Embed Size (px)
Citation preview

How Do People Choose a Travel Mode? Factors Associated with Routine
Walking & Bicycling
Robert Schneider, Ph.D. Candidate
UC Berkeley Department of City and Regional PlanningMay 2011

Outline
• Background & research question
• Core quantitative & qualitative research
• Contributions to the planning field

US Communities with Complete Streets Policies(Data Source: Complete Streets Coalition, January 2011)

0%
5%
10%
15%
20%
25%
30%
Pedestrian & Bicycle Mode Shares in Selected CountriesSources: Bassett, Pucher, Buehler, Thompson, and Crouter (2008); NHTS (2009)
Walk
Bicycle
Source: Basset et al. “Walking, Cycling, and Obesity Rates in Europe, North America, and Australia(2008)

U.S. Shopping Trip Mode Share (2009)
(Home-Based Shopping Trips)Source: Federal Highway Administration, National Household Travel Survey, 2009.
Hayward
Pedestrian
8%Bicycle
1%
Transit
2%
Automobile
89%

How do you travel to the store?
Mission Street, SF
San Carlos

Influences on Walking & Bicycling
Social Interaction
Exercise
Inexpensive
Easy
Altruistic
Work Responsibilities
Takes too Long
Fun
Bad Weather
Too Far
Family Responsibilities
Physical limitations
Traveling with Other People
Crime Risk
Crash Risk
HabitNo Emissions
Too Much TrafficFast Traffic
Carrying ThingsNo Sidewalks,
No Bike Lanes

Research Question
What factors are associated with walking and bicycling for routine travel?
Mission Street, SF

Core Research Components
1) Factors associated with walking and bicycling on routine tours
2) Characteristics of shopping districts that encourage walking rather than driving
3) Theory of mode choice decision process

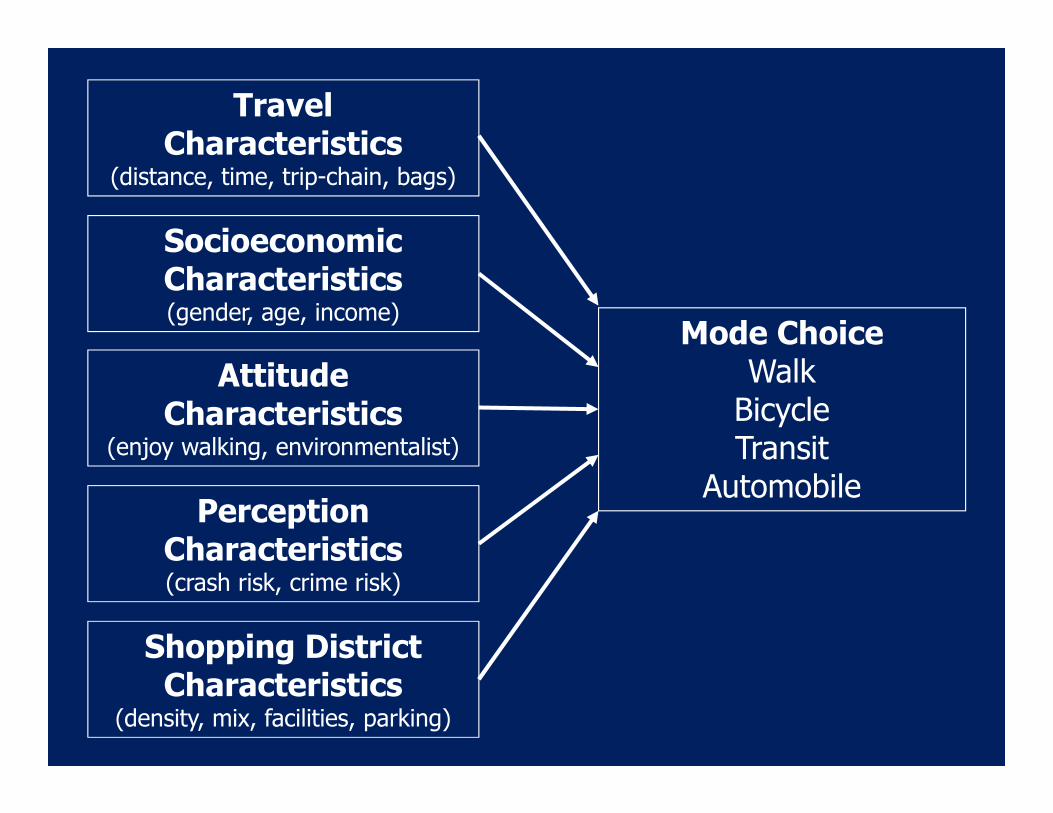
Conceptual Framework for Data Collection & Analysis

Travel Characteristics
(distance, time, trip-chain, bags)
Mode ChoiceWalkBicycleTransit
Automobile
Socioeconomic Characteristics (gender, age, income)
Attitude Characteristics
(enjoy walking, environmentalist)
Perception Characteristics (crash risk, crime risk)
Shopping District Characteristics
(density, mix, facilities, parking)

Methodology

Study Area:San Francisco Bay Area
• 20 shopping districts
• Cluster analysis identified four types of shopping districts
– Urban Core (3)
– Suburban Main Street (8)
– Suburban Thoroughfare (7)
– Suburban Shopping Center (2)

Retail Pharmacy Store Customer Survey
• Intercept survey
• 20 stores in SF Bay Area
– Same national chain
– Different neighborhoods
– ~50 customers per store
• Weekday: 4-6 p.m.
• Saturday: afternoon
• 8/29/09 to 12/9/09
Daly City

Survey Instrument (front side)

Survey Instrument (back side)

Survey Participants
• 4,585 customers invited to participate
• 1,003 survey participants (22%)
• Participant characteristics– 59% female
– 31% age 18-34, 13% age 65+
– 73% shopped alone, 7% in groups of 3 or more
– 9% took Spanish-language survey
Mission Street, SF
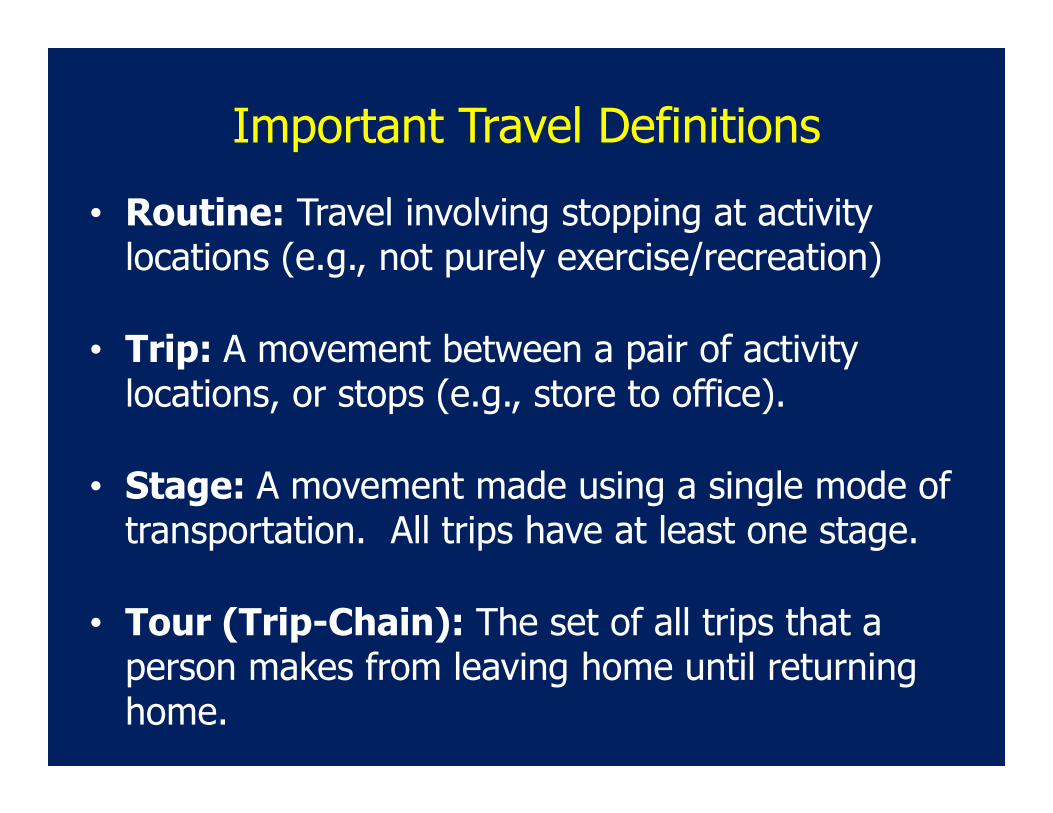
Important Travel Definitions
• Routine: Travel involving stopping at activity locations (e.g., not purely exercise/recreation)
• Trip: A movement between a pair of activity locations, or stops (e.g., store to office).
• Stage: A movement made using a single mode of transportation. All trips have at least one stage.
• Tour (Trip-Chain): The set of all trips that a person makes from leaving home until returning home.

Example: Tour
Graphic source: McGuckin, N. & Y. Nakamoto. Trips, Chains, and Tours—Using an Operational Definition, 2004.Available online: http://onlinepubs.trb.org/onlinepubs/archive/conferences/nhts/McGuckin.pdf

Example: Trips
Graphic source: McGuckin, N. & Y. Nakamoto. Trips, Chains, and Tours—Using an Operational Definition, 2004.Available online: http://onlinepubs.trb.org/onlinepubs/archive/conferences/nhts/McGuckin.pdf

Example: Stages
Graphic source: McGuckin, N. & Y. Nakamoto. Trips, Chains, and Tours—Using an Operational Definition, 2004.Available online: http://onlinepubs.trb.org/onlinepubs/archive/conferences/nhts/McGuckin.pdf

Example Tour: San Mateo shopping district

Example Tour: San Mateo shopping district

Example Tour: San Mateo shopping district

Example Tour: San Mateo shopping district
Home
Store

Google Earth Image
Example Tour: San Mateo shopping district
Home
Store

Google Earth Image
Example Tour: San Mateo shopping district
Home
Store

Google Earth Image
Example Tour: San Mateo shopping district
Home
Store

Google Earth Image
Example Tour: San Mateo shopping district
Home
Store

Google Earth Image
Example Tour: San Mateo shopping district
Home
Store

Google Earth Image
Example Tour: San Mateo shopping district
Home
Store

Google Earth Image
Example Tour: San Mateo shopping district
Home
Store

Google Earth Image
Example Tour: San Mateo shopping district
Home
Store

Google Earth Image
Example Tour: San Mateo shopping district
Home
Store

Google Earth Image
Example Tour: San Mateo shopping district
Home
Store

Google Earth Image
Example Tour: San Mateo shopping district
Home
Store

Google Earth Image
Example Tour: San Mateo shopping district
Home
Store

Example Tour: San Mateo shopping district

Primary Tour Mode (N=959)
Pedestrian
21.3%
Bicycle
2.2%
Transit
9.9%
Automobile
66.6%

Primary Tour
Mode Share by
Shopping District
Pedestrian
Bicycle
Transit
Automobile
Mode
Pop. Density (2000)

1) Factors associated with walking & bicycling on shopping district tours
Market Street, SF

Potential Explanatory Variables
• Travel factors (11)
• Socioeconomic factors (21)
• Attitude & perception factors (10)
• Shopping district factors (26)
Base Map Source: Google Maps, 2010

The utility of a respondent choosing each mode (i = 1, 2, 3) to travel to and from a particular
store was expressed in the following equations:
��1� = �1 + 1�1� + �1��1 + 12��� + ��1� (1)
��2� = �2 + 2�2� + �2��2 + 12��� + ��2� (2)
��3� = �3 + 3�3� + �3��3 + ��3� (3)
�
Mixed logit model: Utility equations
Mode 1 (Walk)
Mode 2 (Transit)
Mode 3 (Auto)

The utility of a respondent choosing each mode (i = 1, 2, 3) to travel to and from a particular
store was expressed in the following equations:
��1� = �1 + 1�1� + �1��1 + 12��� + ��1� (1)
��2� = �2 + 2�2� + �2��2 + 12��� + ��2� (2)
��3� = �3 + 3�3� + �3��3 + ��3� (3)
�
Mixed logit model: Utility equations
Explanatory variables and
associated parameters

The utility of a respondent choosing each mode (i = 1, 2, 3) to travel to and from a particular
store was expressed in the following equations:
��1� = �1 + 1�1� + �1��1 + 12��� + ��1� (1)
��2� = �2 + 2�2� + �2��2 + 12��� + ��2� (2)
��3� = �3 + 3�3� + �3��3 + ��3� (3)
�
Mixed logit model: Utility equations
Unobserved correlated
error between people who
took survey at same store

The utility of a respondent choosing each mode (i = 1, 2, 3) to travel to and from a particular
store was expressed in the following equations:
��1� = �1 + 1�1� + �1��1 + 12��� + ��1� (1)
��2� = �2 + 2�2� + �2��2 + 12��� + ��2� (2)
��3� = �3 + 3�3� + �3��3 + ��3� (3)
�
Mixed logit model: Utility equations
Correlated error between
choice of Mode 1 & Mode 2
(Mode 1 & 2 Nest)

Mixed LogitModel
(N = 388)
(Walk, Transit, Automobile)

Mode ChoiceWalk
TransitAutomobile
Mixed logit model results: Factors associated with walking on tours to and from shopping districts
(N = 388)
Statistical significance:
*** (p < 0.05)
** (0.05 < p < 0.10)
* (0.10 < p < 0.20)
Travel (+) number of stops***, no bags*
(-) distance in shop. dist.*, time***
Socioeconomic (+) group house***,
Spanish-speaker*, student***, low-income***
(-) physical disability*
Attitude(+) enjoy walking*
Perception(+) perceive crash risk***
Shopping District (+) population density*,
employment density***, tree canopy***
(-) survey store parking spaces***

Travel (+) number of stops***, no bags*
(-) distance in shop. dist.*, time***
Mode ChoiceWalk
TransitAutomobile
Socioeconomic (+) group house***,
Spanish-speaker*, student***, low-income***
(-) physical disability*
Attitude(+) enjoy walking*
Perception(+) perceive crash risk***
Shopping District (+) population density*,
employment density***, tree canopy***
(-) survey store parking spaces***
Mixed logit model results: Factors associated with walking on tours to and from shopping districts
(N = 388)
Statistical significance:
*** (p < 0.05)
** (0.05 < p < 0.10)
* (0.10 < p < 0.20)

Mixed LogitModel
(N = 959)
(Walk, Bike, Transit,
Automobile)

Mode ChoiceWalk
BicycleTransit
Automobile
Mixed logit model results: Factors associated with bicycling on tours to and from shopping districts
(N = 959)
Statistical significance:
*** (p < 0.05)
** (0.05 < p < 0.10)
* (0.10 < p < 0.20)
Travel
(-) distance***, Saturday***
Socioeconomic (+) Spanish-speaker*, student***,
no auto***, no children*
(-) female***, physical disability*

Mode ChoiceWalk
BicycleTransit
Automobile
Mixed logit model results: Factors associated with bicycling on tours to and from shopping districts
(N = 959)
Statistical significance:
*** (p < 0.05)
** (0.05 < p < 0.10)
* (0.10 < p < 0.20)
1) All bicycle respondents
enjoyed bicycling.
Travel
(-) distance***, Saturday***
Socioeconomic (+) Spanish-speaker*, student***,
no auto***, no children*
(-) female***, physical disability*
Attitude(+) enjoy bicycling1
Perception(-) perceive crime risk*
Shopping District (+) bicycle facilities**, bike parking
spaces *, employment density***, metered parking*
(-) survey store parking spaces***

Travel
(-) distance***, Saturday***
Mode ChoiceWalk
BicycleTransit
Automobile
Socioeconomic (+) Spanish-speaker*, student***,
no auto***, no children*
(-) female***, physical disability*
Attitude(+) enjoy bicycling1
Perception(-) perceive crime risk*
Shopping District (+) bicycle facilities**, bike parking
spaces *, employment density***, metered parking*
(-) survey store parking spaces***
Mixed logit model results: Factors associated with bicycling on tours to and from shopping districts
(N = 959)
Statistical significance:
*** (p < 0.05)
** (0.05 < p < 0.10)
* (0.10 < p < 0.20)
1) All bicycle respondents
enjoyed bicycling.
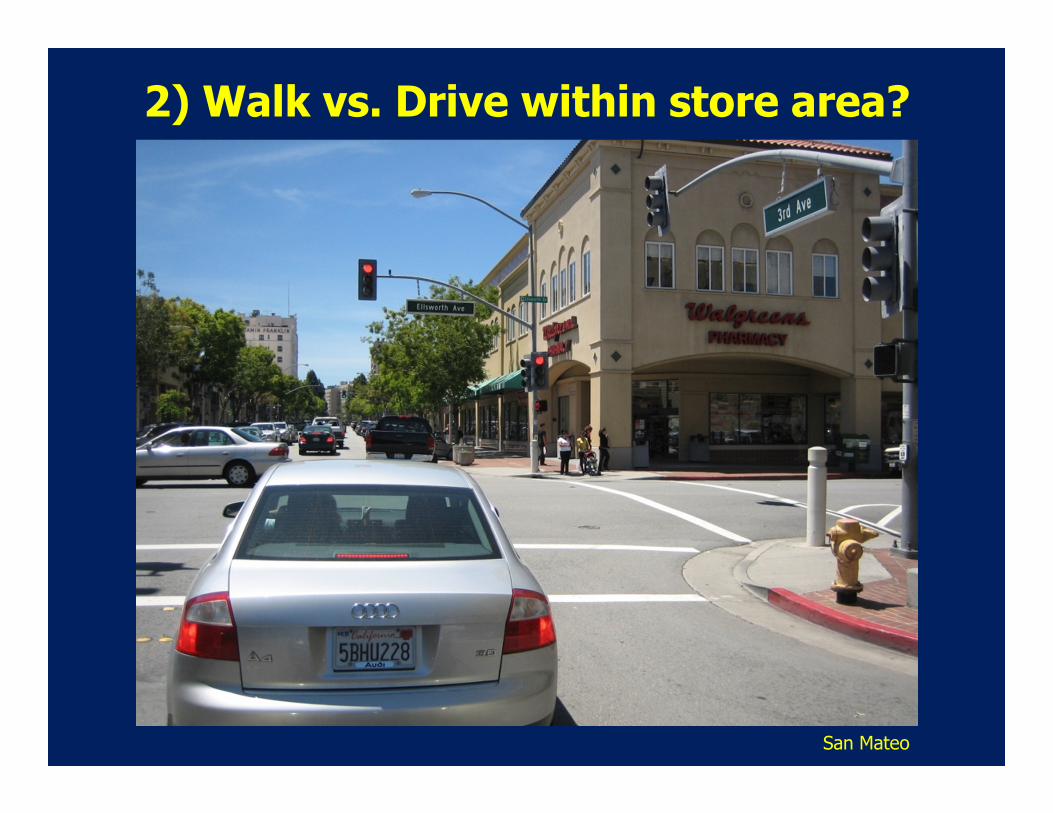
2) Walk vs. Drive within store area?
San Mateo

Mixed LogitModel
(N = 286)
(Walk, Automobile)

Travel (+) shopping alone*
(-) time***, 2+ bags*
Socioeconomic (-) physical disability
Mixed logit model results: Factors associated with walking within shopping
districts(N = 286)
Mode Choice
Walkvs.
Automobile
Statistical significance:
*** (p < 0.05)
** (0.05 < p < 0.10)
* (0.10 < p < 0.20)

Attitude
Perception
Mixed logit model results: Factors associated with walking within shopping
districts(N = 286)
Mode Choice
Walkvs.
Automobile
Statistical significance:
*** (p < 0.05)
** (0.05 < p < 0.10)
* (0.10 < p < 0.20)
Travel (+) shopping alone*
(-) time***, 2+ bags*
Socioeconomic (-) physical disability

Mode Choice
Walkvs.
Automobile
Attitude
Perception
Mixed logit model results: Factors associated with walking within shopping
districts(N = 286)
Statistical significance:
*** (p < 0.05)
** (0.05 < p < 0.10)
* (0.10 < p < 0.20)
Travel (+) shopping alone*
(-) time***, 2+ bags*
Socioeconomic (-) physical disability
Shopping District (+) multi-store shopping complex***,
metered street parking*
(-) driveway crossings***, commercial road speed limit*

Mode Choice
Walkvs.
Automobile
Attitude
Perception
Shopping District (+) multi-store shopping complex***,
metered street parking*
(-) driveway crossings***, commercial road speed limit*
Mixed logit model results: Factors associated with walking within shopping
districts(N = 286)
Statistical significance:
*** (p < 0.05)
** (0.05 < p < 0.10)
* (0.10 < p < 0.20)
Travel (+) shopping alone*
(-) time***, 2+ bags*
Socioeconomic (-) physical disability

3) Mode Choice Decision Process
El Cerrito

In-Depth Interviews
• 26 of the survey participants
• Spring and Summer 2010
• Conducted by phone
• 30 to 60 minutes

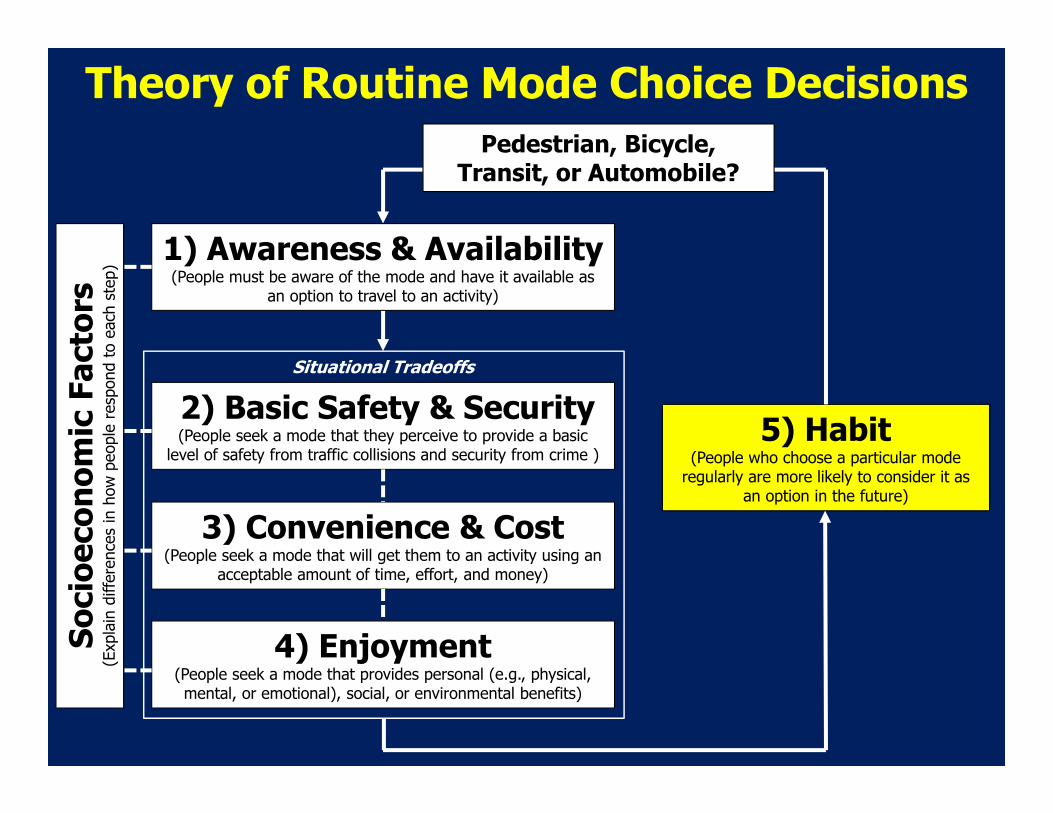
5) Habit(People who choose a particular mode
regularly are more likely to consider it as an option in the future)
2) Basic Safety & Security(People seek a mode that they perceive to provide a basic
level of safety from traffic collisions and security from crime )
3) Convenience & Cost (People seek a mode that will get them to an activity using an
acceptable amount of time, effort, and money)
4) Enjoyment(People seek a mode that provides personal (e.g., physical, mental, or emotional), social, or environmental benefits)
Pedestrian, Bicycle, Transit, or Automobile?
1) Awareness & Availability(People must be aware of the mode and have it available as
an option to travel to an activity)
Theory of Routine Mode Choice Decisions
Situational Tradeoffs
Socioeconomic Factors
(Explain differences in how people respond to each step)

Quotes: Awareness & Availability
• “He rides his bike because the cost of gas and he’s an environmental major…his attitude really did change when he became aware.” --Female, Age 52, San Carlos
• “Working people that are driving…don’t have the mind to think, ‘Am I doing things right?’ You are just surviving.” --Male, Age 30-39, Berkeley
• “So if one person starts cycling, and everyone starts seeing it, everyone will start cycling.” --Male, Age 40-49, Pleasanton
• “I am unemployed and can’t afford to buy a bicycle.” --Female, Age 20-29, San Francisco Market Street

5) Habit(People who choose a particular mode
regularly are more likely to consider it as an option in the future)
2) Basic Safety & Security(People seek a mode that they perceive to provide a basic
level of safety from traffic collisions and security from crime )
3) Convenience & Cost (People seek a mode that will get them to an activity using an
acceptable amount of time, effort, and money)
4) Enjoyment(People seek a mode that provides personal (e.g., physical, mental, or emotional), social, or environmental benefits)
Pedestrian, Bicycle, Transit, or Automobile?
1) Awareness & Availability(People must be aware of the mode and have it available as
an option to travel to an activity)
Theory of Routine Mode Choice Decisions
Situational Tradeoffs
Socioeconomic Factors
(Explain differences in how people respond to each step)

Quotes: Basic Safety & Security
• “I can’t walk there because of the cars that are speeding on Bayshore…and it really bothers me because it’s the one little green open space that I could walk to…within 500 yards of my house, but I can’t get there because of the traffic.” --Female, Age 40-49, San Francisco Third St.
• “If there was less traffic…I probably would walk even more.” --Male, Age 30, San Francisco Fillmore Street
• “I’m not a skilled bicyclist…on the road, so I don’t really feel safe at all.” --Female, Age 30-39, Daly City
• “Right now I wouldn’t bicycle. I had a neighbor who had a terrible accident on a bicycle…” --Female, Age 52, South San Francisco
• “Bicycling itself…I would do it if I wasn’t right up next to cars.” --Female, Age 52, South San Francisco

Quotes: Basic Safety & Security
• “That’s how I got mugged, walking from my car to my house…I thought I might be walking more, but when I actually [moved] here, I realized that I couldn’t.” --Female, Age 40-49, San Francisco Third Street
• “When you are walking in this neighborhood, there’s nobody else walking. You look like a target here.” --Female, Age 40-49, San Francisco Third Street
• “We don’t live in a world that is as safe as it used to be…That’s why most parents don’t have their children biking around or walking out on the streets alone.” --Female, Age 40-49, Danville
• “There’s sometimes a fear of being stranded and not being able to get back, and you are at a distance from your home…I think a car gives you a feeling of security.” --Male, Age 60-69, Brentwood

5) Habit(People who choose a particular mode
regularly are more likely to consider it as an option in the future)
2) Basic Safety & Security(People seek a mode that they perceive to provide a basic
level of safety from traffic collisions and security from crime )
3) Convenience & Cost (People seek a mode that will get them to an activity using an
acceptable amount of time, effort, and money)
4) Enjoyment(People seek a mode that provides personal (e.g., physical, mental, or emotional), social, or environmental benefits)
Pedestrian, Bicycle, Transit, or Automobile?
1) Awareness & Availability(People must be aware of the mode and have it available as
an option to travel to an activity)
Theory of Routine Mode Choice Decisions
Situational Tradeoffs
Socioeconomic Factors
(Explain differences in how people respond to each step)

3) Convenience & Cost
Accessibility of Activity Locations
Short distances to activities decrease and long distances to activities increase barriers to
walking and bicycling:
Availability and Price of Automobile Parking
Limited automobile parking increases and plentiful parking decreases barriers to driving:
• Planning time• Travel time• Physical effort• Packages• Bad weather
• Hills• Lack of lighting• Traffic risk• Sterile streets
• Planning time• Travel time
(searching for spot & walking from parking)
• Price (limited parking is often expensive)

Interview Quotes about Accessibility& Parking

Interview Quotes about Accessibility& Parking
"The next grocery store is about 4 to 5 miles away, and I wouldn't think about walking or bicycling."--Female, Age 40-49, Pleasanton

“Everything for us is like almost walking distance of where we go. I never drive."--Male, Age 30, SF Fillmore Street
Interview Quotes about Accessibility& Parking

"Living here in the suburbs...you get really used to parking not being an issue. Wherever you go, you can park."--Female, Age 60-69, South San Francisco
Interview Quotes about Accessibility& Parking

"I travel less. Because I know coming home, there won't be parking."--Female, Age 40-49, SF Third Street
Interview Quotes about Accessibility& Parking

5) Habit(People who choose a particular mode
regularly are more likely to consider it as an option in the future)
2) Basic Safety & Security(People seek a mode that they perceive to provide a basic
level of safety from traffic collisions and security from crime )
3) Convenience & Cost (People seek a mode that will get them to an activity using an
acceptable amount of time, effort, and money)
4) Enjoyment(People seek a mode that provides personal (e.g., physical, mental, or emotional), social, or environmental benefits)
Pedestrian, Bicycle, Transit, or Automobile?
1) Awareness & Availability(People must be aware of the mode and have it available as
an option to travel to an activity)
Theory of Routine Mode Choice Decisions
Situational Tradeoffs
Socioeconomic Factors
(Explain differences in how people respond to each step)

Quotes: Enjoyment
• “I have noticed that my stress level has gone down since I have walked and bussed more than I drive.” --Male, Age 30, Burlingame
• “It’s a beautiful block with beautiful trees, and I love walking down that street. I wish every street had trees.” --Female, Age 40-49, San Francisco Third Street
• People bicycle “for exercise, for convenience, and for fun.” --Female, Age 20-29, San Francisco Market Street
• “[Bicycling is] a good way to get some exercise, and it’s less pollution…part of it may be that it’s kind of trendy.” --Male, Age 30, San Francisco Fillmore Street
5) Habit(People who choose a particular mode
regularly are more likely to consider it as an option in the future)
2) Basic Safety & Security(People seek a mode that they perceive to provide a basic
level of safety from traffic collisions and security from crime )
3) Convenience & Cost (People seek a mode that will get them to an activity using an
acceptable amount of time, effort, and money)
4) Enjoyment(People seek a mode that provides personal (e.g., physical, mental, or emotional), social, or environmental benefits)
Pedestrian, Bicycle, Transit, or Automobile?
1) Awareness & Availability(People must be aware of the mode and have it available as
an option to travel to an activity)
Theory of Routine Mode Choice Decisions
Situational Tradeoffs
Socioeconomic Factors
(Explain differences in how people respond to each step)

Quotes: Habit
• “I think that getting into the habit of [walking and bicycling] early makes one I think more likely to continue doing them into their later years.” --Male, Age 55, San Francisco Third Street
• “I’m used to using a car. It’s easy. I can get in; I can park in my driveway at night. I get in, I go.” --Male, Age 55, San Francisco Third Street
• “The younger ones—a lot of them drive their cars to high school or to college…That’s probably all they know, really.” --Male, Age 30, Burlingame
• “In the United States actually, we tend to think about the car being the first and the only mode of transportation, and we need to get out of that mindset.” --Female, Age 40-49, Pleasanton

1) Awareness & Availability(Institute individualized marketing programs, bicycle give-away
programs, community-wide education campaigns, Bike to Work Day, Walk to School Week, and other encouragement programs)
5) Habit(Offer information to people who move & change job locations; Explore roadway and
parking pricing strategies)
2) Basic Safety & Security(Construct sidewalks and bicycle paths; Improve pedestrian
crossings; Designate roadway space for bicycles; Design roadways for slower automobile speeds; Educate pedestrians, bicyclists, and drivers on safe behaviors; Enforce traffic laws; Improve roadway
lighting; Provide secure bicycle parking )
3) Convenience & Cost(Allow higher population and employment densities and a finer mix of land uses; Reduce building setbacks; Reduce automobile lanes;
Reduce off-street parking and provide market-rate on-street parking)
4) Enjoyment(Plant street trees and landscaping; Zone for ground-level stores
adjacent to sidewalks; Design public streets for slow-speed activities; Promote environmental & social benefits of walking and bicycling)
Strategies to Increase Walking & BicyclingPedestrian, Bicycle,
Transit, or Automobile?

1) Awareness & Availability
Bike to Work Week; Bike Month Walk to School Day
Bicycle Give-Aways
Photo Credit: City of Rockville, MD
Photo Credit: Jennifer Toole
City of Portland, OR
Individual Marketing

1) Awareness & Availability
Wayfinding Signs; Walk & Bicycle Maps
Photo Credit: City of Seattle

2) Basic Safety & Security
Safer Street & Intersection Facilities Pedestrian Crossing Safety Treatments
Designated Space for Bicycling

2) Basic Safety & Security
Driver, Pedestrian, & Bicyclist Education
Credit: DC, VA, MD Street Smart

2) Basic Safety & Security
Enforcement of Crime & Traffic ViolationsBetter Lighting at Night
Photo Credit: Dan BurdenPhoto Credit: Ron Bloomquist, pedbikeimages.org

3) Convenience & Cost
Decrease distances to activities by changing land uses
Photo Credit: Bing Maps

3) Convenience & Cost
Decrease distances to activities by changing land uses
Photo Credit: Bing Maps

3) Convenience & Cost
Decrease distances to activities by changing land uses
Photo Credit: Bing Maps

3) Convenience & Cost

3) Convenience & Cost
Provide bicycle parking

3) Convenience & Cost
Provide bicycle parking
Limit and price automobile parking

4) Enjoyment
Advertise social & environmental benefitsProvide comfortable facilities
Plant street trees
Photo Credit: Cynthia Cluck

5) Habit
Influence from family & close friendsSafe Routes to School programs
Price changes; Home & work changes
Photo Credit: Associated Press

Survey Support for the Theory
Relationship within Mode Choice Decision Process Supported?
1) Awareness & Availability
� Bike available � More likely to consider bicycle Yes***
� Auto available � More likely to consider automobile Yes***
5) Habit
� Typically walk � More likely to walk Yes***
� Typically bike � More likely to bike Yes***
Difference between binomial proportions : *** indicates p < 0.05; ** indicates 0.05 < p < 0.10;
* indicates 0.10 < p < 0.20; (Yes) = Relationship is found in survey data, but not statistically-significant.

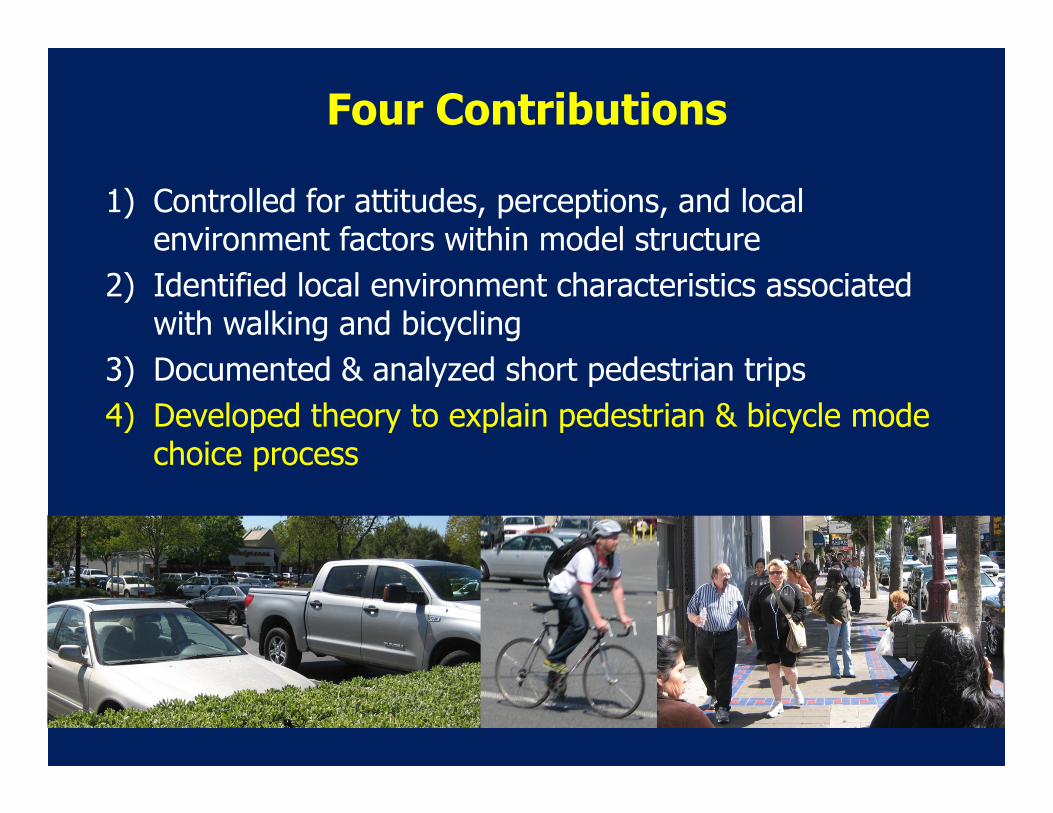
Four Contributions
1) Controlled for attitudes, perceptions, and local environment factors within model structure
2) Identified local environment characteristics associated with walking and bicycling
3) Documented & analyzed short pedestrian trips
4) Developed theory to explain pedestrian & bicycle mode choice process

Travel Characteristics
(distance, time, trip-chain, bags)
Mode ChoiceWalkBicycleTransit
Automobile
Socioeconomic Characteristics (gender, age, income)

Travel Characteristics
(distance, time, trip-chain, bags)
Mode ChoiceWalkBicycleTransit
Automobile
Socioeconomic Characteristics (gender, age, income)
Shopping District Characteristics
(density, mix, facilities, parking)
Travel Characteristics
(distance, time, trip-chain, bags)
Mode ChoiceWalkBicycleTransit
Automobile
Socioeconomic Characteristics (gender, age, income)
Attitude Characteristics
(enjoy walking, environmentalist)
Perception Characteristics (crash risk, crime risk)
Shopping District Characteristics
(density, mix, facilities, parking)

Mode Share Forecast (N = 388)
0%
10%
20%
30%
40%
50%
60%
70%
Less Multimodal Base More Multimodal
Mo
de
Sh
are
fo
r To
urs
to
an
d f
rom
Sh
op
pin
g D
istr
icts
1) Less Street Tree Canopy
2) Larger Parking Lots
3) Lower Population &
Employment Density
1) More Street Tree Canopy
2) Smaller Parking Lots
3) Higher Population &
Employment Denisty
Transit
Walk
Auto

Mode Share Forecast (N = 286)
0%
10%
20%
30%
40%
50%
60%
70%
80%
90%
100%
Less Multimodal Base More Multimodal
Mo
de
Sh
are
fo
r Tr
ips
Wit
hin
Sh
op
pin
g D
istr
ict
1) Free Street Parking
2) Faster Speed Limit
3) Separated Stores
4) More Driveway Crossings
1) Metered Street Parking
2) Slower Speed Limit
3) Stores w/ Shared Parking
4) Fewer Driveway Crossings
Walk
Auto

Mode Share Forecast (N = 959)
0%
10%
20%
30%
40%
50%
60%
70%
80%
Less Multimodal Base More Multimodal
Mo
de
Sh
are
fo
r Tr
ips
Wit
hin
Sh
op
pin
g D
istr
ict
1) Lower Population &
Employment Density
2) Larger Parking Lots
3) No Street Bicycle Facilities
4) No Bicycle Parking
5) Free Street Auto Parking
1) Higher Population &
Employment Density
2) Smaller Parking Lots
3) New Street Bicycle Facilities
4) New Bicycle Parking
5) Metered Auto Parking
Bicycle
Transit
Walk
Auto

Four Contributions
1) Controlled for attitudes, perceptions, and local environment factors within model structure
2) Identified local environment characteristics associated with walking and bicycling
3) Documented & analyzed short pedestrian trips
4) Developed theory to explain pedestrian & bicycle mode choice process

Significant Local Environment Characteristics in Models
Associated with Walking Associated with Bicycling
Population Density (+)Employment Density (+)
Employment Density (+)
Tree Canopy (+)Multi-Store Shopping Complex (+)Metered Street Parking (+)Survey Store Parking Spaces (-)Driveway Crossings (-)Speed Limit (-)
Bicycle Facilities (+)Bicycle Parking (+)Metered Street Parking (+)Survey Store Parking Spaces (-)
Perceived Crime (-) Perceived Crime (-)

Four Contributions
1) Controlled for attitudes, perceptions, and local environment factors within model structure
2) Identified local environment characteristics associated with walking and bicycling
3) Documented & analyzed short pedestrian trips
4) Developed theory to explain pedestrian & bicycle mode choice process

Mode Share Measures for All Survey Respondents

Mode Share Measures for All Survey Respondents

Respondent Pedestrian Path DensityUrban Core Shopping District (Market Street, San Francisco)

Urban Core Shopping District (Mission Street, San Francisco)
Respondent Pedestrian Path Density

Suburban Main Street Shopping District (Burlingame)
Respondent Pedestrian Path Density

Suburban Main Street Shopping District (Richmond)
Respondent Pedestrian Path Density

Suburban Thoroughfare Shopping District (Brentwood)
Respondent Pedestrian Path Density

Suburban Thoroughfare Shopping District (El Cerrito)
Respondent Pedestrian Path Density
Four Contributions
1) Controlled for attitudes, perceptions, and local environment factors within model structure
2) Identified local environment characteristics associated with walking and bicycling
3) Documented & analyzed short pedestrian trips
4) Developed theory to explain pedestrian & bicycle mode choice process

5) Habit(People are more aware of the mode when
they use it; People are less likely to consider modes that they do not use)
2) Basic Safety & Security(People perceive that the mode will provide a basic level of
safety from traffic collisions and security from crime )
3) Convenience & Cost (People calculate that the mode will get them to an activity in
an acceptable amount of time, cost, and effort)
4) Enjoyment(People derive satisfaction from their own physical, mental, or emotional response to the mode and/or its benefit to society)
Pedestrian, Bicycle, Transit, or Automobile?
1) Awareness & Availability(People are aware of the mode and have it available as an
option to travel to an activity)
Theory of Routine Mode Choice DecisionsSocioeconomic Factors
(Explain differences in how people respond to each step)
Situational Tradeoffs

Important Considerations
• Small bicycle sample size
• Fair weather conditions only
• Tour purpose not controlled in secondary model (N=959)
• Exploratory-level statistical significance
• Cross-sectional data
• Mode choice theory based on San Francisco Bay Area subjects and applies to routine travel

Thank you
• United States Environmental Protection Agency
• University of California Transportation Center
• Advisors: Robert Cervero, Elizabeth Deakin, Elizabeth Macdonald, Joan Walker
• Research assistants: Carlos Velasquez & Melissa Chinchilla
• Walgreens Corporation: Bill Hose, Michael O’Brien

Questions?

Walgreens is Everywhere

Previous discrete choice modeling studies with pedestrian & bicycle modes
• Purvis (1997)
• Bowman & Ben-Akiva (2000)
• Jonnalagadda et al. (2001)
• Berrigan & Troiano (2002)
• Cervero & Duncan (2003)
• Walton & Sunseri (2007)
• Ryley (2008)
• Kim & Ulfarsson (2008)
• Handy et al. (2010)

Value of Time (N=388)
• Analysis of tours that had all stops within shopping district (½-mile of store)
• Included travel time and out-of-pocket cost in model instead of tour distance, metered parking, zero vehicles & bus pass
• Value of time
– Automobile tours = $14.41/hour
– Public transit tours = $9.23/hour
– BATS 1990 shopping trips in 2009 dollars = $10.90/hour

Bicycle Facility Tradeoffs (N=959)
• Analysis of all respondent tours (not just to and from shopping district)
• Value of bicycle facilities
– Each additional mile of bicycle facilities in the shopping district was associated with respondents bicycling 1.6 miles further
– Each additional bicycle parking space at the survey store was associated with respondents bicycling 0.5 miles further

Automobile Facility Tradeoffs (N=286)
• Analysis of walk vs. drive within shopping districts
• Value of automobile facilities
– Shopping districts with metered parking were associated with respondents walking 2.5 minutes longer
– 10 fewer commercial driveway crossings along the main shopping district roadway were associated with respondents walking 1.0 minutes longer

Auto Mode Share Under Different Scenarios
40%
45%
50%
55%
60%
Less Multimodal Base More Multimodal
Au
tom
ob
ile
Mo
de
Sh
are
fo
r S
am
ple
of
Su
rve
y R
esp
on
de
nts
Double Population
& Employment Density
Half Population
& Employment Density
Double Parking Lot
Automobile Spaces
Half Parking Lot
Automobile Spaces
Half Street
Tree Canopy
Double Street
Tree Canopy
N = 388

Walk Mode Share Under Different Scenarios
35%
40%
45%
50%
55%
Less Multimodal Base More Multimodal
Wa
lk M
od
e S
ha
re f
or
Sa
mp
le o
f S
urv
ey R
esp
on
de
nts
Double Population
& Employment Density
Half Population
& Employment Density
Double Parking Lot
Automobile Spaces
Half Parking Lot
Automobile Spaces
Half Street
Tree Canopy
Double Street
Tree Canopy
N = 388

Transit Mode Share Under Different Scenarios
0%
5%
10%
15%
20%
Less Multimodal Base More Multimodal
Tra
nsi
t M
od
e S
ha
re f
or
Sa
mp
le o
f S
urv
ey R
esp
on
de
nts
Double Population
& Employment Density
Half Population
& Employment Density
Double Parking Lot
Automobile Spaces
Half Parking Lot
Automobile Spaces
Half Street
Tree Canopy
Double Street
Tree Canopy
N = 388

Attitudes & Perceptions Related to Walking
Primary Tour Mode
Pedestrian
Bicycle
Transit
Automobile

Attitudes & Perceptions Related to Bicycling
Primary Tour Mode
Pedestrian
Bicycle
Transit
Automobile

Respondents who Perceived High Bicycle Crash Risk
33%36%
22%
15%
0%
10%
20%
30%
40%
50%
60%
70%
80%
90%
100%
Urban Core Suburban Main Street Suburban Thoroughfare Suburban Shopping Center
Su
rve
y R
esp
on
de
nts
wh
o P
erc
eiv
ed
Bic
ycl
ing
in
Sh
op
pin
g D
istr
ict
to h
av
e H
igh
Cra
sh R
isk

Respondents who Considered Walking or Bicycling to Store
80%
62%
35%
49%
12%15%
21%
27%
0%
10%
20%
30%
40%
50%
60%
70%
80%
90%
100%
Urban Core Suburban Main Street Suburban Thoroughfare Suburban Shopping Center
Su
rve
y R
esp
on
de
nts
wh
o C
on
sie
red
Wa
lkin
g o
r B
icy
clin
g t
o S
urv
ey
Sto
re
Considered Walking
Considered Bicycling

Respondents who Enjoyed Walking or Bicycling
94%
87%
84% 84%
64% 63%
58% 55%
0%
10%
20%
30%
40%
50%
60%
70%
80%
90%
100%
Urban Core Suburban Main Street Suburban Thoroughfare Suburban Shopping Center
Su
rve
y R
esp
on
de
nts
wh
o R
ep
ort
ed
En
joy
ing
Wa
lkin
g o
r B
icy
clin
g
Enjoyed Walking
Enjoyed Bicycling