Embed Size (px)
Citation preview

How scale and institutional setting explain the costs of small airports? 39
How scale and institutional setting explain the costs
of small airports? –
An application of spatial regression analysis
BY TOLGA ÜLKÜ, VAHIDIN JELESKOVIC,
AND JÜRGEN MÜLLER
1. Introduction
The need for high output levels for airports in order to be able to achieve cost-efficient
operations has always been a challenging issue for airport managers and authorities, as well
as the political decision makers. Airports serving a higher number of passengers are able to exploit the cost advantages of distributing the fixed costs over a larger output. Pels et al.
(2003) find increasing returns to scale at European airports in terms of passenger traffic.
Martin and Voltes-Dorta (2011a) show that, even for large major hubs around the world,
advantages from increasing the scale of operations are still significant. For a large number
of airports in Europe it is not possible to reach the minimum scale, for which the generated
revenues would cover the fixed and operational costs. A small catchment area and insuffi-
cient inbound traffic at such airports can be considered as the most important reasons for
such low output levels. This problem leads to a trade-offs: Either a cost efficient airport
network can be sustained with a relatively lower number of airports, but then the quality of
connectivity would suffer with a less dense airport network. Although competition is shown
to increase the productive efficiency (Malighetti et al., 2008; Chi-Lok and Zhang, 2009) or
financial efficiency (Starkie, 2008), airports within a network are generally not subject to competition. Instead they rely on joint operational planning with a need for direct or indi-
rect subsidies for ongoing operations (Adler et al., 2013). Nonetheless, the negative effects
of subsidies on the productive efficiency of firms should not be neglected.
Addresses of the authors:
Tolga Ülkü Vahidin Jeleskovic
Berlin School of Economics and Law University of Kassel
Badensche Str. 50-51 Department of Economics
10825 Berlin, Germany Nora-Platiel-Str. 4
e-mail: [email protected] 34127 Kassel, Germany
e-mail: [email protected]
Jürgen Müller
Berlin School of Economics and Law
Badensche Str. 50-51
10825 Berlin, Germany
e-mail: [email protected]
40 How scale and institutional setting explain the costs of small airports?
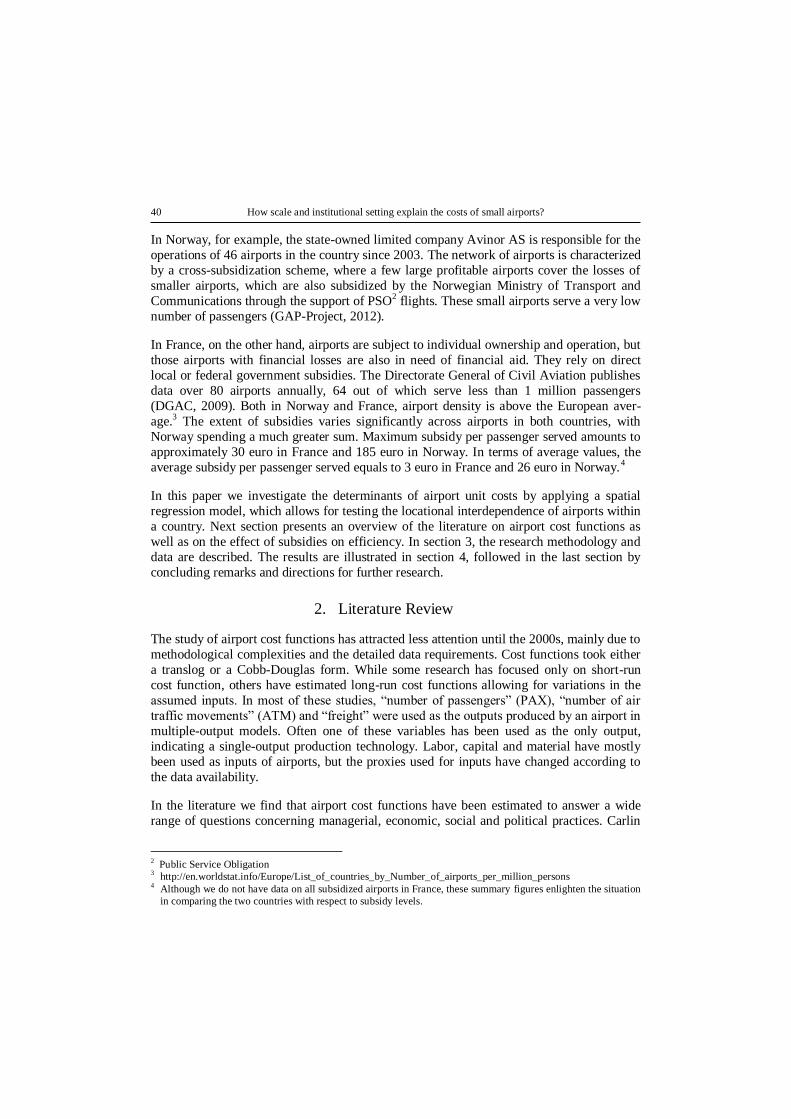
In Norway, for example, the state-owned limited company Avinor AS is responsible for the
operations of 46 airports in the country since 2003. The network of airports is characterized
by a cross-subsidization scheme, where a few large profitable airports cover the losses of
smaller airports, which are also subsidized by the Norwegian Ministry of Transport and
Communications through the support of PSO2 flights. These small airports serve a very low
number of passengers (GAP-Project, 2012).
In France, on the other hand, airports are subject to individual ownership and operation, but
those airports with financial losses are also in need of financial aid. They rely on direct
local or federal government subsidies. The Directorate General of Civil Aviation publishes
data over 80 airports annually, 64 out of which serve less than 1 million passengers
(DGAC, 2009). Both in Norway and France, airport density is above the European aver-
age.3 The extent of subsidies varies significantly across airports in both countries, with
Norway spending a much greater sum. Maximum subsidy per passenger served amounts to
approximately 30 euro in France and 185 euro in Norway. In terms of average values, the
average subsidy per passenger served equals to 3 euro in France and 26 euro in Norway.4
In this paper we investigate the determinants of airport unit costs by applying a spatial
regression model, which allows for testing the locational interdependence of airports within
a country. Next section presents an overview of the literature on airport cost functions as
well as on the effect of subsidies on efficiency. In section 3, the research methodology and
data are described. The results are illustrated in section 4, followed in the last section by
concluding remarks and directions for further research.
2. Literature Review
The study of airport cost functions has attracted less attention until the 2000s, mainly due to
methodological complexities and the detailed data requirements. Cost functions took either
a translog or a Cobb-Douglas form. While some research has focused only on short-run
cost function, others have estimated long-run cost functions allowing for variations in the
assumed inputs. In most of these studies, “number of passengers” (PAX), “number of air
traffic movements” (ATM) and “freight” were used as the outputs produced by an airport in
multiple-output models. Often one of these variables has been used as the only output,
indicating a single-output production technology. Labor, capital and material have mostly
been used as inputs of airports, but the proxies used for inputs have changed according to
the data availability.
In the literature we find that airport cost functions have been estimated to answer a wide
range of questions concerning managerial, economic, social and political practices. Carlin
2 Public Service Obligation
3 http://en.worldstat.info/Europe/List_of_countries_by_Number_of_airports_per_million_persons
4 Although we do not have data on all subsidized airports in France, these summary figures enlighten the situation
in comparing the two countries with respect to subsidy levels.

How scale and institutional setting explain the costs of small airports? 41
and Park (1970) studies optimal pricing strategies to overcome the delay problem for
LaGuardia airport. Keeler (1970) calculates the marginal costs of runway usage for 13
airport systems in the US and differentiates between capital and operational costs. Accord-
ing to Morrison (1983) cost functions should be estimated with a more sophisticated model
that looks at capacity related usage, and the delay costs of the runways. Tolofari et al.
(1990) estimate both short and long-run cost functions for 7 British airports, with PAX,
ATM and freight as outputs; labor, equipment and capital stock as inputs as well as their
prices and various operational attributes of airports. Carlsson (2002) estimates the marginal
costs of 19 Swedish airports by using a log-log functional form with PAX as single output.
Further, he compares the existing charging structure with marginal-cost prices derived from the analysis. Martin-Cejas (2002) determines the relative efficiency of 40 Spanish airports
by estimating a translog cost function with a joint output of passengers and freight trans-
ported. The results show that the insufficient airport scale is the main reason behind effi-
ciency differences observed. Craig et al. (2003) also estimate a cost function to compare the
efficiency of authority-operated airports with their city-operated counterparts for 53 US
airports. The cost function is based on a unique output, namely the ATM and three inputs
labor, capital and materials. Main et al. (2003) estimate Cobb-Douglas cost functions for
the short and long-run in order to investigate the necessity of a new airport in central Scot-
land. They conclude that total welfare can be significantly increased in case of developing
the existing two airports instead of building a new, larger airport. By using data from 94 US
airports Jeong (2005) estimates a translog cost function, in which various operational char-acteristics are incorporated such as share of international traffic, delay and the level of
outsourcing of important activities of the value chain. He finds out that the minimum effi-
cient scale is reached by serving 2.5 million passengers a year. Low and Tang (2006) show
the degree of input substitutability at 9 Asian airports by estimating a translog cost func-
tion. A stochastic cost frontier in translog form is implemented by Barros (2008) to show
the differences in efficiency levels of 27 airports from the United Kingdom. Oum et al.
(2008) apply a similar translog cost frontier model to 109 airports worldwide and show that
mixed public/private ownership structures lead to the least efficient production structure.
Link et al. (2009) estimate the marginal costs for Helsinki airport to show the linear rela-
tionship between the number of aircraft movements and the number of employees. McCar-
thy (2010) estimates a short-run translog cost function for 35 US airports and determines increasing returns to scale in terms of runway utilization. Assaf (2010) utilizes a Bayesian
stochastic cost frontier approach by using a Cobb-Douglas form to determine the level of
cost efficiency for 13 Australian airports. The results show that none of the airports in the
sample can attain the optimal scale. Pels et al. (2010) estimate various specifications of
translog cost functions by using a dataset of 36 airports worldwide. Their results indicate
the importance of economies of scale. The authors also discuss the infeasibility of marginal
cost pricing. Barros (2011) deals with the heterogeneities between the airports in any sam-
ple and uses a latent class model to divide the airports into three clusters. After building the
clusters, a translog cost function with PAX and ATM as outputs and labor, capital and
capital-investment as inputs, is used to identify the efficiency levels for 17 airports in Afri-
ca. Martin et al. (2011) estimates various translog cost functions with single and multiple
outputs by using data from 36 Spanish airports and conclude that the airports cannot

42 How scale and institutional setting explain the costs of small airports?
achieve the minimum efficient scale and there exists limited possibility for input substitu-
tion. Martin and Voltes-Dorta (2011b) draws similar conclusions on minimum efficient
scale with an enlarged dataset of 161 airports worldwide. The same model is implemented
by Voltes-Dorta and Pagliari (2012) for 194 airports worldwide to estimate a short-run cost
frontier. The authors conclude that the average cost efficiency decreased by 6 percent dur-
ing the crisis between 2007 and 2009. Martin et al. (2013) use the results of the previous
work to implement a second stage regression to measure the cost flexibility of airports and
show the disadvantage of higher outsourcing level during a recession.
A look at this literature shows us, that despite addressing similar questions the conclusion
may vary depending on the methodology chosen and data implemented. For example, the
relationship between costs and the scale of operations is one of the most investigated topics.
There is a consensus that airports enjoy scale economies, however the number of passen-
gers necessary to reach efficient scale differs significantly from one study to another.
Furthermore, incorporating airport specific characteristics into cost functions helps to ex-
plain the differences in which inputs such as labor, capital and materials are allocated to the
production. The literature shows us, that airport costs are driven by external factors, such as
traffic structure (percentage of international passengers, percentage of business passengers,
LCC share and share of cargo traffic), delays or the degree of competition between airports.
The type of ownership and the level of outsourcing also matter. These last two points relate
to the governance structure, an issue that we already noted in the study by Oum et al.
(2008) concerning the negative effects of mixed ownership. How subsidies affect the opera-
tional performance or capital costs has however not been studied. For small airports with
inadequate passenger throughput, subsidies play a very important role for their financial
survival. Previous research on other industries (including transport sectors) very often point
to the adverse effect of subsidies on the operational and capital costs. There has been an extensive research on urban public transport (transit) to find an answer to this question.
Bly et al. (1980) investigate 59 urban public transport companies worldwide and conclude
that higher subsidies are associated with higher unit costs and higher number of employees,
notwithstanding the positive effects on fares and quality of service. Anderson (1983) ex-
plores the changes in governance structure of bus transit companies in the US in detail. By
estimating supply and demand equations for the market, the author shows a 28 percent
increase in unit operating costs resulting from the introduction of local, state or federal subsidies. Pucher et al. (1983) use multiple regressions to find out the determinants of unit
operating costs of urban public transport in the US. Their results indicate that increase in
costs accelerated and productivity declines with higher subsidies. They recommend a better
monitoring of operations as well as linking these subsidies to specific performance goals. In
another paper, Pucher and Markstedt (1983) conduct a comparative analysis of unit costs
over ten years for local US bus companies. They show that as the subsidies increased be-
tween 1970 and 1980, this led to higher unit costs. They argue that financial support by
local governments rather than by the federal governments would enhance efficiency. Be-
sides, performance based subsidies are necessary for better incentives. That, subsidies lead

How scale and institutional setting explain the costs of small airports? 43
to an increase in unit costs as well as reduction in output per employee for transit compa-
nies is also shown by Bly and Oldfield (1986), who expand their study from 1980 to 117
cities. Further, with a time lagged regression they show that the rise in costs follows from a
rise in subsidies. Karlaftis and McCarthy (1997) implement a factor analysis method, where
they define the quality of transit system in Indiana with efficiency, effectiveness and overall
performance. The adverse relationship between the subsidies and performance leads the
authors to advocate a performance based subsidy system. In another study Karlaftis and
McCarthy (1998) investigate the effects of subsidies and other governance characteristics
on costs in transit industry by implementing a fixed effect regression. Their results show
that subsidies coming from local, state or federal governments impact the costs differently. Furthermore, Granger causality exists between subsidies and performance. Nolan et al.
(2001) estimate relative efficiency scores of transit companies in the US by using a Data
Envelopment Analysis (DEA) followed by a second stage regression to determine the fac-
tors influencing efficiency. The regression results indicate that the local subsidies increase
the efficiency, whereas the federal ones work in negative direction.
How subsidies influence the costs has also been examined for other industries. For instance,
Oum and Yu (1994) conduct a DEA for 19 railway companies from OECD countries and test the determinants of efficiency with a second stage Tobit regression. According to their
results, subsidized railways achieve lower efficiency scores than their unsubsidized coun-
terparts. Cowie (2009) investigates British train operating companies. After the privatiza-
tion, the government gradually decreased the subsidies to these companies. A DEA
Malmquist Index shows that the efficiency changes were positively influenced by the re-
ductions in subsidies. Bergström (2000) analyzes a similar question on the relationship
between capital subsidization and firm performance for manufacturing industry. By em-
ploying a statistical model with data from Swedish manufacturing companies he concludes
that there is a little evidence for a positive effect of capital subsidies on the productivity.
Tzelepis and Skuras (2004) use a regression analysis for Greek food and drink-
manufacturing sector and show that regional capital subsidies positively influence growth,
but have insignificant effects on efficiency and profitability.
In the light of this literature on other industries, we expect to also find a positive relation-
ship between subsidization and the level of costs for airports. Independent of the causality
between those two variables with respect to the direction of the effect, i.e. whether higher
costs lead to higher subsidies, or vice versa, it postulates that the incentives created by
subsidies influence the costs in an undesirable course.
Further, some Baker and Donnet (2012) propose to promote an overall policy for Australia,
in which all the stakeholders including federal, state, local governments as well as industry
groups jointly take place in strategic decisions. Cohen (2002) also shows that the airport
spending rises/decreases proportionally as airport grants increase/decrease.
The effects of the geographical proximity of airports to each other has been subject to vari-
ous studies (Barrett, 2000; Pels et al., 2009; Fröhlich and Niemeier, 2011; Lian and Rønne-

44 How scale and institutional setting explain the costs of small airports?
vik, 2011). Yet, the main focus of these studies was to investigate the competition among
airports. However, the spatial interdependence of airports relates also to broader topics such
as the effects of network characteristics, airline-airport relationship, cost levels and produc-
tive efficiency rather than just competition effects. Moreover, Huber (2009) shows that a
spatial concentration exists in the European airport network and there is a gap in the airport
literature regarding the influence of spatial interdependence on a number of issues. The
application of spatial relatedness is therefore an approach which includes geographical,
cultural and economic factors in the analysis. First, the closeness between two airports
means they are subject to similar geographical, climatic and natural characteristics. For
example, airports lying on the oceanic coast in Norway mainly struggle with the frozen runways in winter compared to airports located on mountain ranges having to deal with
snow, which leads to distinctly different cost characteristics. Second, spatial proximity also
can be an expression of cultural similarities, as the behaviors of economic agents in the
same regions of a country appear to be comparable. Last but not least, unique or very close
economic conditions such as the GDP, growth rates and purchasing power of inhabitants in
the same region make the economic environment, in which the airports work, also very
close to each other. With the proposed regression specification we would therefore want to
show the statistical significance of the spatial interaction of airports. From an econometric
point of view, in addition, ignoring the spatial specifications when constructing the cost
model could lead to biased estimates of the coefficients. For these reasons, one has to con-
sider also the effects of the geographical distribution of airports and the spill-overs between them. (Pavlyuk, 2012)
To our knowledge, Pavlyuk (2009) is the first application of spatial econometrics to the
airport industry. He investigates the relationship between the competitive pressure on an
airport and its efficiency by introducing a new definition of airport catchment area. Pavlyuk
(2010) tests whether proximity leads to cooperation or competition among airports in Eu-
rope by constructing a stochastic frontier model that incorporates spatial econometrics. The
results show that airports located within a distance of 550 km tend to cooperate, while
competition starts dominating for airports located within 550 km to 880 km. The stochastic frontier model applied also implies that many airports operate below the production frontier
and exhibit high inefficiency levels. In another paper, he makes an extensive review of
airport benchmarking literature and shows how the competition among airports was includ-
ed as an explanatory variable in these studies (Pavlyuk, 2012). Finally, Pavyluk (2013)
utilizes various spatial stochastic frontier models by using data from 122 European airports
and estimates the production function of airports. A comparison of results from these vari-
ous models shows the necessity of including the spatial characteristics in the stochastic
frontier models, so that the biases can be eliminated from the estimations.
Following this review of the literature we first attempt to integrate the spatial interdepend-
ency of airports in the regression identifying the determinants of airport costs. By imple-
menting a spatial regression model, we are able to include information about cost-
relatedness between nearby airports resulting from geographical, cultural or economic re-
semblances. Second, we investigate the effects of airport subsidies on cost efficiency,

How scale and institutional setting explain the costs of small airports? 45
which have so far been ignored in the literature. Third, we evaluate the level of scale econ-
omies at airports.
3. Methodology and Data
We introduce the economic interaction between the airports (that is their spatial autocorre-
lation) and their spatial heterogeneity (i.e. spatial structure) by using the methods of spatial
econometrics to explain the determinants of airport unit costs from the perspective of spa-
tial interactions and spatial effects (see Paelinck and Klaassen, 1979; Anselin, 1980, 1988 and 2001; LeSage and Pace (2009) and the references therein). According to Anselin
(1988) and LeSage and Pace (2009), we can consider the following formulation of spatial
regression models, namely spatial lag, error model and cross-regressive model:5
𝑦 = 𝜌 ∙ 𝑊 ∙ 𝑦 + 𝑋 ∙ 𝛽 + 𝑌 ∙ 𝑊 ∙ 𝑋 + 𝑢 (1)
𝑢 = 𝜆 ∙ 𝑊 ∙ 𝑢 + 𝜀 (2)
𝑤𝑖𝑡ℎ 𝜀~𝑁(0, 𝜎𝜀2𝐼𝑛)
𝑊 is an 𝑛 𝑥 𝑛 spatial weights matrix which is crucial for incorporating the spatial effects into the regression model.6 It specifies which spatial unit affects the other ones as well as in
which way the interaction takes place (Anselin, 2001 and 2002; Elhorst, 2013; LeSage and
Pace, 2009). In the simplest case, one considers the binary weights with the elements of 𝑊-
matrix 𝑤𝑖𝑗 = 1, when 𝑖 and 𝑗 are neighbors, and 𝑤𝑖𝑗 = 0 otherwise. Another common way
to model spatial interaction is to use a smooth or continuous distance decay function so that
𝑤𝑖𝑗 = 𝑓(𝑑𝑖𝑗) where 𝑑𝑖𝑗 is the distance between the unit 𝑖 and 𝑗 (Anselin, 2001 and 2002;
Anselin et al., 2008; Elhorst, 2013).
When 𝜌 = 𝛶 = 𝜆 = 0 and 𝛽 ≠ 0, it delivers a standard regression model, which reveals no
spatial interaction. When 𝜌 ≠ 0, 𝛽 ≠ 0 and 𝛶 = 𝜆 = 0, it is a spatial lag model, which
presents the spatial impact of the dependent variable in the host region on the dependent
variable in the surrounding regions.7 The coefficient ρ measures the intensity of the spatial
effects. The higher the absolute value of 𝜌 is, the stronger the spatial lag of the dependent
variable 𝑦 influences the calculation of the predicted value of ��. In most cases, the weights
matrix is row-standardized for better interpretation so that 𝑊 · 𝑦 is the term of the form
such that it presents a weighted average of the value of y in the neighboring locations called
spatial lag. If 𝜌 = 0, 𝛽 ≠ 0, 𝛶 = 0 and 𝜆 ≠ 0, it is a spatial error model, which reports the
spatial effects in the errors. If 𝜌 = 0, 𝛽 ≠ 0, 𝛶 ≠ 0 and λ=0, it represents a cross regressive
model, which presents the spatial impact of the explanatory variables in the host region on
5 Their combinations result in a possibility for seven different specifications of the model.
6 𝑛 presents the number of spatial statistical units considered in the analysis, which refers to the number of air-
ports in this paper 7 A region in this context means simply the statistical unit. Again, in our context it is an airport.

46 How scale and institutional setting explain the costs of small airports?
the dependent variable in the surrounding regions. Last but not least, one can consider a
combination of those models as well, e.g. spatial lag-spatial error model or spatial lag-cross
regressive model with the corresponding formal representation.
The extension from a spatial regression model to a spatial panel model is straightforward,
as in the case of the extension from a classical regression model to a classical panel model,
with the usual model specification of individual effects 𝛼𝑖 in fixed-effects model or of the
error term 𝜀𝑖 = 𝜇𝑖 + 𝑣𝑖𝑡 in the random effects model (see e.g. Anselin, 2001; Elhorst, 2001
and 2003; Anselin et al., 2008; Jeleskovic and Schwanebeck, 2012). It is obvious that the
choice of the ”best” specification of the panel model might not be a trivial task.8 Hence, we
will consider here only the basic specification of the fixed effects model, namely the spatial
lag fixed effects model. The estimation of this model was done with Matlab and the codes
made by Elhorst (2010) which include already the bias correction procedure of Lee and Yu
(2010).
As already mentioned, the critical point of the spatial regression is the weight matrix which
has to be assumed as an exogenous one (Anselin, 1980 and 1988). Using a distance matrix
for spatial weights, one uses some smooth declining function for individual weights in most
cases:
𝑤 =1
𝑑𝛼 (3)
where d stands for the distance (e.g. in km) between two spatial units and 𝛼 is a smooth
parameter usually an integer 𝛼 = [1,2] (Anselin, 1988 and 2002).
However, in the sense of the spatial clustering one can assume that some first kilometers
around an airport do not make a difference, and after these first kilometers the impact and
catchment area are vanishing in a steep grade, and then kilometers far away do not make a
big difference again.9 Thus, we use a non-linear weighted function of decaying distances
which we construct by using a so-called sigma-shaped function between two airports 𝑖 and
𝑗 as depicted in the following equation:
𝑊𝑖𝑗 = 1 −1
1+𝛼 ∗exp (−𝑏 ∗ 𝑑𝑖𝑠𝑡𝑎𝑛𝑐𝑒𝑖𝑗) (4)
where 𝑖 ≠ 𝑗, 𝑎 > 0 and 𝑏 > 0 and 𝑑𝑖𝑗 is the distance between airports 𝑖 and 𝑗 measured in
km. Next, we deal with the question how to find out the optimal values of 𝑎 and 𝑏. Anselin
(2002) points out that, model validation techniques, such as a comparison of goodness-of-
fit, can be used to find out the best specification of the weight matrix or the parameter of
8 Given several possibilities for different specifications for either fixed or random effects models.
9 See a similar argumentation of Pavlyuk (2009).

How scale and institutional setting explain the costs of small airports? 47
distance decay function.10 We use the Akaike information criterion-AIK (Akaike, 1974) to
solve the problem of best parameter values in our distance decay function.11 Hence, param-
eters a and b are calibrated due to the best value of AIK by estimating the regression model
for each combination of a and b values. We apply a grid search algorithm over a and b in
such a way that all distance decay functions in the parameter space of a and b are unique.
Hence, we do not have the identification problem by the parameters a and b. Finally, we use
the row-standardized weight matrix W, where the sum of each row is equal to one (Anselin,
1988 and 2002; LeSage and Pace, 2009).
In this paper we apply the second specification because of the assumption that the airport
unit costs (dependent variable in our model) at nearby locations show similarities to each
other because they use the same production technique. Hence, the regression model we use
takes the following final specification:
𝑦𝑖𝑡 = 𝜌𝑊𝑦𝑖𝑡 + 𝛽𝑋𝑘𝑖𝑡 + 𝛼𝑖 + 𝜀𝑖𝑡 (5)
where 𝑦 is the vector of dependent variable for airport 𝑖 in year 𝑡, 𝜌 is the spatial auto-
regressive parameter, W is the weighted distance matrix, 𝑋 is a matrix of 𝑘 independent
variables, 𝛽 is the vector of coefficients to be estimated, 𝛼 is the fixed effect parameter for
each airport 𝑖 and 𝜀 is a vector of independent error terms.
The dependent variable we use in the spatial regression is the unit costs of airport opera-
tions (costppax), calculated by dividing the total operational costs by the annual number of
passengers served. Total operational costs include the labor costs, material costs and out-
sourcing costs but exclude the depreciation. Hence, the analysis ignores the investments
undertaken at the airports and focuses merely on the operational level. The matrix of inde-
pendent variables composes of 7 variables. A year dummy variable is introduced into ma-
trix of independent variables in order to identify time trend of unit costs (year). As we uti-
lize a panel dataset between 2002 and 2010 for Norway and 2002 and 2009 for France, year dummy variable controls for the annual changes in average cost levels. To examine how
important the scale of operations at an airport for the unit costs is, work load unit (wlu) is
used as an independent variable. wlu is a combination of number of passengers and amount
of cargo served by the airport and is a good proxy for the cumulative output of the airport.
Due to the fact that there are a lot of small sized airports in our dataset, we expect to find
out significant economies of scale. In order to analyze the influence of subsidy levels on the
cost efficiency, we follow the idea of Oum and Yu (1994) and calculate the ratio of subsi-
dies to the operational costs (subs). This variable shows to what extent the losses are cov-
ered by either cross subsidies or direct financial installments.
10
This is applied according to Fotheringham et al. (1998 and 2000) and Eckey et al. (2007). These authors provide
for using the AIK criterion to optimize the bandwidth parameter in the distance decay function in a geograph-
ically weighted regression approach, which is very similar to our econometric approach used in this research. 11
We take over the assumptions of Anselin and Bera (1998) that the weights matrix is exogenously incorporated
into the model

48 How scale and institutional setting explain the costs of small airports?
Although the share of commercial revenues increased on average in the last decade, the
aeronautical revenues are the core revenue source of most airports, particularly the smaller
regional airports that dominate our sample. These mainly include the fees paid by the air-
lines for using the airport infrastructure. Especially smaller airports with limited possibili-
ties of generating commercial revenues rely mainly on the aeronautical revenues. Hence,
including aeronautical revenues per passenger (aerrev) delivers valuable results in inter-
preting the extent of cost coverage by airport charges. This variable has occasionally been
used as a proxy for the level airport charges in the literature (Bilotkach et al., 2012).
In spite of the fact that our dataset comprises of commercial airports, these airports serve
non-commercial flights as well. These flights are those which are not authorized for public
transportation and include flights such as military, ambulance, school, instruction and gen-
eral aviation. Non-commercial flights constitute a high share of the traffic at some airports
in our dataset. For example for the airports in our dataset they make up one fifth of all the
flights in Norway and two thirds of all flights in France in 2009. By including the share of
non-commercial air traffic movements in total air traffic (noncommatm), we test how these
flights drive the airport unit costs.
Whether an airport serves any flights through public service obligation (pso) is included as
another dummy variable.
In addition investments in terms of either expansion or modernization will influence the
operational costs by altering productivity. By having a capital-intensive production tech-
nology, airports can benefit from modernization investments in terms of efficiency. Fur-thermore, investments directly influence the level of capacity utilization at an airport. For
these reasons, the total investments should be included in the regression function. However,
the data on such investments are not fully available for the whole period of analysis. For
this reason, we include the depreciation per passenger (depr) as a proxy of capital.
For the spatial regression analysis two separate data samples, i.e. from Norwegian and
French airports, are used: A balanced panel dataset of 41 airports in Norway for the years
between 2002 and 2010 and a balanced panel dataset of 26 airports12 in France between
2002 and 2009. Table 1a and 1b present the descriptive statistics for the variables.
12
of which 4 are on the island of Corsica
How scale and institutional setting explain the costs of small airports? 49
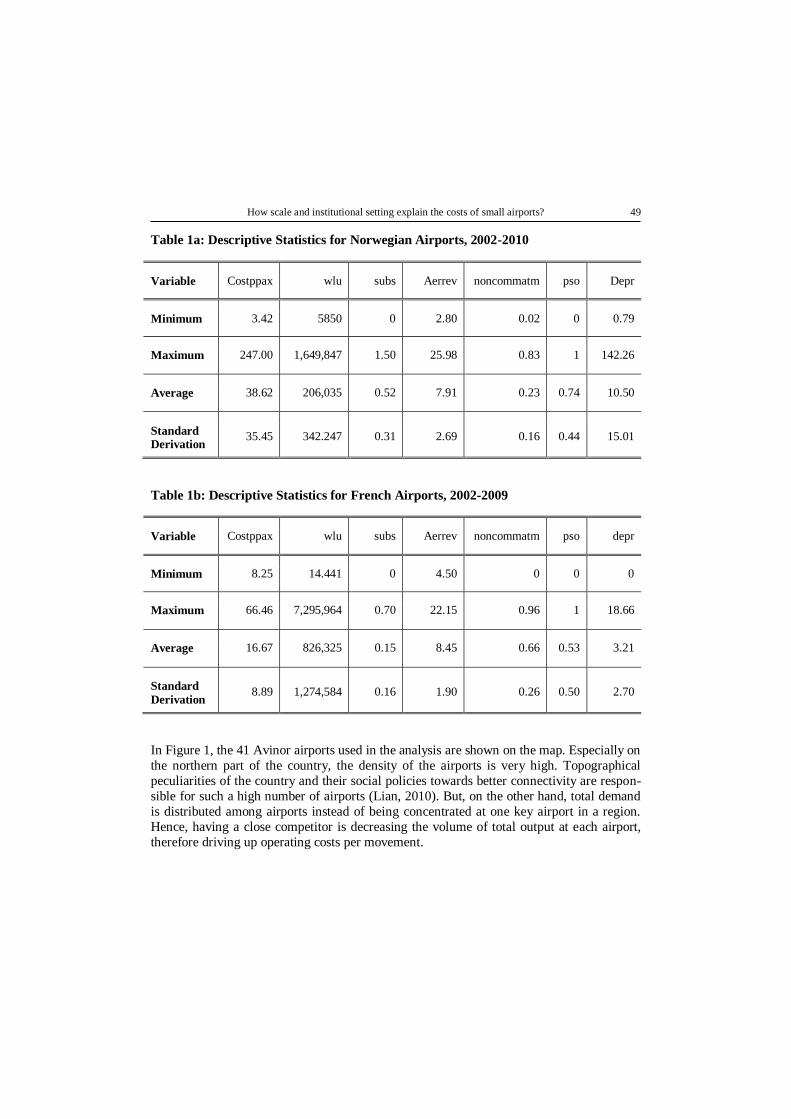
Table 1a: Descriptive Statistics for Norwegian Airports, 2002-2010
Variable Costppax wlu subs Aerrev noncommatm pso Depr
Minimum 3.42 5850 0 2.80 0.02 0 0.79
Maximum 247.00 1,649,847 1.50 25.98 0.83 1 142.26
Average 38.62 206,035 0.52 7.91 0.23 0.74 10.50
Standard Derivation
35.45 342.247 0.31 2.69 0.16 0.44 15.01
Table 1b: Descriptive Statistics for French Airports, 2002-2009
Variable Costppax wlu subs Aerrev noncommatm pso depr
Minimum 8.25 14.441 0 4.50 0 0 0
Maximum 66.46 7,295,964 0.70 22.15 0.96 1 18.66
Average 16.67 826,325 0.15 8.45 0.66 0.53 3.21
Standard
Derivation 8.89 1,274,584 0.16 1.90 0.26 0.50 2.70
In Figure 1, the 41 Avinor airports used in the analysis are shown on the map. Especially on
the northern part of the country, the density of the airports is very high. Topographical
peculiarities of the country and their social policies towards better connectivity are respon-
sible for such a high number of airports (Lian, 2010). But, on the other hand, total demand
is distributed among airports instead of being concentrated at one key airport in a region.
Hence, having a close competitor is decreasing the volume of total output at each airport,
therefore driving up operating costs per movement.

50 How scale and institutional setting explain the costs of small airports?
Figure 1: Norwegian Airports used in the Regression Analysis (Source: Avinor)
Figure 2 displays the 26 French airports used in the analysis on the map13.
13
It should be noted that the proportion of the airports, which we are able to include in the analysis, in comparison
to the total number of airports is very low for France, while in Norway we could obtain data on almost all the
airports.

How scale and institutional setting explain the costs of small airports? 51
Figure 2: French Airports used in the Regression Analysis (Source: own compilation)
4. Results
Table 2 displays the results of the spatial regression analysis from model (5) for the airports
in Norway and France separately. To start with, we evaluate the results from the spatial
perspective by interpreting the coefficient 𝜌 and the corresponding t-values. The coefficient
is statistically significant for both countries. This indicates a significant spatial dependence
among the airports, as far as the unit operating costs is concerned. Furthermore, the coeffi-
cients are positive. Hence, costs of one airport are positively influenced by the weighted
average of costs of neighboring airports; that is by the spatial weights matrix 𝑊 calculated
with the Equation (4). This, as well, leads to the interpretation that airports located close to
each other seem to have similar cost structures. It should be noted that zero values on the
diagonal of 𝑊 matrix assures that the interaction of the same observation in the regression
equation is excluded. The coefficient for Norway is significantly higher than that for
France, which indicates that the positive correlation between costs of nearby airports in
Norway is stronger than in France. It is not a surprising fact, not only because Norwegian
airports are centrally managed by the Avinor Headquarters, but also because Avinor has

52 How scale and institutional setting explain the costs of small airports?
built four administrative sub-units14 of its local airports according to their geographical
position. This evidently leads to similar management techniques for the airports in the same
group. These local airports make up 28 of 41 sample airports; the remaining 13 airports are
grouped as national and regional airports. On the other hand, French airports in the sample
are managed individually and have no administrative links to each other, which possibly
enable them to introduce own strategies regarding the cost structures.15
Table 2: Estimation Results from the Spatial Regression
Variable Norway France
year 0.050*
(9.23)
0.026*
(6.46)
wlu -0.816*
(-18.81)
-0.443*
(-10.46)
subs 0.203*
(3.87)
0.219*
(2.79)
aerrev 0.113*
(3.25)
0.223*
(4.39)
noncommatm 0.229***
(1.65)
-0.266*
(-2.85)
pso -0.018
(-0.67)
-0.046***
(-1.75)
depr 0.032**
(2.20)
0.014***
(1.71)
ρ 0.685*
(12.36)
0.365*
(3.55)
R² 0.98 0.94
Adjusted R² 0.84 0.56
Log-Likelihood 307.00 185.14
1. Dependent variable is “costppax” (Operating costs per passenger)
2. Independent variables “wlu”, aerrev” and “depr” are in natural logarithms.
3. t-values are in parentheses
4. * 1% significance; ** 5% significance; *** 10% significance
14
These four sub-units are: Finnmark, Ofoten/Lofoten/Vesterålen, Helgeland/Namdalen and Southern Norway 15
The private company Vinci has concession contracts for the management of Dinard, Rennes and Nantes airports,
however this happened in 2010, after the timeframe of this analysis.

How scale and institutional setting explain the costs of small airports? 53
Figure 3 plots the interaction level as a function of distance from Equation (4) for our sam-
ple airports from Norway and France. According to these two figures, the interaction levels
remain much higher in Norway, as the distance between airports increases. This leads to the
implication that the presence and strength of links between airports in Norway is much
higher than in France in our sample.
Figure 3: Non-linear weighted functions of decayed distances for Norway and France
The coefficients for the time trend for both countries are highly significant and have posi-
tive signs. It can be concluded that the unit operating costs have increased since 2002. For
the 41 Norwegian airports, we observe approximately 5 percent annual increase in average
costs. On the other hand, the yearly increase in average costs amounts to 2.6 percent for 26 French airports in the sample16.
How scale affects the unit operational costs are investigated by using the variable wlu. The
negative sign of the coefficients for both countries indicates that the unit costs decrease
with increasing output, i.e. airport size. One percent increase in the level of wlu leads to
approximately 0.82 percent decrease in the costs per passenger in Norway and approxi-
mately 0.44 percent decrease in France. Figure 4 visualizes the relation of unit costs with
respect to the airport size, where the unit operating costs are shown against the number of work load units (in log scale). Due to the larger number of very small airports in the sam-
ple, Norwegian airports operate on a steeper curve. Especially those airports serving less
than 50,000 annual work load units suffer from very high average costs. A detailed analysis
16
GAP-Project (2012) finds out that security costs at small Norwegian airports increased more than proportionally
between 2002 and 2010, which is a partial explanation of increasing overall costs.

54 How scale and institutional setting explain the costs of small airports?
of average costs in order to determine the minimum efficient scale of airport operations is
beyond the scope of current work and is left for further research.
Figure 4: Scale Effect on Unit Operating Costs
The coefficient of the variable subs enables us to confirm the relationship between the level
of cost coverage by the subsidies and the unit costs of airports. Having a positive coeffi-
cient in both countries indicates that higher subsidies lead to higher unit costs and this rela-
tionship is statistically significant. To our best knowledge, this is the first attempt in the
literature of airport economics, which statistically analyses the relationship between the two
variables. The results suggest that if the subsidies relative to costs increase by one percent,
the unit costs increase by approximately 0.2 percent both in Norway and France. It should be noted again that the ratio of subsidies to costs is used as the independent variable in the
regression, because the absolute values of the subsidies are not relevant due to different
scale of various airports.
Next, it can be seen that the revenues from the aeronautical charges per passenger have a
significant positive relationship with the unit operating costs by observing the results for
the variable aerrev. Furthermore direct correlation between the unit costs and aeronautical
revenues per passenger amounts to 0.25 in Norway and 0.28 in France. Despite the ob-tained significant and positive relationship, the coefficients and the correlation values are
relatively small indicating that the aeronautical revenues are insufficient, given the opera-
tional costs. This raises concerns whether determination of airport charges follow calcula-
tions based on the costs. The challenge airport managers are facing is the question to what
extent the airport fees can be increased, which are paid by the airline companies. Elasticity
of demand for air travel increases as the travel length decreases. Normally for long-haul
0
50
100
150
200
250
300
5 50 500 5.000
Un
it O
per
ati
ng
Co
sts,
in E
uro
wlu (log scale) Tausende
unit operating costs vs. number of wlu
France
Norway

How scale and institutional setting explain the costs of small airports? 55
flights, we observe inelastic demand. However elastic demand can characterize the short-
haul flights, because the airport charges constitute a higher proportion of total airline costs.
Following this argument, if we assume a price elastic demand of airlines for airport services
(Intervistas, 2007; Starkie and Yarrow, 2013), the aeronautical revenues will further de-
crease when the airport fees are increased and this leads to a vicious circle of whether the
aeronautical revenues may be increased at all. The dataset implies no significant relation-
ship between airport size and the share of aeronautical revenues in total revenues. This is
driven by the fact that relatively small airports dominate the sample. Following figure
shows that none of the airports in the sample was able to cover the operational costs by the
aeronautical revenues on average over the time span. The average value amounts to 36 percent and to 58 percent, for the 41 Norwegian and for the 26 French airports respectively.
Figure 5: Relationship between Costs and Aeronautical Revenues, 2002-2009 or 2010
The variable noncommatm delivers different results for the two countries regarding the
direction of the influence of non-commercial air traffic share on the unit costs. While unit
costs increase in Norway with increasing share of non-commercial air traffic, they decrease
in France. In order to explain the conflicting results, further analysis regarding the compo-
nents of non-commercial air traffic is necessary. Despite not having detailed data, we as-
sume that the general aviation traffic constitutes an important part of non-commercial activ-
ities at French airports, hence lowering the overall unit costs. In contrast, Norwegian air-
ports serve mainly other type of non-commercial activities such as ambulance flights.
Some airports benefit from the centrally-organized and government-subsidized PSO routes
by increasing the number of passengers served. These services help airports improve the
unfavorable situation of having too little traffic, which leads to higher average costs. Fur-
thermore some airports entirely rely on PSO flights. Regression results deliver negative
0%
20%
40%
60%
80%
100%
BIA
CLY
AJA
LDE
PU
F
BES
BV
A
FNI
BZR
KR
S
AES
MO
L
BN
N
HFT SV
J
SSJ
SOG
RV
K
MEH LK
L
SOJ
HA
A
RR
S
France Norway
Percentage of cost coverage by aeronautical revenues (per passenger)

56 How scale and institutional setting explain the costs of small airports?
coefficients for the pso variable. In France, an airport with PSO flights operates with 4.6
percent less average costs than those airports without any PSO flights. We observe the
same, but weaker, relationship for Norway as well, however the coefficient is statistically
insignificant.
Finally, the coefficients of the variable depr are positive indicating that the value of depre-
ciation per passenger influences the average costs in the same year positively. The interpre-tation of the positive coefficients is somewhat difficult, but intuitionally one can explain
this with the lagged effect of investments on the unit costs. It is to say, some investments
require a couple of years to be utilized effectively. Furthermore the lumpiness of airport
investments such as runway or terminal expansions leads to lower capacity utilization in the
time period following the investment. The higher unit costs might be associated with the
low utilization of capacity at those airports, which undertook recent expansions. In addi-
tion, the coefficients of the depreciation variable are significant only at 5 and 10 percent
levels for Norway and France respectively. It can be driven by the fact that that there is no
differentiation in the depreciation data with regard to the lifetime of the investment made.
Both small investments such as computers or office supplies and large investments such as
for runways and terminals are included in the depreciation data. A further distortion to the depreciation data relates to the establishment of Avinor in 2003, which from then on was
responsible for the whole airport infrastructure in the country. Upon establishment Avinor
made an immense investment to improve the infrastructure at airports that where before
operated by the communes or regional bodies. This led to a sudden jump in the data for
depreciation17.
5. Conclusion and Directions for Further Research
Our study is based on two separate data samples that consisted of subsidized airports in
Norway and France, with which a number of hypotheses could be tested. The spatial lag
regression model indicated a significant level of spatial relatedness among airports, namely the spatial impact of the dependent variable (unit costs) at the host airport on the unit cost
of the surrounding airports. We also studied the relationship between subsidies and costs as
well as the importance of scale economies. Furthermore, the annual changes in average cost
levels, cost coverage via aeronautical revenues, importance of non-commercial air traffic
movements, the effects from PSO routes and the level of investments were evaluated in this
paper.
The unit costs of airports show a statistically significant level of spatial interdependencies
which was estimated by the 𝜌 variable in the regression specification. The spatial relation-
ship in Norway is much stronger than in France. Thus, it can be concluded that once the
airports are managed as a group, the interaction among them tend to be stronger mainly due
to the organizational similarities. Although competition is assumed to improve the cost
17
Total depreciation for the 41 airports in the sample increased by approximately 53 percent between 2002 and
2003.

How scale and institutional setting explain the costs of small airports? 57
efficiency, one should treat this issue with special care and evaluate the spatial distance
between airports in detail. In terms of overlapping catchment areas, where airports are lo-
cated very close to each other with limited aggregate demand in the area, positive effects
due to competition are offset by factors like insufficient exploitation of scale that lead to
negative results in terms of the costs, or technical efficiency of airports.
From a methodological point of view, the significance of the results of the spatial parame-ters indicates that the model specification enables us to avoid biased estimates. An F-test
can be implemented to test the efficiency of the model in comparison to a non-spatial re-
gression specification. However, in further research indirect effects should be introduced in
order to improve the analysis. These include the secondary relationships between a host
airport and a third airport, where the spatial dependence of unit costs is transited via an
airport located between those two airports. Nonetheless it is believed that these effects
would only lead to negligible changes in the results we have obtained.
The significant positive relationship between the share of costs covered by the subsidies
and the unit costs indicate that subsidies may provide distorted incentives. Thus policies
regarding the subsidization of airports and routes should be re-evaluated. Subsidization
policies should include mechanisms, which will better align the incentives of the airports
with the government rather than merely encouraging non-market driven traffic as riskless
financial support. Moreover, fiscal decentralization would enhance the way subsidies are
allocated to the necessary nodal point, which should replace the centrally organized in-
stallments to cover any expenses accrued at an airport. For instance, the local governments
can be endowed with a yearly sum of financial support and the allocation between different
nodes of public good provision such as airports; ports; highways; rail or water, gas and
electricity infrastructure should be undertaken according to the needs of the region. Anoth-
er, but a similar option would be to decide the level of subsidy each airport will receive prospectively, rather than paying for the costs ex-post irrespective of the magnitude. We
believe that the causality between the two should be investigated in more detail by applying
a more in-depth regression analysis, in which time lagged variables can determine the di-
rection of the causal links as well as a Granger-causality test.
Inadequate demand at the airports is the most important reason behind high unit costs.
Some airports are not able to achieve a break-even point due to scale, although they might
be technically efficient with regard to the input output combinations chosen. Hence, poli-cies towards increasing the demand for the airport services on the one hand and closing
very small airports on the other can help to overcome this problem. In most of the airports,
traffic is considered to be an exogenous variable, on which the managers have no influence.
Bel (2009) defines this situation for Spanish airports as “a hand tied behind back”, however
presents the example of Girona, where local institutions express a great interest in the situa-
tion of the airport due to financial spillover effects in the region. In addition, airline-
friendly policies are applied by the airport. These resulted in a tenfold increase in the num-
ber of passengers served. However, it should be kept in mind that such policies should be
applied with a special care. Girona airport almost exclusively relied on the services by its

58 How scale and institutional setting explain the costs of small airports?
main customer Ryanair, which constituted approximately 90 percent of the total traffic in
2007. Such a dependency on a single customer certainly leads to concerns about a sustaina-
ble business model. Nevertheless, Ryanair started reducing the offers from or to Girona
airport, reducing the total number of passengers at the airport continuously after 2009.
In some other cases, traffic stimulation via PSO grants appears to be the only solution to
increase the demand at the airports. However, our results show that the unit costs at PSO airports are not statistically different than those at other airports in Norway. This is in line
with the results of Pita et al. (2014), who suggest that the PSO system in Norway can be
enhanced. In France, on the other hand, PSO services seem to improve the airport unit
costs. Airports with PSO share tend to operate with approximately 4.6 percent lower unit
costs. Precise information about the PSO shares for the airports would further enhance the
analysis.
As regards scale economies, it should finally be noted that an estimation as to the minimum efficient scale of operations at the airports was not undertaken in this research, because
based on previous literature it is assumed that the airports in the sample serve a very low
number of passengers, so that the results of such an analysis could not be generalized to
larger airports.
Low capacity utilization accelerates the problems with respect to high unit costs, as shown
with the depreciation variable in our regression specification. From this finding, it can be
concluded that an optimal long-term strategy for small-sized airports should be not to in-
crease the capacity unless a certain threshold for the utilization of current capacity is reached.
Abstract
One of the main pillars of efficient airport operations is cost-minimization. Unit costs of
operation with respect to the level of passengers served are a possible proxy to measure the
cost efficiency of an airport. Due to compound production framework and sophisticated
political-economic environment of airports, estimation of airport costs requires detailed
specifications. Airport cost functions should be able to explain the total costs with the main
inputs labor, material and capital as well as by taking the airport specific characteristics into
account. In this paper, we apply such an approach and focus on airport specific characteris-
tics. We use a spatial regression methodology to explain how these drive the unit costs and
analyze the spatial relationship among the dependent variables. Two separate data samples
from Norwegian and French airports are used in this research to test various hypotheses.
Because a large number of regional airports in both countries cannot reach financial break-
even, our first research question deals with the effects of subsidies, which often follow
regional and political considerations. One must therefore find an efficient way to maintain
How scale and institutional setting explain the costs of small airports? 59
these airports without any distortions on the incentives. When evaluating the relationship
between subsidies and unit costs, we find negative effect of subsidies on airport cost effi-
ciency. Second, we evaluate the importance of economies of scale by focusing on the rela-
tionship between airport size and unit costs. Finally, the results of spatial regression show
that a denser spatial distribution of airports results in higher unit costs as a consequence of
lower capacity utilization, indicating the negative effect of spatial competition on airport
unit costs within an airport network.

60 How scale and institutional setting explain the costs of small airports?
References
Adler, N., Ülkü, T., Yazhemsky, E., 2013. Small regional airport sustainability: Lessons
from benchmarking. Journal of Air Transport Management 33, 22–31.
10.1016/j.jairtraman.2013.06.007.
Akaike, H., 1974. A new look at the statistical model identification. IEEE Transactions on
Automatic Control 19 (6), 716–723. 10.1109/TAC.1974.1100705.
Anderson, S.C., 1983. The effect of government ownership and subsidy on performance:
Evidence from the bus transit industry. Transportation Research Part A: General 17 (3),
191–200. 10.1016/0191-2607(83)90041-9.
Anselin, L., 1980. Estimation methods for spatial autoregressive structures. Program in
Urban and Regional Studies, Cornell University, Ithaca, N.Y.
Anselin, L., 1988. Spatial econometrics: Methods and models. Kluwer Academic Publish-
ers, Dordrecht, Boston.
Anselin, L., 2001. Spatial effects in econometric practice in environmental and resource
economics. American Journal of Agricultural Economics 83 (3), 705-710.
Anselin, L., 2002. Under the hood Issues in the specification and interpretation of spatial
regression models. Agricultural Economics 27 (3), 247–267. 10.1111/j.1574-
0862.2002.tb00120.x.
Anselin, L., Bera, A., 1998. Spatial dependence in linear regression models with an intro-
duction to spatial econometrics. In: Handbook of Applied Economic Statistics, 237–289.
Anselin, L., Le Gallo, J., Jayet, H., 2008. Spatial Panel Econometrics, in: Mátyás, L., Se-
vestre, P. (Eds.), The Econometrics of Panel Data, vol. 46. Springer Berlin Heidelberg,
Berlin, Heidelberg, pp. 625–660.
Assaf, A., 2010. The cost efficiency of Australian airports post privatisation: A Bayesian methodology. Tourism Management 31 (2), 267–273. 10.1016/j.tourman.2009.03.005.
Barrett, S.D., 2000. Airport competition in the deregulated European aviation market. Jour-
nal of Air Transport Management 6 (1), 13–27. 10.1016/S0969-6997(99)00018-6.
Barros, C.P., 2008. Technical efficiency of UK airports. Journal of Air Transport Manage-ment 14 (4), 175–178. 10.1016/j.jairtraman.2008.04.002.
Barros, C.P., 2011. Cost efficiency of African airports using a finite mixture model.
Transport Policy. 10.1016/j.tranpol.2011.05.001.

How scale and institutional setting explain the costs of small airports? 61
Bergström, F., 2000. Capital Subsidies and the Performance of Firms. Small Business Eco-
nomics 14 (3), 183–193. 10.1023/A:1008133217594.
Bilotkach, V., Clougherty, J.A., Mueller, J., Zhang, A., 2012. Regulation, privatization, and
airport charges: panel data evidence from European airports. Journal of Regulatory Eco-
nomics 42 (1), 73–94. 10.1007/s11149-011-9172-1.
Bly, P., Oldfield, R., 1986. The effects of public transport subsidies on demand and supply.
Transportation Research Part A: General 20 (6), 415–427. 10.1016/0191-2607(86)90078-6.
Bly, P., Webster, F., Pounds, S., 1980. Effects of subsidies on urban public transport.
Transportation 9 (4). 10.1007/BF00177696.
Carlin, A., Park, R., 1970. Marginal Cost Pricing of Airport Runway Capacity. The Ameri-
can Economic Review 60 (3), 310–319.
Carlsson, F., 2002. Airport marginal cost pricing: Discussion and an application to Swedish
ariports. Working Papers in Economics no. 85. Department of Economics, Göteborg Uni-versity, Göteborg.
Chi-Lok, A.Y., Zhang, A., 2009. Effects of competition and policy changes on Chinese
airport productivity: An empirical investigation. Journal of Air Transport Management 15
(4), 166–174. 10.1016/j.jairtraman.2008.09.003.
Cowie, J., 2009. The British passenger rail privatisation: Conclusions on subsidy and effi-
ciency from the first round of franchises. Journal of Transport Economics and Policy 43
(1), 85–104.
Craig, S.G., Airola, J., Tipu, M., 2003. The effect of institutional form on airport govern-
ance efficiency, University of Houston, Department of Economics.
DGAC, 2009. Activité des aéroports français: Année 2009.
Eckey, H.-F., Kosfeld, R., Türck, M., 2007. Regional Convergence in Germany: a Geo-
graphically Weighted Regression Approach. Spatial Economic Analysis 2 (1), 45–64.
10.1080/17421770701251905.
Elhorst, J.P., 2001. Dynamic Models in Space and Time. Geographical Analysis 33 (2),
119–140. 10.1111/j.1538-4632.2001.tb00440.x.
Elhorst, J.P., 2003. Specification and Estimation of Spatial Panel Data Models. Internation-
al Regional Science Review 26 (3), 244–268. 10.1177/0160017603253791.
Elhorst, J.P., 2010. Matlab software for spatial panels. Paper presented at 4th World Con-
ference of the Spatial Econometric Association, Chicago.

62 How scale and institutional setting explain the costs of small airports?
Elhorst, J.P., 2013. Spatial Panel Models. In Fischer M.M, Nijkamp P. (eds.), Handbook of
Regional Science, Springer, Berlin.
Fotheringham, A.S., Charlton, M.E., Brunsdon, C., 1998. Geographically Weighted Re-
gression: A Natural Evolution of the Expansion Method for Spatial Data Analysis, Envi-
ronment and Planning A 30(11), 1905-1927. 10.1068/a301905
Fotheringham, A.S., Brunsdon, C., Charlton, M.E., 2000. Geographically Weighted Re-
gression: The Analysis of Spatially Varying Relationships, Wiley, Chichester.
Fröhlich, K., Niemeier, H.-M., 2011. The importance of spatial economics for assessing
airport competition. Journal of Air Transport Management 17 (1), 44–48.
10.1016/j.jairtraman.2010.10.010.
GAP-Project, 2012. Comparative study (benchmarking) on the efficiency of Avinor´s air-
port operations. Revised report submitted to the Norwegian Ministry of Transport and
Communication.
Huber, H., 2009. Comparing spatial concentration and assessing relative market structure in
air traffic. Journal of Air Transport Management 15 (4), 184–194.
10.1016/j.jairtraman.2008.09.015.
Intervistas Consulting Inc., 2007. Estimating Air Travel Demand Elasticities. Report pre-
pared for IATA.
Jeleskovic, V., Schwanebeck, B., 2012. Assessment of a spatial panel model for the effi-
ciency analysis of the heterogonous healthcare systems in the world. MAGKS- Joint Dis-
cussion Paper Series in Economics No. 48-2012.
Jeong, J., 2005. An investigation of operating cost of airports: Focus on the effects of out-
put scale. Master Thesis. University of British Columbia, Vancouver.
Karlaftis, M.G., McCarthy, P., 1998. Operating subsidies and performance in public transit:
an empirical study. Transportation Research Part A: Policy and Practice 32 (5), 359–375.
10.1016/S0965-8564(98)00002-0.
Karlaftis, M.G., McCarthy, P.S., 1997. Subsidy and public transit performance: A factor
analytic approach. Transportation 24 (3), 253–270. 10.1023/A:1004956532174.
Keeler, T., 1970. Airport Costs and Congestion. The American Economist 14 (1), 47–56.
Lee, L.-f., Yu, J., 2010. Estimation of spatial autoregressive panel data models with fixed
effects. Journal of Econometrics 154 (2), 165–185. 10.1016/j.jeconom.2009.08.001.

How scale and institutional setting explain the costs of small airports? 63
LeSage, J.P., Pace, R.K., 2009. Introduction to spatial econometrics. CRC Press, Boca
Raton.
Lian, J.I., 2010. Network dependency and airline competition – Consequences for remote
areas in Norway. Journal of Air Transport Management 16 (3), 137–143.
10.1016/j.jairtraman.2009.07.007.
Lian, J.I., Rønnevik, J., 2011. Airport competition – Regional airports losing ground to
main airports. Journal of Transport Geography 19 (1), 85–92.
10.1016/j.jtrangeo.2009.12.004.
Link, H., Götze, W., Himanen, V., 2009. Estimating the marginal costs of airport operation
using multivariate time series models with correlated error terms. Journal of Air Transport Management 15 (1), 41–46. 10.1016/j.jairtraman.2008.07.003.
Low, J.M., Tang, L.C., 2006. Factor substitution and complementarity in the Asia airport
industry. Journal of Air Transport Management 12 (5), 261–266.
10.1016/j.jairtraman.2006.07.003.
Main, B.G.M., Lever, W., Crook, J.N., 2003. Central Scotland airport study. Hume Occa-
sional Paper No. 62. David Hume Institute, Edinburgh.
Malighetti, P., Martini, G., Paleari, S., Redondi, R., 2008. The Efficiency of European Air-
ports: Do the Importance in the EU Network and the Intensity of Competition Matter?
Working Paper n. 04-2008. University of Bergamo, Department of Economics and Tech-
nology Management, Italy.
http://aisberg.unibg.it/bitstream/10446/410/1/WPIngGe04(2008).pdf.
Martín, J.C., Rodríguez-Déniz, H., Voltes-Dorta, A., 2013. Determinants of airport cost
flexibility in a context of economic recession. Transportation Research Part E: Logistics
and Transportation Review 57, 70–84. 10.1016/j.tre.2013.01.007.
Martín, J.C., Román, C., Voltes-Dorta, A., 2011. Scale economies and marginal costs in Spanish airports. Transportation Research Part E: Logistics and Transportation Review 47
(2), 238–248. 10.1016/j.tre.2010.09.007.
Martín, J.C., Voltes-Dorta, A., 2011a. The econometric estimation of airports’ cost func-
tion. Transportation Research Part B: Methodological 45 (1), 112–127.
10.1016/j.trb.2010.05.001.
Martín, J.C., Voltes-Dorta, A., 2011b. The dilemma between capacity expansions and mul-
ti-airport systems: Empirical evidence from the industry’s cost function. Transportation
Research Part E: Logistics and Transportation Review 47 (3), 382–389.
10.1016/j.tre.2010.11.009.

64 How scale and institutional setting explain the costs of small airports?
Martın-Cejas, R.R., 2002. An approximation to the productive efficiency of the Spanish
airports network through a deterministic cost frontier. Journal of Air Transport Manage-
ment 8 (4), 233–238. 10.1016/S0969-6997(01)00056-4.
McCarthy, P., 2010. Airport Costs, Capacity, and Metropolitan Economic Development: A
Translog Panel Data Cost Function Analysis. Working Paper. School of Economics, Geor-
gia Institute of Technology.
Morrison, S.A., 1983. Estimation of long-run prices and investment levels for airport run-
ways. Research in Transportation Economics 1, 103–113.
Nolan, J.F., Ritchie, P.C., Rowcroft, J.R., 2001. Measuring efficiency in the public sector
using nonparametric frontier estimators: a study of transit agencies in the USA. Applied Economics 33 (7), 913–922. 10.1080/00036840122663.
Oum, T.H., Yan, J., Yu, C., 2008. Ownership forms matter for airport efficiency: A sto-
chastic frontier investigation of worldwide airports. Journal of Urban Economics 64 (2),
422–435. 10.1016/j.jue.2008.03.001.
Oum, T.H., Yu, C., 1994. Economic efficiency of railways and implications for public
policy. A comparative study of the OECD countries' railways. Journal of Transport Eco-
nomics and Policy 38, 121-138.
Paelinck, J.H.P., Klaassen, L.H., 1979. Spatial econometrics. Saxon House, Farnborough,
England.
Pavlyuk, D., 2009. Spatial Competition Pressure as a Factor of European Airports' Efficien-
cy. Transport and Telecommunication 10 (4), 8–17.
Pavlyuk, D., 2010. Multi-tier spatial stochastic frontier model for competition and coopera-
tion of European airports. Transport and Telecommunication 11 (3), 57–66.
Pavlyuk, D., 2012. Airport Benchmarking and Spatial Competition: A Critical Review.
Transport and Telecommunication 13 (2), 123–137. 10.2478/v10244-012-0010-z.
Pavlyuk, D., 2013. Distinguishing Between Spatial Heterogeneity and Inefficiency: Spatial
Stochastic Frontier Analysis of European Airports. Transport and Telecommunication 14
(1), 29–38. 10.2478/ttj-2013-0004.
Pels, E., Nijkamp, P., Rietveld, P., 2003. Inefficiencies and scale economies of European
airport operations. Transportation Research Part E: Logistics and Transportation Review 39
(5), 341–361. 10.1016/S1366-5545(03)00016-4.
How scale and institutional setting explain the costs of small airports? 65
Pels, E., Njegovan, N., Behrens, C., 2009. Low-cost airlines and airport competition.
Transportation Research Part E: Logistics and Transportation Review 45 (2), 335–344.
10.1016/j.tre.2008.09.005.
Pels, E., Vuuren, D. von, Ng, C., Rietveld, P., 2010. An empirical analysis of airport opera-
tional costs. In: Airport Competition, edited by Forsyth P., Gillen D., Müller J. and Niemei-
er, H.M. Ashgate, Burlington.
Pita, J.P., Adler, N., Antunes, A.P., 2014. Socially-oriented flight scheduling and fleet as-
signment model with an application to Norway. Transportation Research Part B: Methodo-
logical 61, 17–32. 10.1016/j.trb.2013.12.006.
Pucher, J., Markstedt, A., 1983. Consequences of public ownership and subsidies for mass transit: Evidence from case studies and regression analysis. Transportation 11 (4), 323–345.
10.1007/BF00150722.
Pucher, J., Markstedt, A., Hirschman, I., 1983. Impacts of Subsidies on the Costs of Urban
Public Transport. Journal of Transport Economics and Policy 17 (2), 155–176.
Starkie, D., 2008. The Airport Industry in a Competitive Environment: A United Kingdom
Perspective. Discussion Paper No. 2008-15, OECD / ITF.
http://dx.doi.org/10.1787/235251766646.
Starkie, D., Yarrow, G., 2013. Why airports can face price-elastic demands: Margins, lump-
iness and leveraged passenger losses. Discussion Paper No. 2013-23, OECD / ITF.
http://www.internationaltransportforum.org/jtrc/DiscussionPapers/DP201323.pdf.
Tolofari, S.R., Ashford, N., Caves, R.E., 1990. The cost of air service fragmentation. Dept.
of Transport Technology, University of Technology, Loughborough, Loughborough.
Tzelepis, D., Skuras, D., 2004. The effects of regional capital subsidies on firm perfor-
mance: an empirical study. Journal of Small Business and Enterprise Development 11 (1),
121–129. 10.1108/14626000410519155.
Voltes-Dorta, A., Pagliari, R., 2012. The impact of recession on airports' cost efficiency.
Transport Policy 24, 211–222. 10.1016/j.tranpol.2012.08.012.