Embed Size (px)
Citation preview

RESEARCH REPOSITORY
This is the author’s final version of the work, as accepted for publication following peer review but without the publisher’s layout or pagination.
The definitive version is available at:
https://doi.org/10.1016/j.vetpar.2018.02.004
Levecke, B., Kaplan, R.M., Thamsborg, S.M., Torgerson, P.R., Vercruysse, J. and Dobson, R.J. (2018) How to improve the standardization and the diagnostic performance of the
fecal egg count reduction test? Veterinary Parasitology
http://researchrepository.murdoch.edu.au/id/eprint/40238/
Copyright: © 2018 Elsevier B.V.
It is posted here for your personal use. No further distribution is permitted.

Accepted Manuscript
Title: How to improve the standardization and the diagnosticperformance of the fecal egg count reduction test?
Authors: Bruno Levecke, Ray M. Kaplan, Stig M. Thamsborg,Paul R. Torgerson, Jozef Vercruysse, Robert J. Dobson
PII: S0304-4017(18)30053-0DOI: https://doi.org/10.1016/j.vetpar.2018.02.004Reference: VETPAR 8588
To appear in: Veterinary Parasitology
Received date: 13-11-2015Revised date: 25-1-2018Accepted date: 1-2-2018
Please cite this article as: Levecke B, Kaplan RM, Thamsborg SM, Torgerson PR,Vercruysse J, Dobson RJ, How to improve the standardization and the diagnosticperformance of the fecal egg count reduction test?, Veterinary Parasitology (2010),https://doi.org/10.1016/j.vetpar.2018.02.004
This is a PDF file of an unedited manuscript that has been accepted for publication.As a service to our customers we are providing this early version of the manuscript.The manuscript will undergo copyediting, typesetting, and review of the resulting proofbefore it is published in its final form. Please note that during the production processerrors may be discovered which could affect the content, and all legal disclaimers thatapply to the journal pertain.

1
How to improve the standardization and the diagnostic performance of the fecal egg
count reduction test?
Bruno Levecke1, Ray M. Kaplan2, Stig M. Thamsborg3, Paul R. Torgerson4, Jozef
Vercruysse1, Robert J. Dobson5
1Department of Virology, Parasitology and Immunology, Faculty of Veterinary Medicine,
Ghent University, Belgium
2Department of Infectious Diseases, College of Veterinary Medicine, University of Georgia,
Georgia, USA
3Department of Veterinary Disease Biology, University of Copenhagen, Denmark
4Section of Epidemiology, Vetsuisse Faculty, University of Zürich, Switzerland
5School of Veterinary and Life Sciences, Murdoch University, Australia
*Corresponding author: Bruno Levecke, Department of Virology, Parasitology and
Immunology, Ghent University, Faculty of Veterinary Medicine, Salisburylaan 133, 9820
Merelbeke, Belgium, Tel. +32 9 264 74 04, Fax. +32 9 264 74 96, e-mail:
ACCEPTED MANUSCRIP
T

2
HIGHLIGHTS
the currently recommended criteria for classifying drug efficacy are the most
appropriate
a combination of confidence intervals methodologies is recommended to assess the
uncertainty of drug efficacy estimates
the required number of eggs to count is proposed for different sample sizes
Abstract
Although various studies have provided novel insights into how to best design, analyze and
interpret a fecal egg count reduction test (FECRT), it is still not straightforward to provide
guidance that allows improving both the standardization and the analytical performance of the
FECRT across a variety of both animal and nematode species. For example, it has been
suggested to recommend a minimum number of eggs to be counted under the microscope (not
eggs per gram of feces), but we lack the evidence to recommend any number of eggs that
would allow a reliable assessment of drug efficacy. Other aspects that need further research
are the methodology of calculating uncertainty intervals (UIs; confidence intervals in case of
frequentist methods and credible intervals in case of Bayesian methods) and the criteria of
classifying drug efficacy into ‘normal’, ‘suspected’ and ‘reduced’. The aim of this study is to
provide complementary insights into the current knowledge, and to ultimately provide
guidance in the development of new standardized guidelines for the FECRT. First, data were
generated using a simulation in which the ‘true’ drug efficacy (TDE) was evaluated by the
FECRT under varying scenarios of sample size, analytic sensitivity of the diagnostic
technique, and level of both intensity and aggregation of egg excretion. Second, the obtained
data were analyzed with the aim (i) to verify which classification criteria allow for reliable
detection of reduced drug efficacy, (ii) to identify the UI methodology that yields the most
ACCEPTED MANUSCRIP
T

3
reliable assessment of drug efficacy (coverage of TDE) and detection of reduced drug
efficacy, and (iii) to determine the required sample size and number of eggs counted under the
microscope that optimizes the detection of reduced efficacy. Our results confirm that the
currently recommended criteria for classifying drug efficacy are the most appropriate.
Additionally, the UI methodologies we tested varied in coverage and ability to detect reduced
drug efficacy, thus a combination of UI methodologies is recommended to assess the
uncertainty across all scenarios of drug efficacy estimates. Finally, based on our model
estimates we were able to determine the required number of eggs to count for each sample
size, enabling investigators to optimize the probability of correctly classifying a theoretical
TDE while minimizing both financial and technical resources.
Keywords: fecal egg count reduction test; anthelmintic efficacy; monitoring programs;
anthelmintic resistance; Monte Carlo simulation; standardization
ACCEPTED MANUSCRIP
T

4
1. Introduction
The fecal egg count reduction test (FECRT) remains the recommended assay to assess
anthelmintic drug efficacy against gastrointestinal nematodes in animals, and hence
anthelmintic resistance (Kaplan and Vidyashankar, 2012). Guidelines for performing a
FECRT were provided in the 1992 World Association for the Advancement of Veterinary
Parasitology (WAAVP) publication on how to detect anthelmintic resistance in nematodes of
veterinary importance (Coles et al., 1992). Since the publication of these guidelines, a variety
of studies have provided novel insights into how to best design (e.g., Torgerson et al., 2005;
2012; McKenna, 2006; Dobson et al., 2012; Levecke et al. 2012; Calvete and Uriarte, 2013),
analyze (e.g., Vercruysse et al., 2001; Cabaret and Berrag, 2004; Dobson et al., 2009,
Levecke et al., 2011; Vercruysse et al., 2011; Vidyashankar et al., 2012; Calvete and Uriarte,
2013) and interpret a FECRT (e.g., Vidyashankar et al., 2007, Torgerson et al., 2005, 2014;
Denwood et al., 2010; Dobson et al., 2012; Lyndal-Murphy et al., 2014; Geurden et al., 2015).
These new insights point to the need for an update of the recommendations for the FECRT.
However, it is not straightforward to provide guidance that allows improving both the
standardization and the performance of the FECRT across a variety of both animal and
parasite species. For example, it is well known that the required sample size and the lower
analytic sensitivity of the fecal egg count (FEC) method (≈ 1 / mass of feces in gram
examined under the microscope) will depend on the underlying level (or intensity) and
aggregation of egg excretion (Levecke et al., 2012). However, these two egg excretion
parameters vary considerable between and within both parasite and animal species, and are
often unknown prior the FECRT, making it difficult to recommend one study design that
applies to all possible scenarios of egg excretion while assuring the reliable performance of a
FECRT. An approach that may untangle this complex issue is to make recommendations on
the total number of eggs that need to be counted under the microscope at baseline, a strategy
ACCEPTED MANUSCRIP
T

5
that has been previously applied by Dobson et al., 2012. Traditionally, the eggs counted are
converted into eggs per gram (EPG), and those data are then used for calculating percent
reduction in FECs and the corresponding uncertainty intervals (UI, confidence intervals in
case of frequentist methods and credible intervals in case of Bayesian methods). However, the
eggs counted under the microscope are the actual data recorded in a FECRT; hence it is an
important parameter with regard to both analytical issues and study design. For example,
when FECR is based on the pre- and post-treatment FECs of the same animals and when all
pre- and post-treatment samples are examined applying a FEC the same analytic sensitivity,
the formula can be reduced to the ratio of the total number of eggs counted under the
microscope at pre- and post-treatment (see Equations 1 and 2; Supplementary Material 1).
Additionally, the total number of eggs counted under the microscope nicely grasps the
variations in both study design (analytic sensitivity and sample size) and host-parasite
interactions (level and aggregation of egg excretion), and hence recommending a minimum
number of eggs to be counted under the microscope (also dependent on the examined sample
size) allows avoiding stringent recommendations on the other parameters. As an example, if it
were recommended to count at least 200 eggs under the microscope across at least 10 animals
prior treatment and if animals were excreting on average 500 EPG, one could either screen 10
animals using a diagnostic technique with a analytic sensitivity of 25 EPG (10 animals x 500
EPG / 25 EPG = 200 eggs) or screen 20 animals with a analytic sensitivity of 50 EPG (20
animals x 500 EPG / 50 EPG = 200 eggs). In addition, it would also allow avoiding
underpowered trials when egg excretion at baseline revealed to be lower as anticipated or
when the level of egg excretion is even unknown. When we now assume that the animals
excrete 250 EPG instead of 500 EPG, the total number of eggs at baseline would be 100 for
both study designs (= 10 animals x 250 EPG / 25 EPG = 20 animals x 250 EPG / 50 EPG),
and hence the trials may not allow to readily draw conclusions on the drug efficacy. At this
ACCEPTED MANUSCRIP
T

6
point, one could easily adapt the diagnostic strategy until a sufficient number of eggs are
counted at baseline (e.g. reexamination of the same samples with the same diagnostic
technique would in principle double the eggs counted). Although these examples illustrate the
elegance of recommending a minimum number of eggs to be counted under the microscope
we currently lack the evidence to recommend the number of eggs required to yield a reliable
assessment of drug efficacy by means of the FECRT. Lastly, it is also important to avoid
having most eggs counted come from only few animals, and hence guidance on the allowed
distribution of egg counts across animals is also needed.
Other aspects of analysis and interpretation of the FECRT that need further research are the
methodology of calculating the corresponding UIs and the criteria for classifying drug
efficacy into ‘normal’, ‘suspected’ and ‘reduced’. The UI methodology in the current
guidelines has two important limitations. First, it can only be applied on a randomized
controlled study design using post-treatment counts of both treatment and control groups
(Coles et al., 1992). This experimental design, however, has proven to be less sensitive at
detecting reduced efficacy compared to FECRT based on pre- and post-treatment counts from
the same animals (McKenna, 2006; Dobson et al. 2012; Calvete and Uriarte, 2013). Second,
the uncertainty of the estimates (the UI) cannot be calculated when the observed FECR is
100%, and hence it is impossible to draw conclusions on the reliability of the estimate
(Denwood et al., 2010; Dobson et al., 2012; Torgerson et al., 2014). This is relevant because
seeing no eggs following treatment does not mean the efficacy was 100%; depending on how
many eggs were counted in the pre-treatment FECs the true efficacy may be approaching
100%, but may never reach 100% (or be considerably less than 100%). Alternative UI
methodologies can be applied to FECRT based on counts of the same animals (Denwood et
al., 2010; Lyndal-Murphy et al., 2014; Torgerson et al., 2014; Levecke et al., 2015; Geurden
et al., 2015; Peña-Espinoza et al., 2016). Other methods allow assessment of the uncertainty
ACCEPTED MANUSCRIP
T

7
of estimates when FECR is 100% (Denwood et al., 2010; Dobson et al., 2012; Torgerson et
al., 2014; Geurden et al., 2015; Peña-Espinoza et al., 2016). However, at present these
methodologies need further research, thus the accuracy and precision of these methods
requires further clarification. Currently, the efficacy of an anthelmintic is classified as
‘reduced’, ‘suspected’ and ‘normal’ based on how the obtained FECR and the lower limit
(LL) of the 95% UI relates to established thresholds, a drug efficacy for sheep and goats being
‘reduced’ when FECR <95% and LL of UI <90%; as ‘suspected’ when either FECR <95% or
LL <90%, and as ‘normal’ when FECR ≥95% and LL ≥90% (Coles et al., 1992). Whether
alternative classification criteria that are solely based on the UI (e.g. drug efficacy being
‘reduced’ when upper limit (UL) <95%, ‘normal’ when LL ≥95%, and ‘suspected’ in any
other cases; El-Abdellati et al., 2010) or combining both the FECR-estimate and the UI
(Lyndal-Murphy et al., 2014; Geurden et al., 2015; ‘normal’: FECR ≥95%, UL of UI ≥95%
and LL of UI ≥90%; ‘reduced’: FECR <95%, UL of UI <95% and LL of UI <90%;
‘suspected’ in all other cases), or only the FECR estimate (e.g., drug efficacy being ‘reduced’
when FECR <90%, ‘normal’ when FECR ≥95%, and ‘suspected’ in any other cases; in
analogy with World Health Organization, 2013) would allow for reliable detection of reduced
drug efficacy is unclear.
The aim of this study is to provide insights complementary to the current knowledge on how
to design, analyze and interpret FECRTs, and to ultimately provide guidance in the
development of new standardized guidelines for the FECRT that lead to improving both the
standardization and the analytical performance of the FECRT across a variety of both animal
and parasite species.
2. Methods
ACCEPTED MANUSCRIP
T

8
The study consisted of two consecutive procedures. First, data were generated using a
simulation in which the ‘true’ drug efficacy (TDE) was evaluated by the FECRT under
varying scenarios of sample size, analytic sensitivity of the diagnostic technique and level of
both intensity and aggregation of egg excretion. Second, the obtained data were analyzed with
the aim (i) to verify which classification criteria allows for reliable detection of reduced drug
efficacy, (ii) to identify the UI methodology that yields the most reliable assessment of
precision of drug efficacy, coverage of TDE and detection of reduced drug efficacy, and (iii)
to determine the required sample size and number of eggs counted under the microscope that
optimizes the detection of reduced efficacy.
2.1. Data generation
Data were generated by Monte Carlo simulation using a modification of the methodology
described by Levecke et al. (2012). First, the distribution of parasites within a virtual host
population before treatment was defined by a negative binomial distribution. This distribution
is determined by two parameters: the mean level of intensity (mean pre-treatment fecal egg
counts (pre-FECs)) and aggregation of egg excretion across animals (k). Low values of k
indicate that only few animals are excreting the majority of the eggs, high values indicate that
egg counts are more equally distributed across the host population. From this pre-defined
distribution representing a virtual population of animals, a random sample of 5,000 FECs was
randomly drawn. This number of FECs was required to ensure a sufficiently large number of
unique non-zero FEC cases. Using this method, the ‘observed’ pre-FEC will be different from
the ‘true’ pre-FEC due to the variation (i.e. stochasticity) introduced by sampling eggs
associated with the diagnostic technique. This component of variation was simulated using
the Poisson distribution defined by the expected number of eggs counted (i.e. ’true’ pre-
FEC/analytic sensitivity). Subsequently, a subset of N animals was randomly drawn from all
ACCEPTED MANUSCRIP
T

9
animals found to be excreting eggs (observed pre-FEC >0) at baseline. The ‘true’ FECs after
treatment (post-FECs) were generated from the binomial distribution with the ‘true’ pre-FECs
as the number of trials and 1-TDE as the proportion. The observed FECs after treatment (post-
FECs) were generated as described above for the pre-FECs. Subsequently, the FECR and its
corresponding 95% UI were determined. The FECR was calculated as described in the
formula below (Kochapakdee, 1995, Equation 1), and is based on the arithmetic mean of pre-
and post-FECs of the same animals
(Eq 1)
FECR = 1-arithmetic mean FEC post-treatment( )arithmetic mean FEC pre-treatment( )
Given an equal number of animals and the use of an equal FEC method analytic sensitivity
before and after treatment, this equation, as shown in Supplementary Material 1, is equivalent
to
(Eq 2)
1-
microscopic egg count post-treatmenti=1
N
å
microscopic egg count pre-treatmenti=1
N
å
The 95% UI intervals were based a frequentist philosophy and were calculated applying two
different methodologies. The first methodology (method 1) is based on the mathematical
framework described by Levecke et al., 2015. In short, this methodology derives the variance
of the FECR applying the Taylor method (delta method; Casella and Berger, 2001) (Equation
3), and assumes that 1-FECR follows a Gamma distribution (Equation 4). The variance of the
FECR applying the Taylor method equals
ACCEPTED MANUSCRIP
T

10
(Eq 3)
var FECR[ ]=mean(post-FEC)
mean(pre-FEC)
æ
èç
ö
ø÷
2
x
var(pre-FEC)
mean(pre-FEC)2+
var(post-FEC)
mean(post-FEC)2
-2 x corr(pre-FEC, post-FEC) x var(pre-FEC) x var(post-FEC)
mean(pre-FEC) x mean(post-FEC)
æ
è
çççç
ö
ø
÷÷÷÷
The LL and UL of the 95% UI of FECR equal 1 - 97.5th quantile and 1 - 2.5th quantile of the
Gamma distribution with a shape parameter γ and a scale parameter θ, respectively. Based on
the FECR, its variance and a sample size N, one can write the two parameters of the Gamma
distribution of 1 - FECR as
(Eq 4)
g =(1-FECR)2x N
var(FECR)
q =var(FECR)
(1-FECR) x N
The second methodology (method 2) is based on the 95% UI described in Coles et al., 1992,
but accounting for correlation between individual FECs before and after treatment and
assuming that the naturally log transformed ratio of mean post-FEC and mean pre-FEC
follows a t-distribution with N-1 degrees of freedom (Lyndal-Murphy et al., 2014). Applying
this methodology, the variance of the log transformed ratio equals
(Eq 5)
Based on this variance (Equation 5) and a sample size N, the LLs and ULs of the 95% UI for
the FECR equal
(Eq 6)
var lnmean(post-FEC)
mean(pre-FEC
æ
èç
ö
ø÷
é
ëê
ù
ûú=
var(pre-FEC)
mean(pre-FEC)2+
var(post-FEC)
mean(post-FEC)2
-2 x corr(pre-FEC, post-FEC) x var(pre-FEC) x var(post-FEC)
mean(pre-FEC) x mean(post-FEC)
æ
è
çççç
ö
ø
÷÷÷÷ACCEPTED M
ANUSCRIPT

11
LL = 1-exp lnmean(post-FEC)
mean(pre-FEC)
æ
èç
ö
ø÷-t0.025,N-1
VarN
æ
èçç
ö
ø÷÷
UL = 1-exp lnmean(post-FEC)
mean(pre-FEC)
æ
èç
ö
ø÷+ t0.025,N-1
VarN
æ
èçç
ö
ø÷÷
The parasite/host population parameter values chosen for mean pre-FEC (25, 50, 100, 150,
200, 250, 500, and 1,000 EPG) and k (0.1, 0.5, 0.75, 1, 1.5 and 2) were based on previously
conducted studies where gastrointestinal nematodes were quantified in goats (Hoste et al.,
2002), sheep (Morgan et al., 2005), cattle (El-Abdellati et al., 2010), horses, pigs and
camelids (Laboratory of Parasitology, Faculty of Veterinary Medicine, Ghent University
(Belgium), unpublished data). The values for analytic sensitivity represented those of four
currently used FEC methods: FLOTAC (analytic sensitivity = 1 EPG; Cringoli et al., 2010),
mini-FLOTAC (analytic sensitivity = 5 and 10 EPG; Cringoli, et al., 2013), FECPAK
(analytic sensitivity = 10 and 30 EPG; www.fecpak.com) and McMaster (analytic sensitivity
= 25 and 50 EPG) (MAFF, 1986). To reduce the number of simulations, the analytic
sensitivity of 30 EPG represented by FECPAK was omitted. The sample sizes varied from 5
to 25 with a step-wise interval of 5. The TDE ranged from 70 to 99% with a step-wise interval
of 1%, resulting in 36,000 combinations (8 (mean pre-FEC) x 6 (k) x 5 (analytic sensitivity) x
5 (sample size) x 30 (TDE)) that were each iterated 100 times.
2.2. Statistical data analysis
2.2.1. Comparison of the diagnostic performance of four classification criteria for drug
efficacy
Four criteria, each classifying the drug efficacy as ‘reduced’, ‘suspected’ and ‘normal’, were
included in the comparison. The first criteria (criteria 1) refer to the current definition (Coles
et al., 1992), classifying drug efficacy as ‘reduced’ when FECR <95% and LL of the 95% UI
ACCEPTED MANUSCRIP
T

12
<90%, as ‘suspected’ when either FECR <95% or LL <90%, and as ‘normal’ when FECR
≥95% and LL ≥90%. The second criteria (criteria 2) are proposed by El-Abdellati et al., 2010,
classifying a drug efficacy as ‘reduced’ when the UL of the 95% UI is <95%, as ‘suspected’
when FECR <95%, but 95% is included in the UI or when FECR ≥95%, but when the LL
<95%, and as ‘normal’ when the LL ≥95%. The third criteria (criteria 3) are proposed by
Lyndal-Murphy 2014 and Geurden et al., 2015, classifying drugs as ‘normal’ when FECR
≥95%, UL of UI ≥95% and lower UI ≥90%, as ‘reduced’ when FECR <95%, UL of UI <95%
and lower UI <90%, and as ‘suspected’ in all other cases. The fourth criteria (criteria 4)
classifies drug efficacy solely based on the observed FECR result; drug efficacy being
‘reduced’ when the FECR <90%, ‘suspected’ when FECR ≥90% but <95%, and ‘normal’
FECR ≥95%. This principle of classifying is applied for the classification of efficacy of drugs
against human parasites (Schistosoma spp., Ascaris lumbricoides, Trichuris trichiura and
hookworms; WHO, 2013). To compare the performance of the different classification criteria,
they were each applied on the dataset generated. Subsequently, the ability of each criteria to
correctly classify a truly reduced and normal drug efficacy were determined. To this end,
every TDE <95% was considered as a truly reduced efficacy, and as truly normal if ≥95%.
The calculation of the UI was based on method 1.
2.2.2. Comparison of coverage and diagnostic performance of two 95% UI methodologies
The two methodologies for calculating 95% UIs were compared based on the coverage
(proportion of the 95% UIs that contains the TDE; which should be 95%), and their ability to
correctly classify a truly reduced and normal drug efficacy based on classifications criteria 1,
2 and 3. Classification criteria 4 were not included in this comparison since it classifies drug
efficacy based on the FECR estimates only.
ACCEPTED MANUSCRIP
T

13
2.2.3. The required samples size and number of eggs counted under the microscope
The required sample size and number of eggs that need to be counted in order to correctly
define a truly reduced and normal efficacy were determined. To this end, fully parameterized
logistic regression models were fitted separately for the detection of truly reduced (sensitivity)
and truly normal drug efficacies (specificity) with the test result based on the most reliable
classification criteria for drug efficacy (positive/negative) as the outcome, and the TDE, the
sample size, the number of eggs counted and all possible interaction between the variables as
covariates. Models were built for both 95% UI methodologies. The predictive power of these
models was evaluated by the proportion of the observed outcome that was correctly predicted
by the model. To this end, an individual probability >0.5 was set as a positive test result, and
negative if different. Finally, the required number of eggs to be counted for correct
classification of drugs as ‘reduced’ and ‘normal’ in at least 95% of the cases was estimated
based on this model for each sample size across a selected range of TDE-values (87%-89%;
97%-99%). To this end, the probability of classifying a truly reduced or normal drug efficacy
was estimated for a wide range of scenarios of sample size and number of eggs counted.
3. Results
3.1. Comparison of the diagnostic performance of four classification criteria for drug efficacy
The sensitivity and the specificity of detecting a truly reduced efficacy for each of the four
classification criteria are summarized in Table 1. As illustrated in Figure 1 the sensitivity and
specificity varied across different values of TDE, with the probability of correctly classifying
drug efficacy decreasing as the TDE approached the threshold of 95% (surface of grey zone
increases). For example, when applying criteria 1, an efficacy of 70% and 99% are correctly
classified, with high probability (>95%), as being ‘reduced’ and ‘normal’, respectively,
ACCEPTED MANUSCRIP
T

14
whereas a drug efficacy of 95% is classified as suspected in ~40% of the cases, ~20% of the
cases as ‘reduced’, and ~40% of the cases as ‘normal’.
<Table 1 and Figure 1 near here>
3.2. Comparison of coverage and diagnostic performance of two 95% UI methodologies
3.2.1. Coverage
Overall, the coverage was lower for method 1 (85.7%) than for method 2 (90.0%). Figure 2
illustrates the coverage over the different TDE-values, highlighting that the coverage remains
stable for TDE values between 70% and 90% (method 1: ~87%; method 2: ~92%), but then
drops towards ~70% when TDE was 99%. This drop can be explained by an increasing
number of cases of FECR equal to 100% in function of increasing TDE. When excluding
these cases, the coverage increased as a function of TDE, ranging from 87.8 to 90.7% for
method 1, and from 92.7% to 93.0% for method 2 (Figure 2).
<Figure 2 near here>
3.2.1. Diagnostic performance
Figure 3 illustrates the diagnostic performance of detecting reduced efficacy based on
classification criteria 1, 2 and 3 for both 95% UI methodologies separately. Compared to
method 1, the sensitivity of detecting reduced efficacy was comparable for method 2, and this
was the case for the three classification criteria (criteria 1: method 1 = 90.0% vs. method 2 =
91.0%; criteria 2: method 1 = 80.3% vs. method 2 = 80.8%; criteria 3: method 1 = 77.1 vs.
method 2 = 78.0%). Differences in specificity, however, were more pronounced. When
applying method 1 to calculate 95% UI, the specificity equaled 81.2% (criteria 1 and 3) and
ACCEPTED MANUSCRIP
T

15
54.2% (criteria 2), whereas this was 71.1% (criteria 1 and 3) and 44% (criteria 2) when
applying method 2.
<Figure 3 near here>
3.3. The required sample size and the number of eggs to be counted under the microscope
Based on the results described in sections 3.1. and 3.2. it was concluded that criteria 1 allowed
for the most reliable detection of reduced efficacy (highest sensitivity and second highest
specificity), and that neither of the UI methodologies was better than the other. Therefore, the
required sample size and the number of eggs to be counted under the microscope were
determined applying classification criteria 1 for the two 95% UI methodologies separately.
For the sensitivity, the logistic regression models predicted the observed data in ~93% of the
cases (method 1 = 93.3%, method 2 = 93.6%), and for the specificity this was 81.3% and
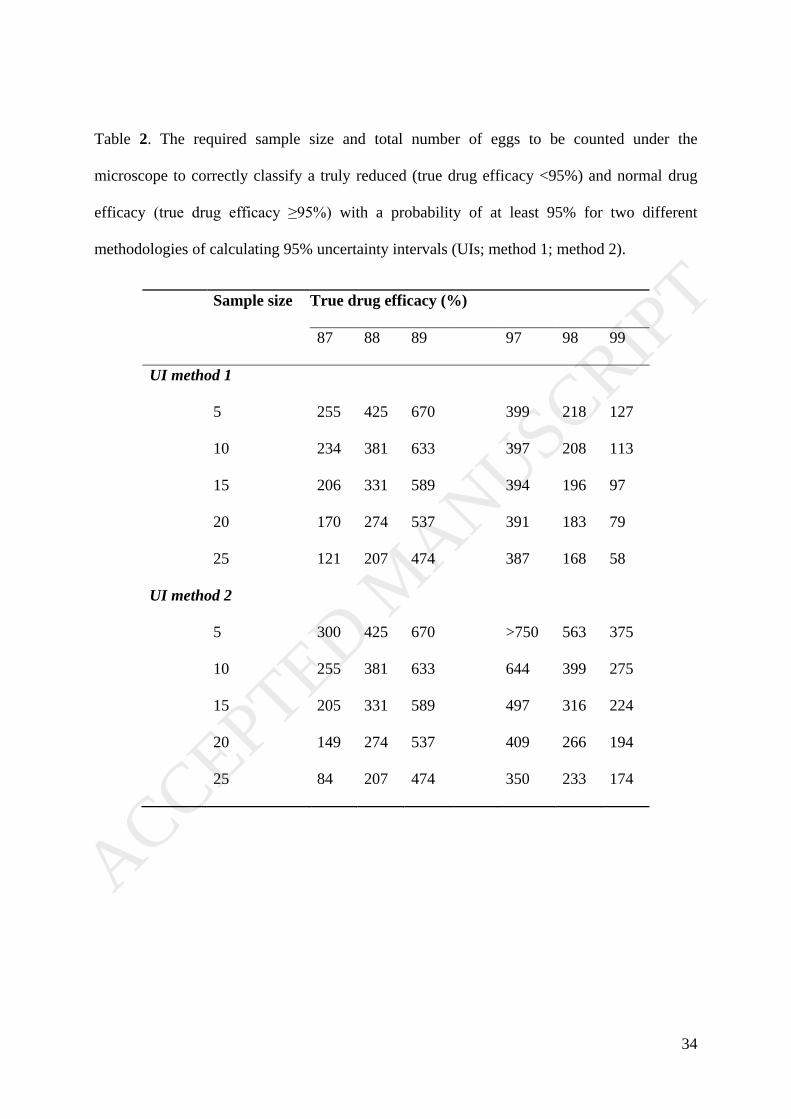
76.6% for methods 1 and 2, respectively. Table 2 provides the required egg numbers required
to correctly classify a TDE of 97%, 98% and 99% as ‘normal’ and a TDE of 87%, 88% and
89% as ‘reduced’ with a probability of at least 95% for a sample size of 5, 10, 15, 20 and 25
for the two different methodologies for calculating UIs. In most cases, the number of eggs to
be counted under the microscope decreased when the sample size increased and increased
when the TDE approached the threshold of 95%. The required egg counts for correctly
classifying a truly reduced drug efficacy is generally higher than the number of eggs required
for classifying a truly normal drug efficacy, but this difference in the required number of eggs
to be counted also varies between the methods applied. For example, when applying method
1, the model predicts that counting ~200 eggs over 15 animals allows one to classify a truly
normal drug efficacy of 98% in 95% of the cases as ‘normal’, where as this number of eggs
only yields a correct classification of a truly reduced efficacy of 87%. When applying method
2, the model predicts ~200 eggs over 15 animals will also allow to classify a truly reduced
efficacy of 87%, but may only allow to classify a truly normal drug efficacy of 99% in 95%
ACCEPTED MANUSCRIP
T

16
of the cases. For UI method I, the decrease in number of eggs to be counted with increasing
sample size was small (TDE = 97%) to absent (TDE = 89%) when the TDE approached the
threshold of 95%. Note that we have not reported the number of eggs that allow correctly
classifying drugs with a truly underlying efficacy between 89% and 97%, and this is because
these numbers are logistically not feasible to be obtained under field conditions (>750 eggs).
<Table 2 near here>
4. Discussion
Despite increasing criticism of the existing WAAVP recommended guidelines for FECRT
published almost 25 years ago in 1992, and the recent progress made on how to best design,
analyze and interpret a FECRT, there remains a lack of important evidence to support the
revision of the current guidelines. In this study we aimed to address this lack of evidence,
with the goal of providing insights complementary to the current knowledge, and to ultimately
provide guidance that allows improving both the standardization and the performance of the
FECRT with applicability across a variety of both host and parasite species. To this end, we
consecutively compared different classification criteria and UI methodologies. Based on the
results obtained, we determined the required samples size and number of eggs to be counted
under the microscope that optimize the detection of reduced efficacy.
Our results show that a number of the parameters in the current FECRT guidelines (Coles et
al., 1992) require modification. However, our analyses also indicate that the classification
criteria provided in the current guidelines, based on the FECR and the LL of the 95% UI, is
the best strategy for classifying drug efficacy. Compared to the other classification criteria for
FECRT results, these criteria provided the highest sensitivity for detecting a truly reduced
efficacy, while providing the second highest specificity. Overall, these criteria yielded the
ACCEPTED MANUSCRIP
T

17
highest probability for correctly classifying drug efficacy of the four classification criteria
tested. Admittedly, the thresholds put forward by Coles et al. (1992) of 95% for FECR and
90% for the LL of the UI are somewhat arbitrary. Once efficacy falls below 99%, both the
actual reduction in efficacy and variability come into play. If the efficacy is lower than
expected due to random variability, then a conclusion of reduced efficacy is reasonable. Thus,
choice of the threshold is not merely a statistical issue, but also a biological one
(Vidyashankar et al, 2012). Consequently, any threshold chosen will be arbitrary by its very
nature. Given the usual expected efficacies of commonly used anthelmintics of >99%, and the
limitations of precision when performing a FECRT, the choice of 95% FECR and LL of UI of
90% remain sensible and useful thresholds. One could increase the thresholds and improve
specificity, or decrease the thresholds and improve sensitivity, but the inherent tradeoff makes
it impossible to maximize both simultaneously. All four of the classification criteria tested in
our analyses used various permutations of the 95% and 90% levels for FECR and 95% UI,
respectively. If different thresholds were used, the measured values for sensitivity and
specificity of each classification criteria would change, but it is likely that the same
conclusions would be reached. Thus, the results of our analyses suggest that revision of the
current classification criteria is not justified.
Making recommendations on the UI methodology revealed to be less straightforward.
Compared to the methodology based on Levecke et al., 2015, the methodology described by
Lyndal-Murphy et al., 2014, resulted in a higher coverage of the TDE (lower LL),
approaching the expected coverage 95%, but often failed to correctly classify a truly normal
drug efficacy. Although this poor specificity of the methodology described by Lyndal-
Murphy et al., 2014 could be resolved by either including more animals or counting more
eggs under the microscope (Table 2), it will come with additional costs. For example,
processing and examining further samples with McMaster (analytic sensitivity of 50 EPG)
ACCEPTED MANUSCRIP
T

18
requires 5 – 6 minutes/sample (Levecke et al., 2009; Barda et al., 2014; Van den Putte, 2016),
whereas this is 12 – 13 min for Mini-FLOTAC (analytic sensitivity 5 – 10 EPG; Barda et al.,
2014; Van den Putte, 2016) and 28 – 37 min for FLOTAC (analytic sensitivity of 1 – 2 EPG;
Speich et al., 2010). In practice additional sampling requires that the original sample material
is preserved while the first set of counts are completed and that a decision on the necessity to
count more samples needs to be determined at the time. In addition, these UI methodologies
do not allow the assessment of uncertainty when the FECR equals 100% and when pre- and
post FECs are perfectly positively correlated. To illustrate these cases in more detail we have
worked out a toy example in Supplementary Material 2. It is important to note that the data
used in this example are not generated using the methodology described in 2.1. Data
generation, neither do they represent real field data, rather they are both arbitrary and
purposively generated to clearly illustrate the limitations of each UI methodology. For
example, although it is likely to observe a FECR 100% when pre-FECs are low and when the
analytic sensitivity of the FEC method is high (increases false negatives), an observed perfect
correlation between observed pre- and post-FEC is virtually unlikely to occur. A variety of
alternative Bayesian based methodologies have been described that allow to assess the
uncertainty around the FECR estimates in these cases, and hence to draw conclusions on the
efficacy of the drugs (Bayescount: Denwood et al., 2010; Geurden et al., 2015; Peña-Espinoza
et al., 2016; Jeffrey’s interval: Dobson et al., 2012: eggCounts: Torgerson et al., 2014).
However, these methodologies too have some important limitations, which impede
recommending one methodology to estimate the uncertainty. Jeffrey’s interval (Dobson et al.,
2012) does not account for the variation and the correlation of counts at pre- and post-
treatment, and as a consequence of this, it is not appropriate for a design based on pre- and
post-FECs of the same animals. This is made more explicit in Supplementary Material 2,
which shows that swapping post-FECs across individuals will not result in a change in the
ACCEPTED MANUSCRIP
T

19
95% UIs when Jeffrey’s interval is applied. The implementation and the interpretation of both
Bayescount (Denwood et al., 2010; Geurden et al., 2015; Peña-Espinoza et al., 2016) and
eggCounts (Torgerson et al., 2014) still require a high-level knowledge on statistics, which
poses an important obstacle for their usability. Efforts in developing web interfaces to make a
bridge between this relatively complex framework and the end-users, who are less
experienced in statistics, should be further encouraged (eggCounts:
http://www.math.uzh.ch/ag/?id=252). Moreover, important differences between both
Bayesian methodologies have recently been observed, eggCounts generally reporting more
narrow UIs compared to those of Bayescount (Peña-Espinoza et al., 2016), and these
discrepancies in width also became apparent in the toy example described in Supplementary
Material 2. EggCounts did not result in wider UIs when post-FECs were swapped, suggesting
that the UIs derived from this model may not completely reflect a true underlying variation in
drug efficacy across animals in a paired test. Also note that earlier implementations of the
eggCounts (before October 2016) did not provided wider UIs, even when it was assumed that
the FECs were obtained through a randomized controlled study design using post-treatment
counts of both treatment and control groups. The latest implementation has corrected this
error (version 1.3; Wang et al. 2017). It is out of the scope of the current study to explain
these observed differences both between and within Bayescount and eggCounts in more
technical detail, but it is important to underline the potential impact of these differences on
drawing conclusions. This is in particular when inference is drawn based on UIs, including
but not limited to classifying drug efficacy based on FECRT. For example, Kotze and
colleagues (2014) applied eggCounts to verify whether inclusion or exclusion of low pre-
treatment FECs (<150 EPG) would affect the FECR results in 2 human clinical trials designed
to assess the efficacy of albendazole against hookworm infections. In one of these human
trials exclusion of the low pre-treatment FECs resulted in a significant higher FECR-result.
ACCEPTED MANUSCRIP
T

20
However, the reported UIs were also unexpectedly small (see also Levecke et al., 2014 which
applied the methodology of Levecke et al., 2015), and therefore the likelihood that UIs do not
overlap increases. As a consequence of this, the probability of falsely rejecting the null
hypothesis that there is no difference in FECR results may have increased. Other studies that
applied the earlier versions of eggCounts, and hence results from unpaired designs in these
studies may need to be interpreted with caution. These include Malrait et al. (2014), das
Neves et al. (2015), O’ Shaughnessy et al. (2014), Balmer et al. (2015), Borges et al. (2015),
Novobilský and Höglund (2015), and Vargas-Duarte et al. (2015). Thus, if an efficacy of
100% is observed in a study, in order to estimate the reliability (UIs) of that result we would
recommend to apply Bayescount (Denwood et al., 2010; Geurden et al., 2015; Peña-Espinoza
et al., 2016), Jeffrey’s interval (Dobson et al., 2012) or eggCounts (Torgerson et al., 2014:
http://www.math.uzh.ch/ag/?id=252) despite the limitations of these methods in other
contexts.
Table 2 provides the required sample size and the total number of eggs to be counted under
the microscope across a wide range of TDE values. These values should now allow
researchers to design their FECRT according to a wide range of field conditions and without
prior knowledge on the egg excretion in the animals, while ensuring a good diagnostic
performance of detecting reduced efficacy. This analysis also confirms that (i) the diagnostic
performance of the FECRT improved as a function of sample size and the number of eggs
counted under the microscope in almost all cases, the latter being a function of the analytic
sensitivity of the diagnostic technique, and the intensity and aggregation of egg excretion; (ii)
that there will always be a grey zone in which it remains unreliable to draw conclusion on the
efficacy of drugs based on FECRT (Figure 3); and (iii) that it requires more animals and
number of eggs to be counted to correctly classify a truly reduced drug efficacy than a truly
normal drug efficacy (Table 2; Levecke et al., 2012). For example, when 200 eggs are
ACCEPTED MANUSCRIP
T

21
counted across 15 animals a TDE down to 98% (3% point from the 95% threshold) can be
correctly classified as normal with a probability of at least 95% (UI method 1), whereas this
same design allows, with an equal level of confidence, classifying a drug efficacy only up to
87% (8% point difference from the 95% threshold). This different performance in classifying
truly reduced and normal drug efficacy can be explained by the decrease in variance of FECR
as a function of increasing drug efficacy (see formulae for calculating variance of FECR;
Levecke et al., 2015). As a consequence of this, one may not extrapolate the required sample
size and number of eggs to be counted across thresholds, and this is made evident in
Supplementary Table 1. This table reports the required sample size and number of eggs
counted to correctly classify truly reduced drug efficacy based on FECRT when a thresholds
of 95% (LL of UI) and 99% (FECR) are used. Not surprisingly less animals and numbers of
eggs need to be counted to correctly classify a truly reduced efficacy using these thresholds,
in casu counting 150 eggs across 5 animals allows correctly classifying TDEs up to 93% (6%
point difference to 99%) as reduced in 95% of the cases. Also note the difference in required
number of eggs to be counted between UI methods. The methodology described by Levecke
et al., 2015 requires less eggs to be counted when sample size is small compared to the
methodology described by Lyndal-Murphy et al., 2014, but requires more eggs when sample
size increases. Moreover, for the UI method described by Levecke et al. (2015) the number of
eggs to be counted increased with the sample size, but only when the TDE equaled 94%. The
latter observation is the result of the three-way interaction in the model (TDE x sample size x
total number of eggs counted), as omission of this interaction resulted in a decrease in the
total number of eggs to be counted as a function of sample size across all scenarios of TDE.
Because the fully parameterized model resulted in a significant better goodness-of-fit, we
decided not to omit the interaction from the model.
ACCEPTED MANUSCRIP
T

22
This study has some important limitations that need to be acknowledged. First, the
conclusions drawn are applying prediction models on data generated through simulation.
Although the assumptions made for data generation in this simulation have been previously
applied in other simulation studies (Torgerson et al., 2005; Dobson et al., 2009; Lyndal-
Murphy et al. 2014) and have been proven to be valid in some animal and parasite species
(Morgan et al., 2005; Torgerson et al., 2012), they may not fully explain the variation
observed in real data (e.g., day-to-day variation in egg excretion; variation in egg counts of
the same sample across laboratory technicians), and hence the required sample size and
number of eggs counted under the microscope might be biased. Moreover, predictions were
based on models that, not surprisingly, fail to correctly predict all the data, and hence this too
may have an impact on the required sample size and the total number of eggs counted.
Second, we did not consider any continuing larval development, though the impact of this
phenomenon on the interpretation of FECRT have been researched in detail by Lyndal-
Murphy et al., 2014. Third, the conclusions drawn only apply to an experimental design in
which FECR are based on pre- and post-FECs of the same animals. When applying a
randomized controlled design based on post-FEC of treated and control animals, more
animals will need to be included and more eggs will need to be counted to draw conclusions
on the drug efficacy with an equal level of reliability. This is because the term including the
correlation needs to be omitted from the variance equation for both method 1 and 2 (FEC are
not correlated), and hence resulting in an increased variance. For a detailed overview of the
different 95% UI methods across different experimental designs we refer the reader to
Lyndal-Murphy et al., 2014.
In conclusion, optimal interpretation of FECRT data requires the ability to distinguish
genuine reductions in efficacy from changes in efficacy due to sampling variability. In order
to address this issue in a meaningful way, it is necessary to use data simulation and statistical
ACCEPTED MANUSCRIP
T

23
analyses to determine the optimal parameters for performing the FECRT and for analyzing
the resulting data. This study has used such an approach in an attempt to provide insights
complementary to the current knowledge on how to optimally design, analyze and interpret
FECRTs, and to ultimately provide guidance that allows improving both the standardization
and the performance of the FECRT across a variety of both animal and parasite species. Our
results confirm that the current criteria to classify drug efficacy are the most appropriate, but
highlights that the UI methodologies vary considerable in coverage and ability to detect a
truly reduced drug efficacy, and that a combination of UI methodologies is recommended to
assess the uncertainty across all possible FECRT scenarios. Finally, based on model estimates
researchers can now determine the required number of eggs to be counted for each sample
size allowing one to optimize the probability of correctly classifying a theoretical TDE while
minimizing both financial and technical resources.
Acknowledgements
BL is funded by the Fund for Scientific Research-Flanders (Belgium) (F.W.O.-Vlaanderen;
www.fwo.be, grant no 1285316N). SMT was partly funded by the EMIDA-project CARES.
We also want to thank Matthew J. Denwood (Department of Large Animal Sciences, Faculty
of Health and Medical Sciences, University of Copenhagen, Denmark) for applying the
Bayescount methodology on the toy example described in Supplementary Material 2.
ACCEPTED MANUSCRIP
T

24
References
Balmer, N., Torgerson, P., Hertzberg, H., 2015. Strategic control of gastrointestinal
nematodes in grazing sheep with a long-acting moxidectin formulation, Small Ruminant Res.
In press.
Borges, Fde A., Borges, D.G., Heckler, R.P., Neves, J.P., Lopes, F.G., Onizuka, M.K., 2015.
Multispecies resistance of cattle gastrointestinal nematodes to long-acting avermectin
formulations in Mato Grosso do Sul. Vet. Parasitol. 212, 299-302.
Barda B., Cajal P., Villagran E., Cimino R., Juarez M., Krolewiecki A., Rinaldi L., Cringoli
G., Burioni R., Albonico M., 2014. Mini-FLOTAC, Kato-Katz and McMaster: three methods,
one goal; highlights from north Argentina. Parasit Vectors. 7, 271.
Cabaret, J., Berrag, B., 2004. Faecal egg count reduction test for assessing anthelmintic
efficacy: average versus individually based estimations. Vet. Parasitol. 121, 105-113.
Casella, G., Berger, B.L., 2002. Statistical Inference, second ed. Duxbury Press. Pacific
Grove: Duxbury Thomson Learning.
Calvete, C., Uriarte, J., 2012. Improving the detection of anthelmintic resistance: Evaluation
of faecal egg count reduction test procedures suitable for farm routines. Vet. Parasitol. 196,
438–452.
Coles, G.C., Bauer, C., Borgsteede, F.H., Geerts, S., Klei, T.R., Taylor, M.A., Waller, P.J.,
1992. World Association for the Advancement of Veterinary Parasitology (W.A.A.V.P.)
methods for the detection of anthelmintic resistance in nematodes of veterinary importance.
Vet. Parasitol. 44, 35-44.
Cringoli, G., Rinaldi, L., Albonico, M., Bergquist, R., Utzinger, J., 2013. Geospatial (s)tools:
integration of advanced epidemiological sampling and novel diagnostics. Geospat. Health, 7,
399-404.
ACCEPTED MANUSCRIP
T

25
Cringoli, G., Rinaldi, L., Maurelli, MP., Utzinger, J., 2010. FLOTAC: new multivalent
techniques for qualitative and quantitative copromicroscopic diagnosis of parasites in animals
and humans. Nat. Protoc. 5, 503-515.
das Neves, J.H., Carvalho, N., Rinaldi, L., Cringoli, G., Amarante, A.F., 2015. Diagnosis of
anthelmintic resistance in cattle in Brazil: a comparison of different methodologies. Vet.
Parasitol. 206, 216-226.
Denwood, M.J., Reid, S.W.J., Love, S., Nielsen, M.K., Matthews, L., McKendrick, I.J.,
Innocent, G.T., 2010. Comparison of three alternative methods for analysis of equine faecal
egg count reduction test data. Prev. Vet. Med. 93, 316-323.
Dobson, R.J., Hosking, B.C., Jacobson, C.L., Cotter, J.L., Besier, R.B., Stein, P.A., Reid,
S.A., 2012. Preserving new anthelmintics: a simple method for estimating faecal egg count
reduction test (FECRT) confidence limits when efficacy and/or nematode aggregation is high.
Vet. Parasitol. 186, 79-93.
Dobson, R.J., Sangster, N.C., Besier, R.B., Woodgate, R.G., 2009. Geometric means provide
a biased efficacy result when conducting a faecal egg count reduction test (FECRT). Vet
Parasitol 161, 162-167.
El-Abdellati, A., Geldhof, P., Claerebout, E., Vercruysse, J., Charlier, J., 2010. Monitoring
macrocyclic lactone resistance in Cooperia oncophora on a Belgian cattle farm during four
consecutive years. Vet Parasitol 171, 167-171.
Geurden, T., Chartier, C., Fanke, J., di Regalbono, A.F., Traversa, D., von Samson-
Himmelstjerna, G., Demeler, J., Vanimisetti, H.B., Bartram, D.J., Denwood, M.J., 2015.
Anthelmintic resistance to ivermectin and moxidectin in gastrointestinal nematodes of cattle
in Europe. Int. J. Parasitol. Drugs Drug Resist. 5, 163-171.
Hoste, H., Sotiraki, S., de Jes˙s Torres-Acosta, J.F., 2011. Control of Endoparasitic Nematode
Infections in Goats. Veterinary Clinics of North America: Food Animal Practice 27, 163-173.
ACCEPTED MANUSCRIP
T

26
Kaplan, R.M., Vidyashankar, A.N., 2012. An inconvenient truth: Global worming and
anthelmintic resistance. Vet. Parasitol. 186, 70-78.
Kochapakdee, S., Pandey, V.S., Pralomkarm, W., Choldumrongkul, S., Ngampongsai, W.,
Lawpetchara, A., 1995. Anthelmintic resistance in goat in southern Thailand. Vet. Rec. 137,
124–125.
Kotze, A.C., Dobson, R.J., Humphries, D., Wilson, M., Cappello, M., 2014. Application of a
Poisson distribution quality control measure to the analysis of two human hookworm drug
treatment studies in Ghana. Int. J. Parasitol. Drugs Drug Resist. 4, 64-70.
Levecke, B., Anderson, R.M., Berkvens, D., Charlier, J., Devleesschauwer, B., Speybroeck,
N., Vercruysse, J., Van Aelst, S., 2015. Mathematical inference on helminth egg counts in
stool and its applications in mass drug administration programmes to control soil-transmitted
helminthiasis in public health. Adv. Parasitol. 87, 193-247.
Levecke, B., De Wilde, N., Vandenhoute, E., Vercruysse, J., 2009. Field validity and
feasibility of four techniques for the detection of Trichuris in simians: a model for monitoring
drug efficacy in public health? PLoS Negl. Trop. Dis., 3: e366.
Levecke, B., Dobson, R.J., Speybroeck, N., Vercruysse, J., Charlier, J., 2012. Novel insights
in the faecal egg count reduction test for monitoring drug efficacy against gastro-intestinal
nematodes of veterinary importance. Vet. Parasitol. 188, 391-396.
Levecke, B., Rinaldi, L., Charlier, J., Maurelli, M.P., Morgoglione, M.E., Vercruysse, J.,
Cringoli, C., 2011. Monitoring drug efficacy against gastrointestinal nematodes when faecal
egg counts are low: do the analytic sensitivity and the formula matter? Parasitol. Res. 109,
953-957.
Levecke, B., Montresor, A., Albonico, M., Ame, S.M., Behnke, J.M., Bethony, J.M.,
Noumedem, C.D., Engels, D., Guillard, B., Kotze, A., Krolewiecki, A.J., McCarthy, J.S.,
Mekonnen, Z., Periago, M.V., Sopheak, H., Tchuem Tchuenté, L.A., Duong, T.T., Huong,
ACCEPTED MANUSCRIP
T

27
N.T., Zeynudin, A., Vercruysse J., 2014. Anthelminthic efficacy of single-oral dose 500 mg
mebendazole in school children in six countries where soil-transmitted helminths are
endemic: a meta-analysis. PLoS Negl. Trop. Dis. 8: e3204.
Lyndal-Murphy, M., Swain, A.J., Pepper, P.M., 2014. Methods to determine resistance to
anthelmintics when continuing larval development occurs. Vet. Parasitol. 199, 191-200.
Malrait, K., Verschave, S., Skuce, P., Van Loo, H., Vercruysse, J., Charlier J., 2015. Novel
insights into the pathogenic importance, diagnosis and treatment of the rumen fluke
(Calicophoron daubneyi) in cattle. Vet? Parasitol. 207, 134-139.
McKenna, P.B., 2006. Further comparison of faecal egg count reduction test procedures:
Sensitivity and specificity. N.Z. Vet. J. 54, 365–366.
Ministry of Agriculture, Fisheries and Food, 1986 (MAFF). Manual of veterinary
parasitological laboratory techniques (Reference Book 418), 3rd ed., London: Her Majesty's
Stationery Office (HMSO), 160 pp.
Morgan, E.R., Cavill, L., Curry, G.E., Wood, R.M., Mitchell, E.S.E., 2005. Effects of
aggregation and sample size on composite faecal egg counts in sheep. Vet. Parasitol. 131, 79–
87.
Novobilský, A., Höglund J., 2015. First report of closantel treatment failure against Fasciola
hepatica in cattle. Int. J. Parasitol. Drugs Drug Resist. 5, 172-177.
O'Shaughnessy, J., Earley, B., Mee, J.F., Doherty, M.L., Crosson, P., Barrett, D., Prendiville,
R., Macrelli, M., de Waal T., 2014. Detection of anthelmintic resistance on two Irish beef
research farms. Vet. Rec. 175, 120.
Peña-Espinoza M., Thamsborg S.M., Denwood M.J., Drag M., Hansen T.V., Jensen V.F.,
Enemark H.L., 2016. Efficacy of ivermectin against gastrointestinal nematodes of cattle in
Denmark evaluated by different methods for analysis of faecal egg count reduction. Int. J.
Parasitol.: Drugs Drug Resist. 6, 241 – 250.
ACCEPTED MANUSCRIP
T

28
Speich, B., Knopp, S., Mohammed, K.A., Khamis, I.S., Rinaldi, L., Cringoli, G, Rollinson, D,
Utzinger, J., 2010. Comparative cost assessment of the Kato-Katz and FLOTAC techniques
for soil-transmitted helminth diagnosis in epidemiological surveys. Parasit. Vectors 3, 71.
Torgerson, P.R., Paul, M., Furrer, R., 2014. Evaluating faecal egg count reduction using a
specifically designed package “eggCounts” in R and a user friendly web interface. Int. J.
Parasitol. 44, 299-303.
Torgerson, P.R., Paul, M., Lewis, F.I., 2012. The contribution of simple random sampling to
observed variations in faecal egg counts. Vet. Parasitol. 188, 397-401.
Torgerson, P.R., Schnyder, M., Hertzberg, H., 2005. Detection of anthelmintic resistance: a
comparison of mathematical techniques. Vet. Parasitol. 128, 291-298.
Vercruysse, J., Behnke, J.M., Albonico, M., Ame, S.M., Angebault, C., Bethony, J.M.,
Engels, D., Guillard, B., Hoa, N.T.V., Kang, G., Kattula, D., Kotze, A.C., McCarthy, J.S.,
Mekonnen, Z., Montresor, A., Periago, M.V., Sumo, L., Tchuem Tchuenté, L.-A., Thach,
D.T.C., Zeynudin, A., Levecke B., 2011. A multinational trial of the efficacy of albendazole
against soil-transmitted helminth infections in children. PloS Negl. Trop. Dis. 5: e948.
Vercruysse, J. Holdsworth, P., Letonja, T., Barth, D., Conder, G., Hamamoto, K., Okano, K.,
2001. International harmonisation of anthelmintic efficacy guidelines. Vet. Parasitol. 96, 171-
193.
Van den Putte N., Claerebout E., Levecke B., 2016. Evaluation of the mini-FLOTAC
technique for the detection of gastro-intestinal parasites in large companion animals. Vlaams
Diergen. tijds. 85: 15-22.
Vargas-Duarte, J.J., Lozano-Márquez, H., Grajales-Lombana, H.A., Manrique-Perdomo, C.,
Martínez-Bello, D.A., Saegerman, C., Raes, M., Kirschvink, N., 2015. Effect of moxidectin
treatment at peripartum on gastrointestinal parasite infections in ewes raised under tropical
Andes high altitude conditions. Vet. Med. Int. 2015, 932080.
ACCEPTED MANUSCRIP
T

29
Vidyashankar, A.N., Hanlon, B.M., Kaplan, R.M., 2012. Statistical and biological
considerations in evaluating drug efficacy in equine strongyle parasites using fecal egg count
data. Vet. Parasitol. 185, 45-56.
Vidyashankar, A.N., Kaplan, R.M., Chan, S., 2007. Statistical approach to measure the
efficacy of anthelmintic treatment on horse farms. Parasitology 134, 2027-2039.
Wang, C., Torgerson, P. R., Höglund, J, Furrer, R., 2017. Zero-inflated hierarchical models
for faecal egg counts to assess anthelmintic effcacy. Vet. Parasitol. (in press).
World Health Organization (2013). Assessing the efficacy of anthelminthic drugs against
schistosomiasis and soil-transmitted helminthiasis. World Health Organization, Geneva,
Switzerland.
ACCEPTED MANUSCRIP
T

30
Figure captions
Figure 1. The cumulative probability of classifying drug efficacy as ‘normal’ (black),
‘suspected’ (grey) and ‘reduced’ (white) based on the classification criteria described by
Coles et al. (1992), El-Abdellati et al. (2010), Lyndal-Murphy et al. (2014) / Geurden et al.
(2015) and WHO (2013).
ACCEPTED MANUSCRIP
T

31
Figure 2. The coverage of two different methodologies to calculate 95% uncertainty intervals
(straight line: Levecke et al., 2015; dashed line: Lyndal-Murphy et al. (2014)) over different
values of true drug efficacy. The left plot represents the coverage across all cases, whereas the
ACCEPTED MANUSCRIP
T

32
right plot represents the coverage for cases for which the corresponding fecal egg count
reduction was not 100%.
Figure 3. The cumulative probability of classifying drug efficacy as ‘normal’ (black),
‘suspected’ (grey) and ‘reduced’ (white) based on the classification criteria described by
Coles et al. (1992; first column of graphs), El-Abdellati et al. (2010; second column of
graphs) and Lyndal-Murphy et al. (2014) / Geurden et al. (2015; third column of graphs)
applying two different 95% uncertainty intervals methodologies (top graphs: Levecke et al.,
2015; bottom graphs: Lyndal-Murphy et al. (2014)).
ACCEPTED MANUSCRIP
T

33
Table 1. The sensitivity and specificity of detecting a truly reduced efficacy (true drug
efficacy <95%) for four classification criteria for drug efficacy.
Sensitivity
N = 3,000,000
Specificity
N = 600,000
n % n %
Criteria 1 2,697,531 90.0 487,001 81.2
Criteria 2 2,410,086 80.3 325,146 54.2
Criteria 3 2,312,238 77.1 487,001 81.2
Criteria 4 2,327,736 77.6 510,165 85.0
Criteria 1 classifies a drug efficacy as ‘reduced’ when FECR <95% and lower limit (LL) of
the 95% uncertainty interval (95%UI) <90%, as ‘suspected’ when either FECR <95% or LL
<90%, and as ‘normal’ when FECR ≥95% and LL ≥90%. The criteria 2 classifies a drug
efficacy as ‘reduced’ when the UL of the 95%UI is <95%, as ‘suspected’ when FECR <95%,
but 95% is included in the UI or when FECR ≥95%, but when the LL <95%, and as ‘normal’
when the LL ≥95%. Criteria 3 classifies drugs as ‘normal’ when FECR ≥95%, UL UI ≥95%
and lower UI ≥90%, as ‘reduced’ when FECR <95%, UL UI <95% and lower UI <90%, and
as ‘suspected’ in all other cases. Criteria 4 classifies drug efficacy solely based on the
observed FECR result, drug efficacy being ‘reduced’ when the FECR <90%, ‘suspected’
when FECR ≥90% but <95%, and ‘normal’ FECR ≥95.
ACCEPTED MANUSCRIP
T
34
Table 2. The required sample size and total number of eggs to be counted under the
microscope to correctly classify a truly reduced (true drug efficacy <95%) and normal drug
efficacy (true drug efficacy ≥95%) with a probability of at least 95% for two different
methodologies of calculating 95% uncertainty intervals (UIs; method 1; method 2).
Sample size True drug efficacy (%)
87 88 89 97 98 99
UI method 1
5 255 425 670 399 218 127
10 234 381 633 397 208 113
15 206 331 589 394 196 97
20 170 274 537 391 183 79
25 121 207 474 387 168 58
UI method 2
5 300 425 670 >750 563 375
10 255 381 633 644 399 275
15 205 331 589 497 316 224
20 149 274 537 409 266 194
25 84 207 474 350 233 174
ACCEPTED MANUSCRIP
T

35
Supplementary Material 1. Given the use of a fecal egg count (FEC) with the same analytic
sensitivity (≈ 1 / mass of feces in grams examined) on all samples before and after treatment,
one can deduce that the fecal egg count reduction (FECR) formula based on the pre- and post-
treatment FECs of the same animals (Kochapakdee, 1995) is equivalent to the ratio of the
total number of eggs counted under the microscope at pre- and post-treatment.
FECR = 1-arithmetic mean FEC post-treatment( )arithmetic mean FEC pre-treatment( )
=1-
FEC post-treatmenti=1
N
å
N
FEC pre-treatmenti=1
N
å
N
=1-
FEC post-treatmenti=1
N
å
FEC pre-treatmenti=1
N
å
1-
microscopic egg count post-treatment / mass of feces in grams examinedi=1
N
å
microscopic egg count pre-treatment / mass of feces in grams examinedi=1
N
å
1-mass of feces in grams examined
mass of feces in grams examined x
microscopic egg count post-treatmenti=1
N
å
microscopic egg count pre-treatmenti=1
N
å
1-
microscopic egg count post-treatmenti=1
N
å
microscopic egg count pre-treatmenti=1
N
å
ACCEPTED MANUSCRIP
T