Embed Size (px)
Citation preview
hpdiagnostics guide
hp
(software release )
procurve
procurve routing switches 9304m, 9308m, and 9315m
07.6.04 or greater
www.hp.com/go/hpprocurve


Diagnostics Guide
for the HP ProCurve Routing Switches
9304M, 9308M, and 9315M
(Software Release 07.6.04 or Greater)
Copyright 2000, 2003 Hewlett-Packard Company, LP. The information contained herein is subject to change without notice.
Publication number
5990-6032
September 2003
Applicable Products
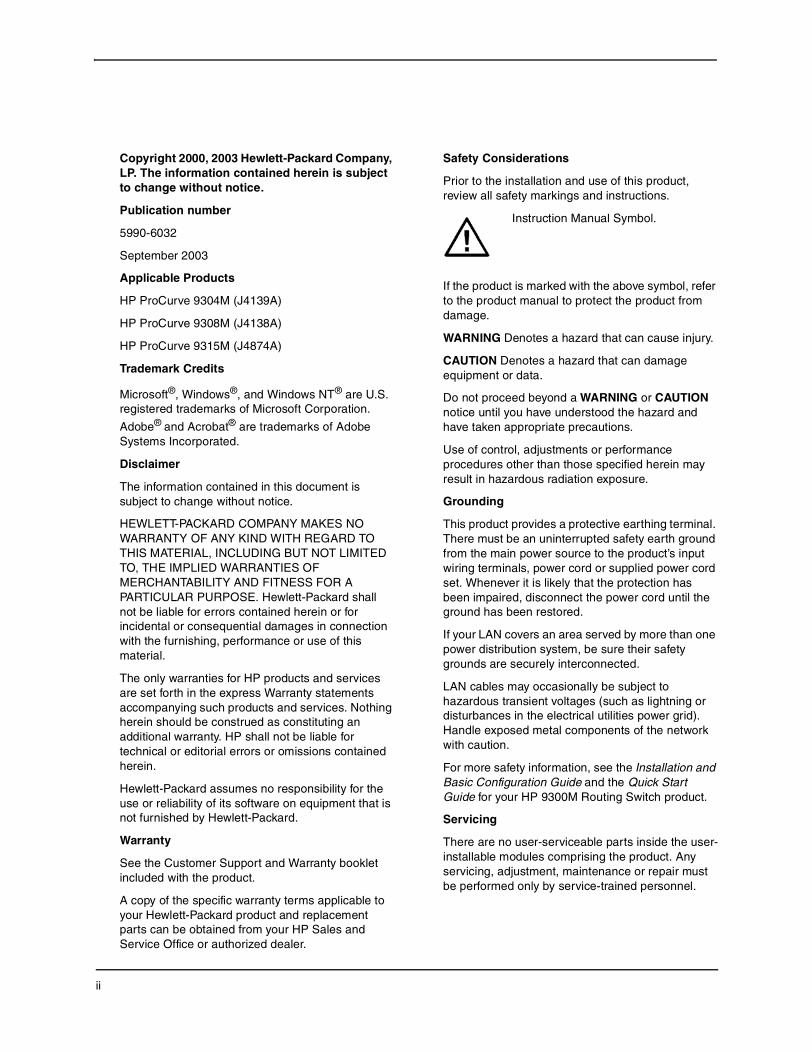
HP ProCurve 9304M (J4139A)
HP ProCurve 9308M (J4138A)
HP ProCurve 9315M (J4874A)
Trademark Credits
Microsoft®, Windows®, and Windows NT® are U.S. registered trademarks of Microsoft Corporation.
Adobe® and Acrobat® are trademarks of Adobe Systems Incorporated.
Disclaimer
The information contained in this document is subject to change without notice.
HEWLETT-PACKARD COMPANY MAKES NO WARRANTY OF ANY KIND WITH REGARD TO THIS MATERIAL, INCLUDING BUT NOT LIMITED TO, THE IMPLIED WARRANTIES OF MERCHANTABILITY AND FITNESS FOR A PARTICULAR PURPOSE. Hewlett-Packard shall not be liable for errors contained herein or for incidental or consequential damages in connection with the furnishing, performance or use of this material.
The only warranties for HP products and services are set forth in the express Warranty statements accompanying such products and services. Nothing herein should be construed as constituting an additional warranty. HP shall not be liable for technical or editorial errors or omissions contained herein.
Hewlett-Packard assumes no responsibility for the use or reliability of its software on equipment that is not furnished by Hewlett-Packard.
Warranty
See the Customer Support and Warranty booklet included with the product.
A copy of the specific warranty terms applicable to your Hewlett-Packard product and replacement parts can be obtained from your HP Sales and Service Office or authorized dealer.
Safety Considerations
Prior to the installation and use of this product, review all safety markings and instructions.
Instruction Manual Symbol.
If the product is marked with the above symbol, refer to the product manual to protect the product from damage.
WARNING Denotes a hazard that can cause injury.
CAUTION Denotes a hazard that can damage equipment or data.
Do not proceed beyond a WARNING or CAUTION notice until you have understood the hazard and have taken appropriate precautions.
Use of control, adjustments or performance procedures other than those specified herein may result in hazardous radiation exposure.
Grounding
This product provides a protective earthing terminal. There must be an uninterrupted safety earth ground from the main power source to the product’s input wiring terminals, power cord or supplied power cord set. Whenever it is likely that the protection has been impaired, disconnect the power cord until the ground has been restored.
If your LAN covers an area served by more than one power distribution system, be sure their safety grounds are securely interconnected.
LAN cables may occasionally be subject to hazardous transient voltages (such as lightning or disturbances in the electrical utilities power grid). Handle exposed metal components of the network with caution.
For more safety information, see the Installation and Basic Configuration Guide and the Quick Start Guide for your HP 9300M Routing Switch product.
Servicing
There are no user-serviceable parts inside the userinstallable modules comprising the product. Any servicing, adjustment, maintenance or repair must be performed only by service-trained personnel.
ii
Contents
ORGANIZATION OF PRODUCT DOCUMENTATION ............................................ vii
CHAPTER 1GETTING STARTED...................................................................................... 1-1INTRODUCTION ...........................................................................................................................................1-1AUDIENCE ..................................................................................................................................................1-1CONVENTIONS ............................................................................................................................................1-1TERMINOLOGY ............................................................................................................................................1-2WHAT’S NEW IN THIS EDITION? ...................................................................................................................1-2
STANDARD MODULE AND EP MODULE SUPPORT ...................................................................................1-2NEW HARDWARE ..................................................................................................................................1-2LAYER 3 ENHANCEMENTS .....................................................................................................................1-3LAYER 2 ENHANCEMENTS .....................................................................................................................1-3SYSTEM-LEVEL ENHANCEMENTS ...........................................................................................................1-4
SUPPORT AND WARRANTY INFORMATION .....................................................................................................1-5RELATED PUBLICATIONS .............................................................................................................................1-5
CHAPTER 2USING DIAGNOSTIC COMMANDS .................................................................. 2-1USING AN ACL TO FILTER DEBUG OUTPUT .................................................................................................2-2
CHAPTER 3HP DIAGNOSTIC COMMAND REFERENCE ..................................................... 3-1ABOUT THE DIAGNOSTIC COMMANDS ..........................................................................................................3-1
DIAGNOSTIC COMMANDS .....................................................................................................................3-1DIAGNOSTIC COMMANDS – SYNTAX DESCRIPTIONS .....................................................................................3-5
de ....................................................................................................................................................... 3-5debug all............................................................................................................................................. 3-5debug appletalk.................................................................................................................................. 3-6debug destination............................................................................................................................... 3-6
iii
Diagnostics Guide
debug gvrp packets............................................................................................................................ 3-6debug ip arp ....................................................................................................................................... 3-7debug ip bgp <address> updates....................................................................................................... 3-8debug ip bgp dampening.................................................................................................................... 3-8debug ip bgp events........................................................................................................................... 3-8debug ip bgp in................................................................................................................................... 3-9debug ip bgp keepalives .................................................................................................................... 3-9debug ip bgp out ................................................................................................................................ 3-9debug ip bgp updates....................................................................................................................... 3-10debug ip dvmrp detail....................................................................................................................... 3-10debug ip dvmrp in............................................................................................................................. 3-10debug ip dvmrp out .......................................................................................................................... 3-11debug ip dvmrp pruning ................................................................................................................... 3-11debug ip icmp events ....................................................................................................................... 3-11debug ip icmp packets ..................................................................................................................... 3-12debug ip igmp................................................................................................................................... 3-12debug ip msdp alarms...................................................................................................................... 3-12debug ip msdp events ...................................................................................................................... 3-13debug ip msdp message .................................................................................................................. 3-13debug ip nat icmp............................................................................................................................. 3-13debug ip nat udp .............................................................................................................................. 3-14debug ip nat tcp................................................................................................................................ 3-14debug ip nat transdata ..................................................................................................................... 3-15debug ip ospf adj.............................................................................................................................. 3-15debug ip ospf events ........................................................................................................................ 3-15debug ip ospf flood........................................................................................................................... 3-16debug ip ospf lsa-generation............................................................................................................ 3-16debug ip ospf packet ........................................................................................................................ 3-16debug ip ospf retransmission ........................................................................................................... 3-17debug ip ospf spf.............................................................................................................................. 3-17debug ip pim <address>................................................................................................................... 3-18debug ip pim events ......................................................................................................................... 3-18debug ip rip ...................................................................................................................................... 3-19debug ip rip database....................................................................................................................... 3-19debug ip rip events........................................................................................................................... 3-20debug ip rip trigger ........................................................................................................................... 3-21debug ip ssh..................................................................................................................................... 3-21debug ip tcp <address>.................................................................................................................... 3-22debug ip tcp driver............................................................................................................................ 3-22debug ip tcp memory........................................................................................................................ 3-23debug ip tcp packet .......................................................................................................................... 3-23debug ip tcp sack ............................................................................................................................. 3-24debug ip tcp transactions ................................................................................................................. 3-24debug ip udp .................................................................................................................................... 3-24debug ip vrrp events......................................................................................................................... 3-25debug ip vrrp packet......................................................................................................................... 3-25debug spanning................................................................................................................................ 3-26mm ................................................................................................................................................... 3-27phy ................................................................................................................................................... 3-28ptrace aaa ........................................................................................................................................ 3-29ptrace appletalk aarp........................................................................................................................ 3-29ptrace appletalk aep......................................................................................................................... 3-30ptrace appletalk nbp......................................................................................................................... 3-30ptrace appletalk none....................................................................................................................... 3-30
iv
Contents
ptrace appletalk rtmp........................................................................................................................ 3-30ptrace appletalk states ..................................................................................................................... 3-30ptrace appletalk zip .......................................................................................................................... 3-31ptrace arp ......................................................................................................................................... 3-31ptrace bootp ..................................................................................................................................... 3-31ptrace dvmrp graft ............................................................................................................................ 3-31ptrace dvmrp graft-ack ..................................................................................................................... 3-31ptrace dvmrp mcache....................................................................................................................... 3-32ptrace dvmrp message..................................................................................................................... 3-32ptrace dvmrp none ........................................................................................................................... 3-32ptrace dvmrp probe .......................................................................................................................... 3-32ptrace dvmrp prune .......................................................................................................................... 3-32ptrace dvmrp route-table .................................................................................................................. 3-32ptrace icmp....................................................................................................................................... 3-33ptrace igmp ...................................................................................................................................... 3-33ptrace ip ........................................................................................................................................... 3-33ptrace none ...................................................................................................................................... 3-33ptrace ospf ....................................................................................................................................... 3-33ptrace pim fcache............................................................................................................................. 3-34ptrace pim mcache........................................................................................................................... 3-34ptrace pim message......................................................................................................................... 3-34ptrace pim none ............................................................................................................................... 3-34ptrace ppp ........................................................................................................................................ 3-34ptrace rarp........................................................................................................................................ 3-34ptrace rip .......................................................................................................................................... 3-35ptrace snmp ..................................................................................................................................... 3-35ptrace switch none ........................................................................................................................... 3-35ptrace switch stp .............................................................................................................................. 3-35ptrace tcp ......................................................................................................................................... 3-35ptrace telnet ..................................................................................................................................... 3-36ptrace term ....................................................................................................................................... 3-36ptrace tftp ......................................................................................................................................... 3-36ptrace udp ........................................................................................................................................ 3-36show ip bgp debug ........................................................................................................................... 3-36show debug...................................................................................................................................... 3-38
CHAPTER 4USING THE BACKPLANE DEBUGGING COMMANDS ........................................ 4-1
CHAPTER 5CHANGING CAM PARTITIONS...................................................................... 5-1CAM OVERVIEW .........................................................................................................................................5-1
CAM PARTITIONING ON STANDARD MODULES .......................................................................................5-2CAM PARTITIONING ON ENHANCED PERFORMANCE MODULES ...............................................................5-2CAM PARTITIONING ON 10 GIGABIT ETHERNET MODULES .....................................................................5-2
USING THE CLI TO CONFIGURE CAM PARTITIONING ....................................................................................5-2DISPLAYING CAM PARTITIONING INFORMATION ............................................................................................5-4
v

Diagnostics Guide
vi
Organization of Product Documentation
NOTE: HP periodically updates the HP ProCurve 9300 Routing Switch documentation. For the latest version of any of these publications, visit the HP ProCurve website at:
http://www.hp.com/go/hpprocurve
Click on technical support, then manuals.
Read Me First The “Read Me First” document includes an overview of software release information, a brief “Getting Started” section, an accessory parts list, troubleshooting tips, operating notes, and other information that is not included elsewhere in the product documentation.
Main Product Coverage The main product documentation for your Routing Switch includes:
• HP ProCurve Quick Start Guide – a printed guide you can use as an easy reference to the installation and product safety information needed for out-of-box setup, plus the general product safety and EMC regulatory statements of which you should be aware when installing and using a Routing Switch. This guide is on the Documentation CD shipped with your HP product and the latest version is also available on the HP ProCurve web site.
• HP ProCurve Installation and Basic Configuration Guide – an electronic (PDF) guide containing product safety and EMC regulatory statements as well as installation and basic configuration information, and software and hardware specifications. This guide is on the Documentation CD shipped with your HP product and the latest version is also available on the HP ProCurve web site.
• Removing and Installing XENPAK Optics – A printed instruction sheet describing the correct preparation and procedure for removing and installing XENPAK optics on the J8174A 2-port 10 Gigabit Ethernet module. This sheet is shipped with the HP Procurve 9300M Management modules and is also available on both the Documentation CD shipped with your HP product and on the HP ProCurve web site.
• HP ProCurve Advanced Configuration and Management Guide – contains advanced configuration information for routing protocols and Quality of Service (QoS). In addition, appendixes in this guide contain reference information for network monitoring, policies, and filters. This manual is included in a PDF (Portable Document Format) file on the Documentation CD shipped with your HP product and the latest version is also available on the HP ProCurve website.
• HP ProCurve Command Line Interface Reference – provides a dictionary of CLI commands and syntax. An electronic copy of this reference is included as a PDF (Portable Document Format) file on the Documentation CD shipped with your HP product and the latest version is also available on the HP ProCurve website.
• HP ProCurve Security Guide – provides procedures for securing management access to HP devices and for
vii
Diagnostics Guide
protecting against Denial of Service (DoS) attacks. An electronic copy of this guide is included as a PDF (Portable Document Format) file on the Documentation CD shipped with your HP product and the latest version is also available on the HP ProCurve website.
• HP ProCurve Diagnostics Guide – describes the diagnostic commands available on HP devices. The software procedures show how to perform tasks using the Command Line Interface (CLI). An electronic copy of this guide is on the Documentation CD shipped with your HP product and the latest version is also available on the HP ProCurve website.
Product Documentation CD: A Tool for Finding Specific Information and/or Printing Selected Pages This Documentation CD is shipped with your HP Routing Switches and provides the following:
• A README file describing the CD contents and use, including easy instructions on how to search the book files for specific information
• A cont ent s file to give you easy access to the documentation on the CD
• Separate PDF files of the individual chapters and appendixes in the major guides, enabling you to easily print individual chapters, appendixes, and selected pages
• Single PDF files for each of the major guides, enabling you to use the Adobe® Acrobat® Reader to easily search for detailed information
• Additional files. These may include such items as additional Readme files and release notes.
Release Notes These documents describe features that become available between revisions of the main product guides. New releases of such documents will be available on HP's ProCurve website. To register to receive email notice from HP when a new software release is available, go to:
ht t p ://w ww . hp. com/go/ h ppr ocur v e
Click on so f t w a r e . Then click on subsc r i b er ’s c hoi c e web pa g e .
viii
Chapter 1 Getting Started
Introduction This guide describes diagnostics command for the following:
• HP ProCurve Routing Switch 9315M
• HP ProCurve Routing Switch 9308M
• HP ProCurve Routing Switch 9304M
Audience
This manual is designed for system administrators with a working knowledge of Layer 2 and Layer 3 switching and routing.
If you are using an HP ProCurve Routing Switch, you should be familiar with the following protocols if applicable to your network—IP, RIP, OSPF, BGP4, IGMP, PIM, DVMRP, IPX, AppleTalk, and VRRP.
Conventions This guide uses the following typographical conventions:
Italic highlights the title of another publication and occasionally emphasizes a word or phrase.
Bold highlights a CLI command.
Bold Italic highlights a term that is being defined.
Underline highlights a link on the Web management interface.
Capitals highlights field names and buttons that appear in the Web management interface.
NOTE: A note emphasizes an important fact or calls your attention to a dependency.
WARNING: A warning calls your attention to a possible hazard that can cause injury or death.
CAUTION: A caution calls your attention to either a possible hazard that can damage equipment or an action that can produce an operating problem or other unwanted results.
1 - 1
Diagnostics Guide
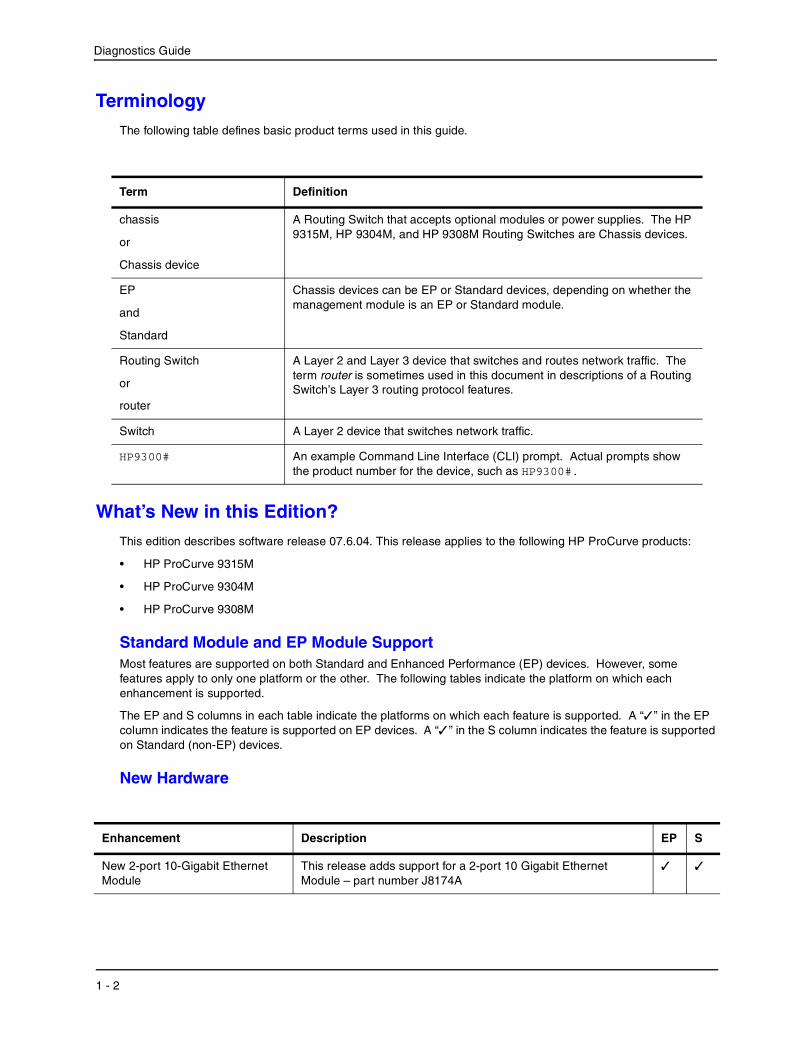
Terminology The following table defines basic product terms used in this guide.
Term
chassis
or
Chassis device
EP
and
Standard
Routing Switch
or
router
Switch
HP9300#
Definition
A Routing Switch that accepts optional modules or power supplies. The HP 9315M, HP 9304M, and HP 9308M Routing Switches are Chassis devices.
Chassis devices can be EP or Standard devices, depending on whether the management module is an EP or Standard module.
A Layer 2 and Layer 3 device that switches and routes network traffic. The term router is sometimes used in this document in descriptions of a Routing Switch’s Layer 3 routing protocol features.
A Layer 2 device that switches network traffic.
An example Command Line Interface (CLI) prompt. Actual prompts show the product number for the device, such as HP9300#.
What’s New in this Edition? This edition describes software release 07.6.04. This release applies to the following HP ProCurve products:
• HP ProCurve 9315M
• HP ProCurve 9304M
• HP ProCurve 9308M
Standard Module and EP Module Support Most features are supported on both Standard and Enhanced Performance (EP) devices. However, some features apply to only one platform or the other. The following tables indicate the platform on which each enhancement is supported.
The EP and S columns in each table indicate the platforms on which each feature is supported. A “✓” in the EP column indicates the feature is supported on EP devices. A “✓ ” in the S column indicates the feature is supported on Standard (non-EP) devices.
New Hardware
Enhancement Description EP S
New 2-port 10-Gigabit Ethernet Module
This release adds support for a 2-port 10 Gigabit Ethernet Module – part number J8174A
✓ ✓
1 - 2
Getting Started
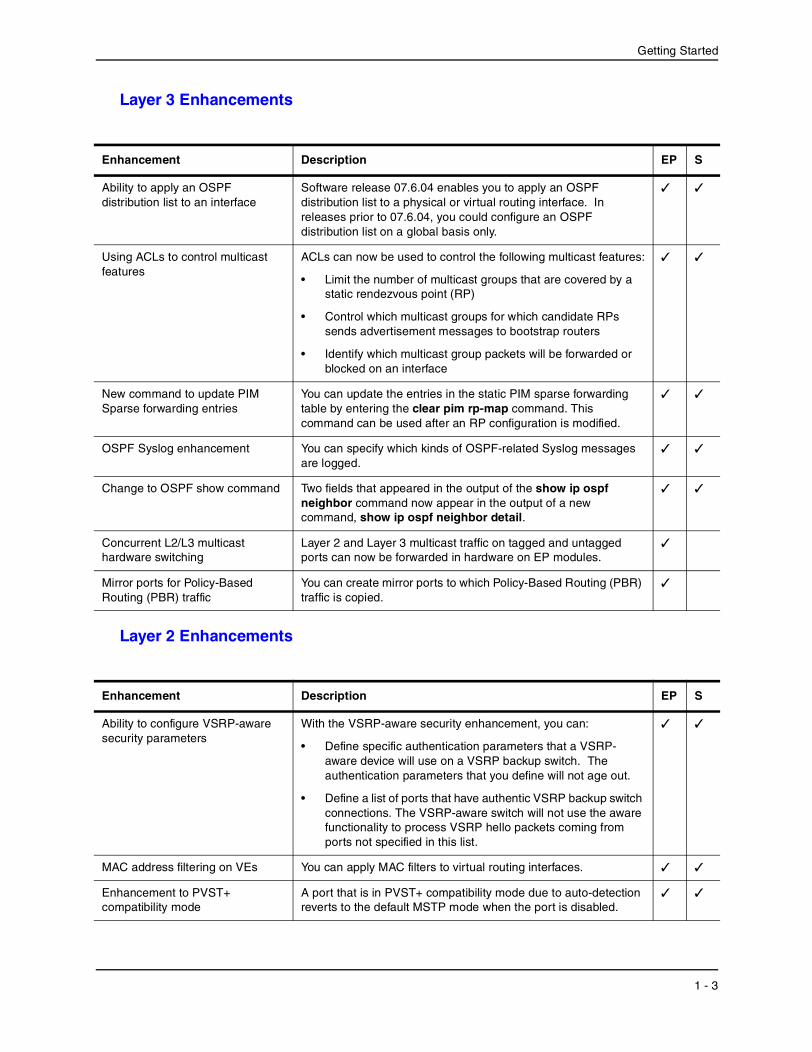
Layer 3 Enhancements
Enhancement Description EP S
Ability to apply an OSPF distribution list to an interface
Software release 07.6.04 enables you to apply an OSPF distribution list to a physical or virtual routing interface. In releases prior to 07.6.04, you could configure an OSPF distribution list on a global basis only.
✓ ✓
Using ACLs to control multicast features
ACLs can now be used to control the following multicast features:
• Limit the number of multicast groups that are covered by a static rendezvous point (RP)
• Control which multicast groups for which candidate RPs sends advertisement messages to bootstrap routers
• Identify which multicast group packets will be forwarded or blocked on an interface
✓ ✓
New command to update PIM Sparse forwarding entries
You can update the entries in the static PIM sparse forwarding table by entering the clear pim rp-map command. This command can be used after an RP configuration is modified.
✓ ✓
OSPF Syslog enhancement You can specify which kinds of OSPF-related Syslog messages are logged.
✓ ✓
Change to OSPF show command Two fields that appeared in the output of the show ip ospf neighbor command now appear in the output of a new command, show ip ospf neighbor detail.
✓ ✓
Concurrent L2/L3 multicast hardware switching
Layer 2 and Layer 3 multicast traffic on tagged and untagged ports can now be forwarded in hardware on EP modules.
✓
Mirror ports for Policy-Based Routing (PBR) traffic
You can create mirror ports to which Policy-Based Routing (PBR) traffic is copied.
✓
Layer 2 Enhancements
Enhancement Description EP S
Ability to configure VSRP-aware security parameters
With the VSRP-aware security enhancement, you can:
• Define specific authentication parameters that a VSRP-aware device will use on a VSRP backup switch. The authentication parameters that you define will not age out.
• Define a list of ports that have authentic VSRP backup switch connections. The VSRP-aware switch will not use the aware functionality to process VSRP hello packets coming from ports not specified in this list.
✓ ✓
MAC address filtering on VEs You can apply MAC filters to virtual routing interfaces. ✓ ✓
Enhancement to PVST+ compatibility mode
A port that is in PVST+ compatibility mode due to auto-detection reverts to the default MSTP mode when the port is disabled.
✓ ✓
1 - 3
Diagnostics Guide
Enhancement Description EP S
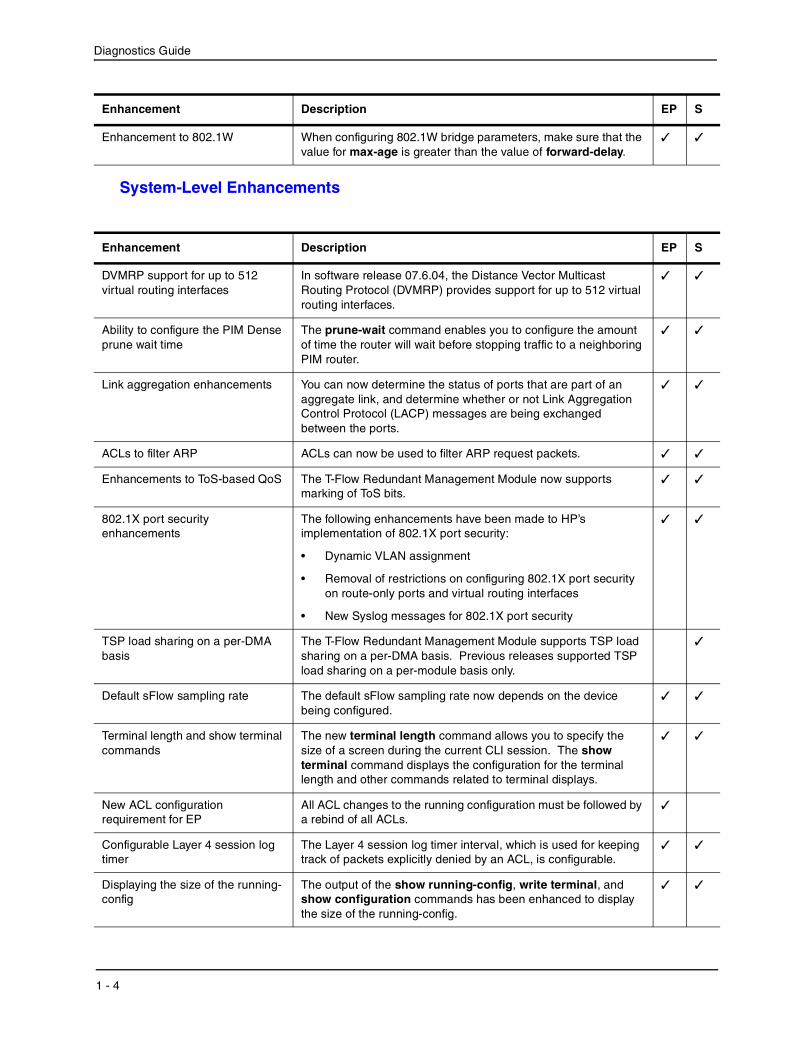
Enhancement to 802.1W When configuring 802.1W bridge parameters, make sure that the value for max-age is greater than the value of forward-delay.
✓ ✓
System-Level Enhancements
Enhancement Description EP S
DVMRP support for up to 512 virtual routing interfaces
In software release 07.6.04, the Distance Vector Multicast Routing Protocol (DVMRP) provides support for up to 512 virtual routing interfaces.
✓ ✓
Ability to configure the PIM Dense prune wait time
The prune-wait command enables you to configure the amount of time the router will wait before stopping traffic to a neighboring PIM router.
✓ ✓
Link aggregation enhancements You can now determine the status of ports that are part of an aggregate link, and determine whether or not Link Aggregation Control Protocol (LACP) messages are being exchanged between the ports.
✓ ✓
ACLs to filter ARP ACLs can now be used to filter ARP request packets. ✓ ✓
Enhancements to ToS-based QoS The T-Flow Redundant Management Module now supports marking of ToS bits.
✓ ✓
802.1X port security enhancements
The following enhancements have been made to HP’s implementation of 802.1X port security:
• Dynamic VLAN assignment
• Removal of restrictions on configuring 802.1X port security on route-only ports and virtual routing interfaces
• New Syslog messages for 802.1X port security
✓ ✓
TSP load sharing on a per-DMA basis
The T-Flow Redundant Management Module supports TSP load sharing on a per-DMA basis. Previous releases supported TSP load sharing on a per-module basis only.
✓
Default sFlow sampling rate The default sFlow sampling rate now depends on the device being configured.
✓ ✓
Terminal length and show terminal commands
The new terminal length command allows you to specify the size of a screen during the current CLI session. The show terminal command displays the configuration for the terminal length and other commands related to terminal displays.
✓ ✓
New ACL configuration requirement for EP
All ACL changes to the running configuration must be followed by a rebind of all ACLs.
✓
Configurable Layer 4 session log timer
The Layer 4 session log timer interval, which is used for keeping track of packets explicitly denied by an ACL, is configurable.
✓ ✓
Displaying the size of the runningconfig
The output of the show running-config, write terminal, and show configuration commands has been enhanced to display the size of the running-config.
✓ ✓
1 - 4
Getting Started
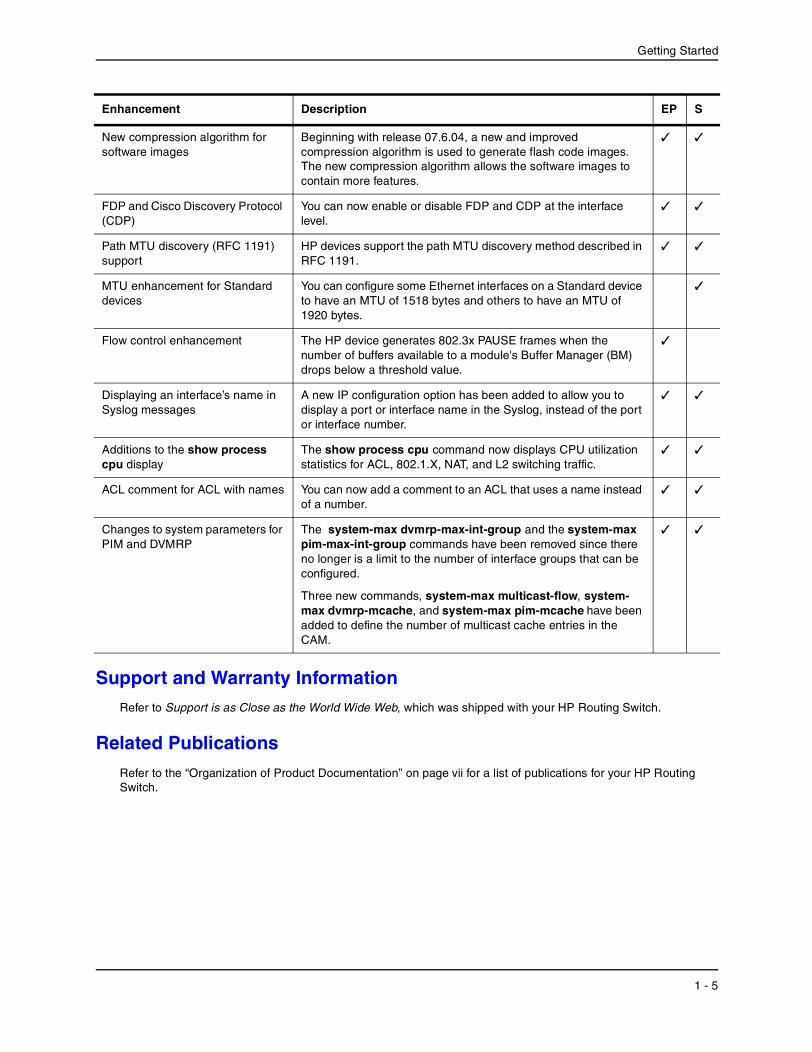
Enhancement Description EP S
New compression algorithm for software images
Beginning with release 07.6.04, a new and improved compression algorithm is used to generate flash code images. The new compression algorithm allows the software images to contain more features.
✓ ✓
FDP and Cisco Discovery Protocol (CDP)
You can now enable or disable FDP and CDP at the interface level.
✓ ✓
Path MTU discovery (RFC 1191) support
HP devices support the path MTU discovery method described in RFC 1191.
✓ ✓
MTU enhancement for Standard devices
You can configure some Ethernet interfaces on a Standard device to have an MTU of 1518 bytes and others to have an MTU of 1920 bytes.
✓
Flow control enhancement The HP device generates 802.3x PAUSE frames when the number of buffers available to a module's Buffer Manager (BM) drops below a threshold value.
✓
Displaying an interface’s name in Syslog messages
A new IP configuration option has been added to allow you to display a port or interface name in the Syslog, instead of the port or interface number.
✓ ✓
Additions to the show process cpu display
The show process cpu command now displays CPU utilization statistics for ACL, 802.1.X, NAT, and L2 switching traffic.
✓ ✓
ACL comment for ACL with names You can now add a comment to an ACL that uses a name instead of a number.
✓ ✓
Changes to system parameters for PIM and DVMRP
The system-max dvmrp-max-int-group and the system-max pim-max-int-group commands have been removed since there no longer is a limit to the number of interface groups that can be configured.
Three new commands, system-max multicast-flow, system-max dvmrp-mcache, and system-max pim-mcache have been added to define the number of multicast cache entries in the CAM.
✓ ✓
Support and Warranty Information Refer to Support is as Close as the World Wide Web, which was shipped with your HP Routing Switch.
Related Publications
Refer to the “Organization of Product Documentation” on page vii for a list of publications for your HP Routing Switch.
1 - 5

Diagnostics Guide
1 - 6
Chapter 2 Using Diagnostic Commands
The HP diagnostic commands are tools that you can use to gather information about HP devices. The diagnostic commands start with de, debug, mm, phy, and ptrace.
de Displays information about CPU buffer allocations.
debug Reports debugging information that you can use to resolve configuration problems.
mm Displays the contents of a specified address on every module. (Available on Chassis devices only)
phy Displays information about PHY (hardware) registers for a specified port.
ptrace Displays information on the console when a specified kind of packet is transmitted or received.
In addition, the show ip bgp debug command reports information about resource allocation and errors in a BGP configuration.
These commands are available in Privileged EXEC mode on the Command Line Interface (CLI) only. You cannot use them in the device’s Web management interface. For complete syntax information for the diagnostic commands, see the next chapter, “HP Diagnostic Command Reference” on page 3-1.
Many of the diagnostic commands are meant to be used in conjunction with calls to HP technical support. If you report a problem, the support engineer may ask you to execute one or more of the diagnostic commands described in this guide. Some of the diagnostic commands report information about internal hardware settings and registers that is relevant primarily to HP engineering staff. Consequently, this information is not described in detail here.
The following table lists some of the tasks you can perform using the diagnostic commands:
Task
Tracing packets ptrace *
Displaying AppleTalk information debug appletalk
ptrace appletalk *
Displaying BGP information
Displaying OSPF packet information
Displaying VRRP packet information
Relevant Commands
debug ip bgp *
show ip bgp debug
debug ip ospf packet
debug ip vrrp packet
2 - 1
Diagnostics Guide
Task
Displaying BPDU packet information
Recovering a frozen console
Displaying CPU buffer information
Reading hardware registers
Relevant Commands
debug spanning
dm uart
de
debug serial state
phy
Using an ACL to Filter Debug Output You can use an ACL to filter output from debug commands. For example, you can set up an ACL that permits packets from an IP address, then apply that ACL to a debug command. When you start the debug command, only messages related to that IP address are displayed in the output for that command.
The following example limits output from the debug ip tcp packet command to only messages related to incoming packets from 10.10.10.10.
First, set up an ACL to permit packets from host 10.10.10.10. For example:
HP9300(config)# access-list 100 permit ip host 10.10.10.10 any
Then apply this ACL to the debug ip tcp command. You can specify no more than one ACL per protocol.
HP9300# debug ip tcp acl 100
Syntax: debug ip <protocol> acl <acl-id>
Then enter the debug ip tcp packet command to start generating debug output.
HP9300# debug ip tcp packet
Syntax: [no] debug ip tcp packet
Only messages related to packets inbound from 10.10.10.10 are displayed in the output for the debug ip tcp packet command. To display messages related to outbound packets sent to 10.10.10.10, add another entry to the ACL, specifying 10.10.10.10 as the destination host. For example:
HP9300(config)# access-list 100 permit ip any host 10.10.10.10
The show debug command displays ACLs applied to debug commands. For example:
HP9300# show debugDebug message destination: ConsoleTCP:
TCP: packet debugging is on TCP: Display is bound to ACL 100
Syntax: show debug
2 - 2
Chapter 3HP Diagnostic Command Reference
This chapter lists and provides syntax and examples for the CLI de, debug, mm, phy, and ptrace commands.
About the Diagnostic Commands You can enter the diagnostic commands at the Privileged EXEC CLI level. The following tables list the diagnostic commands and contains page references to descriptions of each command.
Diagnostic Commands The following diagnostic commands are supported.
de 3-5
debug all 3-5
debug appletalk 3-6
debug destination 3-6
debug gvrp packets 3-6
debug ip arp 3-7
debug ip bgp <address> updates 3-8
debug ip bgp dampening 3-8
debug ip bgp events 3-8
debug ip bgp in 3-9
debug ip bgp keepalives 3-9
debug ip bgp out 3-9
debug ip bgp updates 3-10
debug ip dvmrp detail 3-10
debug ip dvmrp in 3-10
3 - 1
Diagnostics Guide
debug ip dvmrp out 3-11
debug ip dvmrp pruning 3-11
debug ip icmp events 3-11
debug ip icmp packets 3-12
debug ip igmp 3-12
debug ip msdp alarms 3-12
debug ip msdp events 3-13
debug ip msdp message 3-13
debug ip nat icmp 3-13
debug ip nat udp 3-14
debug ip nat tcp 3-14
debug ip nat transdata 3-15
debug ip ospf adj 3-15
debug ip ospf events 3-15
debug ip ospf flood 3-16
debug ip ospf lsa-generation 3-16
debug ip ospf packet 3-16
debug ip ospf retransmission 3-17
debug ip ospf spf 3-17
debug ip pim <address> 3-18
debug ip pim events 3-18
debug ip rip 3-19
debug ip rip database 3-19
debug ip rip events 3-20
debug ip rip trigger 3-21
debug ip ssh 3-21
debug ip tcp <address> 3-22
debug ip tcp driver 3-22
debug ip tcp memory 3-23
debug ip tcp packet 3-23
debug ip tcp sack 3-24
debug ip tcp transactions 3-24
debug ip udp 3-24
debug ip vrrp events 3-25
3 - 2

HP Diagnostic Command Reference
debug ip vrrp packet 3-25
debug spanning 3-26
mm 3-27
phy 3-28
ptrace aaa 3-29
ptrace appletalk aarp 3-29
ptrace appletalk aep 3-30
ptrace appletalk nbp 3-30
ptrace appletalk none 3-30
ptrace appletalk rtmp 3-30
ptrace appletalk states 3-30
ptrace appletalk zip 3-31
ptrace arp 3-31
ptrace bootp 3-31
ptrace dvmrp graft 3-31
ptrace dvmrp graft-ack 3-31
ptrace dvmrp mcache 3-32
ptrace dvmrp message 3-32
ptrace dvmrp none 3-32
ptrace dvmrp probe 3-32
ptrace dvmrp prune 3-32
ptrace dvmrp route-table 3-32
ptrace icmp 3-33
ptrace igmp 3-33
ptrace ip 3-33
ptrace none 3-33
ptrace ospf 3-33
ptrace pim fcache 3-34
ptrace pim mcache 3-34
ptrace pim message 3-34
ptrace pim none 3-34
ptrace ppp 3-34
ptrace rarp 3-34
ptrace rip 3-35
3 - 3

Diagnostics Guide
ptrace snmp 3-35
ptrace switch none 3-35
ptrace switch stp 3-35
ptrace tcp 3-35
ptrace telnet 3-36
ptrace term 3-36
ptrace tftp 3-36
ptrace udp 3-36
3 - 4
HP Diagnostic Command Reference
Diagnostic Commands – Syntax Descriptions The following commands are available at the Privileged EXEC level of the CLI for HP devices, except where noted.
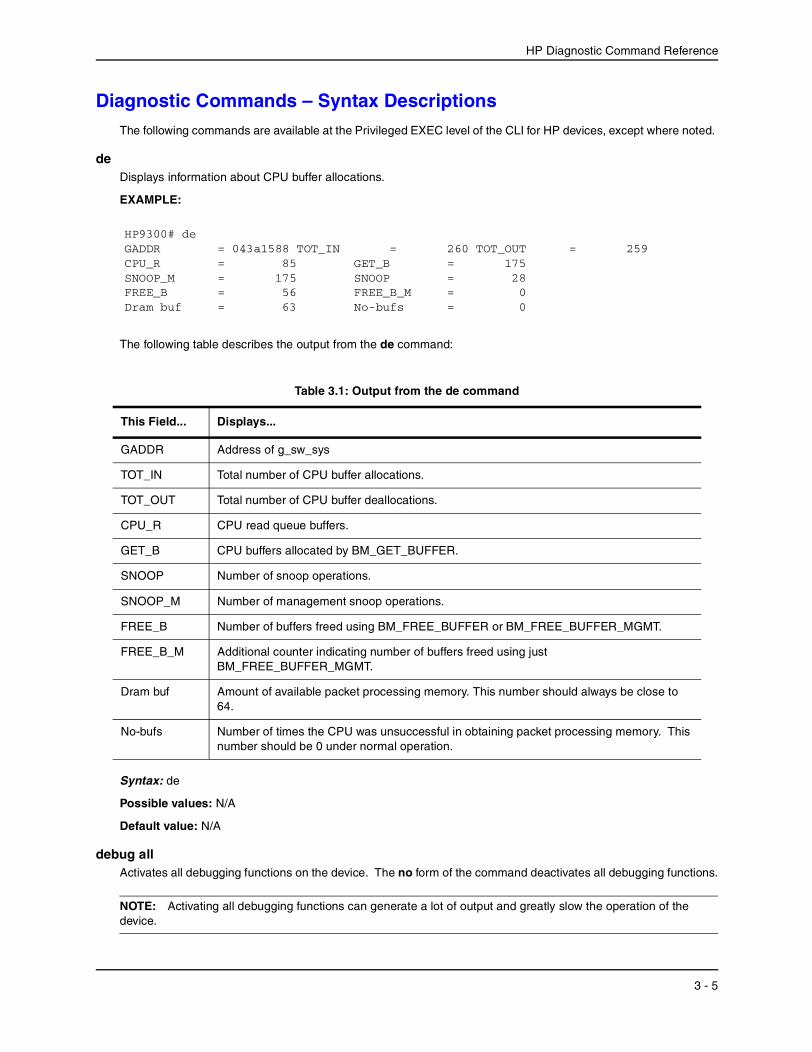
de Displays information about CPU buffer allocations.
EXAMPLE:
HP9300# de GADDR = 043a1588 TOT_IN = 260 TOT_OUT = 259 CPU_R = 85 GET_B = 175 SNOOP_M = 175 SNOOP = 28 FREE_B = 56 FREE_B_M = 0 Dram buf = 63 No-bufs = 0
The following table describes the output from the de command:
Table 3.1: Output from the de command
This Field...
GADDR
TOT_IN
TOT_OUT
CPU_R
GET_B
SNOOP
SNOOP_M
FREE_B
FREE_B_M
Dram buf
No-bufs
Displays...
Address of g_sw_sys
Total number of CPU buffer allocations.
Total number of CPU buffer deallocations.
CPU read queue buffers.
CPU buffers allocated by BM_GET_BUFFER.
Number of snoop operations.
Number of management snoop operations.
Number of buffers freed using BM_FREE_BUFFER or BM_FREE_BUFFER_MGMT.
Additional counter indicating number of buffers freed using just BM_FREE_BUFFER_MGMT.
Amount of available packet processing memory. This number should always be close to 64.
Number of times the CPU was unsuccessful in obtaining packet processing memory. This number should be 0 under normal operation.
Syntax: de
Possible values: N/A
Default value: N/A
debug all Activates all debugging functions on the device. The no form of the command deactivates all debugging functions.
NOTE: Activating all debugging functions can generate a lot of output and greatly slow the operation of the device.
3 - 5
Diagnostics Guide
EXAMPLE:
HP9300# debug all
Syntax: [no] debug all
Possible values: N/A
Default value: N/A
debug appletalk Displays the number of timer events dropped and insufficient zone allocations in an Appletalk configuration.
EXAMPLE:
HP9300# debug appletalkTimer event Dropped: 0Insufficient zone allocation: 0
Syntax: [no] debug appletalk
Possible values: N/A
Default value: N/A
debug destination Specifies a destination for debugging output. You can send debugging output to the console, Syslog buffer, a Telnet session, or an SSH session.
EXAMPLE:
HP9300# debug destination ssh 1
Syntax: debug destination console | logging | telnet <num> | ssh <num>
Possible values: Specify one of the following destinations:
console Directs debugging output to the system console.
logging Directs debugging output to the Syslog buffer and also to the Syslog server, if configured.
telnet <num> Directs debugging output to the specified Telnet session.
ssh <num> Directs debugging output to the specified SSH session.
Default value: By default, debugging output is sent to the Console.
debug gvrp packets Displays GVRP information.
EXAMPLE:
HP9300# debug gvrp packets
3 - 6
HP Diagnostic Command Reference
After you enter this command, messages such as the following appear at the destination specified for debugging output. You can turn off these messages with the no debug gvrp packets command.
GVRP: Port 2/1 RCVGVRP: 0x2095ced4: 01 80 c2 00 00 21 00 e0 52 ab 87 40 00 28 42 42GVRP: 0x2095cee4: 03 00 01 01 04 02 03 e9 04 01 03 eb 04 01 03 ecGVRP: 0x2095cef4: 04 01 03 ef 04 01 03 f1 04 01 05 dd 04 01 09 cbGVRP: 0x2095cf04: 04 01 0f a1 00 00GVRP: Port 2/1 TXGVRP: 0x207651b8: 01 80 c2 00 00 21 00 04 80 2c 0e 20 00 3a 42 42GVRP: 0x207651c8: 03 00 01 01 02 00 04 05 03 e9 04 05 03 eb 04 05GVRP: 0x207651d8: 03 ec 04 05 03 ef 04 05 03 f1 04 05 05 dd 04 05GVRP: 0x207651e8: 09 cb 04 05 0f a1 04 02 00 02 04 01 00 07 04 01GVRP: 0x207651f8: 00 09 04 01 00 0b 00 00GVRP: Port 2/1 TXGVRP: 0x207651b8: 01 80 c2 00 00 21 00 04 80 2c 0e 20 00 18 42 42GVRP: 0x207651c8: 03 00 01 01 04 02 00 02 04 01 00 07 04 01 00 09GVRP: 0x207651d8: 04 01 00 0b 00 00
Syntax: [no] debug gvrp packets
Possible values: N/A
Default value: N/A
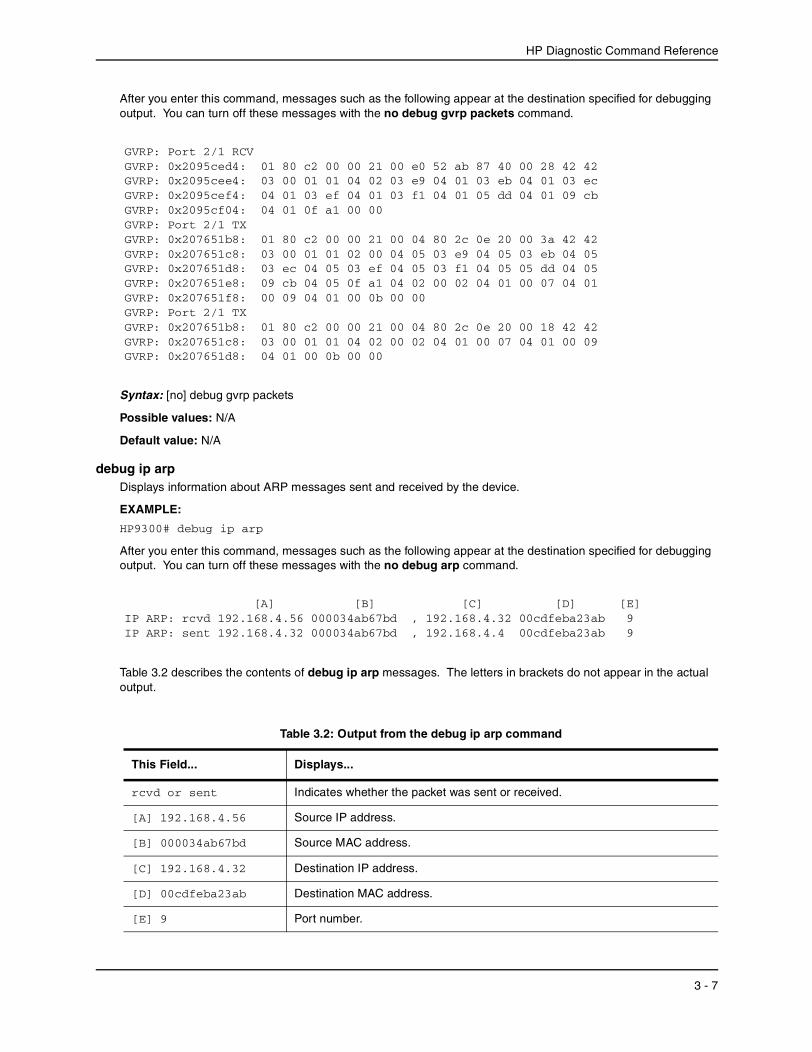
debug ip arp Displays information about ARP messages sent and received by the device.
EXAMPLE:
HP9300# debug ip arp
After you enter this command, messages such as the following appear at the destination specified for debugging output. You can turn off these messages with the no debug arp command.
[A] [B] [C] [D] [E] IP ARP: rcvd 192.168.4.56 000034ab67bd , 192.168.4.32 00cdfeba23ab 9 IP ARP: sent 192.168.4.32 000034ab67bd , 192.168.4.4 00cdfeba23ab 9
Table 3.2 describes the contents of debug ip arp messages. The letters in brackets do not appear in the actual output.
Table 3.2: Output from the debug ip arp command
This Field...
rcvd or sent
[A] 192.168.4.56
[B] 000034ab67bd
[C] 192.168.4.32
[D] 00cdfeba23ab
[E] 9
Displays...
Indicates whether the packet was sent or received.
Source IP address.
Source MAC address.
Destination IP address.
Destination MAC address.
Port number.
3 - 7
Diagnostics Guide
Syntax: [no] debug ip arp
Possible values: N/A
Default value: N/A
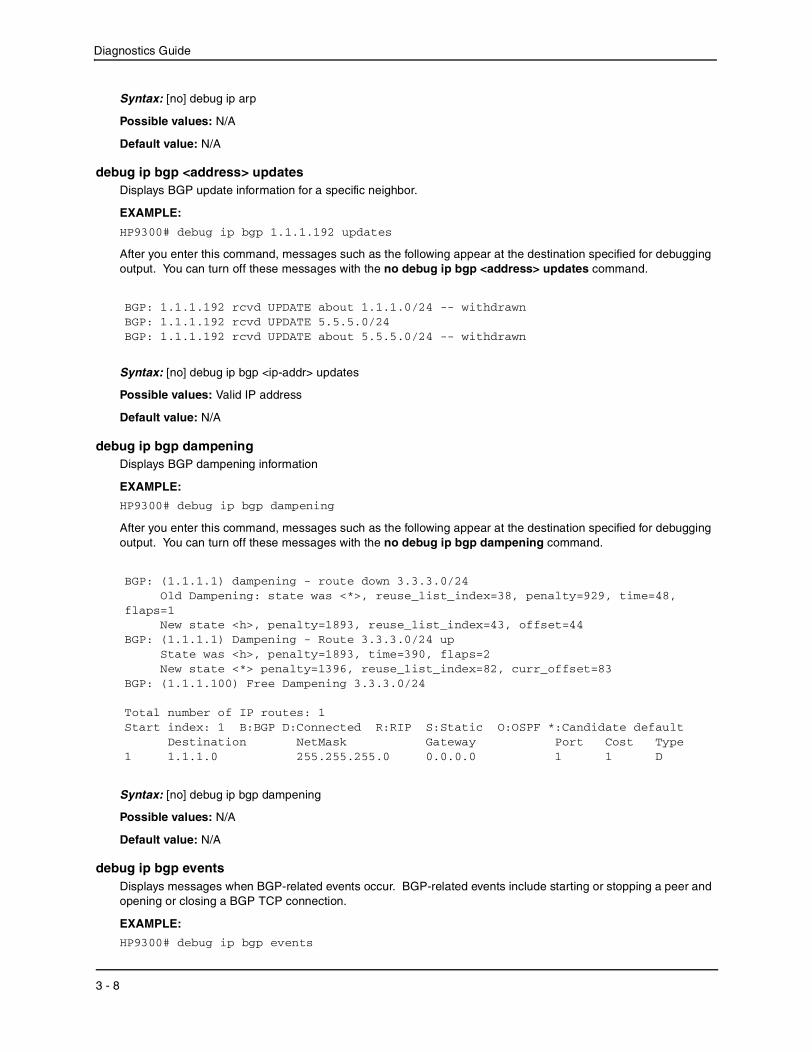
debug ip bgp <address> updates Displays BGP update information for a specific neighbor.
EXAMPLE:
HP9300# debug ip bgp 1.1.1.192 updates
After you enter this command, messages such as the following appear at the destination specified for debugging output. You can turn off these messages with the no debug ip bgp <address> updates command.
BGP: 1.1.1.192 rcvd UPDATE about 1.1.1.0/24 -- withdrawnBGP: 1.1.1.192 rcvd UPDATE 5.5.5.0/24BGP: 1.1.1.192 rcvd UPDATE about 5.5.5.0/24 -- withdrawn
Syntax: [no] debug ip bgp <ip-addr> updates
Possible values: Valid IP address
Default value: N/A
debug ip bgp dampening Displays BGP dampening information
EXAMPLE:
HP9300# debug ip bgp dampening
After you enter this command, messages such as the following appear at the destination specified for debugging output. You can turn off these messages with the no debug ip bgp dampening command.
BGP: (1.1.1.1) dampening - route down 3.3.3.0/24 Old Dampening: state was <*>, reuse_list_index=38, penalty=929, time=48,
flaps=1 New state <h>, penalty=1893, reuse_list_index=43, offset=44
BGP: (1.1.1.1) Dampening - Route 3.3.3.0/24 up State was <h>, penalty=1893, time=390, flaps=2 New state <*> penalty=1396, reuse_list_index=82, curr_offset=83
BGP: (1.1.1.100) Free Dampening 3.3.3.0/24
Total number of IP routes: 1 Start index: 1 B:BGP D:Connected R:RIP S:Static O:OSPF *:Candidate default
Destination NetMask Gateway Port Cost Type 1 1.1.1.0 255.255.255.0 0.0.0.0 1 1 D
Syntax: [no] debug ip bgp dampening
Possible values: N/A
Default value: N/A
debug ip bgp events Displays messages when BGP-related events occur. BGP-related events include starting or stopping a peer and opening or closing a BGP TCP connection.
EXAMPLE:
HP9300# debug ip bgp events
3 - 8
HP Diagnostic Command Reference
After you enter this command, messages such as the following appear at the destination specified for debugging output. You can turn off these messages with the no debug ip bgp events command.
BGP: 3.3.3.1 start peerBGP: 3.3.3.1 stop peerBGP: 3.3.3.1 BGP-TCP Connection openedBGP: 3.3.3.1 TCP_OPEN doneBGP: 3.3.3.1 keep alive timer expired
Syntax: [no] debug ip bgp events
Possible values: N/A
Default value: N/A
debug ip bgp in Displays BGP inbound information.
EXAMPLE:
HP9300# debug ip bgp in
After you enter this command, messages such as the following appear at the destination specified for debugging output. You can turn off these messages with the no debug ip bgp in command.
BGP: rcvd message KEEPALIVE_MESSAGE from peer 1.1.1.100, length (incl. header) 19BGP: rcvd message UPDATE from peer 1.1.1.100, length (incl. header) 27BGP: rcvd message OPEN_MESSAGE from peer 1.1.1.100, length (incl. header) 29
Syntax: [no] debug ip bgp in
Possible values: N/A
Default value: N/A
debug ip bgp keepalives Displays BGP keepalive information
EXAMPLE:
HP9300# debug ip bgp keepalives
After you enter this command, messages such as the following appear at the destination specified for debugging output. You can turn off these messages with the no debug ip bgp keepalives command.
BGP: send keepalives to peer 3.3.3.100
Syntax: [no] debug ip bgp keepalives
Possible values: N/A
Default value: N/A
debug ip bgp out Displays BGP outbound information.
EXAMPLE:
HP9300# debug ip bgp out
3 - 9
Diagnostics Guide
After you enter this command, messages such as the following appear at the destination specified for debugging output. You can turn off these messages with the no debug ip bgp out command.
BGP: send UPDATE message to peer 1.1.1.100, length (incl. header) 19BGP: send KEEPALIVE_MESSAGE message to peer 1.1.1.100, length (incl. header) 19BGP: send OPEN_MESSAGE message to peer 1.1.1.100, length (incl. header) 19
Syntax: [no] debug ip bgp out
Possible values: N/A
Default value: N/A
debug ip bgp updates Displays BGP update information for all neighbors or those specified in an IP prefix list.
EXAMPLE:
HP9300# debug ip bgp updates
After you enter this command, messages such as the following appear at the destination specified for debugging output. You can turn off these messages with the no debug ip bgp updates command.
BGP: 3.3.3.100 rcvd UPDATE 4.4.4.0/24BGP: 3.3.3.100 rcvd UPDATE about 4.4.4.0/24 -- withdrawn
Syntax: [no] debug ip bgp updates [<prefix-list>]
Possible values: The <prefix-list> parameter specifies an IP prefix list. Only the routes permitted by the prefix list are displayed.
Default value: N/A
debug ip dvmrp detail Displays detailed messages about DVMRP events, including sending reports, updating the forwarding table, and inserting table entries.
EXAMPLE:
HP9300# debug ip dvmrp detail
After you enter this command, messages such as the following appear at the destination specified for debugging output. You can turn off these messages with the no debug ip dvmrp detail command.
DVMRP: send report DVMRP report to 224.0.0.4DVMRP: send report DVMRP report to 2.2.2.1DVMRP: updating fwd table due to a child is deletedDVMRP: updating fwd table due to a entry is deletedDVMRP: updating fwd table due to adding entryDVMRP: insert entry source 1.1.1.0 group 239.255.162.2
Syntax: [no] debug ip dvmrp detail
Possible values: N/A
Default value: N/A
debug ip dvmrp in Displays messages related to inbound DVMRP information.
3 - 10
HP Diagnostic Command Reference
EXAMPLE:
HP9300# debug ip dvmrp in
After you enter this command, messages such as the following appear at the destination specified for debugging output. You can turn off these messages with the no debug ip dvmrp in command.
DVMRP: accept report. src ip 2.2.2.1 dest ip 224.0.0.4 group 0.6.5.3 port 7DVMRP: accept probe. src ip 2.2.2.1 dest ip 224.0.0.4 group 0.6.5.3 port 7DVMRP: accept prune. src ip 2.2.2.1 dest ip 2.2.2.100 group 0.6.5.3 port 7
Syntax: [no] debug ip dvmrp in
Possible values: N/A
debug ip dvmrp out Displays messages related to outbound DVMRP information.
EXAMPLE:
HP9300# debug ip dvmrp out
After you enter this command, messages such as the following appear at the destination specified for debugging output. You can turn off these messages with the no debug ip dvmrp out command.
DVMRP: send report. src ip 2.2.2.1 dest ip 224.0.0.4DVMRP: send probe. src 2.2.2.1 dest 2.2.2.100 port 7
Syntax: [no] debug ip dvmrp out
Possible values: N/A
debug ip dvmrp pruning Displays DVMRP pruning information.
EXAMPLE:
HP9300# debug ip dvmrp pruning
After you enter this command, messages such as the following appear at the destination specified for debugging output. You can turn off these messages with the no debug ip dvmrp pruning command.
DVMRP: delete entry 00000003 idx 273DVMRP: delete all entries for source 1.1.1.0 DVMRP: update fwd table by adding group 239.255.162.1 router 3.3.3.100 interface 9DVMRP: update fwd table by adding group 239.255.162.2 router 3.3.3.100 interface 9DVMRP: update fwd table by deleting group 239.255.162.1 router 3.3.3.100 interface 9DVMRP: dvmrp delete prune state: Int6 Index 255 Prune Index 3
Syntax: [no] debug ip dvmrp pruning
Possible values: N/A
Default value: N/A
debug ip icmp events Displays messages when ICMP events, including sending and receiving ICMP echo requests, occur.
EXAMPLE:
HP9300# debug ip icmp events
3 - 11
Diagnostics Guide
After you enter this command, messages such as the following appear at the destination specified for debugging output. You can turn off these messages with the no debug ip icmp events command.
ICMP: rcvd echo request packet of length 40 from 1.1.1.2ICMP: send echo request packet of length 60 to 1.1.1.2
Syntax: [no] debug ip icmp events
Possible values: N/A
Default value: N/A
debug ip icmp packets Displays information related to ICMP packets sent or received on the device.
EXAMPLE:
HP9300# debug ip icmp packets
After you enter this command, messages such as the following appear at the destination specified for debugging output. You can turn off these messages with the no debug ip icmp packets command.
ICMP:dst (1.2.3.4), src (0.0.0.0) echo request type
Syntax: [no] debug ip icmp packets
Possible values: N/A
Default value: N/A
debug ip igmp Displays IGMP related information.
EXAMPLE:
HP9300# debug ip igmp
After you enter this command, messages such as the following appear at the destination specified for debugging output. You can turn off these messages with the no debug ip igmp command.
IGMP: send message to 1.1.1.1 port ethernet 1 type 17 size 28IGMP: send query to all port. type 17 port ethernet 7 ver 2IGMP: rcvd v2 membership report from 1.1.1.2 group address 239.255.162.1 port ethernet 1 size 8IGMP: rcvd membership query from 2.2.2.100 group address 0.0.0.0 port ethernet 7 size 8IGMP: rcvd pim from 2.2.2.100 group address 16.0.0.0 port ethernet 7 size 12
debug ip msdp alarms Displays information about MSDP alarms.
EXAMPLE:
HP9300# debug ip msdp alarms
After you enter this command, messages such as the following appear at the destination specified for debugging output. You can turn off these messages with the no debug ip msdp alarms command.
MSDP: S=xxxxxxx P=0 Initiate Transport Connection to MSDP peer
Syntax: [no] debug ip msdp alarms
Possible values: N/A
Default value: N/A
3 - 12
HP Diagnostic Command Reference
debug ip msdp events Displays messages when significant MSDP events occur.
EXAMPLE:
HP9300# debug ip msdp events
After you enter this command, messages such as the following appear at the destination specified for debugging output. You can turn off these messages with the no debug ip msdp events command.
MSDP: 172.16.2.4: Closing sessionMSDP: 172.16.2.4: Peer back to IDLE stateMSDP: (172.16.2.4) START peerMSDP: 172.16.2.4: Closing sessionMSDP: 172.16.2.4: Peer back to IDLE stateMSDP: Originating SAMSDP: (172.16.2.4) START peerMSDP: 172.16.2.4: TCP Connection to Remote Peer is OpenMSDP: 172.16.2.4: MSDP-TCP Connection openedMSDP: 172.16.2.4: TCP_OPEN DONE, State 4MSDP: Remote Peer closed TCP connection
Syntax: [no] debug ip msdp events
Possible values: N/A
Default value: N/A
debug ip msdp message Displays information when MSDP messages are sent or received on the device.
EXAMPLE:
HP9300# debug ip msdp message
After you enter this command, messages such as the following appear at the destination specified for debugging output. You can turn off these messages with the no debug ip msdp message command.
MSDP: 172.16.2.4: send keepalive messageMSDP: 172.16.2.4: TLV 4 Send Message to peer. length=3MSDP: P=0 MSDP Header Rcvd: Len=3 Type=4MSDP: 172.16.2.4: KEEP_ALIVE Received Type 00000004 State=4 Length=3MSDP: 172.16.2.4: send keepalive messageMSDP: 172.16.2.4: TLV 4 Send Message to peer. length=3MSDP: P=0 MSDP Header Rcvd: Len=3 Type=4MSDP: 172.16.2.4: KEEP_ALIVE Received Type 00000004 State=4 Length=3
Syntax: [no] debug ip msdp message
Possible values: N/A
Default value: N/A
debug ip nat icmp Displays information about ICMP packets whose source or destination matches a specified IP address.
EXAMPLE:
HP9300# debug ip nat icmp 10.10.100.18
3 - 13
Diagnostics Guide
After you enter this command, messages such as the following appear at the destination specified for debugging output. You can turn off these messages with the no debug ip nat icmp command.
NAT: icmp src 10.10.100.18 => trans 192.168.2.79 dst 204.71.202.127NAT: 192.168.2.79 204.71.202.127 ID 35768 len 60 txfid 13 icmp (8/0/512/519)NAT: 204.71.202.127 10.10.100.18 ID 11554 len 60 txfid 15 icmp (0/0/512/519)
Syntax: [no] debug ip nat icmp <ip-addr>
Possible values: A valid IP address. An IP address of 0.0.0.0 matches any ICMP packet.
Default value: N/A
debug ip nat udp Displays information about UDP packets whose source or destination matches a specified IP address.
EXAMPLE:
HP9300# debug ip nat udp 10.10.100.18
After you enter this command, messages such as the following appear at the destination specified for debugging output. You can turn off these messages with the no debug ip nat udp command.
NAT: udp src 10.10.100.18:1561 => trans 192.168.2.79:65286 dst 192.168.3.11:53NAT: 192.168.2.79:65286 192.168.3.11:53 ID 35512 len 58 txfid 13NAT: 192.168.3.11:53 10.10.100.18:1560 ID 8453 len 346 txfid 15
Syntax: [no] debug ip nat udp <ip-addr>
Possible values: A valid IP address. An IP address of 0.0.0.0 matches any UDP packet.
Default value: N/A
debug ip nat tcp Displays information about TCP packets whose source or destination matches a specified IP address.
EXAMPLE:
HP9300# debug ip nat tcp 10.10.100.18
After you enter this command, messages such as the following appear at the destination specified for debugging output. You can turn off these messages with the no debug ip nat tcp command.
NAT: tcp src 10.10.100.18:1473 => trans 192.168.2.78:8016 dst 192.168.2.158:53NAT: 192.168.2.78:8016 192.168.2.158:53 flags S ID 57970 len 44 txfid 13NAT: 192.168.2.158:53 10.10.100.18:1473 flags S A ID 22762 len 44 txfid 15NAT: 192.168.2.78:8016 192.168.2.158:53 flags A ID 58226 len 40 txfid 13NAT: 192.168.2.78:8016 192.168.2.158:53 flags A ID 58482 len 77 txfid 13NAT: 192.168.2.158:53 10.10.100.18:1473 flags A ID 23018 len 42 txfid 15NAT: 192.168.2.78:8016 192.168.2.158:53 flags A ID 58738 len 40 txfid 13NAT: 192.168.2.158:53 10.10.100.18:1473 flags A ID 23274 len 131 txfid 15NAT: 192.168.2.78:8016 192.168.2.158:53 flags FA ID 58994 len 40 txfid 13NAT: 192.168.2.158:53 10.10.100.18:1473 flags A ID 23530 len 40 txfid 15NAT: 192.168.2.158:53 10.10.100.18:1473 flags FA ID 23786 len 40 txfid 15NAT: 192.168.2.78:8016 192.168.2.158:53 flags A ID 59250 len 40 txfid 13
Syntax: [no] debug ip nat tcp <ip-addr>
Possible values: A valid IP address. An IP address of 0.0.0.0 matches any TCP packet.
Default value: N/A
3 - 14
HP Diagnostic Command Reference
debug ip nat transdata Displays information about network translation requests and responses.
EXAMPLE:
HP9300# debug ip nat transdata
After you enter this command, messages such as the following appear at the destination specified for debugging output. You can turn off these messages with the no debug ip nat transdata command.
NAT: icmp src 10.10.100.18:2048 => trans 192.168.2.79 dst 204.71.202.127NAT: udp src 10.10.100.18:1561 => trans 192.168.2.79:65286 dst 192.168.3.11:53NAT: tcp src 10.10.100.18:1473 => trans 192.168.2.78:8016 dst 192.168.2.158:53
Syntax: [no] debug ip nat transdata
Possible values: N/A
Default value: N/A
debug ip ospf adj Displays information related to OSPF adjacency events. Adjacency events include adding or removing an interface, receiving hello messages from an adjacency, and broadcasting hello messages to an adjacency.
EXAMPLE:
HP9300# debug ip ospf adj
After you enter this command, messages such as the following appear at the destination specified for debugging output. You can turn off these messages with the no debug ip ospf adj command.
OSPF: 1.1.1.100 is added to interface neighbor listOSPF: 4.4.4.101 is removed from interface neighbor listOSPF: rvcd hello from 207.95.6.146 area 1 from 207.9OSPF: broadcast hello to area 1 of all neighbors of 207.95.6.52
Syntax: [no] debug ip ospf adj
Possible values: N/A
Default value: N/A
debug ip ospf events Displays messages when significant OSPF events occur. These events include backup designated router (BDR) election, designated router (DR) election, and receiving and sending database description (DBD) packets.
EXAMPLE:
HP9300# debug ip ospf events
After you enter this command, messages such as the following appear at the destination specified for debugging output. You can turn off these messages with the no debug ip ospf events command.
OSPF: DR/BDR election for 1.1.1.1 on ve 2OSPF: elect BDR(backup designated router): Router ID 1.1.1.10 IP interface 1.1.1.10OSPF: elect DR(designated router): Router ID 1.1.1.1, IP interface 1.1.1.1OSPF: rcvd DBD from 1.1.1.1 on ve 2 flag 0x0 len 32 mtu 1500OSPF: send DBD to 1.1.1.1 on ve 2 flag 0x0 len 232
Syntax: [no] debug ip ospf events
Possible values: N/A
3 - 15
Diagnostics Guide
Default value: N/A
debug ip ospf flood Displays OSPF link state advertisement (LSA) flooding information.
EXAMPLE:
HP9300# debug ip ospf flood
After you enter this command, messages such as the following appear at the destination specified for debugging output. You can turn off these messages with the no debug ip ospf flood command.
OSPF: flooding 1 advertisement out interface 207.95.6.52OSPF: attempting to flood rcvd LSA area = 00000001 interface type = 1OSPF: flood advertisement throughout the entire autonomous system
Syntax: [no] debug ip ospf flood
Possible values: N/A
Default value: N/A
debug ip ospf lsa-generation Displays information related to OSPF link state advertisements (LSAs).
EXAMPLE:
HP9300# ip ospf lsa-generation
After you enter this command, messages such as the following appear at the destination specified for debugging output. You can turn off these messages with the no debug ip ospf lsa-generation command.
OSPF: rcvd LSA type = 5, router ID 207.95.6.0 seq_num = 80000058OSPF: ospf ls acknowledgement packet received!OSPF: processing advertisement
Syntax: [no] debug ip ospf lsa-generation
Possible values: N/A
Default value: N/A
debug ip ospf packet Displays information about OSPF packets sent and received on the device
EXAMPLE:
HP9300# debug ip ospf packet
After you enter this command, messages such as the following appear at the destination specified for debugging output. You can turn off these messages with the no debug ip ospf packet command.
OSPF: rcvd. v:2 t:1 l:48 rid:207.95.6.146 aid:207.95.6.146 chk:00007920 aut:0 auk:00000000 00000000
OSPF: send v:2 t:1 l:48 rid:1.1.1.1 aid:1.1.1.1 chk:0000F630 aut:0 auk:00000000 00000000
3 - 16
HP Diagnostic Command Reference
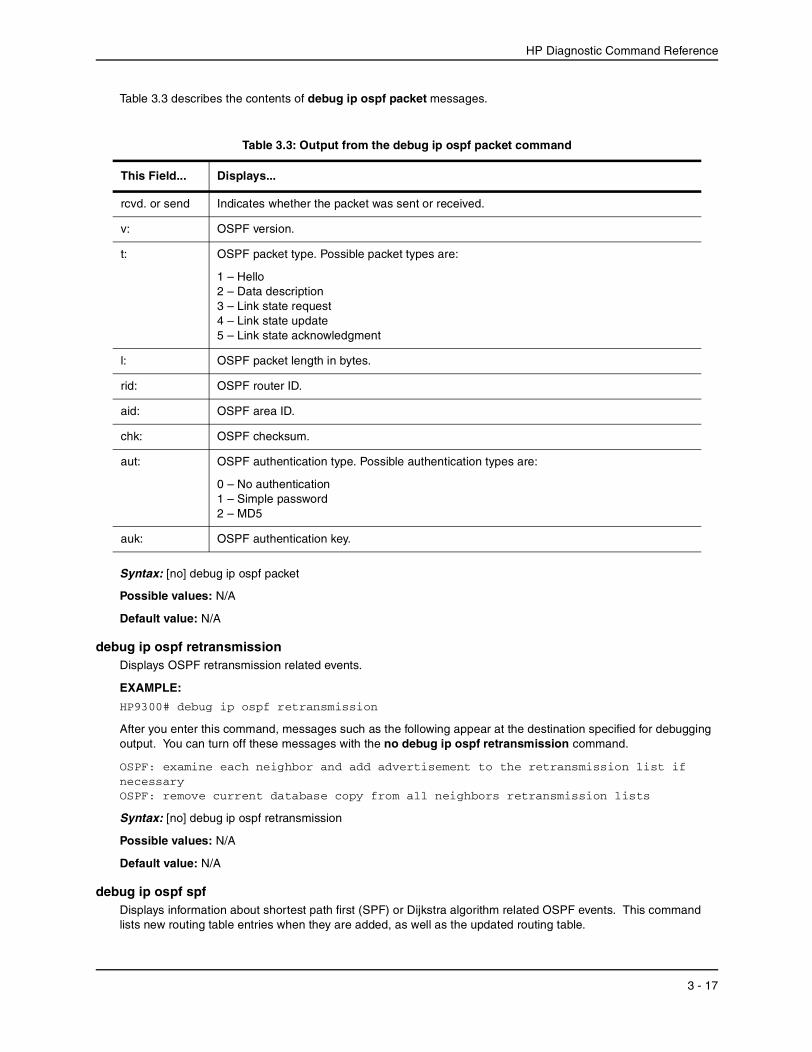
Table 3.3 describes the contents of debug ip ospf packet messages.
Table 3.3: Output from the debug ip ospf packet command
This Field...
rcvd. or send
v:
t:
l:
rid:
aid:
chk:
aut:
auk:
Displays...
Indicates whether the packet was sent or received.
OSPF version.
OSPF packet type. Possible packet types are:
1 – Hello 2 – Data description 3 – Link state request 4 – Link state update 5 – Link state acknowledgment
OSPF packet length in bytes.
OSPF router ID.
OSPF area ID.
OSPF checksum.
OSPF authentication type. Possible authentication types are:
0 – No authentication 1 – Simple password 2 – MD5
OSPF authentication key.
Syntax: [no] debug ip ospf packet
Possible values: N/A
Default value: N/A
debug ip ospf retransmission Displays OSPF retransmission related events.
EXAMPLE:
HP9300# debug ip ospf retransmission
After you enter this command, messages such as the following appear at the destination specified for debugging output. You can turn off these messages with the no debug ip ospf retransmission command.
OSPF: examine each neighbor and add advertisement to the retransmission list ifnecessaryOSPF: remove current database copy from all neighbors retransmission lists
Syntax: [no] debug ip ospf retransmission
Possible values: N/A
Default value: N/A
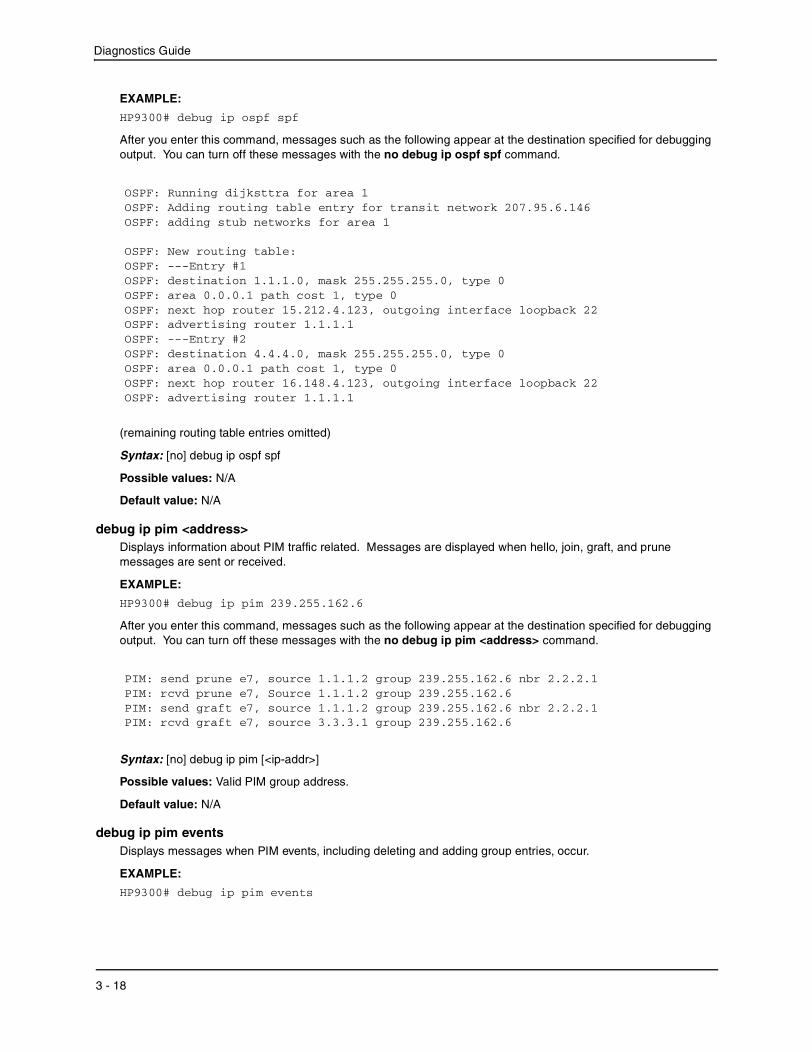
debug ip ospf spf Displays information about shortest path first (SPF) or Dijkstra algorithm related OSPF events. This command lists new routing table entries when they are added, as well as the updated routing table.
3 - 17
Diagnostics Guide
EXAMPLE:
HP9300# debug ip ospf spf
After you enter this command, messages such as the following appear at the destination specified for debugging output. You can turn off these messages with the no debug ip ospf spf command.
OSPF: Running dijksttra for area 1OSPF: Adding routing table entry for transit network 207.95.6.146OSPF: adding stub networks for area 1
OSPF: New routing table:OSPF: ---Entry #1OSPF: destination 1.1.1.0, mask 255.255.255.0, type 0OSPF: area 0.0.0.1 path cost 1, type 0OSPF: next hop router 15.212.4.123, outgoing interface loopback 22OSPF: advertising router 1.1.1.1OSPF: ---Entry #2OSPF: destination 4.4.4.0, mask 255.255.255.0, type 0OSPF: area 0.0.0.1 path cost 1, type 0OSPF: next hop router 16.148.4.123, outgoing interface loopback 22OSPF: advertising router 1.1.1.1
(remaining routing table entries omitted)
Syntax: [no] debug ip ospf spf
Possible values: N/A
Default value: N/A
debug ip pim <address> Displays information about PIM traffic related. Messages are displayed when hello, join, graft, and prune messages are sent or received.
EXAMPLE:
HP9300# debug ip pim 239.255.162.6
After you enter this command, messages such as the following appear at the destination specified for debugging output. You can turn off these messages with the no debug ip pim <address> command.
PIM: send prune e7, source 1.1.1.2 group 239.255.162.6 nbr 2.2.2.1PIM: rcvd prune e7, Source 1.1.1.2 group 239.255.162.6PIM: send graft e7, source 1.1.1.2 group 239.255.162.6 nbr 2.2.2.1PIM: rcvd graft e7, source 3.3.3.1 group 239.255.162.6
Syntax: [no] debug ip pim [<ip-addr>]
Possible values: Valid PIM group address.
Default value: N/A
debug ip pim events Displays messages when PIM events, including deleting and adding group entries, occur.
EXAMPLE:
HP9300# debug ip pim events
3 - 18
HP Diagnostic Command Reference
After you enter this command, messages such as the following appear at the destination specified for debugging output. You can turn off these messages with the no debug ip pim events command.
PIM: BEGIN Periodic join-prune msgsPIM: END Periodic join-prune msgsPIM: delete group 239.255.162.2PIM: Begin sending Join/Prune msg to e7PIM: delete group entry 239.255.162.2 port ethernet 1
Syntax: [no] debug ip pim events
Possible values: N/A
Default value: N/A
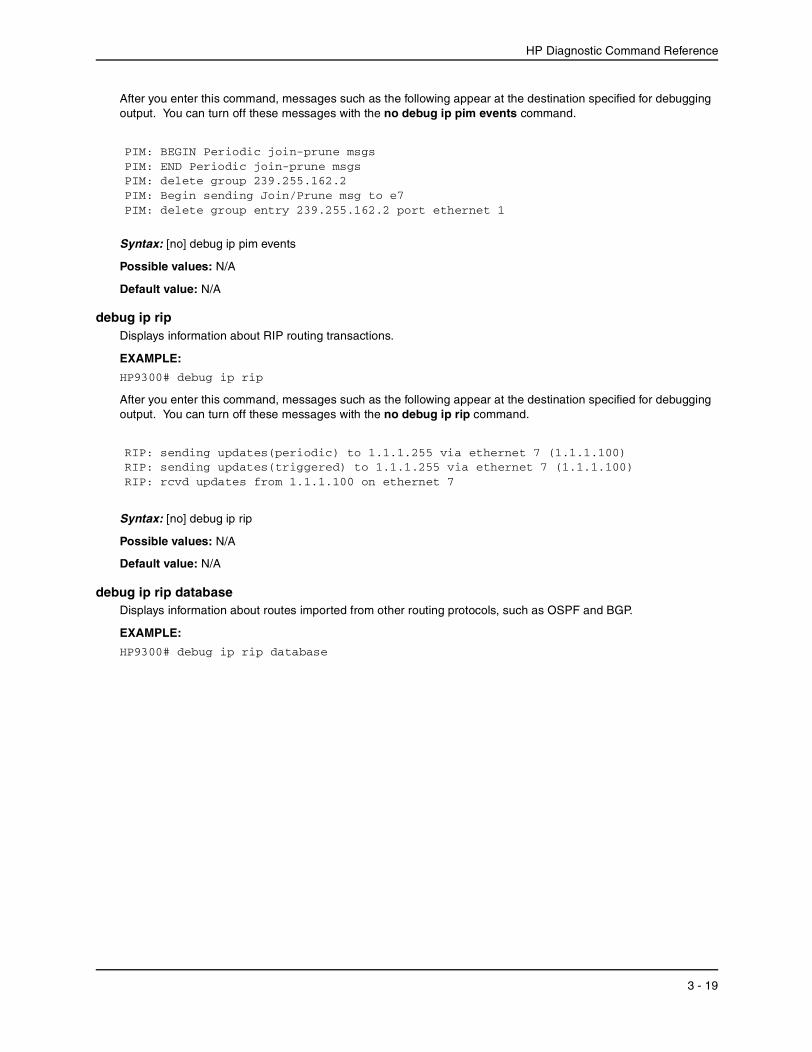
debug ip rip Displays information about RIP routing transactions.
EXAMPLE:
HP9300# debug ip rip
After you enter this command, messages such as the following appear at the destination specified for debugging output. You can turn off these messages with the no debug ip rip command.
RIP: sending updates(periodic) to 1.1.1.255 via ethernet 7 (1.1.1.100)RIP: sending updates(triggered) to 1.1.1.255 via ethernet 7 (1.1.1.100)RIP: rcvd updates from 1.1.1.100 on ethernet 7
Syntax: [no] debug ip rip
Possible values: N/A
Default value: N/A
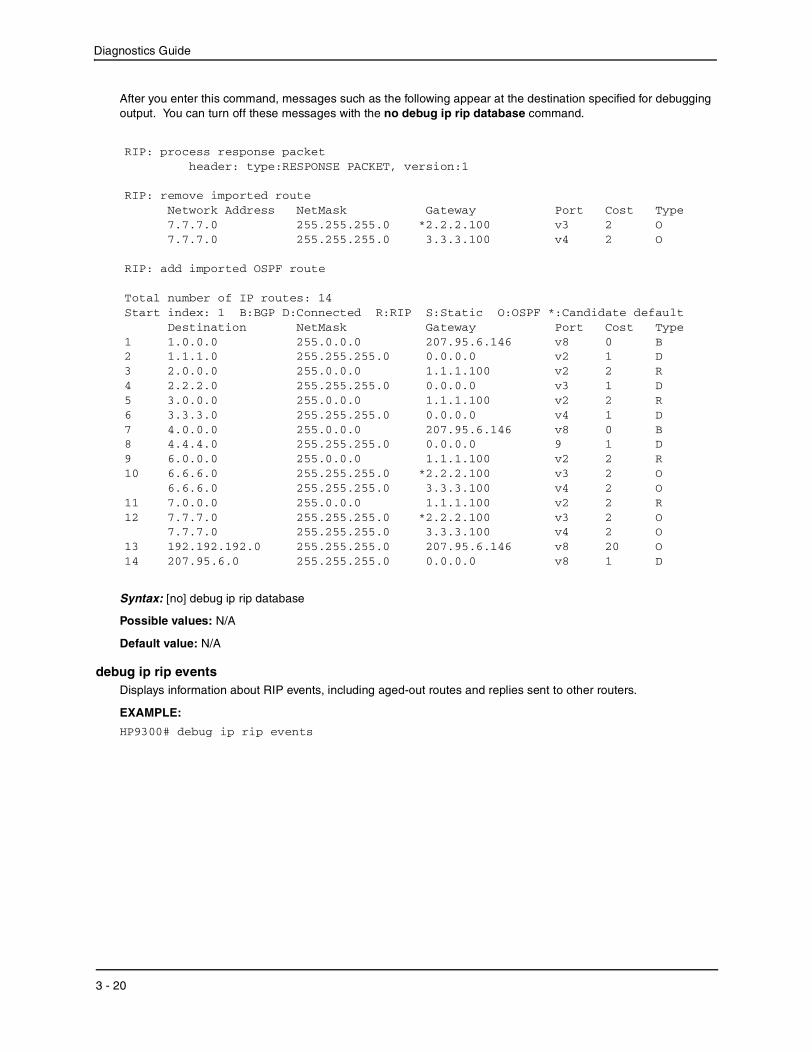
debug ip rip database Displays information about routes imported from other routing protocols, such as OSPF and BGP.
EXAMPLE:
HP9300# debug ip rip database
3 - 19
Diagnostics Guide
After you enter this command, messages such as the following appear at the destination specified for debugging output. You can turn off these messages with the no debug ip rip database command.
RIP: process response packet header: type:RESPONSE PACKET, version:1
RIP: remove imported routeNetwork Address NetMask Gateway Port Cost Type7.7.7.0 255.255.255.0 *2.2.2.100 v3 2 O7.7.7.0 255.255.255.0 3.3.3.100 v4 2 O
RIP: add imported OSPF route
Total number of IP routes: 14Start index: 1 B:BGP D:Connected R:RIP S:Static O:OSPF *:Candidate default
Destination NetMask Gateway Port Cost Type1 1.0.0.0 255.0.0.0 207.95.6.146 v8 0 B2 1.1.1.0 255.255.255.0 0.0.0.0 v2 1 D3 2.0.0.0 255.0.0.0 1.1.1.100 v2 2 R4 2.2.2.0 255.255.255.0 0.0.0.0 v3 1 D5 3.0.0.0 255.0.0.0 1.1.1.100 v2 2 R6 3.3.3.0 255.255.255.0 0.0.0.0 v4 1 D7 4.0.0.0 255.0.0.0 207.95.6.146 v8 0 B8 4.4.4.0 255.255.255.0 0.0.0.0 9 1 D9 6.0.0.0 255.0.0.0 1.1.1.100 v2 2 R10 6.6.6.0 255.255.255.0 *2.2.2.100 v3 2 O
6.6.6.0 255.255.255.0 11 7.0.0.0 255.0.0.012 7.7.7.0 255.255.255.0
3.3.3.100 v4 2 O1.1.1.100 v2 2 R
*2.2.2.100 v3 2 O7.7.7.0 255.255.255.0
13 192.192.192.0 255.255.255.0 14 207.95.6.0 255.255.255.0
3.3.3.100 v4 2 O 207.95.6.146 v8 20 O0.0.0.0 v8 1 D
Syntax: [no] debug ip rip database
Possible values: N/A
Default value: N/A
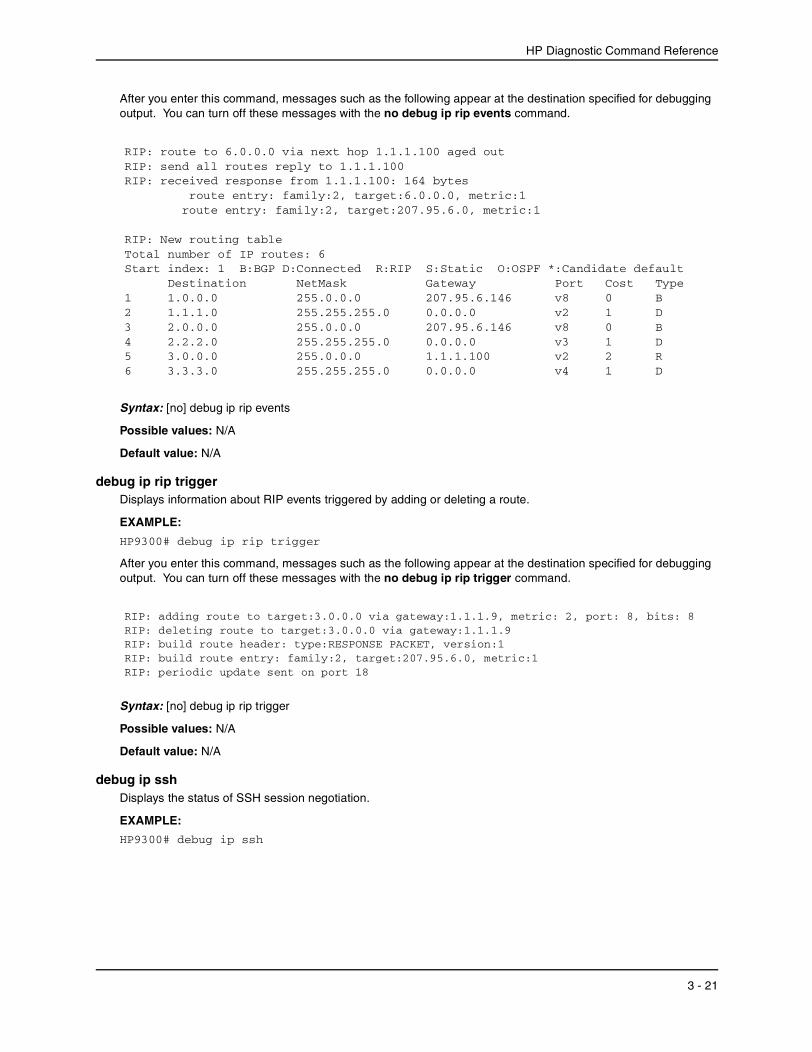
debug ip rip events Displays information about RIP events, including aged-out routes and replies sent to other routers.
EXAMPLE:
HP9300# debug ip rip events
3 - 20
HP Diagnostic Command Reference
After you enter this command, messages such as the following appear at the destination specified for debugging output. You can turn off these messages with the no debug ip rip events command.
RIP: route to 6.0.0.0 via next hop 1.1.1.100 aged outRIP: send all routes reply to 1.1.1.100RIP: received response from 1.1.1.100: 164 bytes
route entry: family:2, target:6.0.0.0, metric:1 route entry: family:2, target:207.95.6.0, metric:1
RIP: New routing table Total number of IP routes: 6 Start index: 1 B:BGP D:Connected R:RIP S:Static O:OSPF *:Candidate default
Destination NetMask Gateway Port Cost Type 1 1.0.0.0 255.0.0.0 207.95.6.146 v8 0 B 2 1.1.1.0 255.255.255.0 0.0.0.0 v2 1 D 3 2.0.0.0 255.0.0.0 207.95.6.146 v8 0 B 4 2.2.2.0 255.255.255.0 0.0.0.0 v3 1 D 5 3.0.0.0 255.0.0.0 1.1.1.100 v2 2 R 6 3.3.3.0 255.255.255.0 0.0.0.0 v4 1 D
Syntax: [no] debug ip rip events
Possible values: N/A
Default value: N/A
debug ip rip trigger Displays information about RIP events triggered by adding or deleting a route.
EXAMPLE:
HP9300# debug ip rip trigger
After you enter this command, messages such as the following appear at the destination specified for debugging output. You can turn off these messages with the no debug ip rip trigger command.
RIP: adding route to target:3.0.0.0 via gateway:1.1.1.9, metric: 2, port: 8, bits: 8RIP: deleting route to target:3.0.0.0 via gateway:1.1.1.9RIP: build route header: type:RESPONSE PACKET, version:1RIP: build route entry: family:2, target:207.95.6.0, metric:1RIP: periodic update sent on port 18
Syntax: [no] debug ip rip trigger
Possible values: N/A
Default value: N/A
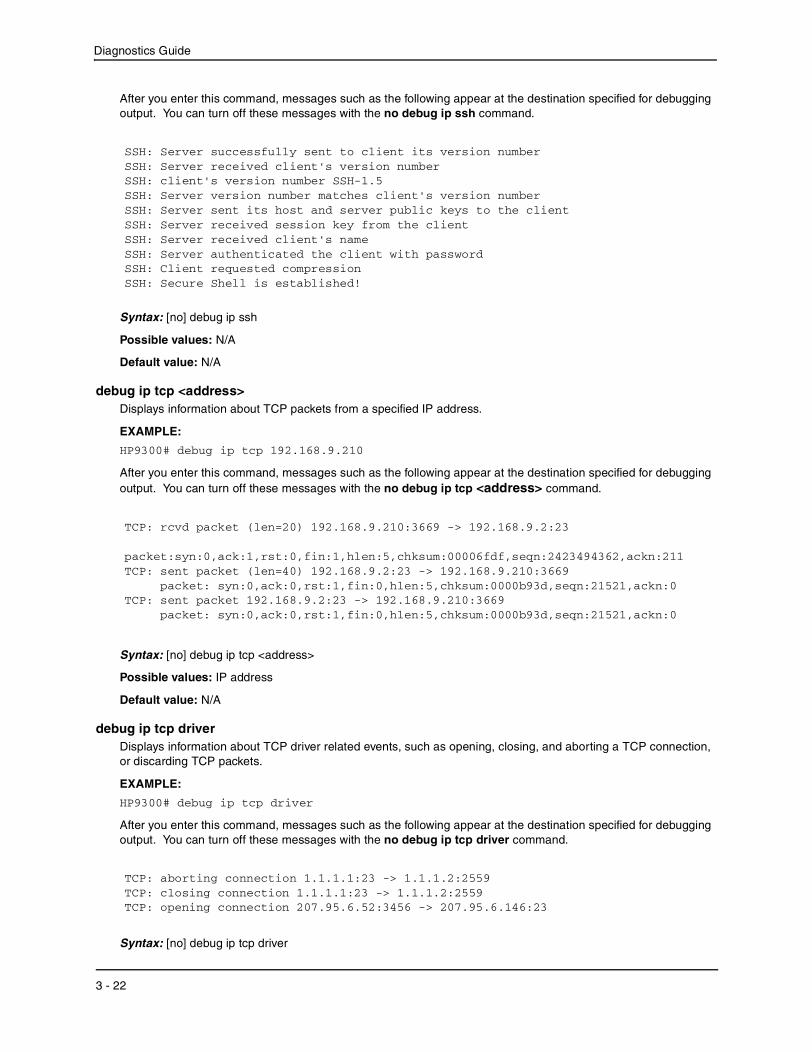
debug ip ssh Displays the status of SSH session negotiation.
EXAMPLE:
HP9300# debug ip ssh
3 - 21
Diagnostics Guide
After you enter this command, messages such as the following appear at the destination specified for debugging output. You can turn off these messages with the no debug ip ssh command.
SSH: Server successfully sent to client its version numberSSH: Server received client's version numberSSH: client's version number SSH-1.5SSH: Server version number matches client's version numberSSH: Server sent its host and server public keys to the clientSSH: Server received session key from the clientSSH: Server received client's nameSSH: Server authenticated the client with passwordSSH: Client requested compressionSSH: Secure Shell is established!
Syntax: [no] debug ip ssh
Possible values: N/A
Default value: N/A
debug ip tcp <address> Displays information about TCP packets from a specified IP address.
EXAMPLE:
HP9300# debug ip tcp 192.168.9.210
After you enter this command, messages such as the following appear at the destination specified for debugging output. You can turn off these messages with the no debug ip tcp <address> command.
TCP: rcvd packet (len=20) 192.168.9.210:3669 -> 192.168.9.2:23
packet:syn:0,ack:1,rst:0,fin:1,hlen:5,chksum:00006fdf,seqn:2423494362,ackn:211TCP: sent packet (len=40) 192.168.9.2:23 -> 192.168.9.210:3669
packet: syn:0,ack:0,rst:1,fin:0,hlen:5,chksum:0000b93d,seqn:21521,ackn:0TCP: sent packet 192.168.9.2:23 -> 192.168.9.210:3669
packet: syn:0,ack:0,rst:1,fin:0,hlen:5,chksum:0000b93d,seqn:21521,ackn:0
Syntax: [no] debug ip tcp <address>
Possible values: IP address
Default value: N/A
debug ip tcp driver Displays information about TCP driver related events, such as opening, closing, and aborting a TCP connection, or discarding TCP packets.
EXAMPLE:
HP9300# debug ip tcp driver
After you enter this command, messages such as the following appear at the destination specified for debugging output. You can turn off these messages with the no debug ip tcp driver command.
TCP: aborting connection 1.1.1.1:23 -> 1.1.1.2:2559TCP: closing connection 1.1.1.1:23 -> 1.1.1.2:2559TCP: opening connection 207.95.6.52:3456 -> 207.95.6.146:23
Syntax: [no] debug ip tcp driver
3 - 22
HP Diagnostic Command Reference
Possible values: N/A
Default value: N/A
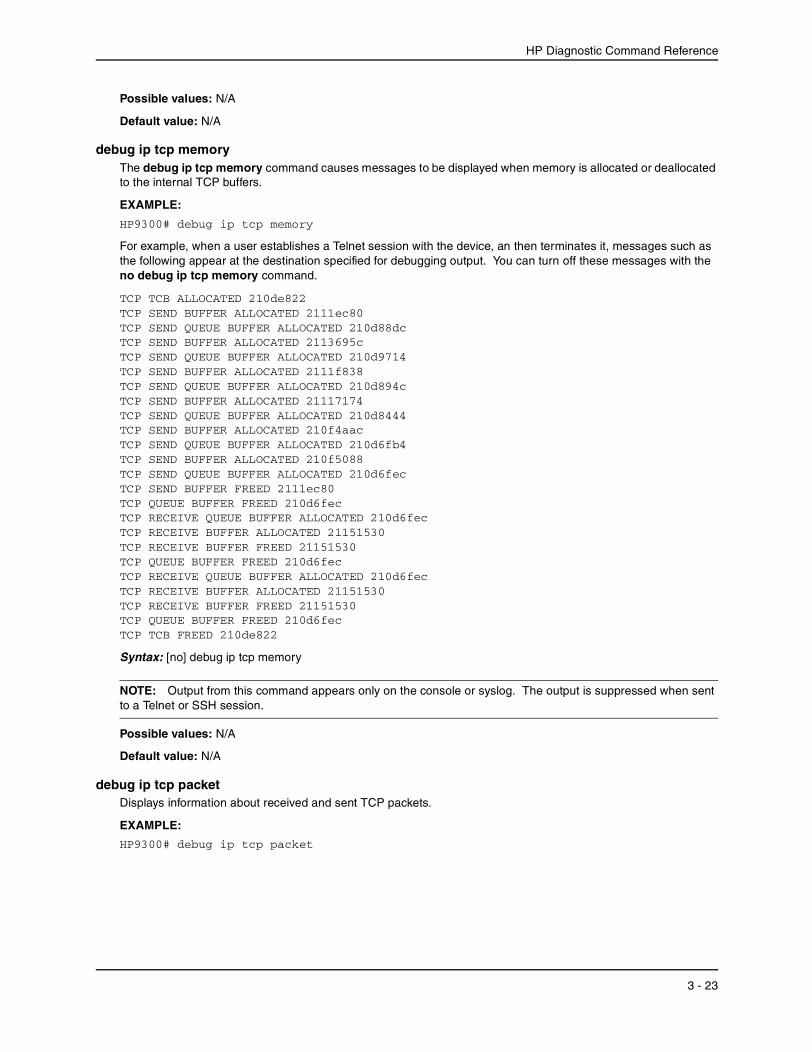
debug ip tcp memory The debug ip tcp memory command causes messages to be displayed when memory is allocated or deallocated to the internal TCP buffers.
EXAMPLE:
HP9300# debug ip tcp memory
For example, when a user establishes a Telnet session with the device, an then terminates it, messages such as the following appear at the destination specified for debugging output. You can turn off these messages with the no debug ip tcp memory command.
TCP TCB ALLOCATED 210de822TCP SEND BUFFER ALLOCATED 2111ec80TCP SEND QUEUE BUFFER ALLOCATED 210d88dcTCP SEND BUFFER ALLOCATED 2113695cTCP SEND QUEUE BUFFER ALLOCATED 210d9714TCP SEND BUFFER ALLOCATED 2111f838TCP SEND QUEUE BUFFER ALLOCATED 210d894cTCP SEND BUFFER ALLOCATED 21117174TCP SEND QUEUE BUFFER ALLOCATED 210d8444TCP SEND BUFFER ALLOCATED 210f4aacTCP SEND QUEUE BUFFER ALLOCATED 210d6fb4TCP SEND BUFFER ALLOCATED 210f5088TCP SEND QUEUE BUFFER ALLOCATED 210d6fecTCP SEND BUFFER FREED 2111ec80TCP QUEUE BUFFER FREED 210d6fecTCP RECEIVE QUEUE BUFFER ALLOCATED 210d6fecTCP RECEIVE BUFFER ALLOCATED 21151530TCP RECEIVE BUFFER FREED 21151530TCP QUEUE BUFFER FREED 210d6fecTCP RECEIVE QUEUE BUFFER ALLOCATED 210d6fecTCP RECEIVE BUFFER ALLOCATED 21151530TCP RECEIVE BUFFER FREED 21151530TCP QUEUE BUFFER FREED 210d6fecTCP TCB FREED 210de822
Syntax: [no] debug ip tcp memory
NOTE: Output from this command appears only on the console or syslog. The output is suppressed when sent to a Telnet or SSH session.
Possible values: N/A
Default value: N/A
debug ip tcp packet Displays information about received and sent TCP packets.
EXAMPLE:
HP9300# debug ip tcp packet
3 - 23
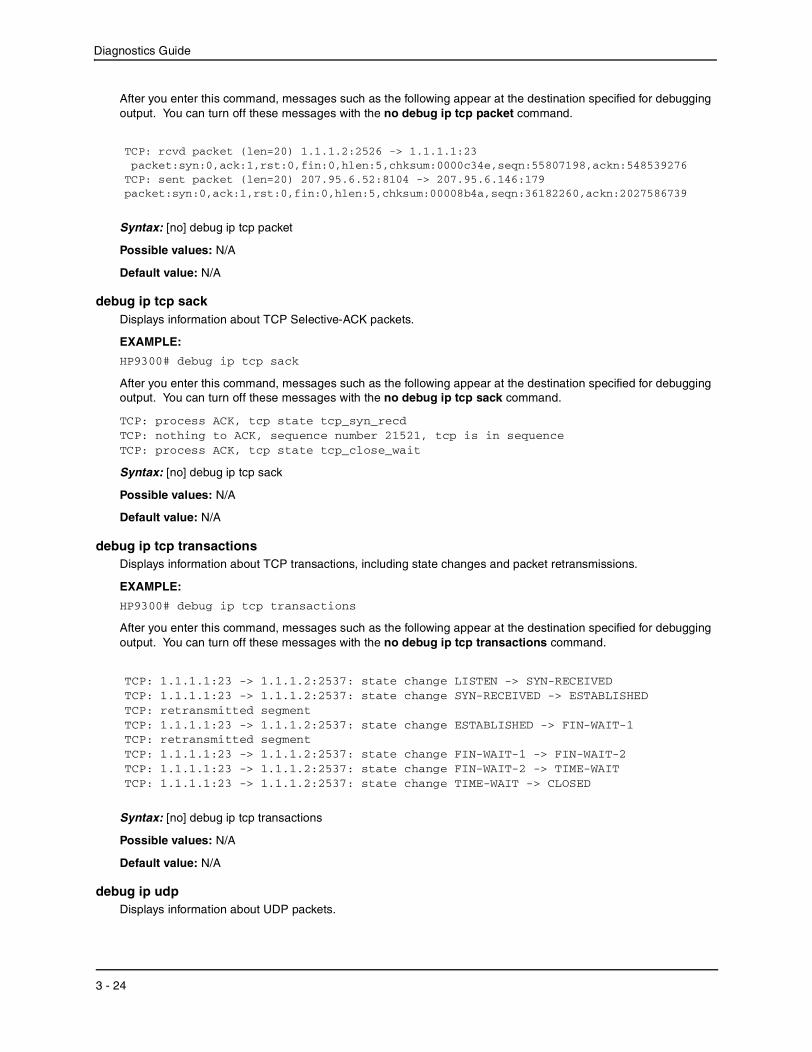
Diagnostics Guide
After you enter this command, messages such as the following appear at the destination specified for debugging output. You can turn off these messages with the no debug ip tcp packet command.
TCP: rcvd packet (len=20) 1.1.1.2:2526 -> 1.1.1.1:23 packet:syn:0,ack:1,rst:0,fin:0,hlen:5,chksum:0000c34e,seqn:55807198,ackn:548539276TCP: sent packet (len=20) 207.95.6.52:8104 -> 207.95.6.146:179packet:syn:0,ack:1,rst:0,fin:0,hlen:5,chksum:00008b4a,seqn:36182260,ackn:2027586739
Syntax: [no] debug ip tcp packet
Possible values: N/A
Default value: N/A
debug ip tcp sack Displays information about TCP Selective-ACK packets.
EXAMPLE:
HP9300# debug ip tcp sack
After you enter this command, messages such as the following appear at the destination specified for debugging output. You can turn off these messages with the no debug ip tcp sack command.
TCP: process ACK, tcp state tcp_syn_recdTCP: nothing to ACK, sequence number 21521, tcp is in sequenceTCP: process ACK, tcp state tcp_close_wait
Syntax: [no] debug ip tcp sack
Possible values: N/A
Default value: N/A
debug ip tcp transactions Displays information about TCP transactions, including state changes and packet retransmissions.
EXAMPLE:
HP9300# debug ip tcp transactions
After you enter this command, messages such as the following appear at the destination specified for debugging output. You can turn off these messages with the no debug ip tcp transactions command.
TCP: 1.1.1.1:23 -> 1.1.1.2:2537: state change LISTEN -> SYN-RECEIVEDTCP: 1.1.1.1:23 -> 1.1.1.2:2537: state change SYN-RECEIVED -> ESTABLISHEDTCP: retransmitted segmentTCP: 1.1.1.1:23 -> 1.1.1.2:2537: state change ESTABLISHED -> FIN-WAIT-1TCP: retransmitted segmentTCP: 1.1.1.1:23 -> 1.1.1.2:2537: state change FIN-WAIT-1 -> FIN-WAIT-2TCP: 1.1.1.1:23 -> 1.1.1.2:2537: state change FIN-WAIT-2 -> TIME-WAITTCP: 1.1.1.1:23 -> 1.1.1.2:2537: state change TIME-WAIT -> CLOSED
Syntax: [no] debug ip tcp transactions
Possible values: N/A
Default value: N/A
debug ip udp Displays information about UDP packets.
3 - 24
HP Diagnostic Command Reference
EXAMPLE:
HP9300# debug ip udp
After you enter this command, messages such as the following appear at the destination specified for debugging output. You can turn off these messages with the no debug ip udp command.
UDP: sent src 1.1.168.192(port 161) -> dest 181.1.168.192(port 162), length:71UDP: rcvd src 234.1.168.192(port 138) -> dest 255.1.168.192(port 138), length:209
Syntax: [no] debug ip udp
Possible values: N/A
Default value: N/A
debug ip vrrp events Displays information about VRRP events, such as when a backup router transitions to a master, a router transitions to a backup router, a VRID is deleted, or a VRRP packet is dropped.
EXAMPLE:
HP9300# debug ip vrrp events
After you enter this command, messages such as the following appear at the destination specified for debugging output. You can turn off these messages with the no debug ip vrrp events command.
TCP: 1.1.1.1:23 -> 1.1.1.2:2537: state change LISTEN -> SYN-RECEIVEDTCP: 1.1.1.1:23 -> 1.1.1.2:2537: state change SYN-RECEIVED -> ESTABLISHEDTCP: retransmitted segmentTCP: 1.1.1.1:23 -> 1.1.1.2:2537: state change ESTABLISHED -> FIN-WAIT-1TCP: retransmitted segmentTCP: 1.1.1.1:23 -> 1.1.1.2:2537: state change FIN-WAIT-1 -> FIN-WAIT-2TCP: 1.1.1.1:23 -> 1.1.1.2:2537: state change FIN-WAIT-2 -> TIME-WAITTCP: 1.1.1.1:23 -> 1.1.1.2:2537: state change TIME-WAIT -> CLOSED
Syntax: [no] debug ip vrrp events
Possible values: N/A
Default value: N/A
debug ip vrrp packet Displays information about VRRP packets and the IP addresses of backup routers.
EXAMPLE:
HP9300# debug ip vrrp packet
After you enter this command, messages such as the following appear at the destination specified for debugging output. You can turn off these messages with the no debug ip vrrp events command.
VRRP: rcvd ver:2 type:1 vrid:1 pri:255 #ip:1 aut:0 adv:1 chk:56825Num of ip addr 1
1.1.1.1 from sender 1.1.1.1VRRP: send advertise! ver:2 type:1 vrid:1 pri:255 #ip:1 aut:0 adv:1 chk:56825 Num of ip addr 11.1.1.1
3 - 25
Diagnostics Guide
Table 3.4 describes the contents of debug ip vrrp packet messages.
Table 3.4: Output from the debug ip vrrp packet command
This Field...
rcvd. or send
ver:
type:
vrid:
pri:
#ip:
aut:
adv:
chk:
Num of ip addr
Displays...
Indicates whether the packet was sent or received.
VRRP version; RFC 2338 defines version 2.
VRRP packet type. Possible packet types are:
1 Advertisement
Virtual Router Identifier.
Priority of the VRRP router.
The number of IP addresses contained in this VRRP advertisement.
VRRP authentication type. Possible authentication types are:
0 No authentication 1 Simple text password 2 IP Authentication Header
VRRP checksum.
Syntax: [no] debug ip vrrp packet
Possible values: N/A
Default value: N/A
debug spanning Displays information about BPDU packets.
EXAMPLE:
HP9300# debug spanning
After you enter this command, messages such as the following appear at the destination specified for debugging output. You can turn off these messages with the no debug spanning command.
ST: Port 2/1
[A] [B][C][D] [E] [F]0000 00 00 00 800000e052c37d40 00000000
[G] [H][I] [J] [K] [L] [M]800000e052c37d40 20 40 0000 0014 0002 000f
3 - 26
HP Diagnostic Command Reference
Table 3.5 describes the contents of debug spanning message. Note that the letters in brackets do not appear in the output.
Table 3.5: Output from the debug spanning command
This Field...
ST:
Port 2/1
[A] 0000
[B] 00
[C] 00
[D] 00
[E] 800000e052c37d40
[F] 00000000
[G] 800000e052c37d40
[H] 20
[I] 40
[J] 0000
[K] 0014
[L] 0002
[M] 000f
Displays...
Indicates that this is a spanning tree packet
Interface receiving the packet
Indicates that this is an IEEE BDPU packet.
Version number.
Command mode. This can be one of the following:
00 Config BPDU
80 Topology Change Notification BPDU
Acknowledgement of topology change. This can be one of the following:
00 No change
80 Change notification
Root ID.
Root path cost.
Bridge ID.
Port priority.
Port number.
Message age in 1/256 seconds.
Maximum age in 1/256 seconds.
Hello time in 1/256 seconds.
Forward delay in 1/256 seconds.
Syntax: [no] debug spanning
Possible values: N/A
Default value: N/A
mm Displays the contents of a specified address on every module.
3 - 27
Diagnostics Guide
EXAMPLE:
HP9300# mm 0190044c(4)0190044c: 0000 0000 0000 0000 0000 0000 0000 0000(4)0190045c: 0000 0000 0000 0000 0000 0000 0000 0000(4)0190046c: 0000 0000 0000 0000 0000 0000 0000 0000(4)0190047c: 0000 0000 0000 0000 0000 0000 0000 00001e90044c: 0000044c 00000450 00000454 000004581e90045c: 0000045c 00000460 00000464 000004681e90046c: 0000046c 00000470 00000474 000004781e90047c: 0000047c 00000480 00000484 00000488
Syntax: mm <address> [<length>]
Possible values: <length> can be up to 0x40 bytes.
Default value: If you do not specify the <length> parameter, 0x40 bytes are displayed.
phy Displays information about PHY registers for a specified port. This command can be useful for resolving problems with NIC adapters that have linking problems.
EXAMPLE:
HP9300# phy 4/11BCR reg 0, val = 1100BSR reg 1, val = 7809ID1 reg 2, val = 7810ID2 reg 3, val = 0043ANA reg 4, val = 01e1ANLPA reg 5, val = 0000ANE reg 6, val = 0000MR reg 16, val = 0c00IER reg 17, val = 0000ISR reg 18, val = 4000CR reg 19, val = 0000CSR reg 20, val = 048b
/* Register 1: Basic Status Register (PHY_BSR_R) */#define BSR_100BASE_T4 0x8000 #define BSR_100BASE_TX_FD 0x4000 #define BSR_100BASE_TX_HD 0x2000 #define BSR_10BASE_T_FD 0x1000 #define BSR_10BASE_T_HD 0x0800 #define BSR_AUTO_NEGO_DONE 0x0020 #define BSR_REMOTE_FAULT 0x0010 #define BSR_AUTO_NEGO_ABL 0x0008 #define BSR_LINK_UP 0x0004
/* Register 4: Auto-Negotiation Advertisement (PHY_ANA_R) */#define ANA_NEXT_PAGE 0x8000#define ANA_REMOTE_FAULT 0x2000#define ANA_100BASE_T4 0x0200#define ANA_100BASE_TX_FD 0x0100#define ANA_100BASE_TX 0x0080#define ANA_10BASE_T_FD 0x0040#define ANA_10BASE_T 0x0020#define ANA_SELECTOR_FIELD 0x001F
/* Register 5: Auto-Negotiation Link Partner Ability (PHY_ANLPA_R) */#define ANL_NEXT_PAGE 0x8000
3 - 28
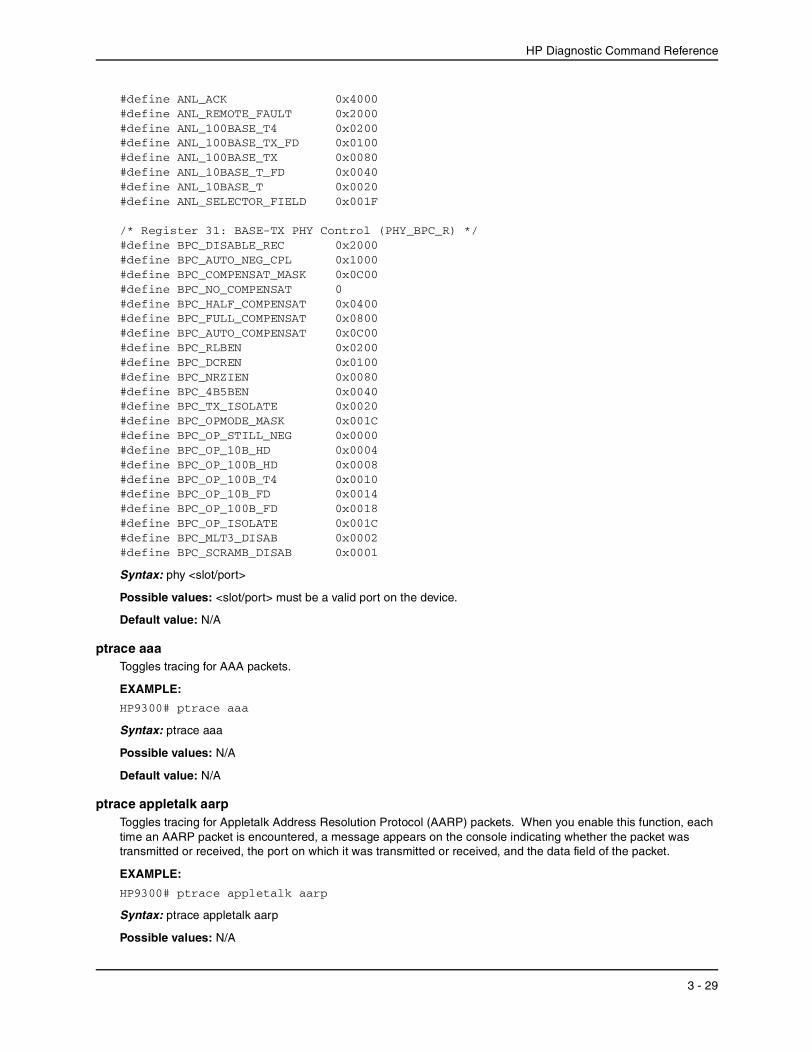
HP Diagnostic Command Reference
#define ANL_ACK 0x4000 #define ANL_REMOTE_FAULT 0x2000 #define ANL_100BASE_T4 0x0200 #define ANL_100BASE_TX_FD 0x0100 #define ANL_100BASE_TX 0x0080 #define ANL_10BASE_T_FD 0x0040 #define ANL_10BASE_T 0x0020 #define ANL_SELECTOR_FIELD 0x001F
/* Register 31: BASE-TX PHY Control (PHY_BPC_R) */#define BPC_DISABLE_REC 0x2000 #define BPC_AUTO_NEG_CPL 0x1000 #define BPC_COMPENSAT_MASK 0x0C00 #define BPC_NO_COMPENSAT 0 #define BPC_HALF_COMPENSAT 0x0400 #define BPC_FULL_COMPENSAT 0x0800 #define BPC_AUTO_COMPENSAT 0x0C00 #define BPC_RLBEN 0x0200 #define BPC_DCREN 0x0100 #define BPC_NRZIEN 0x0080 #define BPC_4B5BEN 0x0040 #define BPC_TX_ISOLATE 0x0020 #define BPC_OPMODE_MASK 0x001C #define BPC_OP_STILL_NEG 0x0000 #define BPC_OP_10B_HD 0x0004 #define BPC_OP_100B_HD 0x0008 #define BPC_OP_100B_T4 0x0010 #define BPC_OP_10B_FD 0x0014 #define BPC_OP_100B_FD 0x0018 #define BPC_OP_ISOLATE 0x001C #define BPC_MLT3_DISAB 0x0002 #define BPC_SCRAMB_DISAB 0x0001
Syntax: phy <slot/port>
Possible values: <slot/port> must be a valid port on the device.
Default value: N/A
ptrace aaa Toggles tracing for AAA packets.
EXAMPLE:
HP9300# ptrace aaa
Syntax: ptrace aaa
Possible values: N/A
Default value: N/A
ptrace appletalk aarp Toggles tracing for Appletalk Address Resolution Protocol (AARP) packets. When you enable this function, each time an AARP packet is encountered, a message appears on the console indicating whether the packet was transmitted or received, the port on which it was transmitted or received, and the data field of the packet.
EXAMPLE:
HP9300# ptrace appletalk aarp
Syntax: ptrace appletalk aarp
Possible values: N/A
3 - 29
Diagnostics Guide
Default value: N/A
ptrace appletalk aep Toggles tracing for Appletalk Echo Protocol (AEP) packets. When you enable this function, each time an AEP packet is encountered, a message appears on the console indicating whether the packet was transmitted or received, the port on which it was transmitted or received, and the contents of the packet’s Datagram Delivery Protocol (DDP) header.
EXAMPLE:
HP9300# ptrace appletalk aep
Syntax: ptrace appletalk aep
Possible values: N/A
Default value: N/A
ptrace appletalk nbp Toggles tracing for Appletalk Name Binding Protocol (NBP) packets. When you enable this function, each time an NBP packet is encountered, a message appears on the console indicating whether the packet was transmitted or received, the port on which it was transmitted or received, and the contents of the packet’s DDP header.
EXAMPLE:
HP9300# ptrace appletalk nbp
Syntax: ptrace appletalk nbp
Possible values: N/A
Default value: N/A
ptrace appletalk none Disables tracing for all Appletalk packets.
EXAMPLE:
HP9300# ptrace appletalk none
Syntax: ptrace appletalk none
Possible values: N/A
Default value: N/A
ptrace appletalk rtmp Toggles tracing for Appletalk Routing Table Maintenance Protocol (RTMP) packets. When you enable this function, each time an RTMP packet is encountered, a message appears on the console indicating whether the packet was transmitted or received, the port on which it was transmitted or received, and the contents of the packet’s DDP header.
EXAMPLE:
HP9300# ptrace appletalk rtmp
Syntax: ptrace appletalk rtmp
Possible values: N/A
Default value: N/A
ptrace appletalk states Toggles tracing for Appletalk state transition packets.
EXAMPLE:
HP9300# ptrace appletalk states
Syntax: ptrace appletalk states
3 - 30
HP Diagnostic Command Reference
Possible values: N/A
Default value: N/A
ptrace appletalk zip Toggles tracing for Appletalk Zone Information Protocol (ZIP) packets. When you enable this function, each time a ZIP packet is encountered, a message appears on the console indicating whether the packet was transmitted or received, the port on which it was transmitted or received, and the contents of the packet’s DDP header.
EXAMPLE:
HP9300# ptrace appletalk zip
Syntax: ptrace appletalk zip
Possible values: N/A
Default value: N/A
ptrace arp Toggles tracing for ARP packets.
EXAMPLE:
HP9300# ptrace arp
Syntax: ptrace arp
Possible values: N/A
Default value: N/A
ptrace bootp Toggles tracing for BOOTP packets.
EXAMPLE:
HP9300# ptrace bootp
Syntax: ptrace bootp
Possible values: N/A
Default value: N/A
ptrace dvmrp graft Toggles tracing for DVMRP graft packets.
EXAMPLE:
HP9300# ptrace dvmrp graft
Syntax: ptrace dvmrp graft
Possible values: N/A
Default value: N/A
ptrace dvmrp graft-ack Toggles tracing for DVMRP graft-ack packets.
EXAMPLE:
HP9300# ptrace dvmrp graft-ack
Syntax: ptrace dvmrp graft-ack
Possible values: N/A
Default value: N/A
3 - 31
Diagnostics Guide
ptrace dvmrp mcache Toggles tracing for DVMRP mcache packets.
EXAMPLE:
HP9300# ptrace dvmrp mcache
Syntax: ptrace dvmrp mcache
Possible values: N/A
Default value: N/A
ptrace dvmrp message Toggles tracing for DVMRP message packets.
EXAMPLE:
HP9300# ptrace dvmrp message
Syntax: ptrace dvmrp message
Possible values: N/A
Default value: N/A
ptrace dvmrp none Disables tracing for DVMRP packets.
EXAMPLE:
HP9300# ptrace dvmrp none
Syntax: ptrace dvmrp none
Possible values: N/A
Default value: N/A
ptrace dvmrp probe Toggles tracing for DVMRP probe packets.
EXAMPLE:
HP9300# ptrace dvmrp probe
Syntax: ptrace dvmrp probe
Possible values: N/A
Default value: N/A
ptrace dvmrp prune Toggles tracing for DVMRP prune packets.
EXAMPLE:
HP9300# ptrace dvmrp prune
Syntax: ptrace dvmrp prune
Possible values: N/A
Default value: N/A
ptrace dvmrp route-table Toggles tracing for DVMRP route-table packets.
EXAMPLE:
HP9300# ptrace dvmrp route-table
3 - 32
HP Diagnostic Command Reference
Syntax: ptrace dvmrp route-table
Possible values: N/A
Default value: N/A
ptrace icmp Toggles tracing for ICMP packets.
EXAMPLE:
HP9300# ptrace icmp
Syntax: ptrace icmp
Possible values: N/A
Default value: N/A
ptrace igmp Toggles tracing for IGMP packets.
EXAMPLE:
HP9300# ptrace igmp
Syntax: ptrace igmp
Possible values: N/A
Default value: N/A
ptrace ip Toggles tracing for IP packets.
EXAMPLE:
HP9300# ptrace ip
Syntax: ptrace ip
Possible values: N/A
Default value: N/A
ptrace none Disables all packet tracing.
EXAMPLE:
HP9300# ptrace none
Syntax: ptrace ip
Possible values: N/A
Default value: N/A
ptrace ospf Toggles tracing for OSPF packets.
EXAMPLE:
HP9300# ptrace ospf
Syntax: ptrace ospf
Possible values: N/A
Default value: N/A
3 - 33
Diagnostics Guide
ptrace pim fcache Toggles tracing for PIM fcache packets.
EXAMPLE:
HP9300# ptrace pim fcache
Syntax: ptrace pim fcache
Possible values: N/A
Default value: N/A
ptrace pim mcache Toggles tracing for PIM mcache packets.
EXAMPLE:
HP9300# ptrace pim mcache
Syntax: ptrace pim mcache
Possible values: N/A
Default value: N/A
ptrace pim message Toggles tracing for PIM message packets.
EXAMPLE:
HP9300# ptrace pim message
Syntax: ptrace pim message
Possible values: N/A
Default value: N/A
ptrace pim none Disables tracing for PIM packets.
EXAMPLE:
HP9300# ptrace pim none
Syntax: ptrace pim none
Possible values: N/A
Default value: N/A
ptrace ppp Toggles tracing for PPP packets.
EXAMPLE:
HP9300# ptrace ppp
Syntax: ptrace ppp
Possible values: N/A
Default value: N/A
ptrace rarp Toggles tracing for RARP packets.
EXAMPLE:
HP9300# ptrace rarp
3 - 34
HP Diagnostic Command Reference
Syntax: ptrace rarp
Possible values: N/A
Default value: N/A
ptrace rip Toggles tracing for RIP packets.
EXAMPLE:
HP9300# ptrace rip
Syntax: ptrace rip
Possible values: N/A
Default value: N/A
ptrace snmp Toggles tracing for SNMP packets.
EXAMPLE:
HP9300# ptrace snmp
Syntax: ptrace snmp
Possible values: N/A
Default value: N/A
ptrace switch none Disables packet tracing started with the ptrace switch stp command.
EXAMPLE:
HP9300# ptrace switch none
Syntax: ptrace switch none
Possible values: N/A
Default value: N/A
ptrace switch stp Toggles tracing for STP packets.
EXAMPLE:
HP9300# ptrace switch stp
Syntax: ptrace switch stp
Possible values: N/A
Default value: N/A
ptrace tcp Toggles tracing for TCP packets.
EXAMPLE:
HP9300# ptrace tcp
Syntax: ptrace tcp
Possible values: N/A
Default value: N/A
3 - 35
Diagnostics Guide
ptrace telnet Toggles tracing for Telnet packets.
EXAMPLE:
HP9300# ptrace telnet
Syntax: ptrace telnet
Possible values: N/A
Default value: N/A
ptrace term Sends packet tracing output to the current terminal.
EXAMPLE:
HP9300# ptrace termdebug output is now sent to this terminal
Syntax: ptrace term
Possible values: N/A
Default value: Packet tracing output is sent to the console by default.
ptrace tftp Toggles tracing for TFTP packets.
EXAMPLE:
HP9300# ptrace tftp
Syntax: ptrace tftp
Possible values: N/A
Default value: N/A
ptrace udp Toggles tracing for UDP packets.
EXAMPLE:
HP9300# ptrace udp
Syntax: ptrace udp
Possible values: N/A
Default value: N/A
show ip bgp debug Displays BGP debugging information for the router.
3 - 36
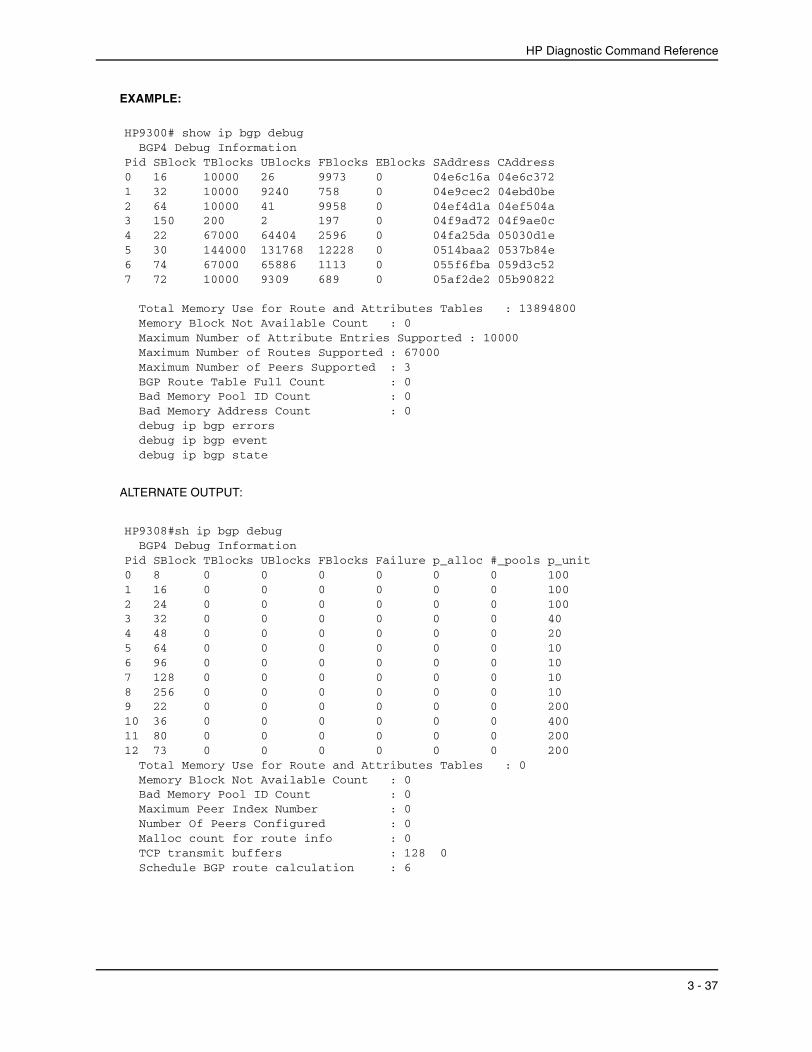
HP Diagnostic Command Reference
EXAMPLE:
HP9300# show ip bgp debug BGP4 Debug Information
Pid SBlock TBlocks UBlocks FBlocks EBlocks SAddress CAddress0 16 10000 26 9973 0 04e6c16a 04e6c3721 32 10000 9240 758 0 04e9cec2 04ebd0be2 64 10000 41 9958 0 04ef4d1a 04ef504a3 150 200 2 197 0 04f9ad72 04f9ae0c4 22 67000 64404 2596 0 04fa25da 05030d1e5 30 144000 131768 12228 0 0514baa2 0537b84e6 74 67000 65886 1113 0 055f6fba 059d3c527 72 10000 9309 689 0 05af2de2 05b90822
Total Memory Use for Route and Attributes Tables : 13894800 Memory Block Not Available Count : 0Maximum Number of Attribute Entries Supported : 10000 Maximum Number of Routes Supported : 67000 Maximum Number of Peers Supported : 3BGP Route Table Full Count : 0Bad Memory Pool ID Count : 0 Bad Memory Address Count : 0 debug ip bgp errors debug ip bgp event debug ip bgp state
ALTERNATE OUTPUT:
HP9308#sh ip bgp debug BGP4 Debug Information
Pid SBlock TBlocks UBlocks FBlocks Failure p_alloc #_pools p_unit0 8 0 0 0 0 0 0 100 1 16 0 0 0 0 0 0 100 2 24 0 0 0 0 0 0 100 3 32 0 0 0 0 0 0 40 4 48 0 0 0 0 0 0 20 5 64 0 0 0 0 0 0 10 6 96 0 0 0 0 0 0 10 7 128 0 0 0 0 0 0 10 8 256 0 0 0 0 0 0 10 9 22 0 0 0 0 0 0 200 10 36 0 0 0 0 0 0 400 11 80 0 0 0 0 0 0 200 12 73 0 0 0 0 0 0 200
Total Memory Use for Route and Attributes Tables : 0 Memory Block Not Available Count : 0Bad Memory Pool ID Count : 0 Maximum Peer Index Number : 0 Number Of Peers Configured : 0 Malloc count for route info : 0 TCP transmit buffers : 128 0 Schedule BGP route calculation : 6
3 - 37
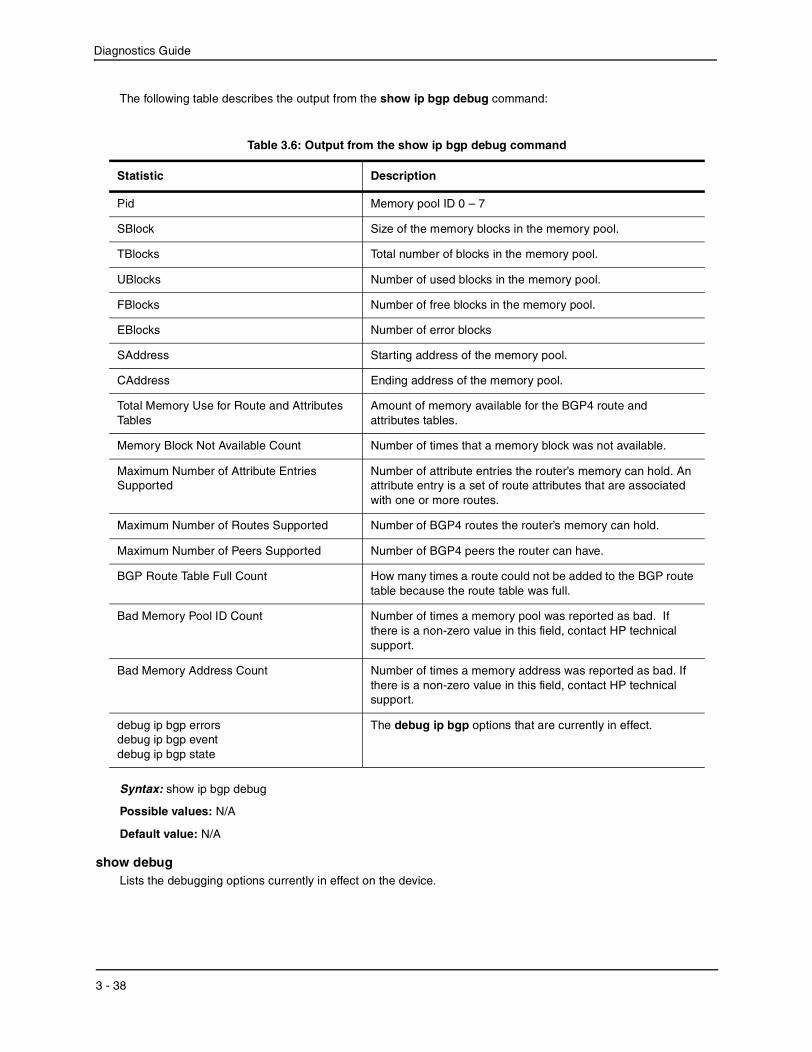
Diagnostics Guide
The following table describes the output from the show ip bgp debug command:
Table 3.6: Output from the show ip bgp debug command
Statistic
Pid
SBlock
TBlocks
UBlocks
FBlocks
EBlocks
SAddress
CAddress
Total Memory Use for Route and Attributes Tables
Memory Block Not Available Count Number of times that a memory block was not available.
Maximum Number of Attribute Entries Number of attribute entries the router’s memory can hold. An Supported attribute entry is a set of route attributes that are associated
with one or more routes.
Maximum Number of Routes Supported
Maximum Number of Peers Supported
BGP Route Table Full Count
Bad Memory Pool ID Count
Bad Memory Address Count
debug ip bgp errors debug ip bgp event debug ip bgp state
Description
Memory pool ID 0 – 7
Size of the memory blocks in the memory pool.
Total number of blocks in the memory pool.
Number of used blocks in the memory pool.
Number of free blocks in the memory pool.
Number of error blocks
Starting address of the memory pool.
Ending address of the memory pool.
Amount of memory available for the BGP4 route and attributes tables.
Number of BGP4 routes the router’s memory can hold.
Number of BGP4 peers the router can have.
How many times a route could not be added to the BGP route table because the route table was full.
Number of times a memory pool was reported as bad. If there is a non-zero value in this field, contact HP technical support.
Number of times a memory address was reported as bad. If there is a non-zero value in this field, contact HP technical support.
The debug ip bgp options that are currently in effect.
Syntax: show ip bgp debug
Possible values: N/A
Default value: N/A
show debug Lists the debugging options currently in effect on the device.
3 - 38
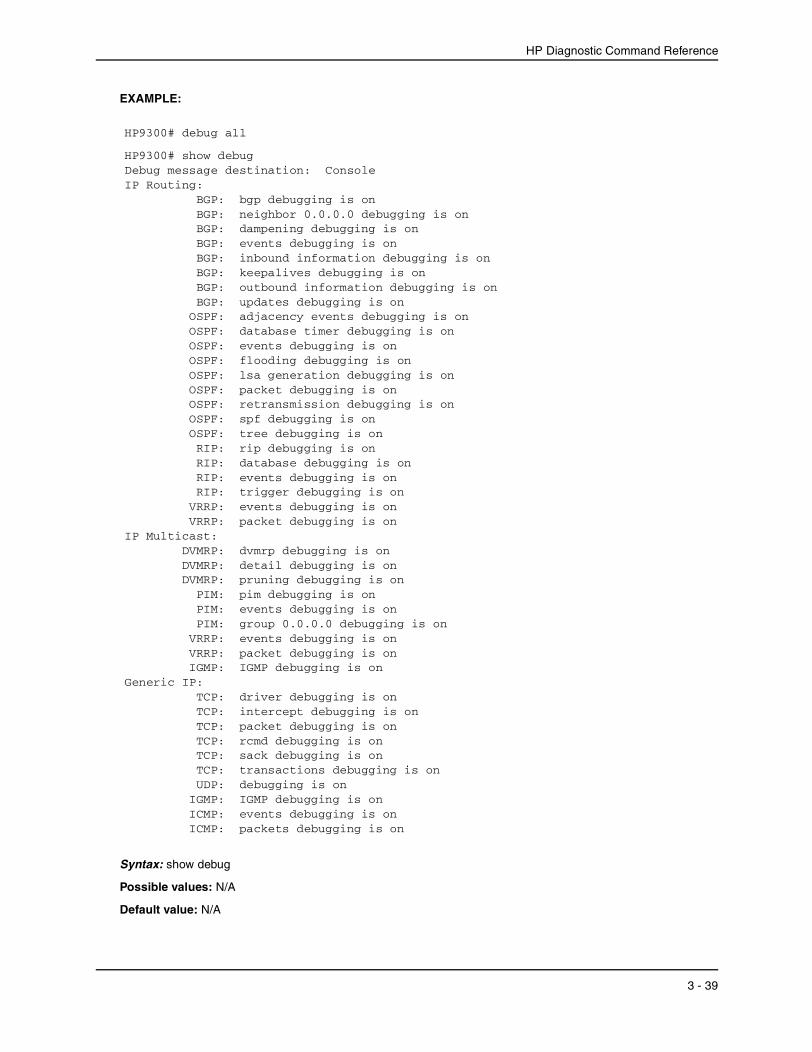
HP Diagnostic Command Reference
EXAMPLE:
HP9300# debug all
HP9300# show debugDebug message destination: ConsoleIP Routing:
BGP: bgp debugging is on BGP: neighbor 0.0.0.0 debugging is on BGP: dampening debugging is on
BGP: events debugging is on BGP: inbound information debugging is on
BGP: keepalives debugging is on BGP: outbound information debugging is on BGP: updates debugging is on
OSPF: adjacency events debugging is on OSPF: database timer debugging is on OSPF: events debugging is on OSPF: flooding debugging is on OSPF: lsa generation debugging is on OSPF: packet debugging is on OSPF: retransmission debugging is on OSPF: spf debugging is on OSPF: tree debugging is on RIP: rip debugging is on
RIP: database debugging is on RIP: events debugging is on RIP: trigger debugging is on
VRRP: events debugging is on VRRP: packet debugging is on
IP Multicast: DVMRP: dvmrp debugging is on
DVMRP: detail debugging is on DVMRP: pruning debugging is on
PIM: pim debugging is on PIM: events debugging is on PIM: group 0.0.0.0 debugging is on
VRRP: events debugging is on VRRP: packet debugging is on IGMP: IGMP debugging is on
Generic IP: TCP: driver debugging is on TCP: intercept debugging is on
TCP: packet debugging is on TCP: rcmd debugging is on TCP: sack debugging is on TCP: transactions debugging is on UDP: debugging is on
IGMP: IGMP debugging is on ICMP: events debugging is on ICMP: packets debugging is on
Syntax: show debug
Possible values: N/A
Default value: N/A
3 - 39

Diagnostics Guide
3 - 40
Chapter 4 Using the Backplane Debugging Commands
For debugging purposes, you can monitor information about the backplane hardware on a Chassis device. When the backplane debugging feature is enabled, every 30 seconds the device checks the following counters: SMC DMA Drop counters (DMADrop), SMC Backplane Drop counters (BPDrop), BM Free Queue Depth counters (FreeDepth), and BM Write Sequence Drop counters (WriteDrop). The device generates a Syslog message when any of the following conditions are true:
• DMADrop count is non-zero
• BPDrop count is non-zero
• WriteDrop count is greater than or equal to 1,500 increments per 30 seconds
• If the queue depth indicated by the FreeDepth counters is 120 less than the management module’s approximate maximum free queue depth for 3 consecutive measurements.
• On T-Flow Redundant Management Module, the maximum free queue depth is approximately 4000.
• On Management 4 modules, the maximum free queue depth is approximately 3960.
• On Management 1 and Management 2, the maximum free queue depth is approximately 890.
4 - 1
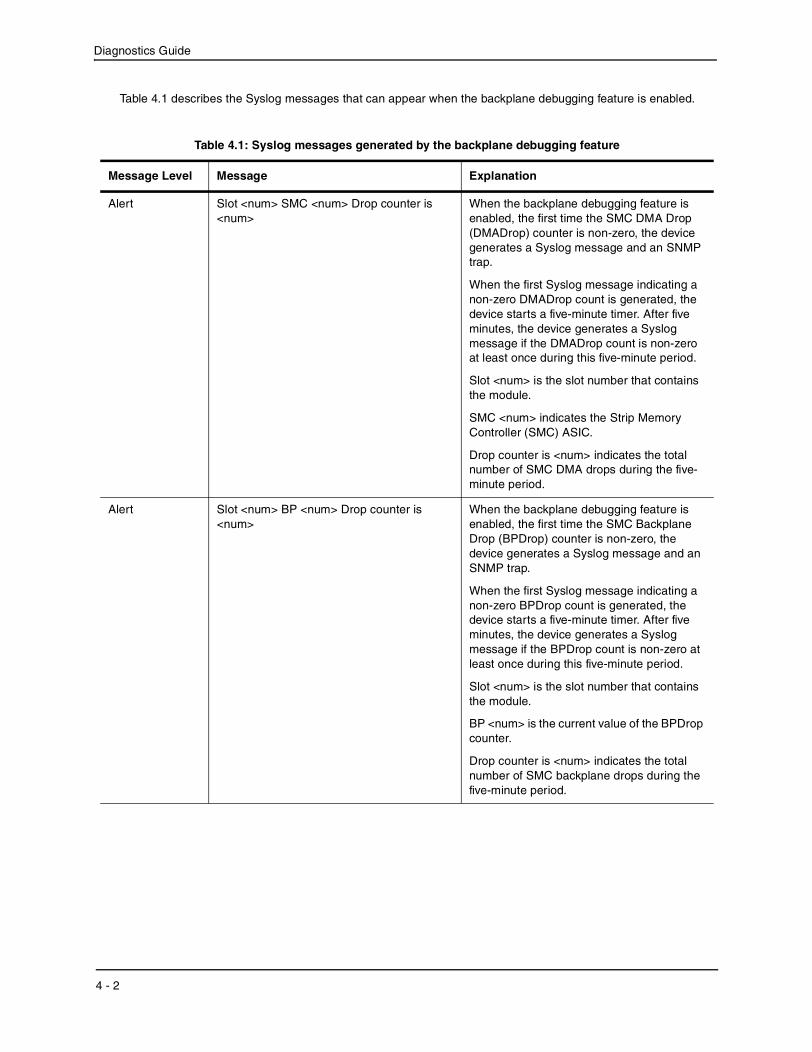
Diagnostics Guide
Table 4.1 describes the Syslog messages that can appear when the backplane debugging feature is enabled.
Table 4.1: Syslog messages generated by the backplane debugging feature
Message Level Message Explanation
Alert Slot <num> SMC <num> Drop counter is <num>
When the backplane debugging feature is enabled, the first time the SMC DMA Drop (DMADrop) counter is non-zero, the device generates a Syslog message and an SNMP trap.
When the first Syslog message indicating a non-zero DMADrop count is generated, the device starts a five-minute timer. After five minutes, the device generates a Syslog message if the DMADrop count is non-zero at least once during this five-minute period.
Slot <num> is the slot number that contains the module.
SMC <num> indicates the Strip Memory Controller (SMC) ASIC.
Drop counter is <num> indicates the total number of SMC DMA drops during the fiveminute period.
Alert Slot <num> BP <num> Drop counter is <num>
When the backplane debugging feature is enabled, the first time the SMC Backplane Drop (BPDrop) counter is non-zero, the device generates a Syslog message and an SNMP trap.
When the first Syslog message indicating a non-zero BPDrop count is generated, the device starts a five-minute timer. After five minutes, the device generates a Syslog message if the BPDrop count is non-zero at least once during this five-minute period.
Slot <num> is the slot number that contains the module.
BP <num> is the current value of the BPDrop counter.
Drop counter is <num> indicates the total number of SMC backplane drops during the five-minute period.
4 - 2
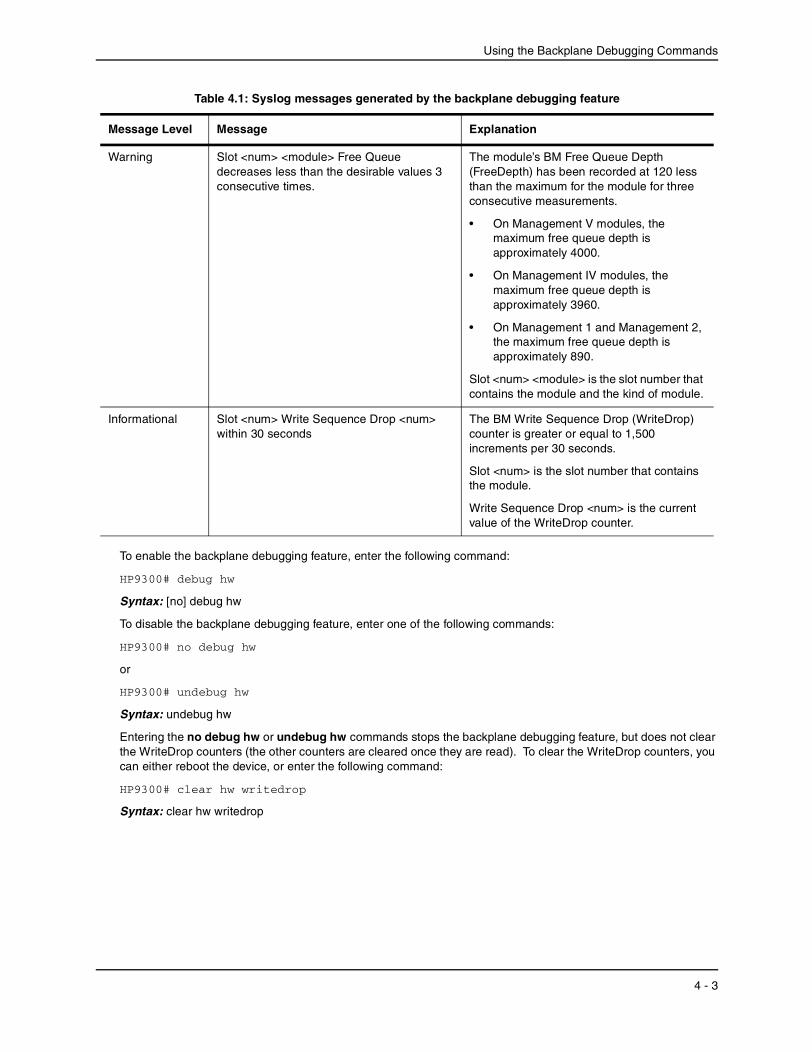
Using the Backplane Debugging Commands
Table 4.1: Syslog messages generated by the backplane debugging feature
Message Level Message Explanation
Warning Slot <num> <module> Free Queue decreases less than the desirable values 3 consecutive times.
The module’s BM Free Queue Depth (FreeDepth) has been recorded at 120 less than the maximum for the module for three consecutive measurements.
• On Management V modules, the maximum free queue depth is approximately 4000.
• On Management IV modules, the maximum free queue depth is approximately 3960.
• On Management 1 and Management 2, the maximum free queue depth is approximately 890.
Slot <num> <module> is the slot number that contains the module and the kind of module.
Informational Slot <num> Write Sequence Drop <num> within 30 seconds
The BM Write Sequence Drop (WriteDrop) counter is greater or equal to 1,500 increments per 30 seconds.
Slot <num> is the slot number that contains the module.
Write Sequence Drop <num> is the current value of the WriteDrop counter.
To enable the backplane debugging feature, enter the following command:
HP9300# debug hw
Syntax: [no] debug hw
To disable the backplane debugging feature, enter one of the following commands:
HP9300# no debug hw
or
HP9300# undebug hw
Syntax: undebug hw
Entering the no debug hw or undebug hw commands stops the backplane debugging feature, but does not clear the WriteDrop counters (the other counters are cleared once they are read). To clear the WriteDrop counters, you can either reboot the device, or enter the following command:
HP9300# clear hw writedrop
Syntax: clear hw writedrop
4 - 3
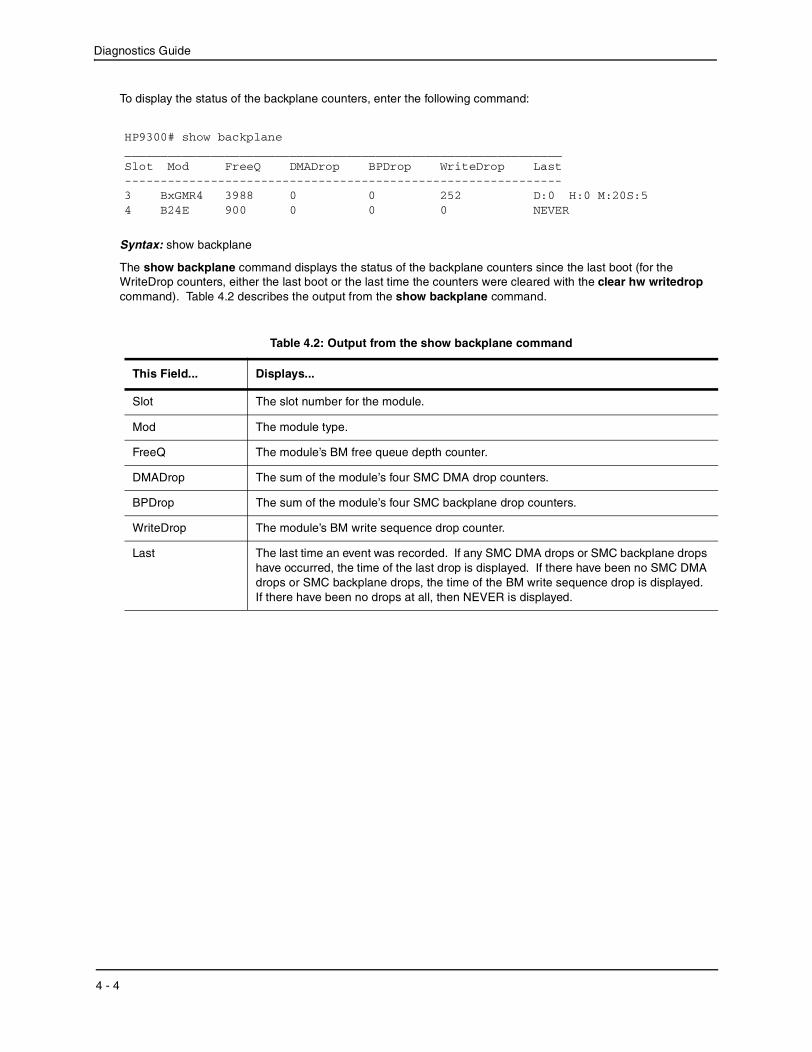
Diagnostics Guide
_____________________________________________________________
-------------------------------------------------------------
To display the status of the backplane counters, enter the following command:
HP9300# show backplane
Slot Mod FreeQ DMADrop BPDrop WriteDrop Last
3 BxGMR4 3988 0 0 252 D:0 H:0 M:20S:54 B24E 900 0 0 0 NEVER
Syntax: show backplane
The show backplane command displays the status of the backplane counters since the last boot (for the WriteDrop counters, either the last boot or the last time the counters were cleared with the clear hw writedrop command). Table 4.2 describes the output from the show backplane command.
Table 4.2: Output from the show backplane command
This Field...
Slot
Mod
FreeQ
DMADrop
BPDrop
WriteDrop
Last
Displays...
The slot number for the module.
The module type.
The module’s BM free queue depth counter.
The sum of the module’s four SMC DMA drop counters.
The sum of the module’s four SMC backplane drop counters.
The module’s BM write sequence drop counter.
The last time an event was recorded. If any SMC DMA drops or SMC backplane drops have occurred, the time of the last drop is displayed. If there have been no SMC DMA drops or SMC backplane drops, the time of the BM write sequence drop is displayed. If there have been no drops at all, then NEVER is displayed.
4 - 4
Chapter 5 Changing CAM Partitions
You can adjust the percentage of a module’s CAM that can store Layer 2, Layer 3, or Layer 4 entries. In releases prior to 07.6.01b, CAM partitioning was not configurable. Starting in release 07.6.01b, you can specify the percentage of CAM assigned to each of the CAM entry types, both on a global and per-module basis. After you reboot the HP device, the user-specified CAM partitions take effect.
This chapter is divided into the following sections:
• “CAM Overview” below
• “Using the CLI to Configure CAM Partitioning” on page 5-2
• “Displaying CAM Partitioning Information” on page 5-4
CAM Overview Content Addressable Memory (CAM) is a component of HP modules that facilitates hardware forwarding. As packets flow through the HP device from a given source to a given destination, the management processor records forwarding information about the flow in CAM entries. A CAM entry generally contains next-hop information, such as the outgoing port, the MAC address of the next-hop router, VLAN tag, and so on. Once the HP device has this information in its CAM, packets with the same source and destination can be forwarded by hardware without the aid of the management processor, speeding up forwarding time.
CAM entries can contain Layer 2, Layer 3, or Layer 4 information. Each type of CAM entry has its own format. Layer 2 CAM entries contain destination MAC information; Layer 3 CAM entries contain destination IP information; Layer 4 CAM entries contain destination IP, destination TCP/UDP port, source IP, and source TCP/UDP port information. Layer 2 entries also deal with 802.1p (priority), and VLAN information.
When the HP device is initialized, the software partitions the available CAM into segments for Layer 2, Layer 3, or Layer 4 information. The percentage of CAM devoted to each type of CAM entry depends on the software image running on the device. For example, Routing Switch software may assign a percentage of CAM to Layer 3 and a percentage to Layer 2/4.
On HP 9300 series routers, the CAM lookup mechanism involves longest prefix match with up to three levels of overlapping prefixes. The Layer 3 CAM partition on these devices is divided into three levels of “supernet” host routes, designated Level1, Level2, and Level3. For Layer 3 IP network routes, Level1 routes precede Level2 routes, and Level2 routes precede Level3 routes. For example, given three routes to program into the CAM, 110.23.24.0/24, 110.23.0.0/16 and 110.0.0.0/8, the device programs 110.23.24.0/24 in Level1, 110.23.0.0/16 in Level2, and 110.0.0.0/8 in Level3.
The Layer 4 CAM partition is divided into four pools, designated Pool0, Pool1, Pool2, and Pool3. Pools 1 – 3 store Layer 4 session CAM entries. When no match for an IP packet is found in Pools 1 – 3, an entry for the packet is made in Pool0. IP packets with CAM entries in Pool0 are sent to the CPU. By default, entries for all packet types
5 - 1
Diagnostics Guide
except TCP are programmed into Pool0. When strict ACL TCP mode is enabled (with the ip strict-acl-tcp command) TCP packets are also programmed into Pool0.
CAM partitioning also depends on the device type and module used: HP 9300 series deviceshave different amounts of CAM available, and Standard (non-EP), Enhanced Performance, and 10 Gigabit Ethernet modules use different CAM partitioning mechanisms. The following sections list the CAM entry size, amount of CAM, and default CAM partition size for each of these modules for software images.
CAM Partitioning on Standard Modules In the Standard architecture, all CAM entries are 64-bits wide, regardless of type.
HP 9300 series Gigabit modules have 1 Mbit of CAM for each set of four ports, for a total of 2 Mbits. B24E modules have 1 Mbit of CAM for all 24 ports.
For router software images, the default CAM partition is 50 percent Layer 2 entries and 50 percent Layer 3 entries. In unicast high-performance mode (the default for release 7.5.04 and above) the CAM partition is 75 percent Layer 3 entries and 25 percent Layer 2 entries. On Standard modules, Layer 4 CAM entries are part of the Layer 2 partition.
CAM Partitioning on Enhanced Performance Modules On EP modules, CAM entries can be 64 bits (for Layer 2 entries) 64 bits (for Layer 3 entries), or 128 bits (for Layer 4 entries). Each 64-bit Layer 3 CAM entry contains two 32-bit IP route entries.
EP module ports are managed by two kinds of custom ASICs:
• Integrated Gigabit Controllers (IGCs) – Ethernet packet controllers for Gigabit ports. Each Gigabit Ethernet module contains two IGCs.
• Integrated Packet Controllers (IPCs) – Ethernet packet controllers for 10/100 ports. Each 10/100 Ethernet module contains two IPCs.
Each IGC or IPC has its own CAM space. An IPC or IGC has 2 Mbits for HP 9300 series modules. A J-BxG module has 4 Mbits of CAM, a J-FI48E module has 2 Mbits, and a J-B16GC module has 8Mbits.
For router software images, the default CAM partition is 50 percent Layer 3 entries, 25 percent Layer 2 entries, and 25 percent Layer 4 entries. Note that these percentages refer to the amount of CAM space allotted to each type of CAM entry, not to the actual number of CAM entries, since on EP modules CAM entries of different types can be different sizes.
CAM Partitioning on 10 Gigabit Ethernet Modules As with other EP modules, CAM entries on 10 Gigabit Ethernet modules are 64 bits (for Layer 2 entries) 64 bits (for Layer 3 entries), or 128 bits (for Layer 4 entries). Unlike the other EP modules, 10 Gigabit Ethernet modules have two CAM banks of 4 Mbits each. One CAM bank is used for Layer 2 destination address entries and Layer 3 entries, and the other CAM bank is used for Layer 2 source address entries and Layer 4 entries.
The amount of CAM space allotted to Layer 2 source address entries must be equal to the amount allotted to Layer 2 destination address entries. Consequently, if you increase the amount of Layer 2 CAM space, it will reduce the amount of CAM space for both Layer 3 and Layer 4 entries.
For router software images, one bank of CAM is divided into 25 percent Layer 2 destination address entries and 75 percent Layer 3 entries. The other CAM bank is divided into 25 percent Layer 2 source address entries and 75 percent Layer 4 entries.
Using the CLI to Configure CAM Partitioning You can configure CAM partitioning on a global or per-module basis. On a Routing Switch image, you can specify percentages for Layer 2, Layer 3, and Layer 4 CAM entries.
5 - 2
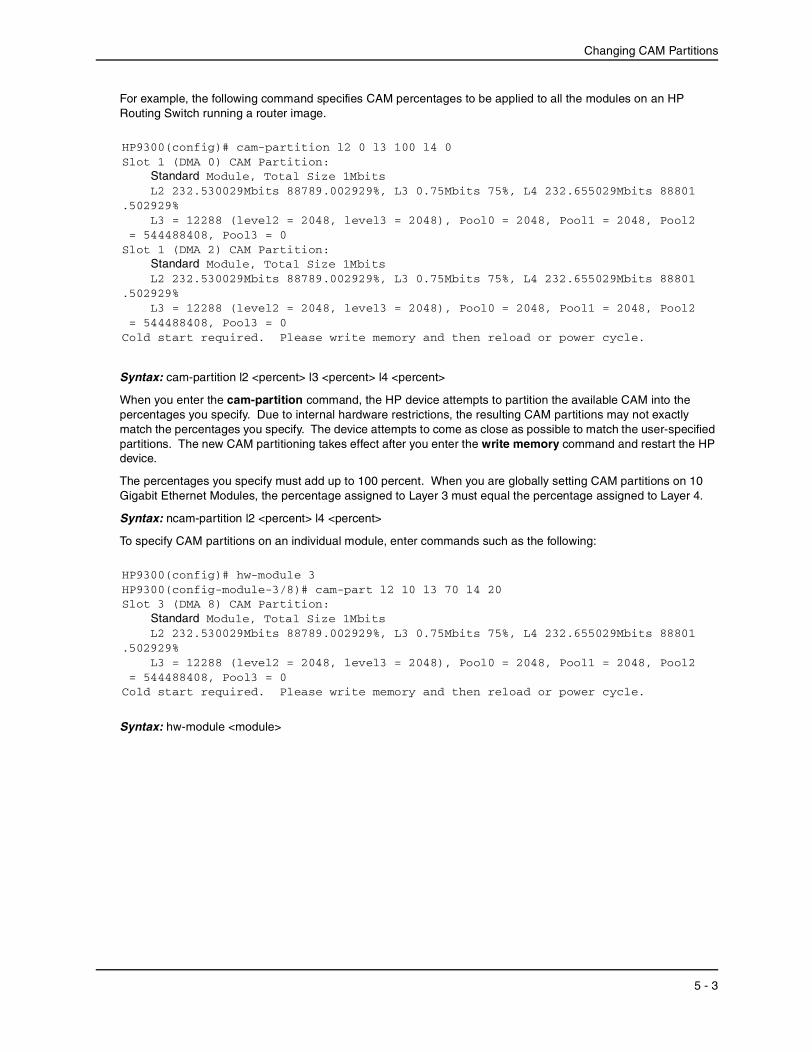
Changing CAM Partitions
For example, the following command specifies CAM percentages to be applied to all the modules on an HP Routing Switch running a router image.
HP9300(config)# cam-partition l2 0 l3 100 l4 0Slot 1 (DMA 0) CAM Partition:
Standard Module, Total Size 1Mbits L2 232.530029Mbits 88789.002929%, L3 0.75Mbits 75%, L4 232.655029Mbits 88801
.502929% L3 = 12288 (level2 = 2048, level3 = 2048), Pool0 = 2048, Pool1 = 2048, Pool2
= 544488408, Pool3 = 0Slot 1 (DMA 2) CAM Partition:
Standard Module, Total Size 1Mbits L2 232.530029Mbits 88789.002929%, L3 0.75Mbits 75%, L4 232.655029Mbits 88801
.502929% L3 = 12288 (level2 = 2048, level3 = 2048), Pool0 = 2048, Pool1 = 2048, Pool2
= 544488408, Pool3 = 0Cold start required. Please write memory and then reload or power cycle.
Syntax: cam-partition l2 <percent> l3 <percent> l4 <percent>
When you enter the cam-partition command, the HP device attempts to partition the available CAM into the percentages you specify. Due to internal hardware restrictions, the resulting CAM partitions may not exactly match the percentages you specify. The device attempts to come as close as possible to match the user-specified partitions. The new CAM partitioning takes effect after you enter the write memory command and restart the HP device.
The percentages you specify must add up to 100 percent. When you are globally setting CAM partitions on 10 Gigabit Ethernet Modules, the percentage assigned to Layer 3 must equal the percentage assigned to Layer 4.
Syntax: ncam-partition l2 <percent> l4 <percent>
To specify CAM partitions on an individual module, enter commands such as the following:
HP9300(config)# hw-module 3HP9300(config-module-3/8)# cam-part l2 10 l3 70 l4 20Slot 3 (DMA 8) CAM Partition:
Standard Module, Total Size 1Mbits L2 232.530029Mbits 88789.002929%, L3 0.75Mbits 75%, L4 232.655029Mbits 88801
.502929% L3 = 12288 (level2 = 2048, level3 = 2048), Pool0 = 2048, Pool1 = 2048, Pool2
= 544488408, Pool3 = 0 Cold start required. Please write memory and then reload or power cycle.
Syntax: hw-module <module>
5 - 3
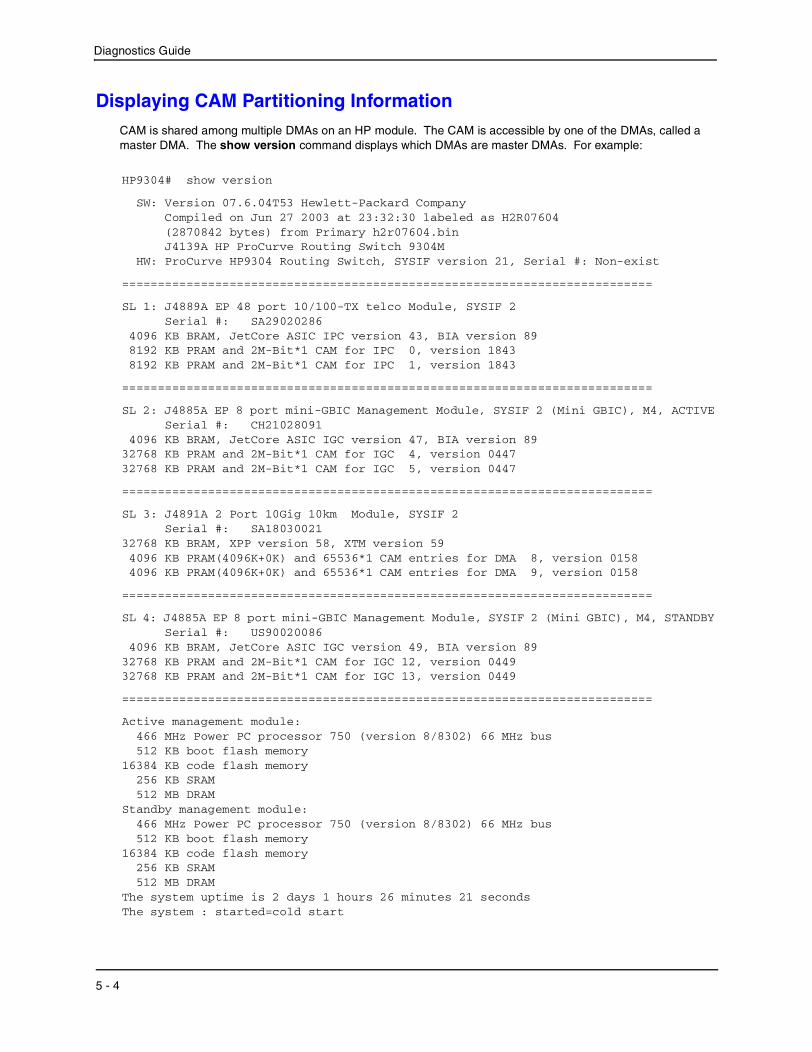
Diagnostics Guide
Displaying CAM Partitioning Information CAM is shared among multiple DMAs on an HP module. The CAM is accessible by one of the DMAs, called a master DMA. The show version command displays which DMAs are master DMAs. For example:
HP9304# show version
SW: Version 07.6.04T53 Hewlett-Packard Company Compiled on Jun 27 2003 at 23:32:30 labeled as H2R07604 (2870842 bytes) from Primary h2r07604.bin J4139A HP ProCurve Routing Switch 9304M
HW: ProCurve HP9304 Routing Switch, SYSIF version 21, Serial #: Non-exist
==========================================================================
SL 1: J4889A EP 48 port 10/100-TX telco Module, SYSIF 2 Serial #: SA29020286
4096 KB BRAM, JetCore ASIC IPC version 43, BIA version 89 8192 KB PRAM and 2M-Bit*1 CAM for IPC 0, version 1843 8192 KB PRAM and 2M-Bit*1 CAM for IPC 1, version 1843
==========================================================================
SL 2: J4885A EP 8 port mini-GBIC Management Module, SYSIF 2 (Mini GBIC), M4, ACTIVE Serial #: CH21028091
4096 KB BRAM, JetCore ASIC IGC version 47, BIA version 8932768 KB PRAM and 2M-Bit*1 CAM for IGC 4, version 044732768 KB PRAM and 2M-Bit*1 CAM for IGC 5, version 0447
==========================================================================
SL 3: J4891A 2 Port 10Gig 10km Module, SYSIF 2 Serial #: SA18030021
32768 KB BRAM, XPP version 58, XTM version 59 4096 KB PRAM(4096K+0K) and 65536*1 CAM entries for DMA 8, version 0158 4096 KB PRAM(4096K+0K) and 65536*1 CAM entries for DMA 9, version 0158
==========================================================================
SL 4: J4885A EP 8 port mini-GBIC Management Module, SYSIF 2 (Mini GBIC), M4, STANDBY Serial #: US90020086
4096 KB BRAM, JetCore ASIC IGC version 49, BIA version 8932768 KB PRAM and 2M-Bit*1 CAM for IGC 12, version 044932768 KB PRAM and 2M-Bit*1 CAM for IGC 13, version 0449
==========================================================================
Active management module:466 MHz Power PC processor 750 (version 8/8302) 66 MHz bus512 KB boot flash memory
16384 KB code flash memory256 KB SRAM512 MB DRAM
Standby management module:466 MHz Power PC processor 750 (version 8/8302) 66 MHz bus512 KB boot flash memory
16384 KB code flash memory256 KB SRAM512 MB DRAM
The system uptime is 2 days 1 hours 26 minutes 21 secondsThe system : started=cold start
5 - 4
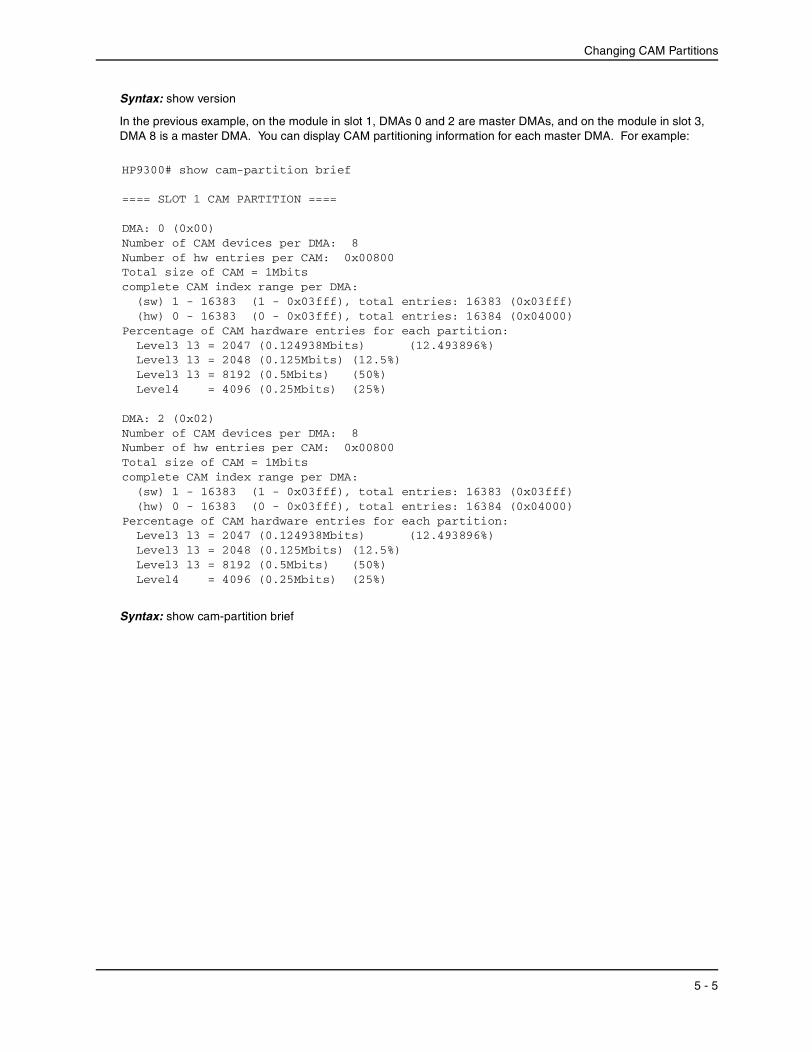
Changing CAM Partitions
Syntax: show version
In the previous example, on the module in slot 1, DMAs 0 and 2 are master DMAs, and on the module in slot 3, DMA 8 is a master DMA. You can display CAM partitioning information for each master DMA. For example:
HP9300# show cam-partition brief
==== SLOT 1 CAM PARTITION ====
DMA: 0 (0x00)Number of CAM devices per DMA: 8Number of hw entries per CAM: 0x00800Total size of CAM = 1Mbitscomplete CAM index range per DMA: (sw) 1 - 16383 (1 - 0x03fff), total entries: 16383 (0x03fff) (hw) 0 - 16383 (0 - 0x03fff), total entries: 16384 (0x04000)Percentage of CAM hardware entries for each partition:
Level3 l3 = 2047 (0.124938Mbits) (12.493896%)Level3 l3 = 2048 (0.125Mbits) (12.5%)Level3 l3 = 8192 (0.5Mbits) (50%)Level4 = 4096 (0.25Mbits) (25%)
DMA: 2 (0x02)Number of CAM devices per DMA: 8Number of hw entries per CAM: 0x00800Total size of CAM = 1Mbitscomplete CAM index range per DMA: (sw) 1 - 16383 (1 - 0x03fff), total entries: 16383 (0x03fff) (hw) 0 - 16383 (0 - 0x03fff), total entries: 16384 (0x04000)Percentage of CAM hardware entries for each partition:
Level3 l3 = 2047 (0.124938Mbits) (12.493896%)Level3 l3 = 2048 (0.125Mbits) (12.5%)Level3 l3 = 8192 (0.5Mbits) (50%)Level4 = 4096 (0.25Mbits) (25%)
Syntax: show cam-partition brief
5 - 5
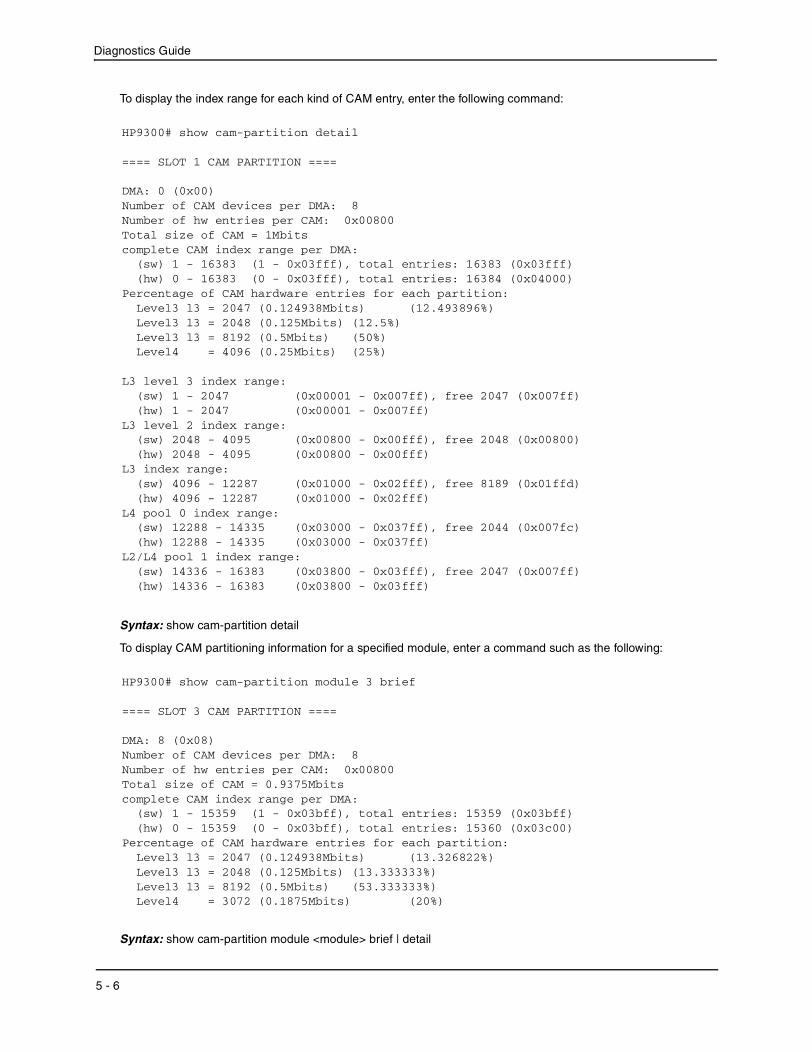
Diagnostics Guide
To display the index range for each kind of CAM entry, enter the following command:
HP9300# show cam-partition detail
==== SLOT 1 CAM PARTITION ====
DMA: 0 (0x00)Number of CAM devices per DMA: 8Number of hw entries per CAM: 0x00800Total size of CAM = 1Mbitscomplete CAM index range per DMA: (sw) 1 - 16383 (1 - 0x03fff), total entries: 16383 (0x03fff) (hw) 0 - 16383 (0 - 0x03fff), total entries: 16384 (0x04000)Percentage of CAM hardware entries for each partition:
Level3 l3 = 2047 (0.124938Mbits) (12.493896%)Level3 l3 = 2048 (0.125Mbits) (12.5%)Level3 l3 = 8192 (0.5Mbits) (50%)Level4 = 4096 (0.25Mbits) (25%)
L3 level 3 index range:(sw) 1 - 2047 (0x00001 - 0x007ff), free 2047 (0x007ff)
(hw) 1 - 2047 (0x00001 - 0x007ff)L3 level 2 index range:
(sw) 2048 - 4095 (0x00800 - 0x00fff), free 2048 (0x00800)(hw) 2048 - 4095 (0x00800 - 0x00fff)
L3 index range:(sw) 4096 - 12287 (0x01000 - 0x02fff), free 8189 (0x01ffd)(hw) 4096 - 12287 (0x01000 - 0x02fff)
L4 pool 0 index range: (sw) 12288 - 14335 (0x03000 - 0x037ff), free 2044 (0x007fc) (hw) 12288 - 14335 (0x03000 - 0x037ff)L2/L4 pool 1 index range: (sw) 14336 - 16383 (0x03800 - 0x03fff), free 2047 (0x007ff) (hw) 14336 - 16383 (0x03800 - 0x03fff)
Syntax: show cam-partition detail
To display CAM partitioning information for a specified module, enter a command such as the following:
HP9300# show cam-partition module 3 brief
==== SLOT 3 CAM PARTITION ====
DMA: 8 (0x08)Number of CAM devices per DMA: 8Number of hw entries per CAM: 0x00800Total size of CAM = 0.9375Mbitscomplete CAM index range per DMA: (sw) 1 - 15359 (1 - 0x03bff), total entries: 15359 (0x03bff) (hw) 0 - 15359 (0 - 0x03bff), total entries: 15360 (0x03c00)Percentage of CAM hardware entries for each partition:
Level3 l3 = 2047 (0.124938Mbits) (13.326822%)Level3 l3 = 2048 (0.125Mbits) (13.333333%)Level3 l3 = 8192 (0.5Mbits) (53.333333%)Level4 = 3072 (0.1875Mbits) (20%)
Syntax: show cam-partition module <module> brief | detail
5 - 6


© 2000, 2003 Hewlett-Packard Development Company, LP. The information contained herein is subject to change without notice.
Edition 1, September 2003 Manual Part Number 5990-6032