Embed Size (px)
Citation preview

Bull. Org. mond. Sante 1960, 22, 263-272Bull. Wld Hlth Org.
Human and Animal Antibody Responsesto Commercial Poliomyelitis Vaccine
U. PENTTI KOKKO, M.D., Dr.P.H.' & RODERICK MURRAY, M.D.2
The evaluation of the poliomyelitis vaccine field trials conducted in the USA in 1954showed that there was considerable variation in the antigenicity of the vaccines then inuse. Since then, however, there have been changes both in manufacturing procedures andin immunization schedules; and a new study has therefore been conducted into the antibodyresponse of triply negative children, aged 6 months to 3 years, to commercial vaccine.The results show good response for all three poliovirus types after three injections. Aftertwo doses antibody levels were relatively low, but the rise in level after the third dose wassubstantial and resulted in aggregate conversion rates of over 80% for all three types ata serum dilution of > 1: 4. The limited data available indicate that the correlation betweenanimal tests and the results in man is low but sufficient to make it possible to rate vaccinesas "good " or " poor "'. There was no demonstrable influence of geographical locationon antibody response.
The variation of the antigenicity of the early polio-myelitis vaccines was well documented in thepoliomyelitis field trial report (Poliomyelitis VaccineEvaluation Center, 1957). Since that time, changeshave been made in manufacturing procedures as wellas in the recommended immunization schedule.Scattered fragmentary observations have also sug-gested that commercial vaccines were not alwayseliciting antibodies in an appreciable proportionof " triply negative " children who received twoinjections.The present study was undertaken (1) to investigate
the variation of antibody response to a number oflots of currently manufactured poliomyelitis vaccinesin infants having no detectable antibodies forpoliomyelitis prior to immunization; and (2) tocompare the human antibody response with theantibody response of monkeys and chicks immunizedwith the same lots of vaccine.The study was initially designed to include infants
from a number of widely separated areas, but fromonly four cities was sufficient information collected
I Assistant Chief, Laboratory Branch, CommunicableDisease Center, Public Health Service, US Department ofHealth, Education, and Welfare, Atlanta, Ga., USA
' Director, Division of Biologics Standards, Public HealthService, US Department of Health, Education, and Welfare,Bethesda, Md., USA
to warrant valid analysis of data. These wereBuffalo, N. Y., Cleveland, O., Louisville, Ky., andNew Orleans, La.
Infants, rather than older individuals, wereselected for this study because in most cases theabsence of detectable antibodies in infants couldbe interpreted to indicate an immunologicallyinexperienced individual. Such interpretation ofsimilar findings in older individuals would not bevalid, since, at least in theory, they might have lostthe detectable titre of circulating antibodies from aprior poliomyelitis infection while retaining theiranamnestic reactivity.The immunization schedule selected was basically
that which has been recommended by Salk sincethe spring of 1955. The first two intramuscularinjections of 1 ml each were given one month apart.The third injection was administered six to sevenmonths after the second. Venous blood sampleswere obtained as follows: the first sample was drawnjust prior to the first injection; the second samplefour weeks after the second injection; the thirdsample just prior to the third injection; and thefourth sample one month after the third injection.
Altogether there were 245 serum specimensobtained from originally triply negative infantsone month after the second vaccine injection.At the time of the first injection, the age of the
858 -363-

U. P. KOKKO & R. MURRAY
infants ranged from 6 to 44 months. The medianage was 13 months and the mean age 14.4 months.It was only possible to follow 182 infants throughthe entire study period. The antibody analysisone month after the third injection is based on thisnumber.The plan of the study called for the use of a
number of vaccines representative of those generallyavailable on the market at the time (1957). Allvaccines studied had been recently released for useand met prescribed standards. The selection andprocurement of the actual lots of vaccine for use inthe study was made by the Division of BiologicsStandards (DBS), National Institutes of Health, onthe basis of the animal potency data available to it,and an effort was made to include lots havingdifferent levels of potency. A total of seven suchlots were studied. Actually, the range of choicewas limited by the fact that only recently releasedvaccines were available.The six-month expiration period of poliomyelitis
vaccine ordinarily prevents administration of thesame vaccine lot for all three injections in an immun-ization schedule which extends over an 8-monthperiod. To be able to administer the third injectionwith vaccine for which some information on humanantibody titres was already available, two lots wereselected from the seven used for the initial phase ofthe study. These two lots were chosen on the basisof antibody response in the study group after theseries of two injections and the fact that they could,according to Federal Regulations, be given a validre-dating by the manufacturer. In this way itwas possible to obtain some information on infantswho had received all three doses with the samelots of vaccines, although the majority of infantsreceived only the first and second injections withthe same vaccine lot and the third from a differentlot.
Since it was considered that local handling ofvaccine might be a factor in variation of results andsince it has been suggested that there may be geo-graphical variation in the antibody response (Shaugh-nessy, Morrissey & Church, 1957), at least two lotsof vaccine were tested in each city. One lot ofmedium antigenicity as judged by the DBS servedas a " control lot ", which was used in each of thefour cities.
LABORATORY WORK
All the human antibody titrations reported inthis study, except parallel titrations performed by
other laboratories to check reproducibility, wereperformed by the same personnel at the Communi-cable Disease Center, Chamblee, Ga. The pre-immunization serum specimens were screened forantibodies at 1: 8 and 1: 16 dilutions, and allindividuals whose serum neutralized the virus inthis test were dropped from the study. The 1: 8screening dilution was chosen to conserve sera forretesting simultaneously with the post-immunizationsera and also because it was expected that, shouldsome antibodies from a prior natural infection bepresent in this particular age-group, the antibodylevel would be high enough to be detected at thisdilution. The antibody titrations of serum specimensobtained after the second vaccine injection werestarted at 1: 4 dilution and carried out to 1: 512.When the sera obtained after the third injectionwere available, all the sera from each individual,with the exception of the pre-immunization speci-mens, were titrated in parallel in the same test.In this test the titration was started at 1: 4 dilutionwhenever sufficient serum was available. Serawhich had antibodies in 1: 512 dilution were retested,if still available, to determine the end-point. Serawhich were found to be toxic for tissue cells atdilutions of 1: 4 or 1: 8 and which had no antibodiesin the first readable dilution were omitted from theanalysis.
MATERIALS AND METHODS
Poliomyelitis virus
The stock virus was prepared from the secondmonkey kidney tissue culture passage of the seedvirus, which was the source material prepared anddistributed by Connaught Laboratories for the 1954poliomyelitis vaccine field trials (type 1 Mahoney,type 2 MEF 1, and type 3 Saukett). It was dispensedin 1-ml aliquots and stored at - 20°C.The serological specificity of the stock virus was
determined in a neutralization test employing100 TCD5O of virus and 1: 30 dilution of anti-poliovirus monkey serum, which was prepared bythe National Foundation for Infantile Paralysisfor the 1954 field trials. The same stock viruseswere used for the entire study.
Neutralization testThe neutralization test employed in this study was
the monkey kidney cell metabolic inhibition test,as described by Melnick (1956). The twofolddilutions of sera were prepared prior to the actual
264
ANTIBODY RESPONSES TO COMMERCIAL POLIOMYELITIS VACCINE 265
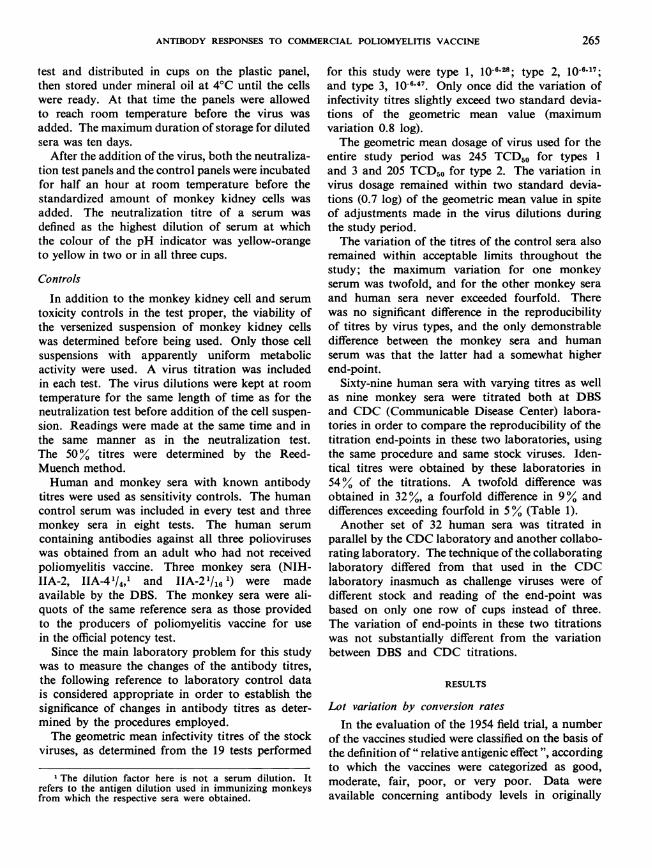
test and distributed in cups on the plastic panel,then stored under mineral oil at 4°C until the cellswere ready. At that time the panels were allowedto reach room temperature before the virus wasadded. The maximum duration of storage for dilutedsera was ten days.
After the addition of the virus, both the neutraliza-tion test panels and the control panels were incubatedfor half an hour at room temperature before thestandardized amount of monkey kidney cells wasadded. The neutralization titre of a serum wasdefined as the highest dilution of serum at whichthe colour of the pH indicator was yellow-orangeto yellow in two or in all three cups.
ControlsIn addition to the monkey kidney cell and serum
toxicity controls in the test proper, the viability ofthe versenized suspension of monkey kidney cellswas determined before being used. Only those cellsuspensions with apparently uniform metabolicactivity were used. A virus titration was includedin each test. The virus dilutions were kept at roomtemperature for the same length of time as for theneutralization test before addition of the cell suspen-sion. Readings were made at the same time and inthe same manner as in the neutralization test.The 50% titres were determined by the Reed-Muench method.Human and monkey sera with known antibody
titres were used as sensitivity controls. The humancontrol serum was included in every test and threemonkey sera in eight tests. The human serumcontaining antibodies against all three polioviruseswas obtained from an adult who had not receivedpoliomyelitis vaccine. Three monkey sera (NIH-IIA-2, IIA41/4,' and IIA-21/16 1) were madeavailable by the DBS. The monkey sera were ali-quots of the same reference sera as those providedto the producers of poliomyelitis vaccine for usein the official potency test.
Since the main laboratory problem for this studywas to measure the changes of the antibody titres,the following reference to laboratory control datais considered appropriate in order to establish thesignificance of changes in antibody titres as deter-mined by the procedures employed.The geometric mean infectivity titres of the stock
viruses, as determined from the 19 tests performed
1 The dilution factor here is not a serum dilution. Itrefers to the antigen dilution used in immunizing monkeysfrom which the respective sera were obtained.
for this study were type 1, 10-6-28; type 2, 10-.17;and type 3, 10-6-47. Only once did the variation ofinfectivity titres slightly exceed two standard devia-tions of the geometric mean value (maximumvariation 0.8 log).The geometric mean dosage of virus used for the
entire study period was 245 TCD5O for types 1and 3 and 205 TCD5O for type 2. The variation invirus dosage remained within two standard devia-tions (0.7 log) of the geometric mean value in spiteof adjustments made in the virus dilutions duringthe study period.The variation of the titres of the control sera also
remained within acceptable limits throughout thestudy; the maximum variation for one monkeyserum was twofold, and for the other monkey seraand human sera never exceeded fourfold. Therewas no significant difference in the reproducibilityof titres by virus types, and the only demonstrabledifference between the monkey sera and humanserum was that the latter had a somewhat higherend-point.
Sixty-nine human sera with varying titres as wellas nine monkey sera were titrated both at DBSand CDC (Communicable Disease Center) labora-tories in order to compare the reproducibility of thetitration end-points in these two laboratories, usingthe same procedure and same stock viruses. Iden-tical titres were obtained by these laboratories in54% of the titrations. A twofold difference wasobtained in 32%, a fourfold difference in 9% anddifferences exceeding fourfold in 5% (Table 1).Another set of 32 human sera was titrated in
parallel by the CDC laboratory and another collabo-rating laboratory. The technique of the collaboratinglaboratory differed from that used in the CDClaboratory inasmuch as challenge viruses were ofdifferent stock and reading of the end-point wasbased on only one row of cups instead of three.The variation of end-points in these two titrationswas not substantially different from the variationbetween DBS and CDC titrations.
RESULTS
Lot variation by conversion rates
In the evaluation of the 1954 field trial, a numberof the vaccines studied were classified on the basis ofthe definition of " relative antigenic effect ", accordingto which the vaccines were categorized as good,moderate, fair, poor, or very poor. Data wereavailable concerning antibody levels in originally

U. P. KOKKO & R. MURRAY
TABLE 1POLIOVIRUS NEUTRALIZING ANTIBODY TITRES OF78 SERA FOR ALL THREE TYPES AS DETERMINED IN
PARALLEL BY CDC AND DBS a
1 1 5 2 7
1 214 1111 3
2 1 2 3 7 4 2 1
2 4 16 7 8 1
2 1 13 7 1 1 1 1
1 4 11 4
9 I10 1 2 1
66 1 2 1
<8 8 16 32 64 128 256 512 >512Reciprocal of serum titre
CDC
a CDC = Communicable Disease Center laboratoryDBS = Division of Biologics Standards laboratory
triply negative children who received their vaccinein the field trials, and these data make possible acomparison of the field trial results with thoseobtained in the present study. However, since thetitrations during the field trial were carried out atserum dilutions of 1: 4, 1: 16, 1: 64, etc., this com-parison is confined to the percentage of the subjectswho converted from no detectable antibody levelsto either > 1: 4 or > 1: 16. Such comparison isgiven for six lots of vaccine at these conversion levelsin Fig. 1 and 2.
In the present study, the relative antigenicity ofsix different lots of vaccine may be determined byconversion rates after two injections, separated by a4-week interval (Table 2). (The seventh lot wasomitted from this calculation since the sera werenot tested at 1: 4 dilutions.)
Statistical analysis of the antibody responseindicates that type 1 conversion rates vary signifi-cantly at the serum dilution 1: 4; however, theproportion of positive reactors decreases so rapidlywith increasing serum dilution that no significantdifference can be demonstrated at the antibody
FIG. IPERCENTAGE OF INDIVIDUALS DEVELOPING ANTIBODY TITRES > 1:4 (CONVERSION RATES)
PRESENT STUDY 1954 FIELD TRIALS
Type I
month ofter2nd injection3rd injection
fl SgType3 H 1
A 8 C D E F ALL LOTSLOT USED FOR FIRST TWO INJECTIONS COMBINED I
GOOD MOD- FAIR POOR VERYERATE POOR
LOT CLASSIFICATION9-3203
> 512
512a
256E' 128a)
ao 64
232
16
8
<8
100-
s0 -
60-
40
20-
100-
80-
4F 60-z
U 40-
A 20-a.
IV I
100-
80-
60 -
40-
20-
v I...
--.UJAA
v I 5. -
III
r
Inn
266
i
ozEW- PHS-OSS-CDC ArTLANTA.". DEC., t958 awow- st
. 1.
...
rrrn

ANTIBODY RESPONSES TO COMMERCIAL POLIOMYELITIS VACCINE
FIG. 2PERCENTAGE OF INDIVIDUALS DEVELOPING ANTIBODY TITRES > 1:16 (CONVERSION RATES)
PRESENT STUDY 1954 FI ELD
Type I -
F
09I s-a m ...- - .- -
TRIALS
I monthafter3D 2nd injection(ID 3rd injection
Type 3
~~__fm [mgm~~IlrrA 8 c D E F ALL LOTS GOOD MOO- FAIR POOR VERY
LOT USED FOR FIRST TWO INJECTIONS COMBINED I ERATE POORLOT CLASSIFICATION
ATLANTA.0*. DEC.. 1956 av *- W-onl
TABLE 2COMPARISON OF CONVERSION RATES AT LEVELS INDICATED FOR SIX LOTS
OF VACCINE ONE MONTH AFTER THE SECOND INJECTION
LotNo.
>4
Type
>8
Type
-> 1 6
Type
1 2 3 1 2 3 1 2
A 34 98 42 14 83 11 10 69
B 52 85 33 30 62 19 13 62
C 75 100 55 38 100 42 21 100
D 71 100 71 36 97 44 23 84
E 25 82 11 10 67 8 10 33
F 29 80 0 17 64 0 8 55
%2 13.1 16.3 16.5 10.1 22.8 17.8 4.2 24.4
P 0.02 0.01 0.01 0.071 <0.001 < 0.001 0.50 <0.001
No. of infants a 98 157 98 163 176 163 163 176
3
9
12
21
31
8
0
11.8
0.04
169
100
so,
60
40
20
100
80-
60-
40-
20-
w
I.-
z
w
w
f
0=4X - g--- -
00
80~
60*
40.
20-
DHEW-P1S-8SS -CC
a Discrepancies in numbers of infants are caused by insufficient quantity of sera, which pre-vented testing at low dilution as explained in the text. For example, if a serum was negative at adilution of 1 : 8 and not tested at 1: 4, it was omitted from the >4 column.
0 ' - ''- - -
I
I
I iI
-
267
...
I

268 U. P. KOKKO & R. MURRAY
TABLE 3COMPARISON OF CONVERSION RATES
AT LEVELS INDICATED FOR TWO LOTS OF VACCINEONE MONTH AFTER THE THIRD INJECTION a
>4 >8 >16
No. infants Type Type Type
1 2 3 1 2J3 1 1213
B 14 93 100 100 93 100 92 93 100 85
C 12 83 100100 83 100 100 83 100 100
a Lot differences are not statistically significant.
level > 1 :16. The differences among type 2 conver-sion rates for different lots are quite significant ateach serum dilution tabulated. Owing to thegenerally high titres of type 2, the difference ismost significant at antibody levels > 16. Type 3differences are also highly significant in lower serumdilutions, but because of generally low titres thedifferences tend to disappear in higher serum dilu-tions. The conversion rates for two vaccines (B andC) may be calculated also after three injections(Table 3). These conversion rates do not differsignificantly at the relatively low antibody levelstabulated. The combined conversion rates for allvaccines after the third injection in the present studyare shown in Tables 4 and 5. These rates comparequite favourably with those obtained during the1954 field trial.
Lot variation by mean titresWhile the conversion rates may be conveniently
used to compare the relative antigenicity of differentlots of vaccine at any arbitrarily selected serumdilution, they do not describe the actual antibodytitres obtained with different vaccines. These may
TABLE 4PERCENTAGE OF CONVERTERS AT ANTIBODY LEVEL
1:4, ALL VACCINES COMBINED
Percentage of convertersSerum specimen
Type II Type 2 Type 3
4 weeks after 2nd injection 50 94 46
Just prior to 3rd injection 35 81 21
4 weeks after 3rd injection | 89 98 88
TABLE 5PERCENTAGE OF CONVERTERS AT ANTIBODY LEVEL
>1:16, ALL VACCINES COMBINED
Percentage of convertersSerum specimen
Type I Type 2 Type 3
4 weeks after 2nd injection 14 69 14
Just prior to 3rd injection 13 50 7
4 weeks after 3rd injection | 75 1 97 | 68
be illustrated most simply by using geometric meantitres of the groups of individuals immunized witheach lot.
In this study the antibody titres were rather lowafter two vaccine injections but after the thirdinjection the antibody responses were distinctlyhigher. The geometric mean titres for two individuallots (B and C) and six lot combinations after threeinjections are shown in Table 6. The difference oftype 1 mean titres for different vaccine combinationsis statistically significant at the 0.03 probabilitylevel, but both type 2 and type 3 titres differ at the< 0.001 probability level. The difference of themean titres produced by the vaccines B and C(the vaccines used for the third injection) may beanalysed in vaccine combinations B + B, C + B,B + C, and C + C. (In these combinations, thefirst letter indicates the vaccine used for the firstand second injections, and the second letter repre-sents the vaccine used for the third injection.)Analysis of the titres of these combinations indicatesno significant difference of type 1 antibody titresbut does demonstrate a difference of type 2 andtype 3 mean antibody titres at the respective pro-bability levels of< 0.01 and < 0.02.
Antibody variation during the immunization scheduleThe antibody response to the first vaccine injection
in this study was low. Of the infants and the 17 triplynegative older individuals 1 whose sera were testedjust prior to the second vaccine injection, onlythree infants and four older individuals had deve-loped measurable antibodies. One of the infants
I These were older children and young adults fromfrom Grafton, N. Dak. They were immunized with thecontrol vaccine (lot A), and their pre- and post-immunizationsera were titrated simultaneously with the present study.Our sincerest appreciation is extended to Dr Charles C.Rand for his co-operation in making these sera availablefor studv.

ANTIBODY RESPONSES TO COMMERCIAL POLIOMYELITIS VACCINE 269
TABLE 6GEOMETRIC MEAN TITRES ONE MONTH AFTER THE THIRDINJECTION FOR EACH VACCINE LOT COMBINATION
Vaccinecombinations No. of
indi- Type I Type 2 Type 31st &2nd 3rd vidualsinjection injection
B B 14 1:67 1:209 1:42
B C 17 1:72 1:434 1:28
C B 14 1:110 >1: 512 1:78
C C 12 1:108 >1:512 1:64
E BorC 12 1:15 1:107 <1: 8
A BorC 64 1:29 1:288 1:23
F BorC 12 1:47 1:364 1:11
D BorC 28 1:72 1: 423 1:65
had a type 1 titre of 1: 8 and two others had type 2titres of 1: 16. Two of the older individuals alsodeveloped type 2 titres of 1: 16 but the titres of thetwo other individuals in this older age-group weredifferent. One 22-year-old who had no detectableantibodies at a serum dilution of 1: 8 prior to thefirst injection developed after a single dose ofvaccine a type 2 antibody titre of 1: 32, and an anti-type 3 titre> 1: 512. Another subject, aged 8 years,developed a type 1 titre of I :128 and a type 2titre of 1: 256 after a single injection. The youngadults who already had demonstrable antibodiesprior to the first vaccine injection responded to asingle vaccine injection in each instance with adefinite homologous antibody rise, thus behavingin sharp contrast to the triply negative infants.
In most cases the change in individual antibodytitres between the second and third bleedings wasno more than could be explained on the basis ofnormal variation of repeated titrations of the sameserum. However, in the group as a whole, theconversion rates declined for each type, and thetype 2 geometric mean titre also dropped from1: 23 to 1: 15. (This comparison cannot be madefor type 1 and type 3 because the geometric meantitres against these types after two vaccine injectionswere < 1: 8.) On the other hand, 13 out of 538 titrepairs, representing 10 out of 182 infants, had morethan a fourfold increase of titres between the secondand third bleedings. Four of these titre increaseswere type 1, six were type 2, and three were type 3.Although it is conceivable that some of these
increases could be attributed to technical factors,some of the extreme variations, including two whichrose from <1: 8 to >1: 512, might be more easilyexplained on the basis of sub-clinical infections.
In the present study there were 33 individualswhose measurable antibodies after two vaccineinjections against one or more types declined to asub-detection level before the third injection. Therewere also 39 individuals whose antibodies againstone or more types did not change during thisperiod. When the antibody responses to the thirdinjection in these two groups are compared, nogroup difference can be observed. The data suggestthat the decline would have little if anything to dowith the preparedness to react to the third injectionand that the differences in the response to the thirdinjection may be associated with the antibodylevel after the primary stimulus, i.e., those who hadhigher antibody titres after two initial injectionsreach a higher level after the third injection andvice versa. This is in agreement with Salk's observa-tions (1956).
Geographical variation
The possible geographical variation of antibodyresponses was studied by comparing the proportionof positive reactors for the same vaccine combina-tions in three participating cities 1 (Table 7). Whenthe apparent differences of the conversion rates indifferent cities were analysed by the X2 test, correctedfor small numbers, the inter-city differences provedto be statistically significant only for type 1 withone of the two vaccine combinations at antibodylevel > 16. Such distribution of titres in a homo-geneous population may occur by chance in lessthan 1% of instances. However, its importance isreduced by the fact that significant differences arenot found in any other column of the table. Also,if the type 1 conversion rates of both vaccina-tion groups (A + B and A + C) at > 16 levelsare combined, the statistical significance disappears.This combination is justifiable on the basis of therelatively small difference of type 1 antigenicityof the two lots used for the third injection.
Age
In the fairly narrow limits of this study, ageappears to have no influence on antibody responses
1 One city has been omitted from this considerationbecause the numbers were too small. Its inclusion would nothave increased the differences.

270 U. P. KOKKO & R. MURRAY
TABLE 7ANTIBODY RESPONSES TO SAME VACCINE COMBINATIONS IN THREE CITIES a (LOT A FOR FIRST TWO INJECTIONS
FOLLOWED BY LOTS B OR C)
Type 1 Type 2 Type 3
City A+B A+C A+B A+C A+1B A+C
24 1.8 16 4 128 16 4 18 116.24 1 81 16 .4 1.8 1.16 .4 28 1.16
l 7/10 5/10 3/10 6/9 4/9 4/9 13/13 13/13 13/13 9/10 9/10 9/10 11/12 9/12 7/12 6/9 6/9 4/9
II 13/13 13/13 13/13 10/11 10/11 9/11 13/13 13/13 13/13 11/11 11/11 11/11 11/12 11/12 11/12 11/11 9/11 9/11
III 6/9 6/9 6/9 6/7 6/7 5/7 9/9 9/9 9/9 7/7 7/7 7/7 7/9 7/9 5/9 4/7 3/7 2/7
x2 b 3.52 5.80 10.08 1.10 4.34 1.98. - - |- |0.80 0.63 3.04 3.70 1.70 3.90
P >0.05 >0.05 <0.01 >0.05 >0.05 >0.05 >0.05 >0.05 >0.05 >0.05 >0.05 >0.05 >0.05 >0.05>0.05 >0.05>0.05>0.05
a The denominator indicates the number of infants in the group and the numerator the number of infants developing antibodies.b x2 corrected for small numbers
(Table 8). The fact that the study population inone of the cities contained a considerable numberof babie.s from a premature nursery did not seemto have any effect on the antibody production.
Animal tests
Although each of the vaccines used had beentested for potency prior to release for use, an addi-tional test was performed by DBS at the time thefirst two doses were administered to the subjectsin this study. The methods indicated in the regula-tions for poliomyelitis vaccine were followed.Briefly, these methods involve the immunizationof 12 monkeys with the vaccine under test. Thuseach animal, which had previously been screenedto determine the absence of detectable poliomyelitis
TABLE 8GEOMETRIC MEAN ANTIBODY TITRES BY AGEa
Type 1 Type 2 Type 3Age-
(months) I mo. I mo. I mo. I mo. I mo. I mo.at after after after after after after
lstinjection 2nd 3rd 2nd 3rd 2nd 3rdinj. inj. inj. inj. inj. inj.
6-11 <1:8 1:48 1:21 1:288 <1:8 1:25
12-17 <1:8 1:61 1:26 1:446 <1:8 1:45
18+ <1:8 1:45 1:18 1:368 <1:8 1:26
a The number of individuals for each age-group varies bytype and bleeding. The minimum numbers for each age-groupare 76, 50, 40 respectively.
antibodies, received a series of three l-ml dosesspaced at weekly intervals. One week after thelast dose, blood was removed for antibody deter-minations. The geometric mean antibody titre ofthe group of monkeys was compared with thegeometric mean titre of a group of reference sera.'
In any one test the antibody titrations for both testand reference sera were carried out simultaneouslywith respect to each type. Three replicates wererun for each of the individual monkey sera and eightfor each of the reference monkey sera. The ratio-geometric mean titre of test sera/geometric meantitre of reference sera-is referred to as the " monkeypotency test ratio". " Desired " ratios in this testare 0.89 for type 1, 0.75 for type 2, and 0.48 fortype 3. In the interpretation of the test, a variationof 66.7% is permitted; i.e., the lowest levels ofacceptability are ratios 0.29, 0.25, and 0.16 respect-ively. Since the test requires at least one month forcompletion, results were not available until thefirst inoculation of the children had been completed.The results of the monkey tests in the case of the
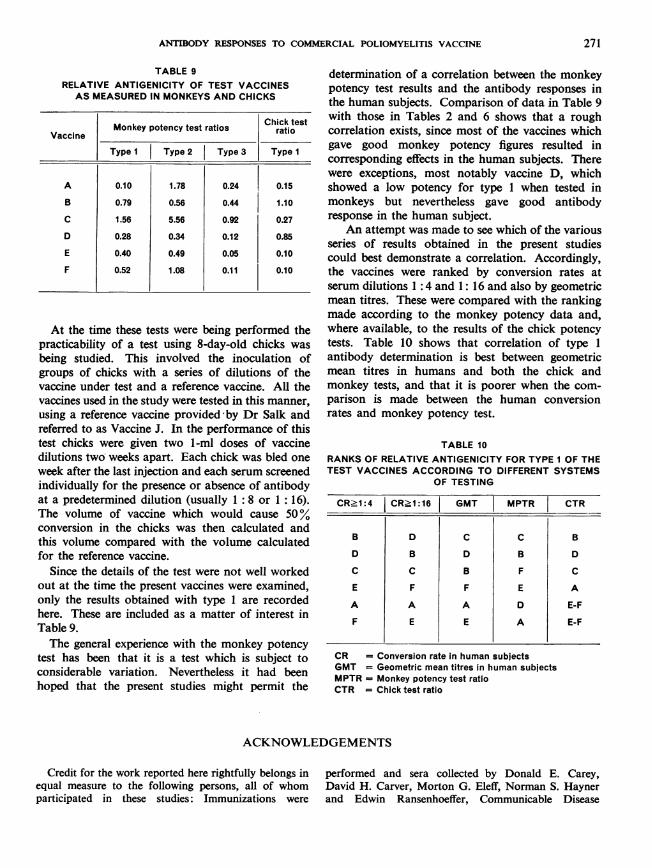
vaccines used are shown in Table 9. It will be notedthat all vaccines gave satisfactory results for type 2and that one vaccine gave a low monkey ratio fortype 1, while in the case of type 3 three gave lowresults.
1 Originally prepared by pooling sera from groups ofmonkeys inoculated with a series of dilutions of a vaccineprovided by Dr Salk and referred to as Vaccine A (not to beconfused with the alphabetical code of the vaccines used inthe present study). The three solutions used were: undiluted,1: 4, and 1:8.
ANTIBODY RESPONSES TO COMMERCIAL POLIOMYELITIS VACCINE
TABLE 9RELATIVE ANTIGENICITY OF TEST VACCINESAS MEASURED IN MONKEYS AND CHICKS
Monkey potency test ratios Chick testVaccine
Type I Type 2 Type 3 Type 1
A 0.10 1.78 0.24 0.15
B 0.79 0.56 0.44 1.10
C 1.56 5.56 0.92 0.27
D 0.28 0.34 0.12 0.85
E 0.40 0.49 0.05 0.10
F 0.52 1.08 0.11 0.10
At the time these tests were being performed thepracticability of a test using 8-day-old chicks wasbeing studied. This involved the inoculation ofgroups of chicks with a series of dilutions of thevaccine under test and a reference vaccine. All thevaccines used in the study were tested in this manner,using a reference vaccine provided by Dr Salk andreferred to as Vaccine J. In the performance of thistest chicks were given two 1-ml doses of vaccinedilutions two weeks apart. Each chick was bled oneweek after the last injection and each serum screenedindividually for the presence or absence of antibodyat a predetermined dilution (usually 1: 8 or 1: 16).The volume of vaccine which would cause 50%conversion in the chicks was then calculated andthis volume compared with the volume calculatedfor the reference vaccine.
Since the details of the test were not well workedout at the time the present vaccines were examined,only the results obtained with type 1 are recordedhere. These are included as a matter of interest inTable 9.The general experience with the monkey potency
test has been that it is a test which is subject toconsiderable variation. Nevertheless it had beenhoped that the present studies might permit the
determination of a correlation between the monkeypotency test results and the antibody responses inthe human subjects. Comparison of data in Table 9with those in Tables 2 and 6 shows that a roughcorrelation exists, since most of the vaccines whichgave good monkey potency figures resulted incorresponding effects in the human subjects. Therewere exceptions, most notably vaccine D, whichshowed a low potency for type 1 when tested inmonkeys but nevertheless gave good antibodyresponse in the human subject.
An attempt was made to see which of the variousseries of results obtained in the present studiescould best demonstrate a correlation. Accordingly,the vaccines were ranked by conversion rates atserum dilutions 1:4 and 1: 16 and also by geometricmean titres. These were compared with the rankingmade according to the monkey potency data and,where available, to the results of the chick potencytests. Table 10 shows that correlation of type 1antibody determination is best between geometricmean titres in humans and both the chick andmonkey tests, and that it is poorer when the com-parison is made between the human conversionrates and monkey potency test.
TABLE 10RANKS OF RELATIVE ANTIGENICITY FOR TYPE I OF THETEST VACCINES ACCORDING TO DIFFERENT SYSTEMS
OF TESTING
CR21:4 CR21:16 [ GMT MPTR CTR
B D C C B
D B D B D
C C B F C
E F F E A
A A A D E-F
F E E A E-F
CR = Conversion rate in human subjectsGMT = Geometric mean titres in human subjectsMPTR = Monkey potency test ratioCTR = Chick test ratio
ACKNOWLEDGEMENTS
Credit for the work reported here rightfully belongs inequal measure to the following persons, all of whomparticipated in these studies: Immunizations were
performed and sera collected by Donald E. Carey,David H. Carver, Morton G. Eleff, Norman S. Haynerand Edwin Ransenhoeffer, Communicable Disease
271

272 U. P. KOKKO & R. MURRAY
Center, Atlanta, Ga; John P. Fox, Tulane University;David T. Karzon, University of Buffalo; Martha Lipson-Lepow and Frederick Robbins, Western Reserve Uni-versity; and Alex J. Steigman, University of Louisville.
Laboratory work was done by Samuel Baron and AlanBernstein, Communicable Disease Center, Atlanta, Ga.Statistical analysis of data was carried out by MyronWillis, Communicable Disease Center, Atlanta, Ga.
RtSUME
Les vaccins poliomyelitiques ont presente, au debut deleur emploi, des variations d'antigenicite que l'on acherche a attenuer par la suite, en ameliorant les methodesde production et les schemas de vaccination.
Les auteurs ont compare l'activite de plusieurs vaccinscommerciaux chez des enfants de 6-44 mois, ne possedantavant la vaccination aucun anticorps poliomyelitiquedecelable, envers l'un ou I'autre des trois types de virus.On a suivi, tout au long du processus d'immunisation,182 enfants dans quatre villes des Etats-Unis.Le schema de vaccination adopte etait celui que Salk a
recommande depuis le printemps 1955, soit deux injec-tions intramusculaires de 1 ml a un mois d'intervalle,suivies d'une troisieme, 5-6 mois plus tard. Des echan-tillons de serum ont ete preleves sur les enfants un moisapres la seconde injection et un mois apres la troisieme.Sept lots de vaccins recemment mis dans le commerce onte soumis aux epreuves. La periode d'utilisation duvaccin etant limitee a 6 mois et la periode de vaccinations'etendant sur pres de 8 mois, la plupart des enfants ont
regu une troisieme injection d'un lot different de celui desdeux premieres. Un certain nombre cependant ont requles trois injections d'un meme lot, dont l'activite prolon-gee pouvait etre garantie. Deux lots de vaccins ont eutilises dans chacune des quatre villes.La reponse anticorps aux trois types de vaccins apres
trois injections a e bonne. Apres les deux premieres, letitre etait relativement bas. 11 s'est notablement eleve a lasuite de la troisieme injection. Le taux de conversionglobal a e de 80% pour les trois types, a la dilution duserum > I: 4.
L'evaluation parallele des vaccins sur le singe, animalconnu pour repondre de faqon tres variable a ce test, amontre une concordance des titres d'anticorps avecceux des enfants d'une approximation satisfaisante. Ellepermet en tout cas la classification des vaccins en <( bons>et ( mauvais i>.
I1 n'y a pas eu de variation de la reponse anticorps chezles enfants, qui soit attribuable a un facteur geographique.
REFERENCES
Melnick, J. L. (1956) Tissue culture methods for thecultivation of poliomyelitis and other viruses. In:American Public Health Association, Diagnosticprocedures for virus and rickettsial diseases, NewYork, p. 97
Poliomyelitis Vaccine Evaluation Center (1957) Evalua-
tion of 1954 field trial of poliomyelitis vaccine:Final report, Ann Arbor, Mich.
Salk, J. E. (1955) Amer. J. publ. Hlth, 45, 575Salk, J. E. (1956) J. Amer. med. Ass., 162, 1451Shaughnessy, H. J., Morrissey, R. A. & Church, R. E.
(1957) Amer. J. publ. Hlth, 47, 613