Embed Size (px)
Citation preview
Genetics Laboratory Manualsecond edition
(revised 8-25-00)
University of South Florida, Tampa
James R. GareySamantha R. BrownLaurie L. MarkhamRichard A. Anthony
Genetics Laboratory Manual Garey et al. 2
CONTENTSChapter 1 Background in Molecular and Mendelian Genetics . . . . . . . . . . . . . . . . . . . . . . . . . . 3
DNA and RNA structure and function . . . . . . . . . . . . . . . . . . . . . . . . . . . . . . . . 4Mitosis and meiosis . . . . . . . . . . . . . . . . . . . . . . . . . . . . . . . . . . . . . . . . . . . . . . 6Dominance and recessiveness . . . . . . . . . . . . . . . . . . . . . . . . . . . . . . . . . . . . . . 8Gene interactions . . . . . . . . . . . . . . . . . . . . . . . . . . . . . . . . . . . . . . . . . . . . . . . . 8Basic probability . . . . . . . . . . . . . . . . . . . . . . . . . . . . . . . . . . . . . . . . . . . . . . . . . 9
Chapter 2 Statistics . . . . . . . . . . . . . . . . . . . . . . . . . . . . . . . . . . . . . . . . . . . . . . . . . . . . . . . . . . . . 14Mutually exclusive events . . . . . . . . . . . . . . . . . . . . . . . . . . . . . . . . . . . . . . . . 16Probability and pedigrees . . . . . . . . . . . . . . . . . . . . . . . . . . . . . . . . . . . . . . . . 18Chi Square test . . . . . . . . . . . . . . . . . . . . . . . . . . . . . . . . . . . . . . . . . . . . . . . . . 19
Chapter 3 Introduction to Drosophila melanogaster . . . . . . . . . . . . . . . . . . . . . . . . . . . . . . . . . 22Biochemical genetics and mutation . . . . . . . . . . . . . . . . . . . . . . . . . . . . . . . . . 23Eye color in D. melanogaster . . . . . . . . . . . . . . . . . . . . . . . . . . . . . . . . . . . . . 23D. melanogaster life cycle . . . . . . . . . . . . . . . . . . . . . . . . . . . . . . . . . . . . . . . . 25Procedures: Working with D. melanogaster . . . . . . . . . . . . . . . . . . . . . . . 26
Mendelian inheritance in D. melanogaster . . . . . . . . . . . . . . 29Recombination and mapping in D. melanogaster . . . . . . . . . 32Chromosome mapping . . . . . . . . . . . . . . . . . . . . . . . . . . . . . . 34Coefficient of coincidence and interference . . . . . . . . . . . . . 35
Chapter 4 Molecular Genetics . . . . . . . . . . . . . . . . . . . . . . . . . . . . . . . . . . . . . . . . . . . . . . . . . . . 38Background in Molecular Genetics . . . . . . . . . . . . . . . . . . . . . . . . . . . . . . . . . 38
Restriction enzyme digestion . . . . . . . . . . . . . . . . . . . . . . . . 38Gel electrophoresis . . . . . . . . . . . . . . . . . . . . . . . . . . . . . . . . 39Genome size . . . . . . . . . . . . . . . . . . . . . . . . . . . . . . . . . . . . . 40PCR amplification . . . . . . . . . . . . . . . . . . . . . . . . . . . . . . . . . 41Molecular cloning . . . . . . . . . . . . . . . . . . . . . . . . . . . . . . . . . 42Restriction mapping . . . . . . . . . . . . . . . . . . . . . . . . . . . . . . . . 44DNA sequencing . . . . . . . . . . . . . . . . . . . . . . . . . . . . . . . . . . . 45
Procedures in Molecular Genetics . . . . . . . . . . . . . . . . . . . . . . . . . . . . . . . . . . 46DNA digestion . . . . . . . . . . . . . . . . . . . . . . . . . . . . . . . . . . . . 46PCR amplification . . . . . . . . . . . . . . . . . . . . . . . . . . . . . . . . . 47Spun column purification . . . . . . . . . . . . . . . . . . . . . . . . . . . 48Quantify PCR product . . . . . . . . . . . . . . . . . . . . . . . . . . . . . 49DNA sequencing . . . . . . . . . . . . . . . . . . . . . . . . . . . . . . . . . . . 51Cloning PCR products . . . . . . . . . . . . . . . . . . . . . . . . . . . . . . 52Phenol extraction . . . . . . . . . . . . . . . . . . . . . . . . . . . . . . . . . . 52Ligation . . . . . . . . . . . . . . . . . . . . . . . . . . . . . . . . . . . . . . . . . . 53Transforming E. coli cells . . . . . . . . . . . . . . . . . . . . . . . . . . . 54Mini-preparation of plasmid DNA . . . . . . . . . . . . . . . . . . . . 55Restriction mapping . . . . . . . . . . . . . . . . . . . . . . . . . . . . . . . . 56
Appendix I Useful protocols and recipes . . . . . . . . . . . . . . . . . . . . . . . . . 57
Genetics Laboratory Manual Garey et al. 3
CHAPTER ONE
Background: Molecular and Mendelian Genetics The purpose of this exercise is to help students understand the relationship between moleculargenetic phenomena and Mendelian inheritance. Topics included in this discussion are:
JDNA and RNA Structure and Function Molecular Structure of DNA and RNA Genes and Information Flow Chromosomes JMitosis and Meiosis Asexual Reproduction Gametogenesis JDominance and Recessiveness Genotype and Phenotype
JGene Interactions Incomplete Dominance Codominance JMendelian Inheritance and Probability Random Segregation Independent Assortment Genetic Linkage The AND and OR Rules This is intended to be an introduction to fundamental genetic concepts. It is not meant to becomprehensive. It should aid in developing a cohesive understanding of genetics, since an efforthas been made to provide thorough and integrated explanations of most concepts. Thispresentation is not always easy reading but is illustrative. It seeks to provoke thought andencourage further study. Students will find the section covering Mendelian inheritance andprobability especially useful, since it introduces a powerful method that can be used to solve awide variety of genetic problems. Expanded discussions of many topics presented here can befound in most comprehensive genetics text books.
Genetics Laboratory Manual Garey et al. 4
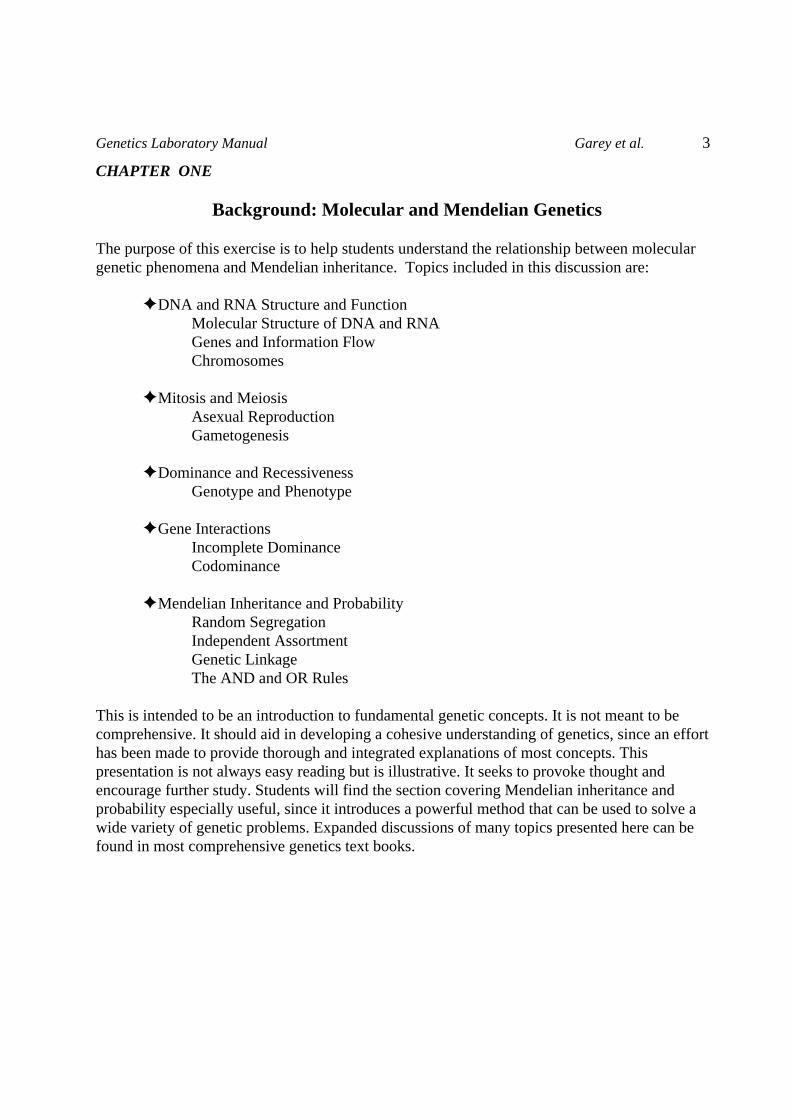
Figure 1. Nucleotide Structure. Shown is thestructure of a ribonucleotide of RNA. In thedeoxyribonucleotides of DNA, the 2' hydroxyl group(OH) is replaced by a hydrogen atom.
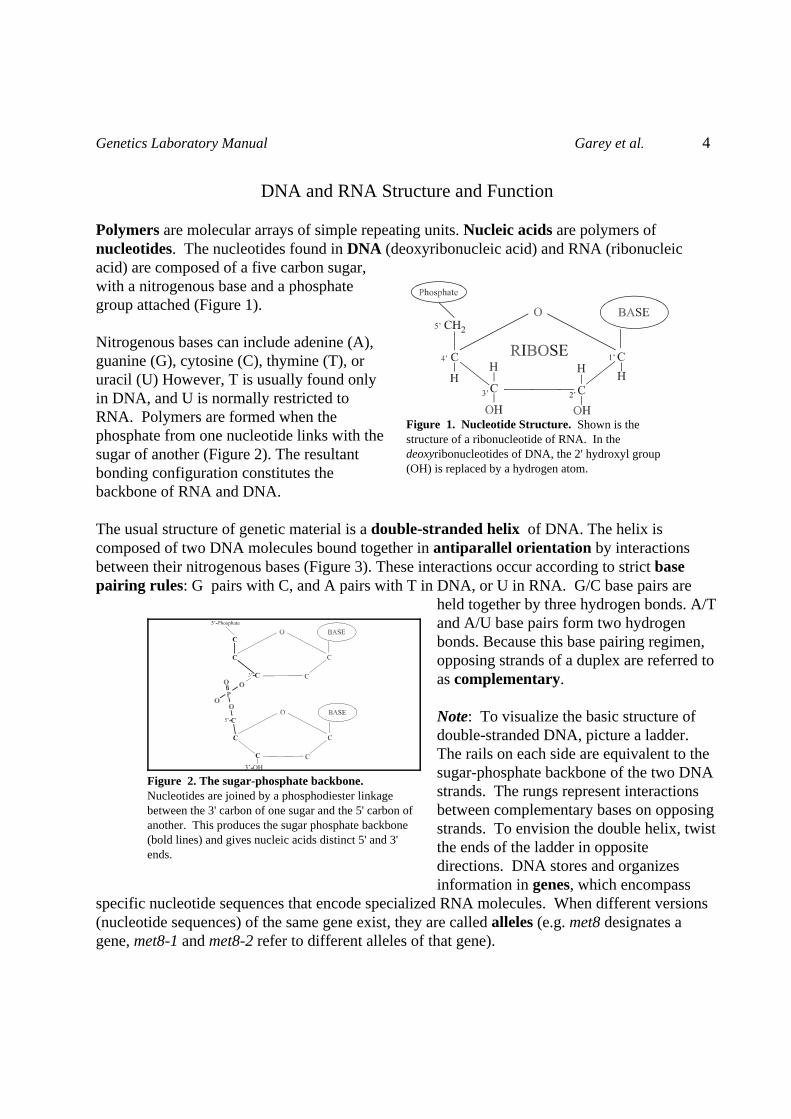
Figure 2. The sugar-phosphate backbone. Nucleotides are joined by a phosphodiester linkagebetween the 3' carbon of one sugar and the 5' carbon ofanother. This produces the sugar phosphate backbone(bold lines) and gives nucleic acids distinct 5' and 3'ends.
DNA and RNA Structure and Function
Polymers are molecular arrays of simple repeating units. Nucleic acids are polymers ofnucleotides. The nucleotides found in DNA (deoxyribonucleic acid) and RNA (ribonucleicacid) are composed of a five carbon sugar,with a nitrogenous base and a phosphategroup attached (Figure 1).
Nitrogenous bases can include adenine (A),guanine (G), cytosine (C), thymine (T), oruracil (U) However, T is usually found onlyin DNA, and U is normally restricted toRNA. Polymers are formed when thephosphate from one nucleotide links with thesugar of another (Figure 2). The resultantbonding configuration constitutes thebackbone of RNA and DNA.
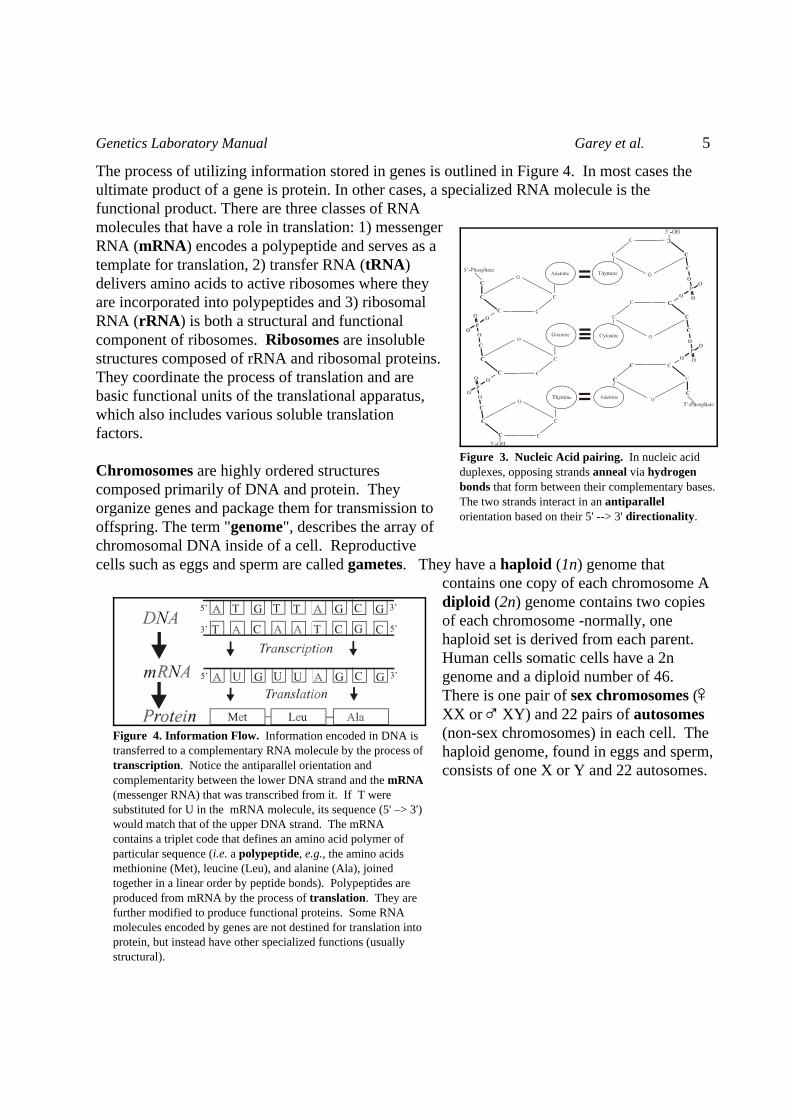
The usual structure of genetic material is a double-stranded helix of DNA. The helix iscomposed of two DNA molecules bound together in antiparallel orientation by interactionsbetween their nitrogenous bases (Figure 3). These interactions occur according to strict basepairing rules: G pairs with C, and A pairs with T in DNA, or U in RNA. G/C base pairs are
held together by three hydrogen bonds. A/Tand A/U base pairs form two hydrogenbonds. Because this base pairing regimen,opposing strands of a duplex are referred toas complementary.
Note: To visualize the basic structure ofdouble-stranded DNA, picture a ladder. The rails on each side are equivalent to thesugar-phosphate backbone of the two DNAstrands. The rungs represent interactionsbetween complementary bases on opposingstrands. To envision the double helix, twistthe ends of the ladder in oppositedirections. DNA stores and organizesinformation in genes, which encompass
specific nucleotide sequences that encode specialized RNA molecules. When different versions(nucleotide sequences) of the same gene exist, they are called alleles (e.g. met8 designates agene, met8-1 and met8-2 refer to different alleles of that gene).
Genetics Laboratory Manual Garey et al. 5
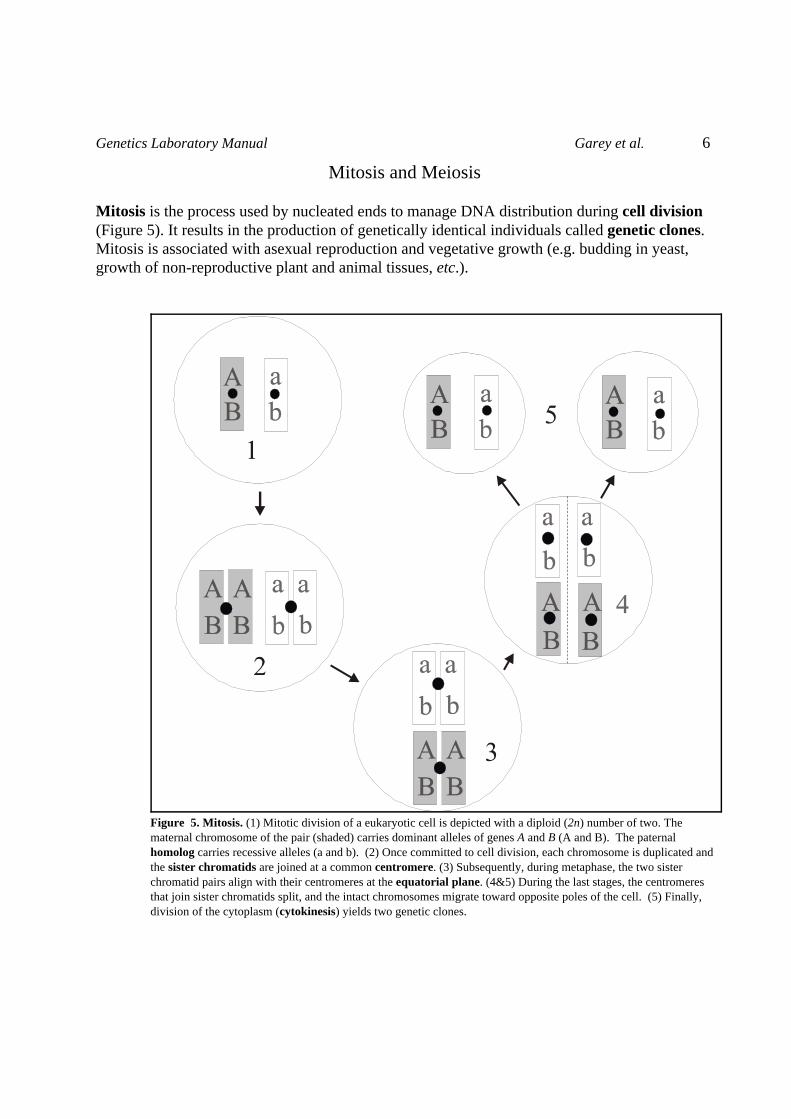
Figure 4. Information Flow. Information encoded in DNA istransferred to a complementary RNA molecule by the process oftranscription. Notice the antiparallel orientation andcomplementarity between the lower DNA strand and the mRNA(messenger RNA) that was transcribed from it. If T weresubstituted for U in the mRNA molecule, its sequence (5' –> 3')would match that of the upper DNA strand. The mRNAcontains a triplet code that defines an amino acid polymer ofparticular sequence (i.e. a polypeptide, e.g., the amino acidsmethionine (Met), leucine (Leu), and alanine (Ala), joinedtogether in a linear order by peptide bonds). Polypeptides areproduced from mRNA by the process of translation. They arefurther modified to produce functional proteins. Some RNAmolecules encoded by genes are not destined for translation intoprotein, but instead have other specialized functions (usuallystructural).
Figure 3. Nucleic Acid pairing. In nucleic acidduplexes, opposing strands anneal via hydrogenbonds that form between their complementary bases. The two strands interact in an antiparallelorientation based on their 5' --> 3' directionality.
The process of utilizing information stored in genes is outlined in Figure 4. In most cases theultimate product of a gene is protein. In other cases, a specialized RNA molecule is thefunctional product. There are three classes of RNAmolecules that have a role in translation: 1) messengerRNA (mRNA) encodes a polypeptide and serves as atemplate for translation, 2) transfer RNA (tRNA)delivers amino acids to active ribosomes where theyare incorporated into polypeptides and 3) ribosomalRNA (rRNA) is both a structural and functionalcomponent of ribosomes. Ribosomes are insolublestructures composed of rRNA and ribosomal proteins.They coordinate the process of translation and arebasic functional units of the translational apparatus,which also includes various soluble translationfactors.
Chromosomes are highly ordered structurescomposed primarily of DNA and protein. Theyorganize genes and package them for transmission tooffspring. The term "genome", describes the array ofchromosomal DNA inside of a cell. Reproductivecells such as eggs and sperm are called gametes. They have a haploid (1n) genome that
contains one copy of each chromosome Adiploid (2n) genome contains two copiesof each chromosome -normally, onehaploid set is derived from each parent.Human cells somatic cells have a 2ngenome and a diploid number of 46. There is one pair of sex chromosomes (XX or � XY) and 22 pairs of autosomes(non-sex chromosomes) in each cell. Thehaploid genome, found in eggs and sperm,consists of one X or Y and 22 autosomes.
Genetics Laboratory Manual Garey et al. 6
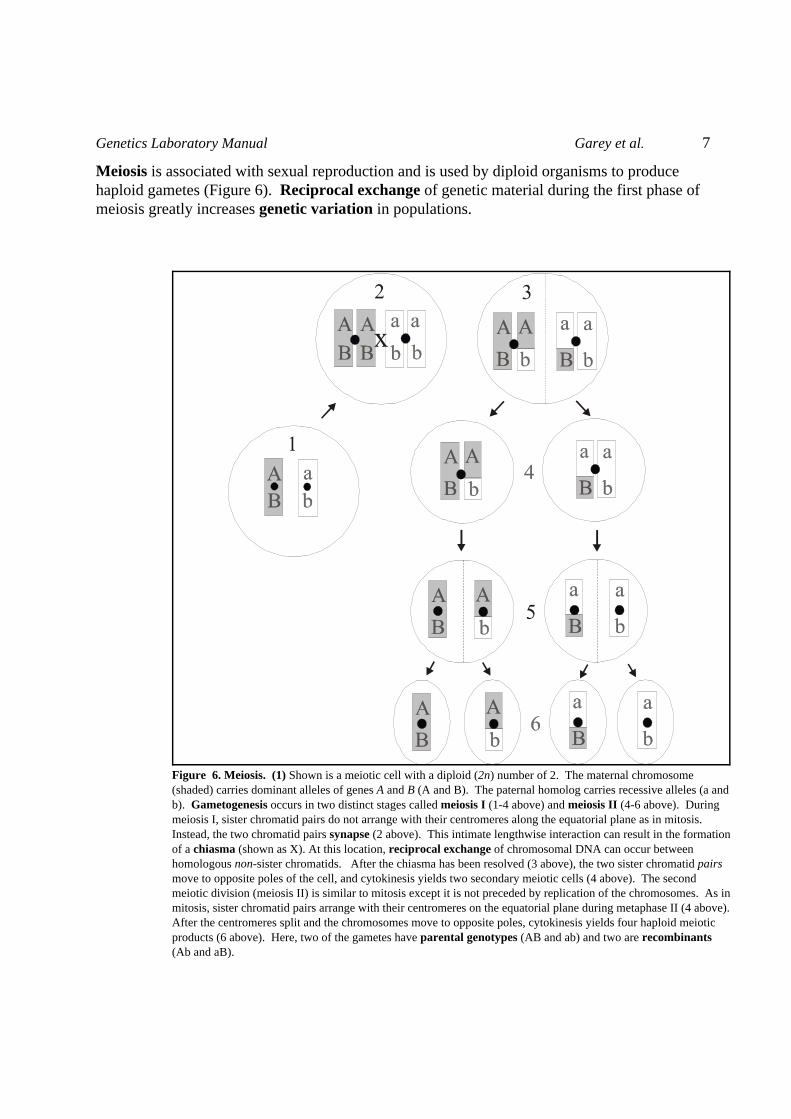
Figure 5. Mitosis. (1) Mitotic division of a eukaryotic cell is depicted with a diploid (2n) number of two. Thematernal chromosome of the pair (shaded) carries dominant alleles of genes A and B (A and B). The paternalhomolog carries recessive alleles (a and b). (2) Once committed to cell division, each chromosome is duplicated andthe sister chromatids are joined at a common centromere. (3) Subsequently, during metaphase, the two sisterchromatid pairs align with their centromeres at the equatorial plane. (4&5) During the last stages, the centromeresthat join sister chromatids split, and the intact chromosomes migrate toward opposite poles of the cell. (5) Finally,division of the cytoplasm (cytokinesis) yields two genetic clones.
Mitosis and Meiosis
Mitosis is the process used by nucleated ends to manage DNA distribution during cell division(Figure 5). It results in the production of genetically identical individuals called genetic clones.Mitosis is associated with asexual reproduction and vegetative growth (e.g. budding in yeast, growth of non-reproductive plant and animal tissues, etc.).
Genetics Laboratory Manual Garey et al. 7
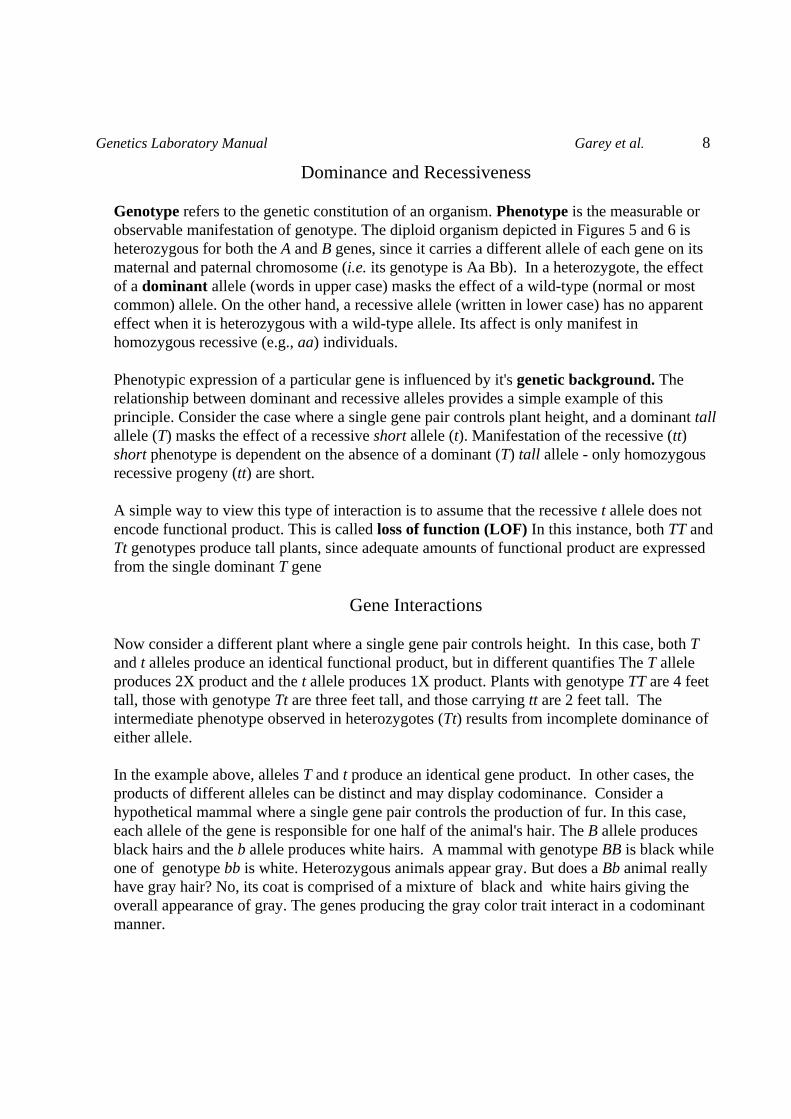
Figure 6. Meiosis. (1) Shown is a meiotic cell with a diploid (2n) number of 2. The maternal chromosome(shaded) carries dominant alleles of genes A and B (A and B). The paternal homolog carries recessive alleles (a andb). Gametogenesis occurs in two distinct stages called meiosis I (1-4 above) and meiosis II (4-6 above). Duringmeiosis I, sister chromatid pairs do not arrange with their centromeres along the equatorial plane as in mitosis. Instead, the two chromatid pairs synapse (2 above). This intimate lengthwise interaction can result in the formationof a chiasma (shown as X). At this location, reciprocal exchange of chromosomal DNA can occur betweenhomologous non-sister chromatids. After the chiasma has been resolved (3 above), the two sister chromatid pairsmove to opposite poles of the cell, and cytokinesis yields two secondary meiotic cells (4 above). The secondmeiotic division (meiosis II) is similar to mitosis except it is not preceded by replication of the chromosomes. As inmitosis, sister chromatid pairs arrange with their centromeres on the equatorial plane during metaphase II (4 above). After the centromeres split and the chromosomes move to opposite poles, cytokinesis yields four haploid meioticproducts (6 above). Here, two of the gametes have parental genotypes (AB and ab) and two are recombinants(Ab and aB).
Meiosis is associated with sexual reproduction and is used by diploid organisms to producehaploid gametes (Figure 6). Reciprocal exchange of genetic material during the first phase ofmeiosis greatly increases genetic variation in populations.
Genetics Laboratory Manual Garey et al. 8
Dominance and Recessiveness
Genotype refers to the genetic constitution of an organism. Phenotype is the measurable orobservable manifestation of genotype. The diploid organism depicted in Figures 5 and 6 isheterozygous for both the A and B genes, since it carries a different allele of each gene on itsmaternal and paternal chromosome (i.e. its genotype is Aa Bb). In a heterozygote, the effectof a dominant allele (words in upper case) masks the effect of a wild-type (normal or mostcommon) allele. On the other hand, a recessive allele (written in lower case) has no apparenteffect when it is heterozygous with a wild-type allele. Its affect is only manifest inhomozygous recessive (e.g., aa) individuals.
Phenotypic expression of a particular gene is influenced by it's genetic background. Therelationship between dominant and recessive alleles provides a simple example of thisprinciple. Consider the case where a single gene pair controls plant height, and a dominant tallallele (T) masks the effect of a recessive short allele (t). Manifestation of the recessive (tt)short phenotype is dependent on the absence of a dominant (T) tall allele - only homozygousrecessive progeny (tt) are short.
A simple way to view this type of interaction is to assume that the recessive t allele does notencode functional product. This is called loss of function (LOF) In this instance, both TT andTt genotypes produce tall plants, since adequate amounts of functional product are expressedfrom the single dominant T gene
Gene Interactions Now consider a different plant where a single gene pair controls height. In this case, both Tand t alleles produce an identical functional product, but in different quantifies The T alleleproduces 2X product and the t allele produces 1X product. Plants with genotype TT are 4 feettall, those with genotype Tt are three feet tall, and those carrying tt are 2 feet tall. Theintermediate phenotype observed in heterozygotes (Tt) results from incomplete dominance ofeither allele. In the example above, alleles T and t produce an identical gene product. In other cases, theproducts of different alleles can be distinct and may display codominance. Consider ahypothetical mammal where a single gene pair controls the production of fur. In this case,each allele of the gene is responsible for one half of the animal's hair. The B allele producesblack hairs and the b allele produces white hairs. A mammal with genotype BB is black whileone of genotype bb is white. Heterozygous animals appear gray. But does a Bb animal reallyhave gray hair? No, its coat is comprised of a mixture of black and white hairs giving theoverall appearance of gray. The genes producing the gray color trait interact in a codominantmanner.
Genetics Laboratory Manual Garey et al. 9
Gametes a a
A Aa Aa
A Aa Aa
Gametes A a
A AA Aa
A AA Aa
Gametes A a
a Aa aa
a Aa aa
Basic Mendelian Inheritance and Probability The distribution of genes to gametes during meiosis occurs according to the Mendelian law ofrandom segregation. This means that a heterozygous individual will produce gametes thathave the dominant or recessive allele in a 1:1 ratio. In an individual with genotype Tt, 50% ofgametes will carry the dominant T allele and 50% will carry the recessive t allele. Because ofthis, it is simple to predict the genotype of offspring that result from the mating of twoindividuals. Of course, if genetically identical homozygotes mate (e.g. aa x aa or AA x AA),all of the offspring will be homozygous (i.e. aa or AA). However, this would not be the case ifthe parents were heterozygotes, or had different genotypes.
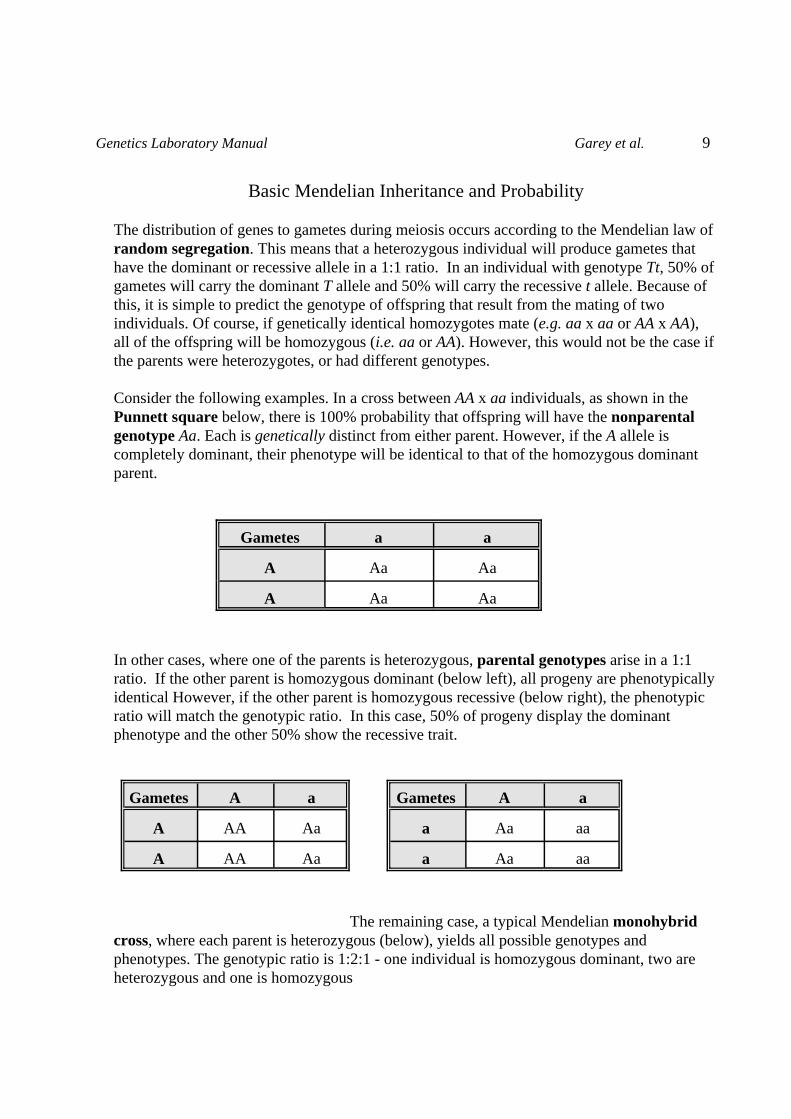
Consider the following examples. In a cross between AA x aa individuals, as shown in thePunnett square below, there is 100% probability that offspring will have the nonparentalgenotype Aa. Each is genetically distinct from either parent. However, if the A allele iscompletely dominant, their phenotype will be identical to that of the homozygous dominantparent.
In other cases, where one of the parents is heterozygous, parental genotypes arise in a 1:1ratio. If the other parent is homozygous dominant (below left), all progeny are phenotypicallyidentical However, if the other parent is homozygous recessive (below right), the phenotypic ratio will match the genotypic ratio. In this case, 50% of progeny display the dominantphenotype and the other 50% show the recessive trait.
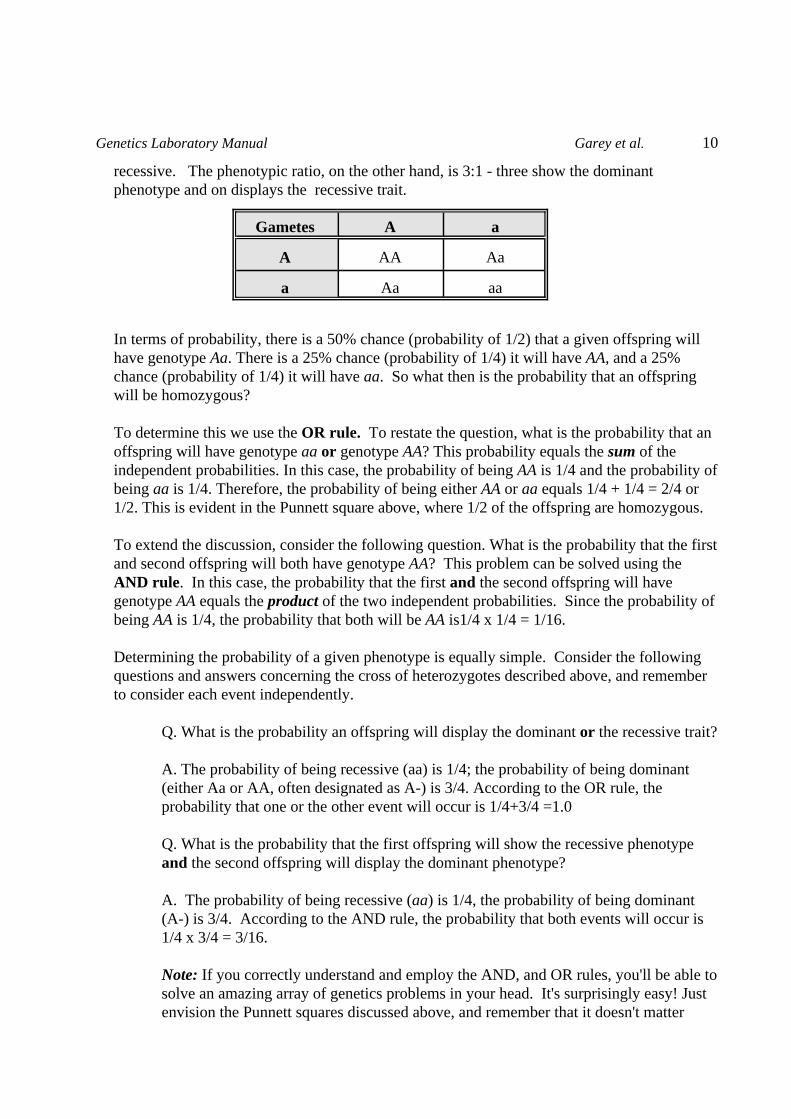
The remaining case, a typical Mendelian monohybridcross, where each parent is heterozygous (below), yields all possible genotypes andphenotypes. The genotypic ratio is 1:2:1 - one individual is homozygous dominant, two areheterozygous and one is homozygous
Genetics Laboratory Manual Garey et al. 10
Gametes A a
A AA Aa
a Aa aa
recessive. The phenotypic ratio, on the other hand, is 3:1 - three show the dominantphenotype and on displays the recessive trait.
In terms of probability, there is a 50% chance (probability of 1/2) that a given offspring willhave genotype Aa. There is a 25% chance (probability of 1/4) it will have AA, and a 25%chance (probability of 1/4) it will have aa. So what then is the probability that an offspringwill be homozygous? To determine this we use the OR rule. To restate the question, what is the probability that anoffspring will have genotype aa or genotype AA? This probability equals the sum of theindependent probabilities. In this case, the probability of being AA is 1/4 and the probability ofbeing aa is 1/4. Therefore, the probability of being either AA or aa equals 1/4 + 1/4 = 2/4 or1/2. This is evident in the Punnett square above, where 1/2 of the offspring are homozygous. To extend the discussion, consider the following question. What is the probability that the firstand second offspring will both have genotype AA? This problem can be solved using theAND rule. In this case, the probability that the first and the second offspring will havegenotype AA equals the product of the two independent probabilities. Since the probability ofbeing AA is 1/4, the probability that both will be AA is1/4 x 1/4 = 1/16.
Determining the probability of a given phenotype is equally simple. Consider the followingquestions and answers concerning the cross of heterozygotes described above, and rememberto consider each event independently.
Q. What is the probability an offspring will display the dominant or the recessive trait?
A. The probability of being recessive (aa) is 1/4; the probability of being dominant(either Aa or AA, often designated as A-) is 3/4. According to the OR rule, theprobability that one or the other event will occur is 1/4+3/4 =1.0
Q. What is the probability that the first offspring will show the recessive phenotypeand the second offspring will display the dominant phenotype?
A. The probability of being recessive (aa) is 1/4, the probability of being dominant(A-) is 3/4. According to the AND rule, the probability that both events will occur is1/4 x 3/4 = 3/16.
Note: If you correctly understand and employ the AND, and OR rules, you'll be able tosolve an amazing array of genetics problems in your head. It's surprisingly easy! Justenvision the Punnett squares discussed above, and remember that it doesn't matter
Genetics Laboratory Manual Garey et al. 11
Gametes AB Ab aB ab Phenotypic Ratio Expected
AB AABB AABb AaBB AaBb 9/16 tall and green (A-B-)
Ab AAbB AAbb AaBb Aabb 3/16 tall and yellow (A-bb)
aB AaBB AaBb aaBB aaBb 3/16 short and green (aaB-)
ab AaBb Aabb aaBb aabb 1/16 short and yellow (aabb)
which letter you use to designate a particular gene pair. Another of Mendel's rules is the law of independent assortment. In modern terms, it meansthat different gene pairs (e.g. Aa and Bb) segregate independently during meiosis if they arenot genetically linked by being near one another on the same chromosome.
To understand the concept of genetic linkage, meiosis must be considered (Figure 6). Thereciprocal genetic exchange indicated by a chiasma can cause physically linked genes toappear unlinked in progeny. In the example shown on Figure 6, the Aa and Bb pairs are notgenetically linked, even though they are physically linked. Notice that two of the non-sisterchromatids (AB and ab) exchanged genes to yield the recombinant gametes Ab and aB. If thisevent occurs 50% of the time (i.e., between 1/2 of the non-sister chromatids), as in theexample, it is impossible to tell such physically linked genes from those on differentchromosomes. Conversely, when there is complete genetic linkage between two genes on thesame chromosome, the genes always segregate together. In such cases, no recombinantgametes are produced. They are all parental type for the genes of interest
Note: If you really want to exercise try this! Add another chromosome pair to the cell shownin Figure 6 and transfer the B genes to it (i.e., physically unlink the A and B genes). Put the 2chromosome pairs through meiosis and inspect the gametes. Remember that sister chromatidpairs arrange randomly at the equatorial plate during metaphase. Fifty percent of the time,AA and bb pairs will segregate together during meiosis I. Ultimately, 1/2 of all gametes willbe the recombinant Ab type. This result is the same obtained when genes are physically, butnot genetically linked, as in the original example.
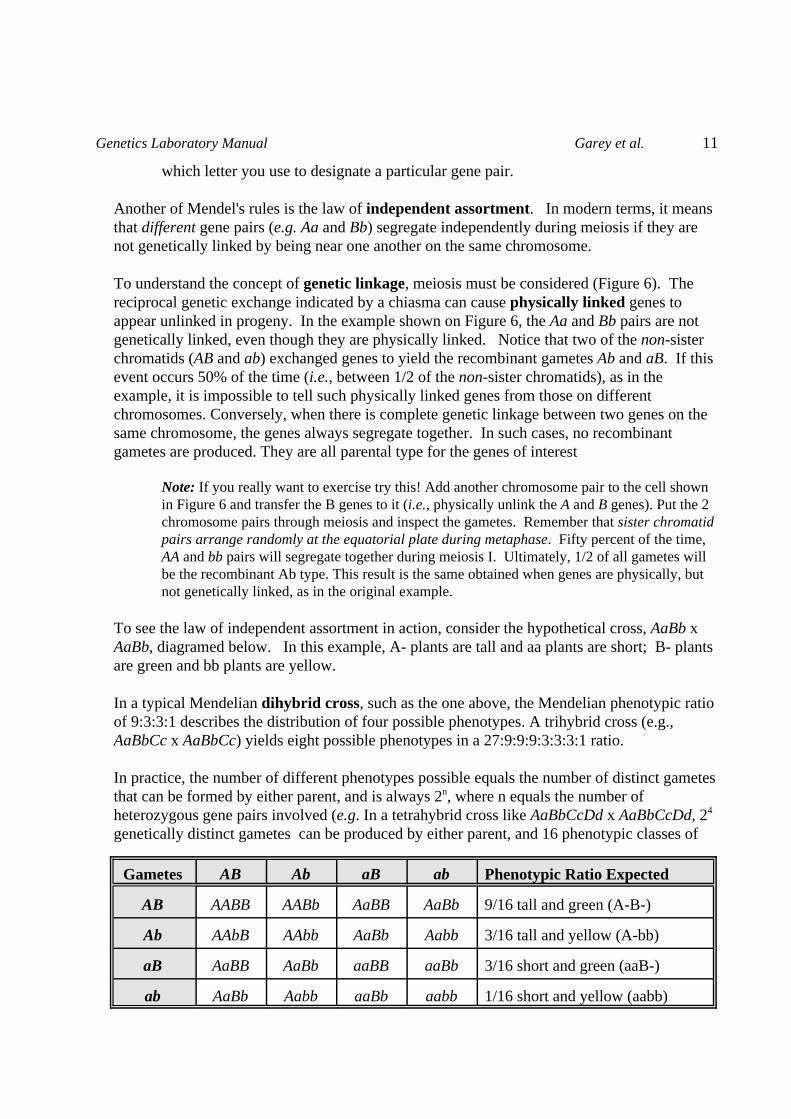
To see the law of independent assortment in action, consider the hypothetical cross, AaBb xAaBb, diagramed below. In this example, A- plants are tall and aa plants are short; B- plantsare green and bb plants are yellow.
In a typical Mendelian dihybrid cross, such as the one above, the Mendelian phenotypic ratioof 9:3:3:1 describes the distribution of four possible phenotypes. A trihybrid cross (e.g.,AaBbCc x AaBbCc) yields eight possible phenotypes in a 27:9:9:9:3:3:3:1 ratio.
In practice, the number of different phenotypes possible equals the number of distinct gametes that can be formed by either parent, and is always 2n, where n equals the number of heterozygous gene pairs involved (e.g. In a tetrahybrid cross like AaBbCcDd x AaBbCcDd, 24
genetically distinct gametes can be produced by either parent, and 16 phenotypic classes of
Genetics Laboratory Manual Garey et al. 12
offspring are possible). The number of distinct genotypes possible in the offspring equals 3n.
Punnett squares become laborious when two or more different genetic loci (e.g. Aa and Bb)are being considered. In these cases, another method is simpler. To begin, follow the cardinalrule for answering questions about genetic probability - consider each event independently.
Consider the following question. What is the probability that an offspring of genotypeAaBBccDd will result from a mating between AABbCcDd and aaBBccDd individuals?
To solve the question, break it down into its constituent parts. Since each gene pair assortsindependently, the question involves four distinct meiotic events. Essentially, it can bereduced to four distinct questions. Employ the following strategy.
Determine the probability of each independent event:
Q. What is the probability that an Aa individual will result from a AA x aa cross?A. 4/4 (100%, probability = 1.0)
Q. What is the probability that a BB individual will result from a Bb x BB cross?A. 2/4 (50%, probability = 0.5)
Q. What is the probability that a cc individual will result from a Cc x cc cross?A. 2/4 (50%, probability = 0.5)
Q. What is the probability that a Dd individual will result from a Dd x Dd cross?A. 2/4 (50%, probability = 0.5)
Finally, combine the independent probabilities (from steps 1-4)
Q. What is the probability that an individual with genotype Aa and BB and cc and Ddwill arise from a AABbCcDd x aaBBccDd cross? A. According to the AND rule, the probability equals 4/4 x 2/4 x 2/4 x 2/4, or
1/8
Now consider another question. What is the probability that an offspring from the cross CcDdx ccDd have genotype DD or dd but not Cc? In this question there are three independentevents to be considered. To solve it, modify the approach outlined above.
Calculate the probability of the individual events:
Q. What is the probability that a DD individual will result from a Dd x Dd cross? A. 1/4 (25%, probability = 0.25)
Q. What is the probability that a dd individual will result from a Dd x Dd cross? A. 1/4 (25%, probability = 0.25)
Genetics Laboratory Manual Garey et al. 13
To address the "but not Cc" part of the question, use a logical approach:
Q. What is the probability that a Cc individual will arise from a Cc x cc cross?A. 1/2 (50%, probability = 0.5)
It then follows that 1/2 are not Cc.
Calculate the combined probability of DD or dd:
Q. What is the probability of having genotype DD or dd?A. According to the OR rule, 1/4 + 1/4, or 1/2
Finish the problem by combining the probabilities:
Q. What is the probability of having genotype DD or dd and not Cc?A. According to the AND rule, 1/2 X 1/2 or 1/4
The above discussions introduce a very robust approach to solving genetic probabilityquestions. The method can be modified and layered to solve a wide variety of problems. Thekey is to apply this method consistently, and to develop a mechanistic and logical approach toproblem solving.
References Klug, WS and MR Cummings, Concepts of Genetics 5th ed., Prentiss-Hall, Inc. 1997.
Hartl, D.L. and E.W. Jones, Genetics, principles and analysis, 4th ed., Jones and Bartlett, 1998. Hardy G, 1908. Mendelian proportions in a mixed population Science 28: 49-50. Kerr, W.E., and S. Wright, 1954. Experimental studies of the distributed of gene frequenciesin very small populations of Drosophila melanogaster I Forked. Evolution 8: 172-177.
Genetics Laboratory Manual Garey et al. 14
CHAPTER TWO Statistics
The objectives are:
1) Define and give an example of what is meant by the concept of chance. 2) Use the probability principles to solve problems concerning independent events occurring simultaneously and mutually exclusive events. 3) Apply probability concepts to the analysis of pedigrees. 4) Learn to calculate and interpret a 32 value with a given set of data.
Chance
The concept of chance can be demonstrated by tossing coins. It is usually impossible to controlwhether the coin will land heads up or tails up. That is said to occur by chance. Since there aretwo possible outcomes, each with a 1/2 probability, it is expected that when a coin is tossed manytimes approximately half the tosses will land heads up, and half will land tails up.
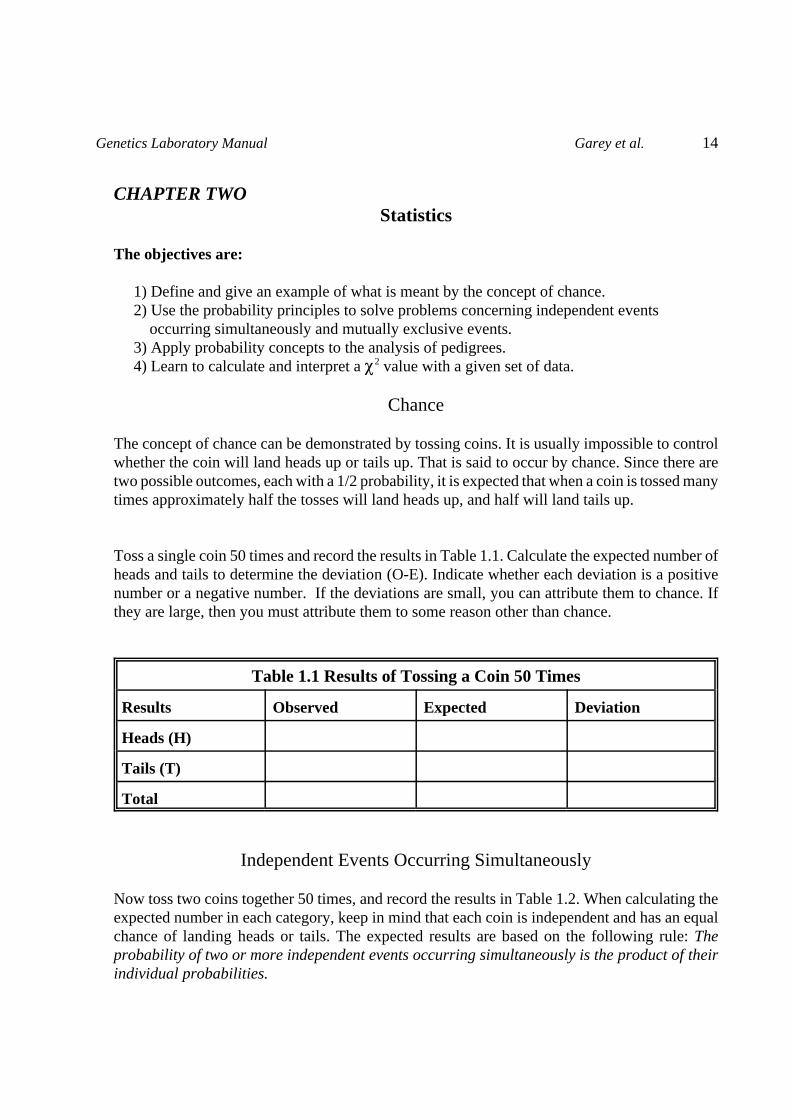
Toss a single coin 50 times and record the results in Table 1.1. Calculate the expected number ofheads and tails to determine the deviation (O-E). Indicate whether each deviation is a positivenumber or a negative number. If the deviations are small, you can attribute them to chance. Ifthey are large, then you must attribute them to some reason other than chance.
Table 1.1 Results of Tossing a Coin 50 Times
Results Observed Expected Deviation
Heads (H)
Tails (T)
Total
Independent Events Occurring Simultaneously
Now toss two coins together 50 times, and record the results in Table 1.2. When calculating theexpected number in each category, keep in mind that each coin is independent and has an equalchance of landing heads or tails. The expected results are based on the following rule: Theprobability of two or more independent events occurring simultaneously is the product of theirindividual probabilities.
Genetics Laboratory Manual Garey et al. 15
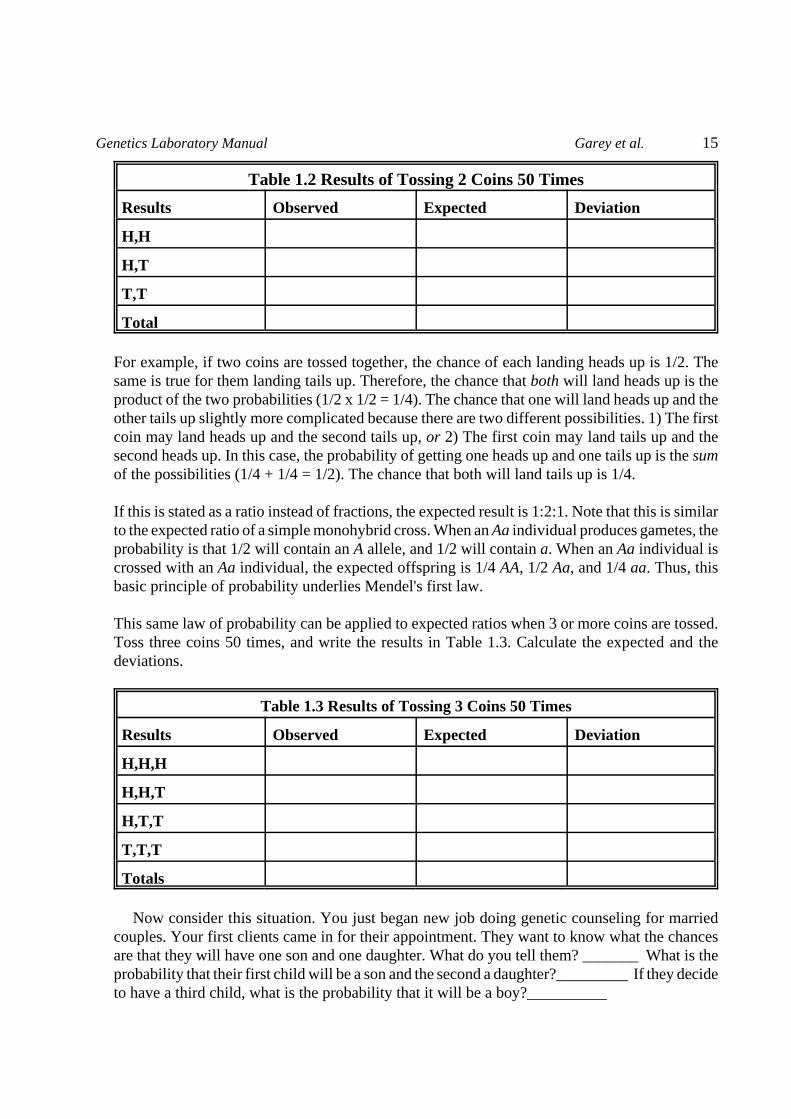
Table 1.2 Results of Tossing 2 Coins 50 Times
Results Observed Expected Deviation
H,H
H,T
T,T
Total
For example, if two coins are tossed together, the chance of each landing heads up is 1/2. Thesame is true for them landing tails up. Therefore, the chance that both will land heads up is theproduct of the two probabilities (1/2 x 1/2 = 1/4). The chance that one will land heads up and theother tails up slightly more complicated because there are two different possibilities. 1) The firstcoin may land heads up and the second tails up, or 2) The first coin may land tails up and thesecond heads up. In this case, the probability of getting one heads up and one tails up is the sumof the possibilities (1/4 + 1/4 = 1/2). The chance that both will land tails up is 1/4.
If this is stated as a ratio instead of fractions, the expected result is 1:2:1. Note that this is similarto the expected ratio of a simple monohybrid cross. When an Aa individual produces gametes, theprobability is that 1/2 will contain an A allele, and 1/2 will contain a. When an Aa individual iscrossed with an Aa individual, the expected offspring is 1/4 AA, 1/2 Aa, and 1/4 aa. Thus, thisbasic principle of probability underlies Mendel's first law.
This same law of probability can be applied to expected ratios when 3 or more coins are tossed.Toss three coins 50 times, and write the results in Table 1.3. Calculate the expected and thedeviations.
Table 1.3 Results of Tossing 3 Coins 50 Times
Results Observed Expected Deviation
H,H,H
H,H,T
H,T,T
T,T,T
Totals Now consider this situation. You just began new job doing genetic counseling for marriedcouples. Your first clients came in for their appointment. They want to know what the chancesare that they will have one son and one daughter. What do you tell them? _______ What is theprobability that their first child will be a son and the second a daughter?_________ If they decideto have a third child, what is the probability that it will be a boy?__________
Genetics Laboratory Manual Garey et al. 16
Binomial Expansion
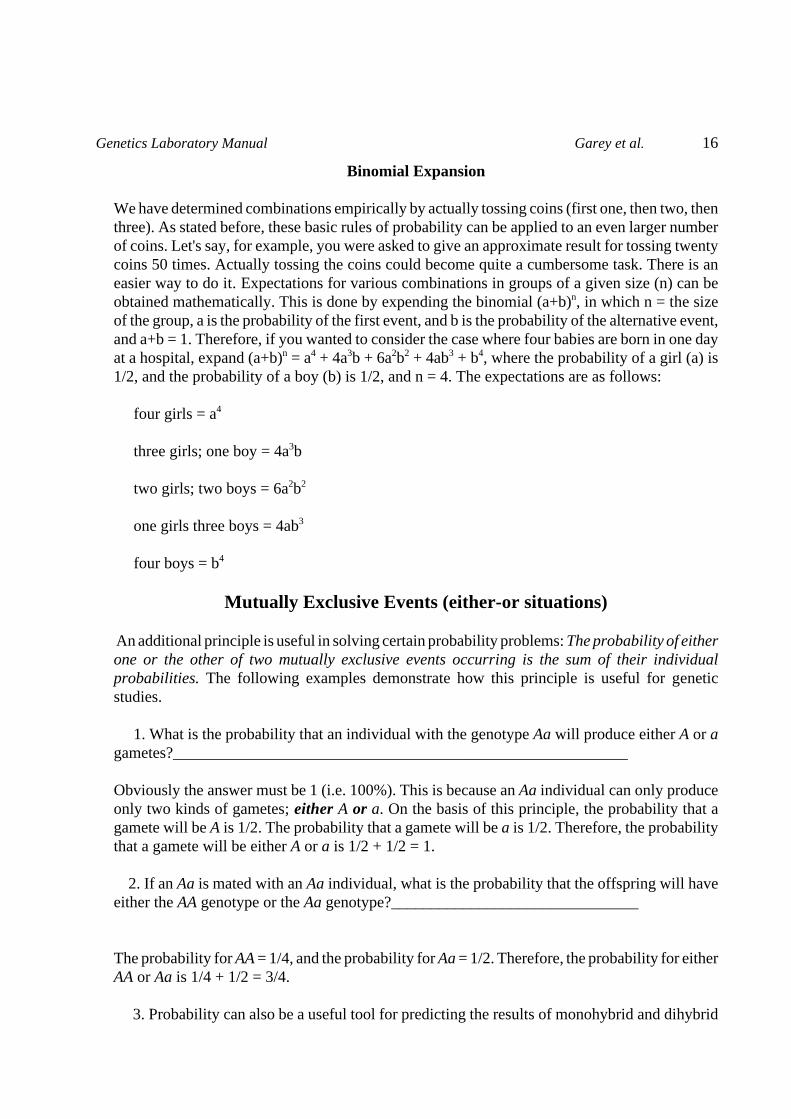
We have determined combinations empirically by actually tossing coins (first one, then two, thenthree). As stated before, these basic rules of probability can be applied to an even larger numberof coins. Let's say, for example, you were asked to give an approximate result for tossing twentycoins 50 times. Actually tossing the coins could become quite a cumbersome task. There is aneasier way to do it. Expectations for various combinations in groups of a given size (n) can beobtained mathematically. This is done by expending the binomial (a+b)n, in which n = the sizeof the group, a is the probability of the first event, and b is the probability of the alternative event,and a+b = 1. Therefore, if you wanted to consider the case where four babies are born in one dayat a hospital, expand (a+b)n = a4 + 4a3b + 6a2b2 + 4ab3 + b4, where the probability of a girl (a) is1/2, and the probability of a boy (b) is 1/2, and n = 4. The expectations are as follows:
four girls = a4
three girls; one boy = 4a3b
two girls; two boys = 6a2b2
one girls three boys = 4ab3
four boys = b4
Mutually Exclusive Events (either-or situations)
An additional principle is useful in solving certain probability problems: The probability of eitherone or the other of two mutually exclusive events occurring is the sum of their individualprobabilities. The following examples demonstrate how this principle is useful for geneticstudies.
1. What is the probability that an individual with the genotype Aa will produce either A or agametes?_________________________________________________________
Obviously the answer must be 1 (i.e. 100%). This is because an Aa individual can only produceonly two kinds of gametes; either A or a. On the basis of this principle, the probability that agamete will be A is 1/2. The probability that a gamete will be a is 1/2. Therefore, the probabilitythat a gamete will be either A or a is 1/2 + 1/2 = 1. 2. If an Aa is mated with an Aa individual, what is the probability that the offspring will haveeither the AA genotype or the Aa genotype?_______________________________
The probability for AA = 1/4, and the probability for Aa = 1/2. Therefore, the probability for eitherAA or Aa is 1/4 + 1/2 = 3/4.
3. Probabilit y can also be a useful tool for predicting the results of monohybrid and dihybrid
Genetics Laboratory Manual Garey et al. 17
crosses. For example, in mating AaBb x AaBb, one would expect 1/4 the offspring to be AA, 2/4to be Aa, and 1/4 to be aa. Likewise, 1/4 should be BB, 1/2 Bb, and 1/4 bb. If the A_ and B_ genesare independently assorting, one would expect 3/4 x 3/4 = 9/16 of the offspring to be A_B_ , 1/4x 1/4 = 1/16 to be AAbb, 1/4 x 1/4 = 1/16 to be aaBB, and 1/4 x 1/4 = 1/16 to be aabb. Try usingthis approach to answer the following questions: If AaBb is mated to AaBb, what is the probabilitythat the offspring will be:
a. either AABb or AaBB?______________________________________________
b. either AaBb or aaBb?_______________________________________________
c. either Aabb or aaBB?_______________________________________________
d. either the phenotype A_B_ or the phenotype aaB_?__________________________
Genetics Laboratory Manual Garey et al. 18
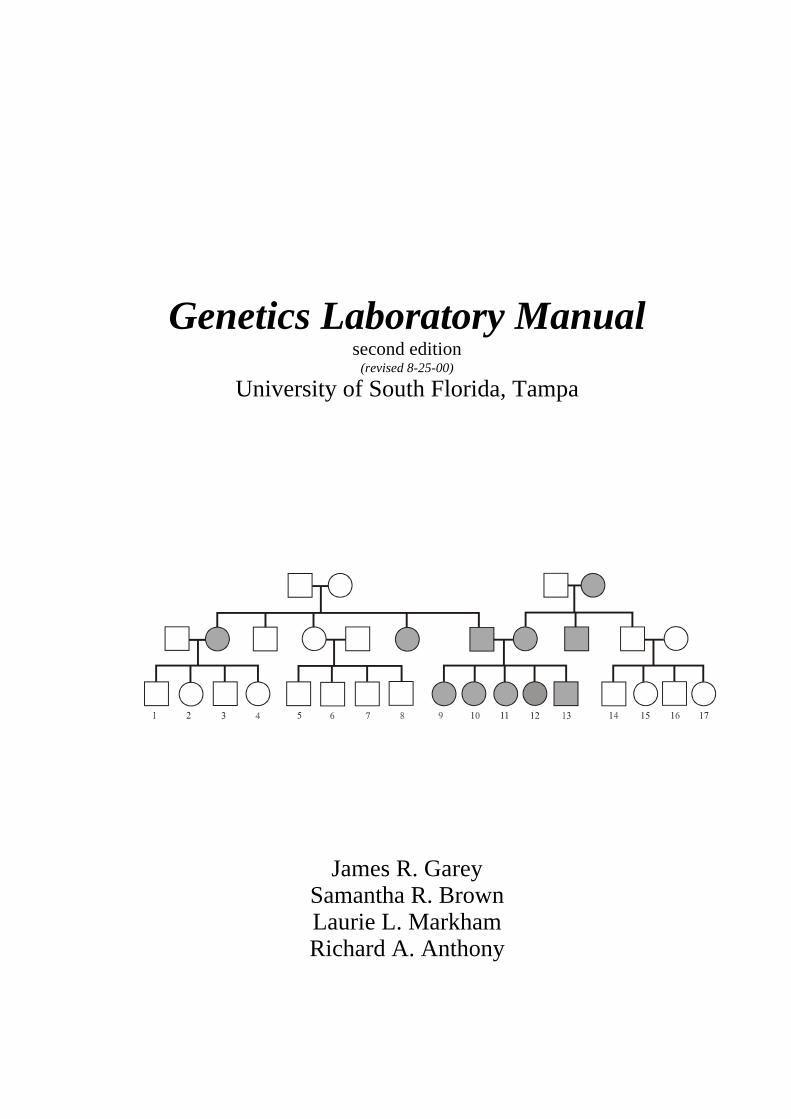
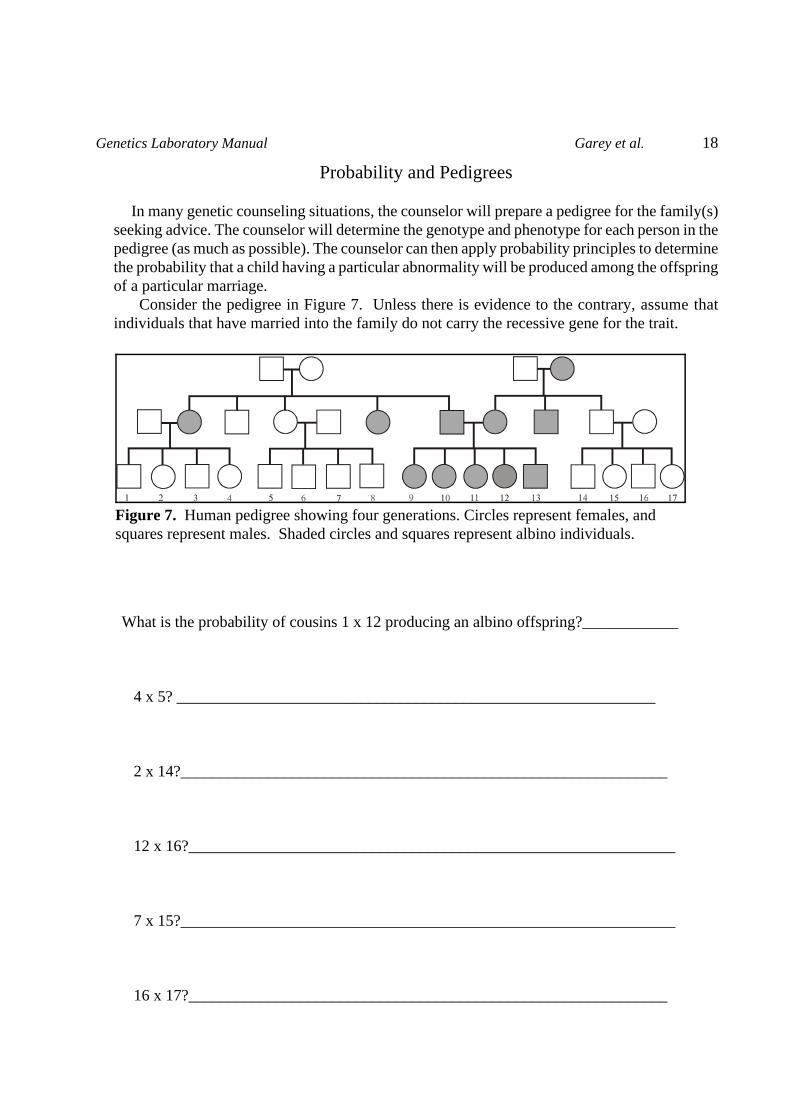
Figure 7. Human pedigree showing four generations. Circles represent females, andsquares represent males. Shaded circles and squares represent albino individuals.
Probability and Pedigrees
In many genetic counseling situations, the counselor will prepare a pedigree for the family(s)seeking advice. The counselor will determine the genotype and phenotype for each person in thepedigree (as much as possible). The counselor can then apply probability principles to determinethe probability that a child having a particular abnormality will be produced among the offspringof a particular marriage. Consider the pedigree in Figure 7. Unless there is evidence to the contrary, assume thatindividuals that have married into the family do not carry the recessive gene for the trait.
What is the probability of cousins 1 x 12 producing an albino offspring?____________
4 x 5? ____________________________________________________________
2 x 14?_____________________________________________________________
12 x 16?_____________________________________________________________
7 x 15?______________________________________________________________
16 x 17?____________________________________________________________
Genetics Laboratory Manual Garey et al. 19
The Chi Square Test
The purpose of the chi square 32 test is to determine whether experimentally obtained dataconstitute a good fit to a theoretical, expected ratio. In other words, the 32 test enables one todetermine whether it is reasonable to attribute deviations from an expected value to chance.Obviously, if deviations are small then they can be more reasonably attributed to chance. Thequestion is how small must deviations be in order to be attributed to chance?
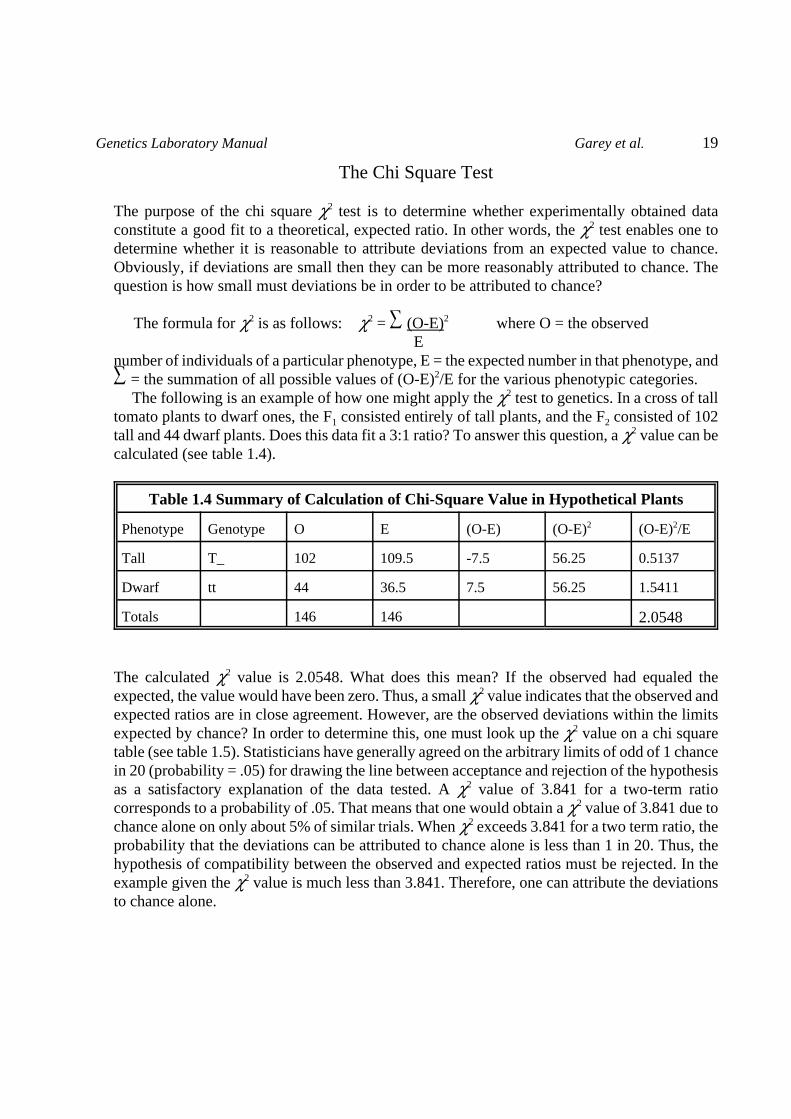
The formula for 32 is as follows: 32 = � (O-E)2 where O = the observed Enumber of individuals of a particular phenotype, E = the expected number in that phenotype, and� = the summation of all possible values of (O-E)2/E for the various phenotypic categories. The following is an example of how one might apply the 32 test to genetics. In a cross of talltomato plants to dwarf ones, the F1 consisted entirely of tall plants, and the F2 consisted of 102tall and 44 dwarf plants. Does this data fit a 3:1 ratio? To answer this question, a 32 value can becalculated (see table 1.4).
Table 1.4 Summary of Calculation of Chi-Square Value in Hypothetical Plants
Phenotype Genotype O E (O-E) (O-E)2 (O-E)2/E
Tall T_ 102 109.5 -7.5 56.25 0.5137
Dwarf tt 44 36.5 7.5 56.25 1.5411
Totals 146 146 2.0548
The calculated 32 value is 2.0548. What does this mean? If the observed had equaled theexpected, the value would have been zero. Thus, a small 32 value indicates that the observed andexpected ratios are in close agreement. However, are the observed deviations within the limitsexpected by chance? In order to determine this, one must look up the 32 value on a chi squaretable (see table 1.5). Statisticians have generally agreed on the arbitrary limits of odd of 1 chancein 20 (probability = .05) for drawing the line between acceptance and rejection of the hypothesisas a satisfactory explanation of the data tested. A 32 value of 3.841 for a two-term ratiocorresponds to a probability of .05. That means that one would obtain a 32 value of 3.841 due tochance alone on only about 5% of similar trials. When 32 exceeds 3.841 for a two term ratio, theprobability that the deviations can be attributed to chance alone is less than 1 in 20. Thus, thehypothesis of compatibility between the observed and expected ratios must be rejected. In theexample given the 32 value is much less than 3.841. Therefore, one can attribute the deviationsto chance alone.
Genetics Laboratory Manual Garey et al. 20
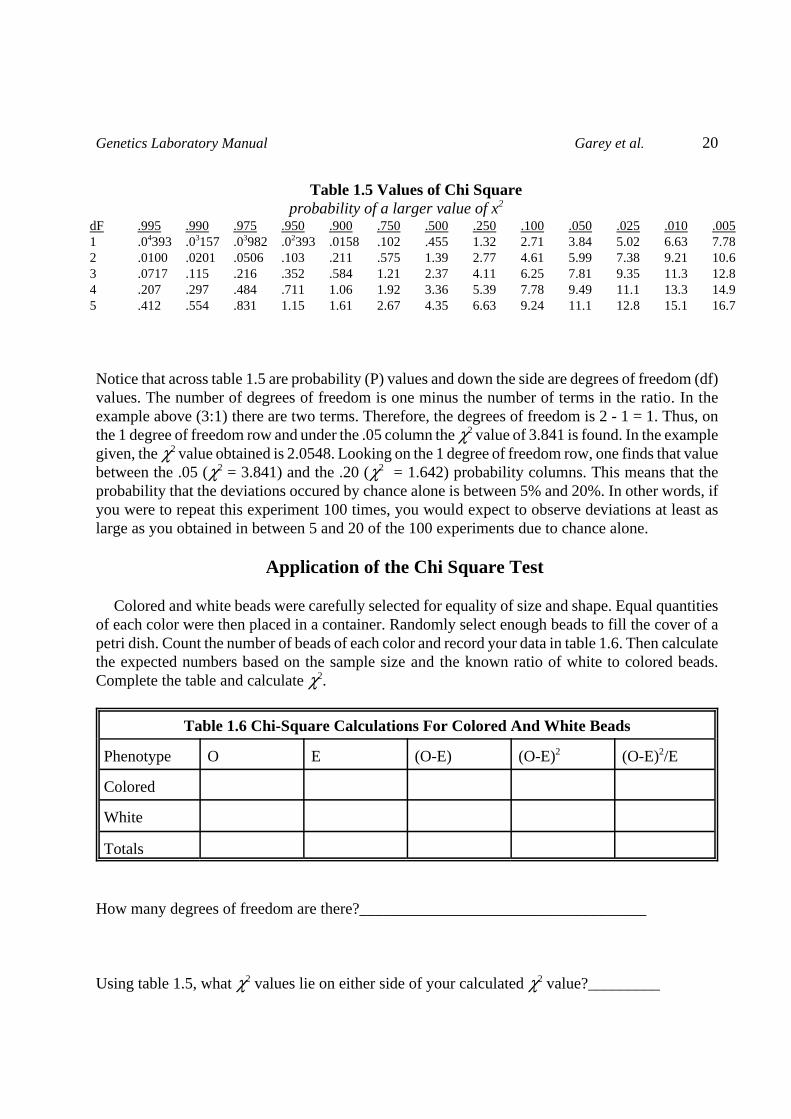
Table 1.5 Values of Chi Square probability of a larger value of x2
dF .995 .990 .975 .950 .900 .750 .500 .250 .100 .050 .025 .010 .0051 .04393 .03157 .03982 .02393 .0158 .102 .455 1.32 2.71 3.84 5.02 6.63 7.782 .0100 .0201 .0506 .103 .211 .575 1.39 2.77 4.61 5.99 7.38 9.21 10.63 .0717 .115 .216 .352 .584 1.21 2.37 4.11 6.25 7.81 9.35 11.3 12.84 .207 .297 .484 .711 1.06 1.92 3.36 5.39 7.78 9.49 11.1 13.3 14.95 .412 .554 .831 1.15 1.61 2.67 4.35 6.63 9.24 11.1 12.8 15.1 16.7
Notice that across table 1.5 are probability (P) values and down the side are degrees of freedom (df)values. The number of degrees of freedom is one minus the number of terms in the ratio. In theexample above (3:1) there are two terms. Therefore, the degrees of freedom is 2 - 1 = 1. Thus, onthe 1 degree of freedom row and under the .05 column the 32 value of 3.841 is found. In the examplegiven, the 32 value obtained is 2.0548. Looking on the 1 degree of freedom row, one finds that valuebetween the .05 (32 = 3.841) and the .20 (32 = 1.642) probability columns. This means that theprobability that the deviations occured by chance alone is between 5% and 20%. In other words, ifyou were to repeat this experiment 100 times, you would expect to observe deviations at least aslarge as you obtained in between 5 and 20 of the 100 experiments due to chance alone.
Application of the Chi Square Test
Colored and white beads were carefully selected for equality of size and shape. Equal quantitiesof each color were then placed in a container. Randomly select enough beads to fill the cover of apetri dish. Count the number of beads of each color and record your data in table 1.6. Then calculatethe expected numbers based on the sample size and the known ratio of white to colored beads.Complete the table and calculate 32.
Table 1.6 Chi-Square Calculations For Colored And White Beads
Phenotype O E (O-E) (O-E)2 (O-E)2/E
Colored
White
Totals
How many degrees of freedom are there?____________________________________
Using table 1.5, what 32 values lie on either side of your calculated 32 value?_________
Genetics Laboratory Manual Garey et al. 21
What are the probability values associated with the 32 values?_____________________
Briefly interpret the 32 value you have just calculated. ___________________________
_____________________________________________________________________
Notebook Guidelines
All of the data and questions you answered should be recorded in your notebook. For convenienceyou may cut out the tables you filled in and paste them in your notebook. In addition, calculate the3
2 values for the data you obtained for tossing the one, two, and three coins and answer these samefour questions.
References
Mann, PS, Introductory Statistics, 3rd ed., Wiley and Sons, 1998.
Mertens, T and R. Hammersmith, Genetics Laboratory Investigations, tenth edition. pp 21-44, 1991.
Genetics Laboratory Manual Garey et al. 22
CHAPTER THREE
Introduction to Drosophila melanogaster The purpose of this chapter is to introduce students to the equipment and techniques used tohandle “fruit flies" in the laboratory. You will learn about the life cycle of the DipteranDrosophila melanogaster. You will also learn to differentiate between male and female flies andhow to identify aberrant phenotypes that are attributable to specific mutations, many of whichwill be studied during the semester.
Upon completion of this exercise you should be able to
J Distinguish between male and female D. melanogasterJ Categorize mutant flies based on aberrant phenotypesJ Prepare controlled genetic crosses of D. melanogaster
Background
The fruit fly Drosophila melanogaster is a very useful organism for genetic research and hasprobably been used to define more fundamental genetic principles than any other multicellular eukaryote. One person responsible for development of D. melanogaster into a model geneticsystem was named Thomas Hunt Morgan who, in 1910, published one of the first descriptionsof sex linkage. His description was based on the segregation pattern he observed while studyingthe white-eye mutation in D. melanogaster. He later performed crosses involving multiple sexlinked mutations and observed unexpected combinations of phenotypes in the offspring fromthose crosses. These observations led him to hypothesize that there is a physical exchange ofgenetic information during the formation of gametes in D. melanogaster. He called thisphenomenon crossing over. The results of Morgan's experiments led him to propose that genesare linked in a linear array along chromosomes and the probability of recombination occurringbetween any two genes is related to the distance that separates them.
Morgan’s thinking was expanded by one of his students, Alfred A. Sturtevant, who showed thatthe frequency of recombination between two linked genes can be used to estimate the distancebetween them. More notably, he used trihybrid crosses to show that these distances are additiveand can be used to construct a map describing the order and placement of genes along achromosome.
Due to its simple culturing requirements, short generation time, copious offspring, andwell-defined genetics, this diminutive organism has become a versatile model system that isroutinely used for inquiries into the genetics of eukaryotic development, behavior, andpopulation dynamics. Since the arrival of recombinant DNA technology, much has been learnedabout the biology of Drosophila melanogaster.
Genetics Laboratory Manual Garey et al. 23
Biochemical Genetics and Mutation
Metabolism is the sum of all physical and chemical changes that occur in an organism. Itinvolves transformation of both materials and energy. Anabolic processes use energy to producematerials such as enzymes, structural proteins, and storage molecules from simple substrates.During this process, energy is transferred to and stored in the chemical bonds of more complexcompounds. Catabolic processes involve degradation of complex compounds with theconcurrent release of energy and simple substrates or waste products.
Many metabolic processes involve the sequential conversion of one substrate to another via amulti-step biochemical pathway. The genetic analysis of such pathways provided a basis forthe “one gene encodes one enzyme (polypeptide)" hypothesis originated by Beadle and Tatum.Most often, the substrate conversion that occurs at each step of a biochemical pathway iscatalyzed by a different enzyme, which is encoded by a corresponding gene. Mutation of such agene can block the pathway by altering or eliminating the respective enzyme and preventingconversion of the substrate at a specific step.
Archibald Garrod first suggested the relationship between genes and enzymes in 1902 whilestudying families affected by alkaptonuria, a rare inherited metabolic disorder characterized bysecretion of homogenistic acid (HA) in urine. The high concentration of HA causes the urine of affected individuals to turn black when exposed to air. The products of its oxidation also tend toaccumulate in cartilaginous tissue, which leads to a darkening of the ears and nose, and can resultin arthritis later in life. Garrod referred to this disease as an "inborn error of metabolism”. Oneof Garrod's contributions to biochemical genetics was his perception that the position of a blockin a metabolic pathway can be determined by observing accumulation of the substrate thatprecedes the blocked step. Interestingly, few scientists other than William Bateson, a closecolleague, grasped the significance of Garrod’s work until about 30 years later when a similardisease called phenylketonuria was described.
It is now known that alkaptonuria is caused by mutation of a gene encoding the enzyme HAoxidase. This enzyme normally catalyses the conversion of HA to maleylacetoacetic acid in ametabolic pathway involving phenylalanine and tyrosine. Since HA is not metabolized inalkaptonurics it accumulates to excess levels and causes the clinical symptoms of the disease.The accumulation of HA can be moderated (i.e. the disease can be treated) by controlling dietaryintake of phenylalanine and tyrosine.
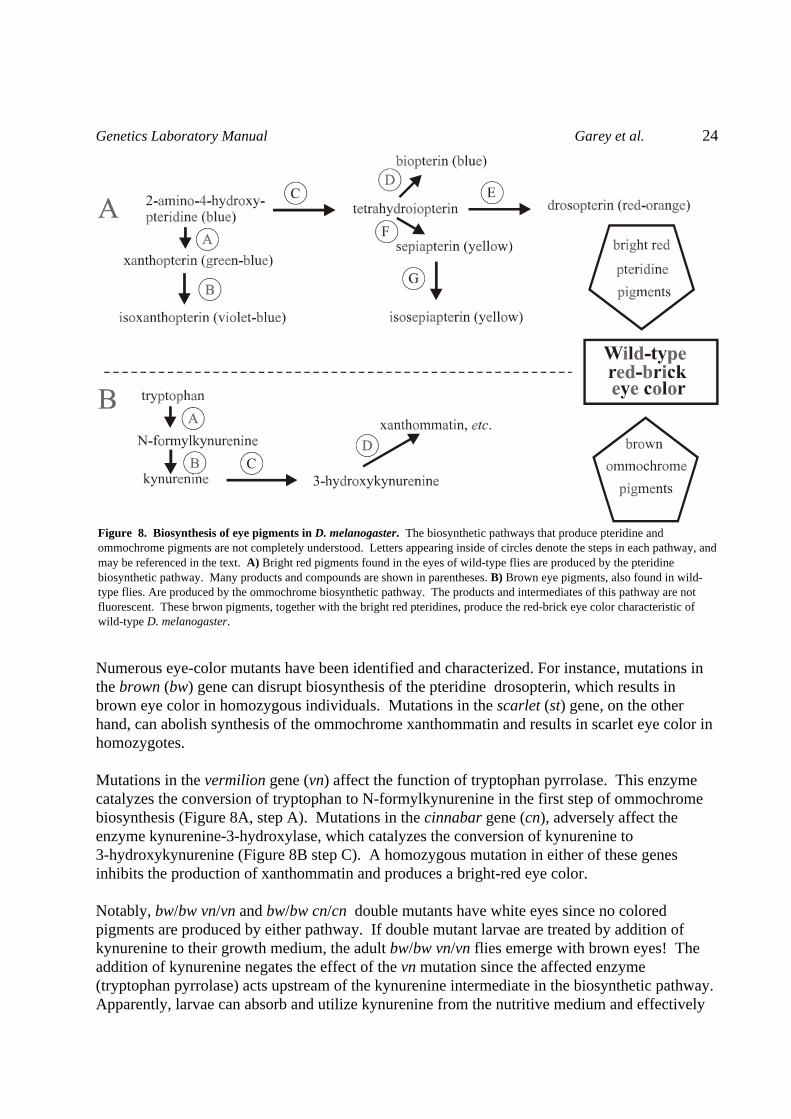
Eye Color in D. melanogaster The common fruit fly has compound eyes. Each eye consists of multiple visual structurescalled ommatidia. Bright red pteridine and brown ommochrome pigments combine in eachommatidia to produce the characteristic red-brick eye color of wild-type D. melanogaster. Thesepigments are produced by two different biochemical pathways (Figure 8).
Genetics Laboratory Manual Garey et al. 24
Figure 8. Biosynthesis of eye pigments in D. melanogaster. The biosynthetic pathways that produce pteridine andommochrome pigments are not completely understood. Letters appearing inside of circles denote the steps in each pathway, andmay be referenced in the text. A) Bright red pigments found in the eyes of wild-type flies are produced by the pteridinebiosynthetic pathway. Many products and compounds are shown in parentheses. B) Brown eye pigments, also found in wild-type flies. Are produced by the ommochrome biosynthetic pathway. The products and intermediates of this pathway are notfluorescent. These brwon pigments, together with the bright red pteridines, produce the red-brick eye color characteristic ofwild-type D. melanogaster.
Numerous eye-color mutants have been identified and characterized. For instance, mutations inthe brown (bw) gene can disrupt biosynthesis of the pteridine drosopterin, which results inbrown eye color in homozygous individuals. Mutations in the scarlet (st) gene, on the otherhand, can abolish synthesis of the ommochrome xanthommatin and results in scarlet eye color inhomozygotes.
Mutations in the vermilion gene (vn) affect the function of tryptophan pyrrolase. This enzymecatalyzes the conversion of tryptophan to N-formylkynurenine in the first step of ommochromebiosynthesis (Figure 8A, step A). Mutations in the cinnabar gene (cn), adversely affect theenzyme kynurenine-3-hydroxylase, which catalyzes the conversion of kynurenine to3-hydroxykynurenine (Figure 8B step C). A homozygous mutation in either of these genesinhibits the production of xanthommatin and produces a bright-red eye color.
Notably, bw/bw vn/vn and bw/bw cn/cn double mutants have white eyes since no coloredpigments are produced by either pathway. If double mutant larvae are treated by addition ofkynurenine to their growth medium, the adult bw/bw vn/vn flies emerge with brown eyes! Theaddition of kynurenine negates the effect of the vn mutation since the affected enzyme(tryptophan pyrrolase) acts upstream of the kynurenine intermediate in the biosynthetic pathway.Apparently, larvae can absorb and utilize kynurenine from the nutritive medium and effectively
Genetics Laboratory Manual Garey et al. 25
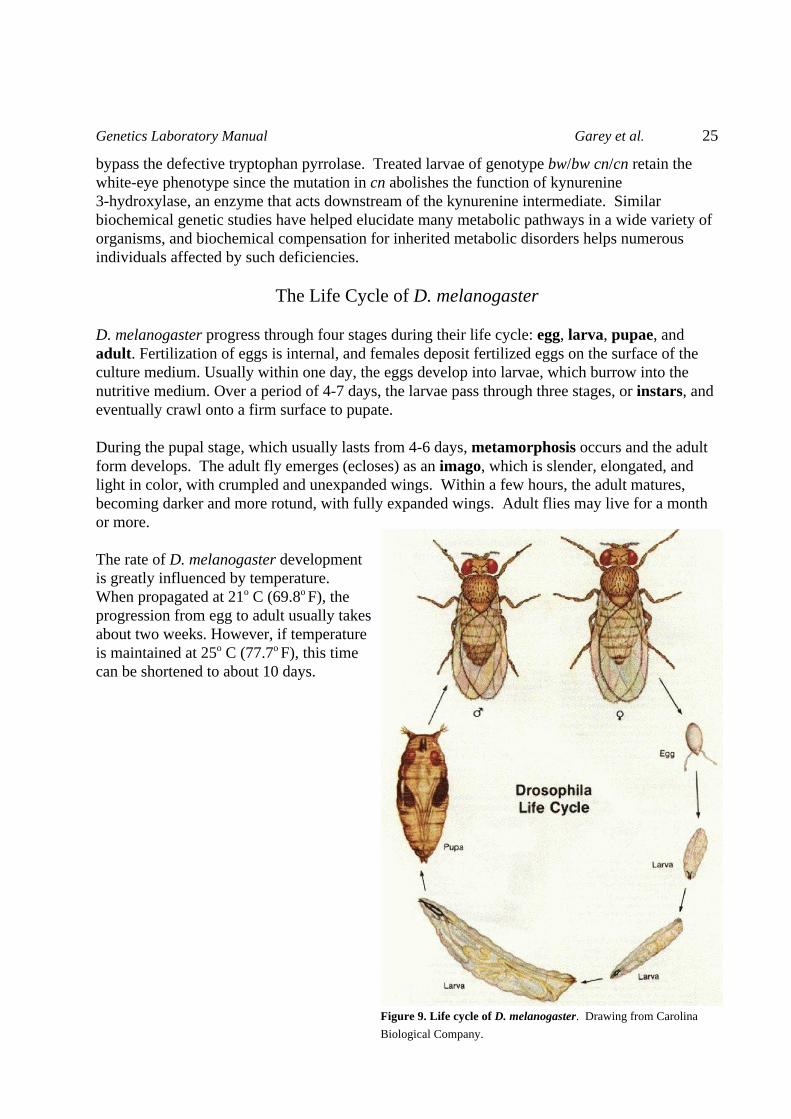
Figure 9. Life cycle of D. melanogaster. Drawing from Carolina
Biological Company.
bypass the defective tryptophan pyrrolase. Treated larvae of genotype bw/bw cn/cn retain thewhite-eye phenotype since the mutation in cn abolishes the function of kynurenine3-hydroxylase, an enzyme that acts downstream of the kynurenine intermediate. Similarbiochemical genetic studies have helped elucidate many metabolic pathways in a wide variety oforganisms, and biochemical compensation for inherited metabolic disorders helps numerousindividuals affected by such deficiencies.
The Life Cycle of D. melanogaster
D. melanogaster progress through four stages during their life cycle: egg, larva, pupae, andadult. Fertilization of eggs is internal, and females deposit fertilized eggs on the surface of theculture medium. Usually within one day, the eggs develop into larvae, which burrow into thenutritive medium. Over a period of 4-7 days, the larvae pass through three stages, or instars, andeventually crawl onto a firm surface to pupate.
During the pupal stage, which usually lasts from 4-6 days, metamorphosis occurs and the adultform develops. The adult fly emerges (ecloses) as an imago, which is slender, elongated, andlight in color, with crumpled and unexpanded wings. Within a few hours, the adult matures,becoming darker and more rotund, with fully expanded wings. Adult flies may live for a monthor more.
The rate of D. melanogaster developmentis greatly influenced by temperature. When propagated at 21o C (69.8o F), theprogression from egg to adult usually takesabout two weeks. However, if temperatureis maintained at 25o C (77.7o F), this timecan be shortened to about 10 days.
Genetics Laboratory Manual Garey et al. 26
Working with D. melanogaster Media
For our purposes, D. melanogaster will be raised in plastic culture vials, which may contain asmall piece of plastic netting to increase surface area for attachment of pupae. The culturemedium is a complex mixture of agar, sugars, other nutritional supplements, and mold inhibitors. Handling Flies Fly-nap, a commercial fly anesthetic, will be used anesthetize flies for transfer and scoring. Tobegin, dip a wand into Fly-nap and insert it into a fly vial. Do not touch the Fly-nap wanddirectly to the walls of the vial or to the medium, and be careful not to let any flies escape. Keepthe vial on its side for 3-5 minutes. The flies should land on the glass side of the vial as theybecome unconscious. If the vial is left upright, the flies will become mired in the medium andeventually die. Flies can be over-anesthetized, which results in sterility or death, so do not leavethe Fly-nap wand in the vial longer than necessary. Flies should remain unconscious for at least20 minutes. Shake out the anesthetized flies onto a small sheet of white paper and observe them under thestereo microscope. Flies that are not needed to set up crosses or for other manipulations can bedisposed of in bottles labeled as morgues. These bottles contain either liquid detergent, oil, oralcohol and should be kept sealed when not in use. Scoring Phenotypes It will often be necessary to accurately identify phenotypic characteristics each as eye color orshape, body color, and bristle or wing morphology. Some differences in phenotypes are moresubtle than others and mistaking vermillion eyes for the wild type brick red color could lead toerroneous conclusions.
In most cases, you will be using a stereo microscope (dissection microscope) to examine variousphenotypes or determine the sex of an individual fly. To accurately score flies for phenotypedifferences that are difficult to distinguish, it is easiest to make direct comparisons by having awild type fly and the mutant strain both in the field of view of the stereo microscope. Determining the Sex of Adult Flies Along with scoring various phenotypes, it is critical that the sex of each fly is accuratelydetermined. In sex linkage studies, flies must be classified as male or female, and for geneticcrossing, males from one stock will often be mated with females from another stock. Withpractice, the task of sexing flies becomes easy.
Several distinguishing features can be used to determine the sex of adult D. melanogaster. Ingeneral, females are larger than males but this is not a very reliable criterion. The clearestdifferences are seen by examining the genitalia on the ventral side of the tip of the abdomen. Thetip of the abdomen is pointed and elongated in females but appears more rounded in males. In
Genetics Laboratory Manual Garey et al. 27
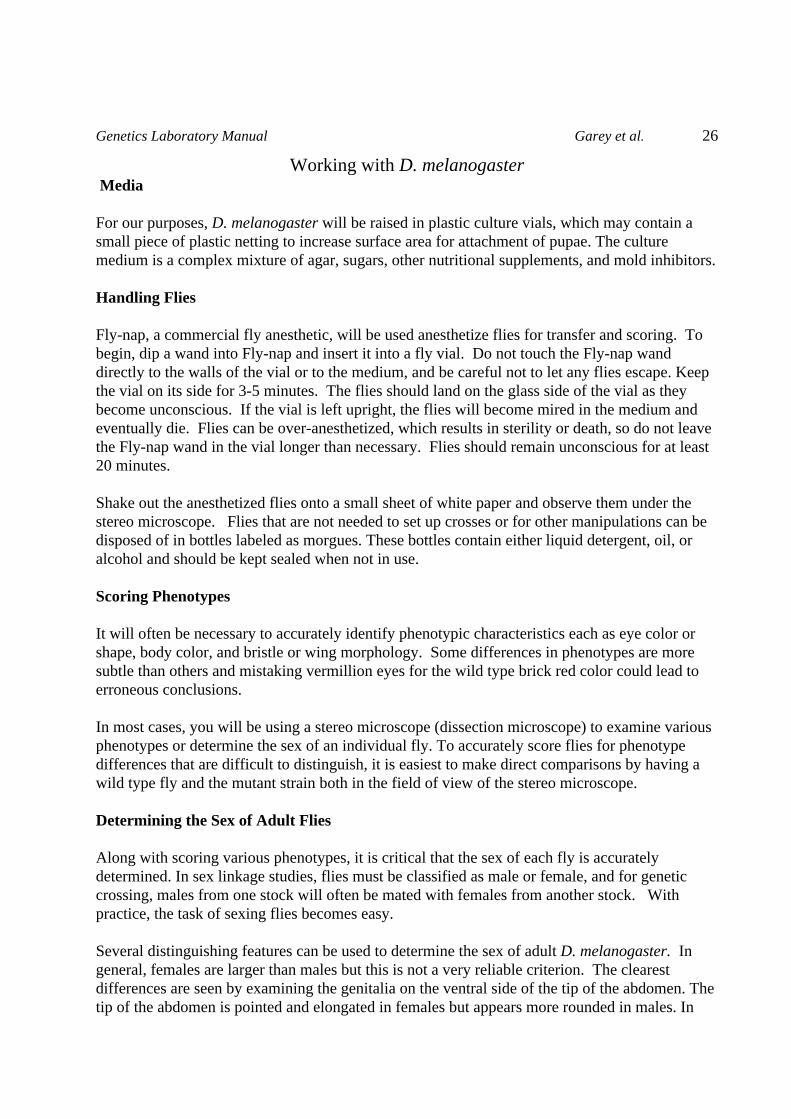
Figure 10. Sexual dimorphism of D. melanogaster. Drawing from Carolina BiologicalCompany.
older adults, this area is often darker colored in males. The male’s genitalia are quite complexcompared to the females and are surrounded by dark heavy bristles, which are absent in females. Males also have fewer sternites which are bristled ventral abdominal segments. Normally,males have only five sternites while there are often seven in females. Another reliablecharacteristic is the presence of sex combs on the distal portion of the front legs in males. Theseappear as dense "barb-like" structures and are used to secure females during copulation. Femalesdo not possess sex combs.
Preparing Genetic Crosses In the crosses you will be doing, the P1 generation has already been crossed. To do this it was necessary to isolate virgin females. Although this has been done for you it is important tounderstand the process. A D. melanogaster female can store and use sperm for days after she hasbeen impregnated. Since a female may mate with several different males over a short period,there is no way to predict which eggs were fertilized by which male. However, since females donot reach sexual maturity for approximately 10-12 hours after emerging from the pupal stage,virgin flies can be isolated during that time. This is accomplished by removing (or clearing) alladult flies from a culture and collecting any females that emerge within the following 10-12 hourperiod. An alternative, but riskier method for isolating virgins involves identifying young females basedon morphological characteristics. Sexually immature females can often be distinguished fromolder females by their pale color, elongated abdomen, crumpled wings, and a characteristic darkspot on the posterior ventral part of their abdomen.
Virgin females are usually only needed for the P1 generation since the F1 is usually self-crossedto produce the F2 generation.
Genetics Laboratory Manual Garey et al. 28
Observation and Handling of D. melanogaster mutants
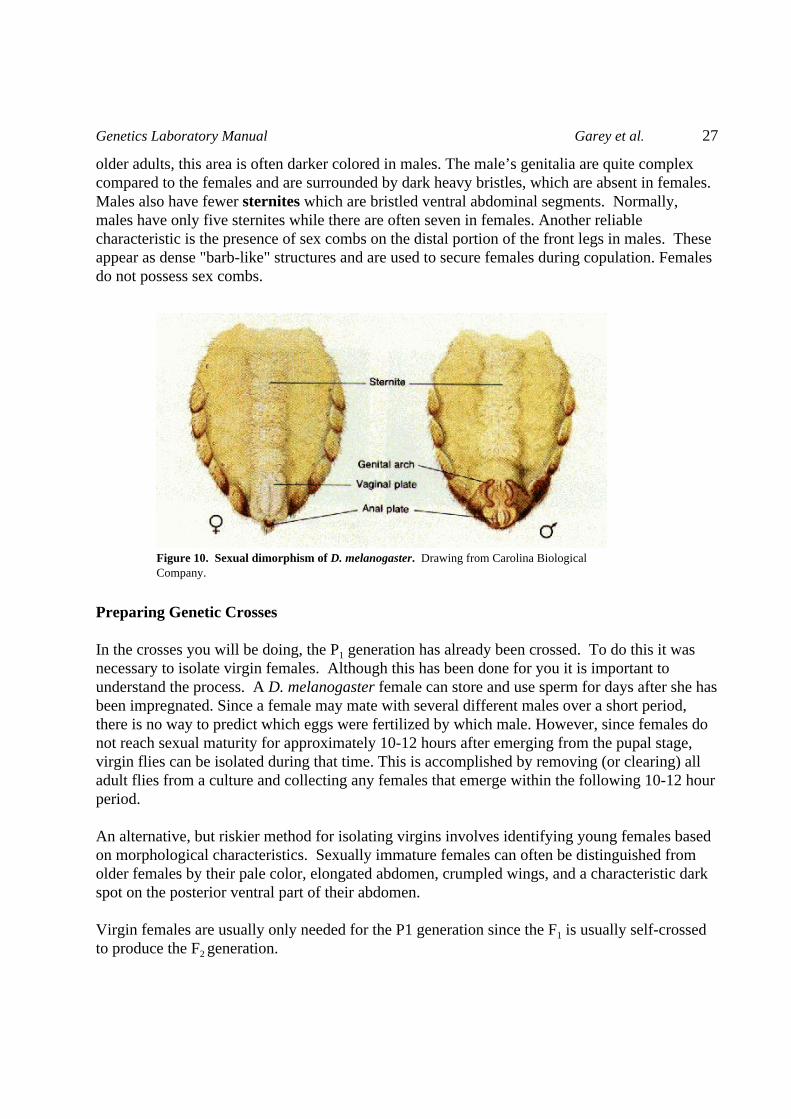
Observe and sketch each of the following:
Phenotype Genotype Location Chromosome
Wildtype +/+
vestigial vg/vg wing 2
apterous ap/ap wing 2
dumpy dp/dp wing 2
black b/b body 2
yellow y/y body 1 (sex-linked)
ebony eb/eb body 3
brown bw/bw eye 2
white w/w eye 1 (sex-linked)
sepia se/se eye 3
eyeless ey/ey eye 4
vermillion vn/vn eye 1 (sex-linked)
You will be given flies with “unknown” mutations to identify.
Since some traits are sex-linked, it will be necessary to observe the phenotype occurrence inmales as compared to females. It is a good idea to sort the flies by sex and then by phenotype.Follow instructions given above to sedate the flies using Flynap.
In your lab notebook and lab report:
Include a drawing of the life cycle and sketches of a males and females for all phenotypes.
Genetics Laboratory Manual Garey et al. 29
Mendelian Inheritance in D. melanogaster
In this exercise, you will investigate the inheritance of traits in D. melanogaster, using theMendelian model to develop your hypotheses. You will work with monohybrid, dihybrid andsex-linked crosses to determine the genotypes of the F1 and F2 generations and the phenotypes.
Upon completion of this lab, you should be able to:
J Predict the offspring of a monohybrid, a dihybrid and a sex-linked cross.J Determine the parents of a designed cross from the ratios of observed offspring.J Calculate phenotypic ratios and carry out Chi-squared analyses for each cross.
Background:
Each cross begins with true breeding (homozygous) parents. A homozygote has two identicalalleles for a given trait. If parents with different traits are crossed (aa x AA), the offspring will beheterozygous (Aa), receiving one allele from each parent. However, the offspring will expressonly one allele, which Mendel described as dominant. The masked trait is recessive; two allelesmust be present for a recessive trait to be expressed. The parents in this cross are referred to asthe P generation, and the hybrid offspring, as the F1 (first filial or hybrid) generation. Two F1hybrids are crossed to produce the F2 generation.
The predicted Mendelian results for the F2 generation from a monohybrid cross (Aa x Aa) is a1:2:1 genotypic ratio and a 3:1 phenotypic ratio. Mendel formulated his law of segregation toexplain these results: allele pairs separate during gamete formation and return to the pairedcondition during the fertilization to form a zygote.
Mendel’s dihybrid crosses showed that traits did segregate and that pairs of alleles (Aa & Bb)assorted themselves independently of other pairs of alleles during meiosis (Mendel’s law ofindependent assortment). If two traits segregate independently, then four kinds of gametes willbe produced by the F1 generation and the offspring will have a 9:3:3:1 phenotypic ratio.
A common observation in genetics is that the product of several different genes can interact toproduce certain phenotypes. Two independent genes (e.g. non-interacting), each with adominant/recessive pair of alleles, will produce four phenotypes in a 9:3:3:1 ratio in the F2
generation of a dihybrid cross. However, if there is an interaction between the two genes(epistasis) a modified F2 dihybrid ratio may be observed.
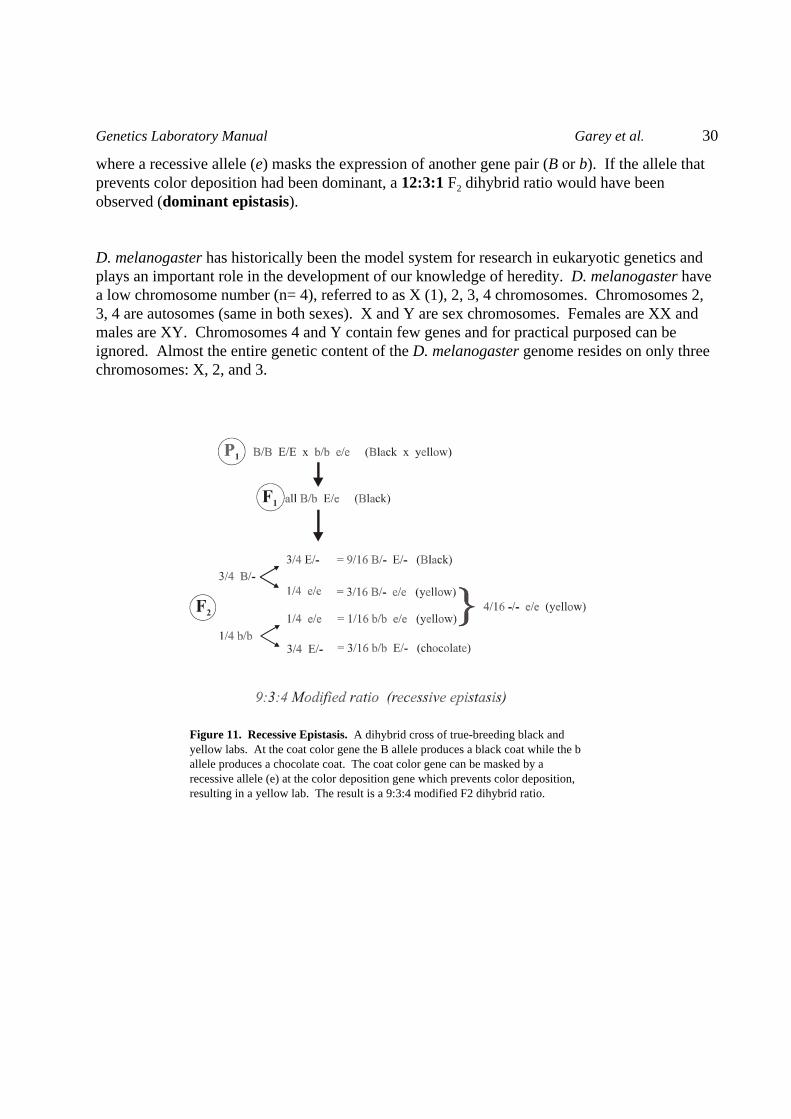
In Labrador retrievers, two loci are responsible for coat color. Allele B and b of a pigment genedetermines black (B) or chocolate (b) coats. Another locus contains allele E which allows colordeposition or allele e which prevents color deposition. A black lab is B/- E/-, a chocolate lab isb/b E/-, while a yellow lab is homozygous for the e allele (e.g. -/- e/e), which displays recessiveepistasis to the pigment gene. A dihybrid cross involving these genes is diagramed in Figure 9. Note that the result is a modified F2 dihybrid ratio of 9:3:4, indicative of recessive epistasis
Genetics Laboratory Manual Garey et al. 30
Figure 11. Recessive Epistasis. A dihybrid cross of true-breeding black andyellow labs. At the coat color gene the B allele produces a black coat while the ballele produces a chocolate coat. The coat color gene can be masked by arecessive allele (e) at the color deposition gene which prevents color deposition,resulting in a yellow lab. The result is a 9:3:4 modified F2 dihybrid ratio.
where a recessive allele (e) masks the expression of another gene pair (B or b). If the allele thatprevents color deposition had been dominant, a 12:3:1 F2 dihybrid ratio would have beenobserved (dominant epistasis).
D. melanogaster has historically been the model system for research in eukaryotic genetics andplays an important role in the development of our knowledge of heredity. D. melanogaster havea low chromosome number (n= 4), referred to as X (1), 2, 3, 4 chromosomes. Chromosomes 2,3, 4 are autosomes (same in both sexes). X and Y are sex chromosomes. Females are XX andmales are XY. Chromosomes 4 and Y contain few genes and for practical purposed can beignored. Almost the entire genetic content of the D. melanogaster genome resides on only threechromosomes: X, 2, and 3.
Genetics Laboratory Manual Garey et al. 31
Procedure:
You will be given vials of flies and perform one monohybrid, one dihybrid and one sex-linkedcross from the following five possible crosses:
Monohybrid se/se x +/+ ap/ap x +/+
Dihybrid +/+ ap/ap x se/se +/+ +/+ vg/vg x se/se +/+
Sex-linked w/w x +/Y
Each group will do one of each cross. Select 10 females and 5 males from each F1 generationfrom which you will make the cross and place them in fresh vials. Label each cross with thedate, your initials and the nature of the cross.
In your lab notebook:
Record the genotypes and phenotypes for the P1 generation.
Record the expected F1 genotypes and examine at least 30 flies for sex and phenotype for eachcross.
Record the expected F2 genotypes and examine at least 100 flies for sex and phenotype.
Obtain data from other lab groups that carried out the same crosses (pooled data).
Calculate the phenotypic ratios for each cross using (1) only your data and (2) using your pooleddata.
Carry out Chi-squared analysis for each cross using (1) your data and (2) your pooled datacomparing your data to the expected phenotypic ratios for the mono- and dihybrid crosses andthe sex-linked cross.
Lab report:
Your lab report should include your raw data, including all calculations, phenotype sketches, andconclusions, whether or not you got expected results and if they were significant.
Genetics Laboratory Manual Garey et al. 32
Recombination and Chromosome Mapping in D. melanogaster This exercise introduces chromosome mapping and demonstrates how the frequency ofrecombination between genes relates to their physical location in the genome. You will usethree-point mapping to determine the physical relationship between three genes on chromosome2 of D. melanogaster. The frequency of crossing over between genes will be calculated from thenumbers of different recombinant F2 offspring generated by crossing a heterozygous female witha hemozygous mutant male.
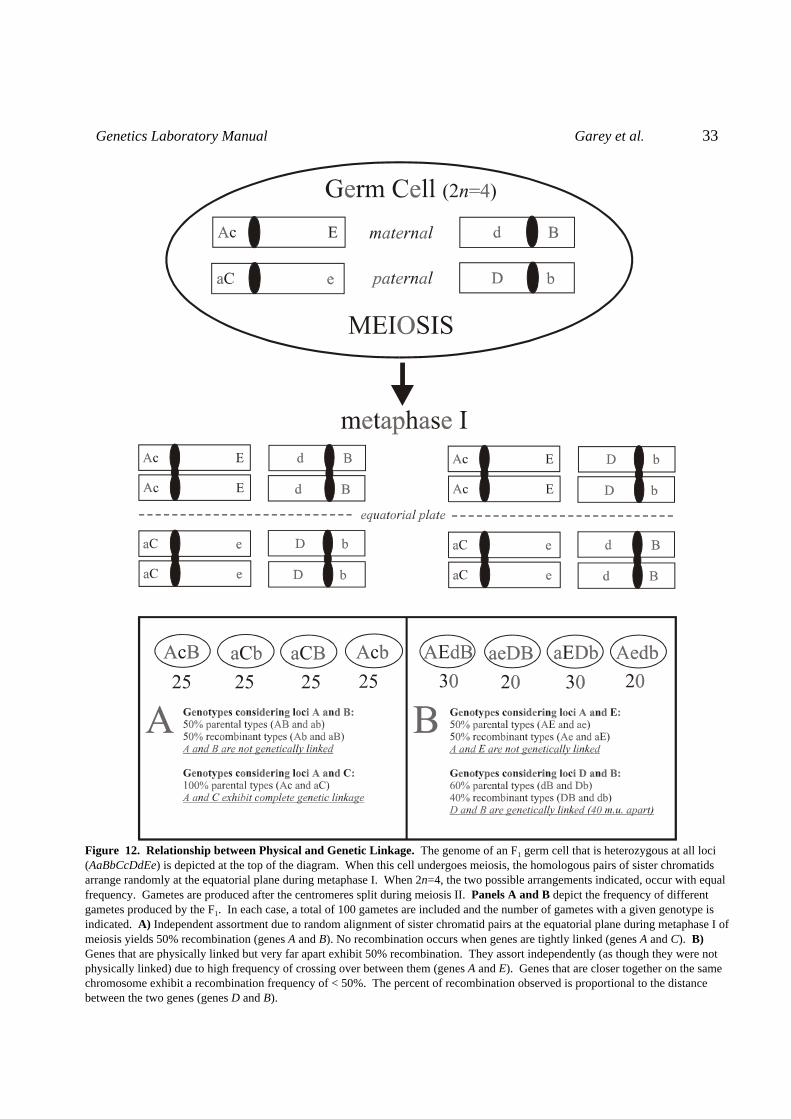
Upon completion of this exercise you should be able to J Discuss the relationship between recombination frequency and linkage J Perform linkage analysis and map genes using data from F2 offspring J Calculate the coefficient of coincidence and interference Independent Assortment: A key observation that Mendel described in his 1865 paper, Versüche über Pflänzen Hybriden(Studies of Plant Hybridization), was independent assortment. Simply stated, it means thatgenes on different chromosomes distribute randomly during the formation of gametes. Considera germ cell (i.e. a spermatogonium or oogonium) containing two pairs of chromosomes (2n=4).If it is heterozygous for gene A on one chromosome (e.g. A/a), and for gene B on the otherchromosome (e.g. B/b), meiosis will yield haploid gametes (i.e. sperm or eggs) having genotypeAB, Ab, aB, or ab, in equal proportions. In other words, since A and B are not physically linked(on the same chromosome), the two genes assort independently. This is due to the randomarrangement of sister chromatid pairs at the equatorial plate during metaphase I of meiosis(Figure 10).
Genetic Linkage and Recombination Two tightly linked genes are likely to be co-inherited rather than exhibiting independentassortment. Consider the tight linkage indicated between the A and C genes in Figure 10. Ifthese two genetic loci are so near each other that crossing over does not occur between them,they will always segregate together and no recombinant gametes will be produced. The gameteswill only receive a parental combination of A and C alleles.
Even though genes on the same chromosome are considered to be in the same linkage group,they can assort independently if there is a great distance between them. Consider the A and Egenes indicated in Figure 10. The great distance separating these two genes allows for a highfrequency of crossing over between them and results in the production of 50% recombinantgametes. Such genes are physically linked but are not genetically linked. Often, the frequency of crossing over between physically linked genes is less than 50% asindicated for the D and B genes in Figure 10. In such cases, the genes exhibit genetic linkage and
Genetics Laboratory Manual Garey et al. 33
Figure 12. Relationship between Physical and Genetic Linkage. The genome of an F1 germ cell that is heterozygous at all loci(AaBbCcDdEe) is depicted at the top of the diagram. When this cell undergoes meiosis, the homologous pairs of sister chromatidsarrange randomly at the equatorial plane during metaphase I. When 2n=4, the two possible arrangements indicated, occur with equalfrequency. Gametes are produced after the centromeres split during meiosis II. Panels A and B depict the frequency of differentgametes produced by the F1. In each case, a total of 100 gametes are included and the number of gametes with a given genotype isindicated. A) Independent assortment due to random alignment of sister chromatid pairs at the equatorial plane during metaphase I ofmeiosis yields 50% recombination (genes A and B). No recombination occurs when genes are tightly linked (genes A and C). B)Genes that are physically linked but very far apart exhibit 50% recombination. They assort independently (as though they were notphysically linked) due to high frequency of crossing over between them (genes A and E). Genes that are closer together on the samechromosome exhibit a recombination frequency of < 50%. The percent of recombination observed is proportional to the distancebetween the two genes (genes D and B).
Genetics Laboratory Manual Garey et al. 34
the ratio of recombinant gametes to parental types is proportional to the distance separating the two loci.
Chromosome Mapping If the frequency of crossing over between two genes is less than 50%, it is proportional to thephysical distance separating the two loci. If the frequency is 50% or greater, linkage cannot bedetermined since independent assortment produces this frequency when two genes reside ondifferent chromosomes. When the recombination frequency between two genetic loci is less than50% it is possible to determine the order and arrangement of the genes on a chromosome. Acommonly used technique is called three-point mapping. Three-point mapping involves scoring phenotypes in the offspring of a test cross where oneparent is heterozygous at the three loci of interest and the other parent is homozygous recessive.Consider the heterozygote described in Figure 10. If that individual were crossed to ahomozygous recessive tester, offspring showing a combination of wild-type and recessive traitscould only result from a crossing over. That is how crossing over can be identified: by observingthe visible result in progeny of a test cross.
In this Exercise, genes located on chromosome 2 of D. melanogaster will be mapped. Theoffspring from a cross between heterozygous wild type females and homozygous mutant maleswill be scored to assess the recombination frequency between the three genetic loci. Under theseconditions, flies should fall into one of eight distinct phenotypic categories based on thecombination of phenotypes they display.
Examine the hypothetical cross diagramed in Figure 11. Three hypothetical loci are beinginvestigated: Q (quilted jacket), R (rimmed glasses), and T (top hat). Flies of genotype Q/- donot wear a jacket. Those with genotype R/- do not wear glasses, and those with genotype T/- donot wear a hat. Females that are homozygous recessive at any of these loci, and males that arehomozygous recessive at any of these loci are clad in some combination of this attire. Forinstance, a female with genotype qRt/qrt wears a quilted jacket and top hat, but not glasses. Amale of genotype QrT/Y wears rimmed glasses, but no jacket or hat. The largest category ofoffspring observed (50 flies) are parental types and are identical to their mother or father. Thenext two largest categories (25 and 20 flies, respectively) are recombinants resulting from asingle crossover event. The smallest class (5 flies) is also comprised of recombinants, but thisgroup results from double crossovers. By comparing the phenotypes of these rare doublecrossover recombinants to their parents, one can determine the order of genes on thechromosome. Notice that three of these flies wear quilted jackets and top hats, while the othertwo reciprocals wear only rimmed glasses. The only characteristic that distinguishes either groupfrom one of the parents is the presence or absence of glasses. This means that gene R must be inthe middle. Since double crossovers are a very rare event, there are low numbers of progeny inthis category. In any three-point mapping experiment, the double recombinant class is alwaysthe smallest. Knowing that the reciprocal phenotypes in this class result from a doublecrossover, we can conclude that the genetic loci distinguishing these progeny from their parentsmust have a single crossover between it and the adjacent gene on either side. This places thatlocus in the middle of the three genes.
Genetics Laboratory Manual Garey et al. 35
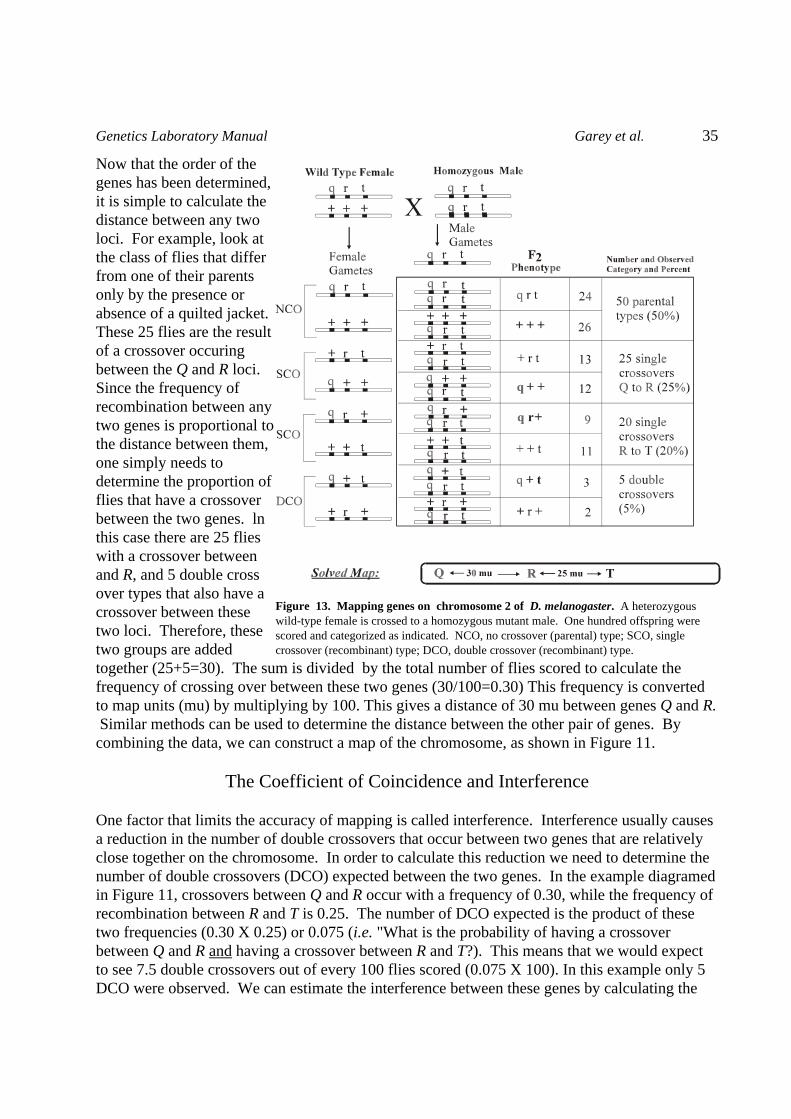
Figure 13. Mapping genes on chromosome 2 of D. melanogaster. A heterozygouswild-type female is crossed to a homozygous mutant male. One hundred offspring werescored and categorized as indicated. NCO, no crossover (parental) type; SCO, singlecrossover (recombinant) type; DCO, double crossover (recombinant) type.
Now that the order of thegenes has been determined,it is simple to calculate thedistance between any twoloci. For example, look atthe class of flies that differfrom one of their parentsonly by the presence orabsence of a quilted jacket.These 25 flies are the resultof a crossover occuringbetween the Q and R loci. Since the frequency ofrecombination between anytwo genes is proportional tothe distance between them,one simply needs todetermine the proportion offlies that have a crossoverbetween the two genes. lnthis case there are 25 flieswith a crossover between and R, and 5 double crossover types that also have acrossover between thesetwo loci. Therefore, thesetwo groups are addedtogether (25+5=30). The sum is divided by the total number of flies scored to calculate thefrequency of crossing over between these two genes (30/100=0.30) This frequency is convertedto map units (mu) by multiplying by 100. This gives a distance of 30 mu between genes Q and R. Similar methods can be used to determine the distance between the other pair of genes. Bycombining the data, we can construct a map of the chromosome, as shown in Figure 11.
The Coefficient of Coincidence and Interference One factor that limits the accuracy of mapping is called interference. Interference usually causesa reduction in the number of double crossovers that occur between two genes that are relativelyclose together on the chromosome. In order to calculate this reduction we need to determine thenumber of double crossovers (DCO) expected between the two genes. In the example diagramedin Figure 11, crossovers between Q and R occur with a frequency of 0.30, while the frequency ofrecombination between R and T is 0.25. The number of DCO expected is the product of thesetwo frequencies (0.30 X 0.25) or 0.075 (i.e. "What is the probability of having a crossoverbetween Q and R and having a crossover between R and T?). This means that we would expectto see 7.5 double crossovers out of every 100 flies scored (0.075 X 100). In this example only 5DCO were observed. We can estimate the interference between these genes by calculating the
Genetics Laboratory Manual Garey et al. 36
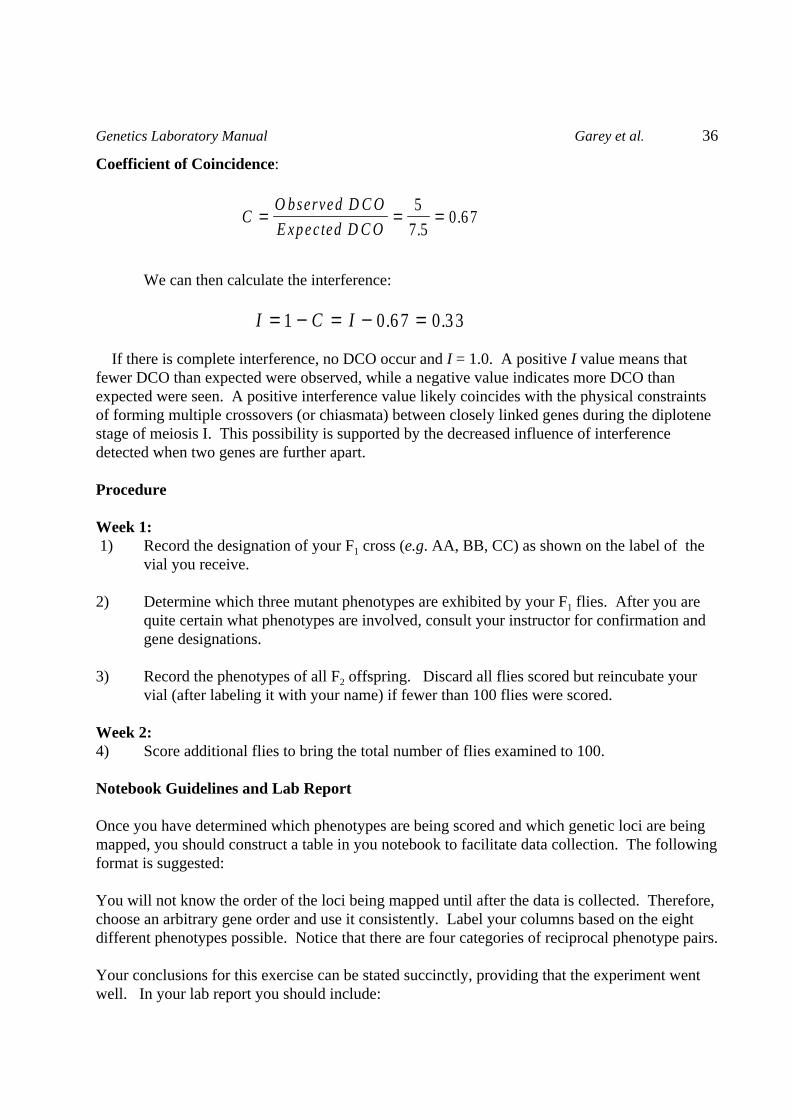
Coefficient of Coincidence:
CO bserved D C O
E xpec ted D C O= = =
5
7 50 6 7
..
We can then calculate the interference:
I C I= − = − =1 0 6 7 0 3 3. . If there is complete interference, no DCO occur and I = 1.0. A positive I value means thatfewer DCO than expected were observed, while a negative value indicates more DCO thanexpected were seen. A positive interference value likely coincides with the physical constraintsof forming multiple crossovers (or chiasmata) between closely linked genes during the diplotenestage of meiosis I. This possibility is supported by the decreased influence of interferencedetected when two genes are further apart. Procedure Week 1: 1) Record the designation of your F1 cross (e.g. AA, BB, CC) as shown on the label of the
vial you receive.
2) Determine which three mutant phenotypes are exhibited by your F1 flies. After you arequite certain what phenotypes are involved, consult your instructor for confirmation andgene designations.
3) Record the phenotypes of all F2 offspring. Discard all flies scored but reincubate your
vial (after labeling it with your name) if fewer than 100 flies were scored. Week 2:4) Score additional flies to bring the total number of flies examined to 100. Notebook Guidelines and Lab Report Once you have determined which phenotypes are being scored and which genetic loci are beingmapped, you should construct a table in you notebook to facilitate data collection. The followingformat is suggested: You will not know the order of the loci being mapped until after the data is collected. Therefore,choose an arbitrary gene order and use it consistently. Label your columns based on the eightdifferent phenotypes possible. Notice that there are four categories of reciprocal phenotype pairs.
Your conclusions for this exercise can be stated succinctly, providing that the experiment wentwell. In your lab report you should include:
Genetics Laboratory Manual Garey et al. 37
1) an explanation of how this cross allowed you to evaluate the behavior of recessive genes during meiosis and gametogenesis in one parent by observing the phenotypes of diploid offspring arising from zygotes that were produced by two parents.
2) a discussion of which genes are linked or unlinked, and the analysis of data that led to
your conclusions. 3) a complete map of linked genes, including the distances between them.
4) a calculation of the coefficient of coincidence and interference values, where appropriate,together with a discussion of their significance.
Make sure to relate your conclusions to your results and show all calculations. If your datamakes little sense, try to assess the nature of the senselessness both qualitatively and, wherepossible, quantitatively. Discuss any inconsistencies in your data with other students and theinstructor prior to writing your report. References Dickinson, W. and D. Sullivan. Gene enzyme systems in Drosophila, Springer-Verlag, New York. 1975.
Flagg, Raymond, Carolina Drosophila melanogaster Manual, 1988, Carolina Biological Company (copies are available in the laboratory).
Hadorn, E. 1962. Fractionating the fruit fly. Scientific American. 206: 101-109. Hartl, D.L. and E.E. Jones, Genetics: Principles and Analysis, 4th ed., Jones and Bartlett, 1998.
Klug, W.S. and M.R. Cummings, Concepts of Genetics, 5th ed,. Prentiss Hall, Inc, 1997. Morgan, T.H. 1911. An attempt to analyze the constitution of chromosomes on the basis of sex-linked inheritancein Drosophila melanogaster. J. Exp. Zool. 11: 365-414. Sturtevant, A.H. 1913. The linear arrangement of six sex-linked factors in Drosophila melanogaster, as shown bytheir mode of association. J. Exp. Zool. 14: 43-59
Parsons, P. and M. Green. 1959. Pleiotrophy and competition at the vermilion locus inDrosophila melanogaster, Proc. Natl. Acad. Sci. USA 45: 993-996. Phillips, J. and H. Forest. 1980. Ommochromes and Pteridines, in The Genetics and Biology of Drosophila,Ashburner, M. and T. Wright, eds., Academic Press, New York, pp. 541-623.
Ziegler, I. 1961. Generic aspects of ommachrome and pterin pigments. Adv. in Genetics, 10: 349-403.
The Virtual Fly Lab, California State University at Los Angeles, on the World Wide Web athttp://vflylab.calstatela.edu/
Genetics Laboratory Manual Garey et al. 38
CHAPTER FOUR
Molecular Genetics
Introduction
Molecular genetics is the study of inheritance at the molecular level and includes such topics asgene and genome structure, regulation of gene expression, and diagnosis of genetic diseases bydirect genotyping. In this part of the course, we will carry out a series of lab exercises in whichwe will:
(1) Observe the complexity of a number of different genomes
(2) Use the polymerase chain reaction (PCR) to isolate and visualize a specific D.melanogaster gene
(3) Sequence the PCR amplified DNA from D. melanogaster
(4) Clone the PCR product into a plasmid
Background
In order to carry out these lab exercises, it is important to understand the basic principles ofrestriction endonucleases digestion of DNA, agarose gel electrophoresis, the polymerase chainreaction, and basic molecular cloning. Further information can be found in your genetics text(e.g. Hartl & Jones, Genetics Principles and Analysis, Chapter 9: Genetic Engineering andGenome Analysis).
Restriction Enzyme Digestion of DNA
Restriction endonucleases are enzymes purified from bacteria. They have the property of cuttingDNA at specific sites. For example, EcoRI cuts only at the sequence GAATTC. These enzymesfunction to protect the bacteria from invading viruses. Their own DNA is modified at these sitesand so will not be cut by the enzyme (e.g. bacteria containing EcoRI methylate the GAATTC sitewhich makes it immune to the enzyme), but an invading virus will not be protected and its DNAwill be cut and thus infection prevented.
Restriction enzymes are named after the species from which they were purified, thus EcoRI wasthe first enzyme to be isolated from E. coli strain RY13, and EcoRV is the fifth enzyme to bepurified from the same bacteria.
Restriction enzymes generally recognize a 6 base sequence. They cut only double stranded DNA,and often leave a "sticky" end. A six base recognizing enzyme will cut DNA on the average every46 or 4096 bases. A four base recognition enzyme will cut on the average every 44 or 256nucleotides. There are some 8 base recognition enzymes that cut on the average every 48 or~16000 nucleotides. The actual pattern of cutting depends on the DNA being digested in terms of
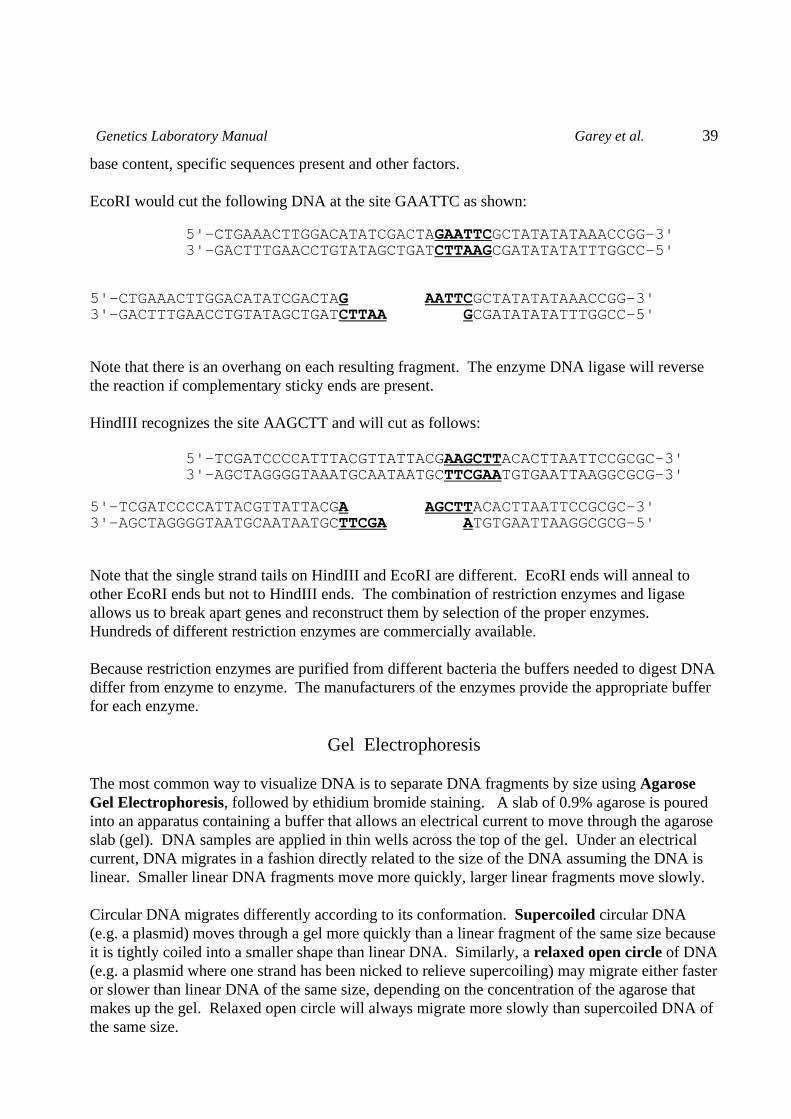
Genetics Laboratory Manual Garey et al. 39
base content, specific sequences present and other factors.
EcoRI would cut the following DNA at the site GAATTC as shown:
5'-CTGAAACTTGGACATATCGACTAGAATTCGCTATATATAAACCGG-3'3'-GACTTTGAACCTGTATAGCTGATCTTAAGCGATATATATTTGGCC-5'
5'-CTGAAACTTGGACATATCGACTAG AATTCGCTATATATAAACCGG-3'3'-GACTTTGAACCTGTATAGCTGATCTTAA GCGATATATATTTGGCC-5'
Note that there is an overhang on each resulting fragment. The enzyme DNA ligase will reversethe reaction if complementary sticky ends are present.
HindIII recognizes the site AAGCTT and will cut as follows:
5'-TCGATCCCCATTTACGTTATTACGAAGCTTACACTTAATTCCGCGC-3'3'-AGCTAGGGGTAAATGCAATAATGCTTCGAATGTGAATTAAGGCGCG-3'
5'-TCGATCCCCATTACGTTATTACGA AGCTTACACTTAATTCCGCGC-3'3'-AGCTAGGGGTAATGCAATAATGCTTCGA ATGTGAATTAAGGCGCG-5'
Note that the single strand tails on HindIII and EcoRI are different. EcoRI ends will anneal toother EcoRI ends but not to HindIII ends. The combination of restriction enzymes and ligaseallows us to break apart genes and reconstruct them by selection of the proper enzymes. Hundreds of different restriction enzymes are commercially available.
Because restriction enzymes are purified from different bacteria the buffers needed to digest DNAdiffer from enzyme to enzyme. The manufacturers of the enzymes provide the appropriate bufferfor each enzyme.
Gel Electrophoresis
The most common way to visualize DNA is to separate DNA fragments by size using AgaroseGel Electrophoresis, followed by ethidium bromide staining. A slab of 0.9% agarose is pouredinto an apparatus containing a buffer that allows an electrical current to move through the agaroseslab (gel). DNA samples are applied in thin wells across the top of the gel. Under an electricalcurrent, DNA migrates in a fashion directly related to the size of the DNA assuming the DNA islinear. Smaller linear DNA fragments move more quickly, larger linear fragments move slowly.
Circular DNA migrates differently according to its conformation. Supercoiled circular DNA(e.g. a plasmid) moves through a gel more quickly than a linear fragment of the same size becauseit is tightly coiled into a smaller shape than linear DNA. Similarly, a relaxed open circle of DNA(e.g. a plasmid where one strand has been nicked to relieve supercoiling) may migrate either fasteror slower than linear DNA of the same size, depending on the concentration of the agarose thatmakes up the gel. Relaxed open circle will always migrate more slowly than supercoiled DNA ofthe same size.
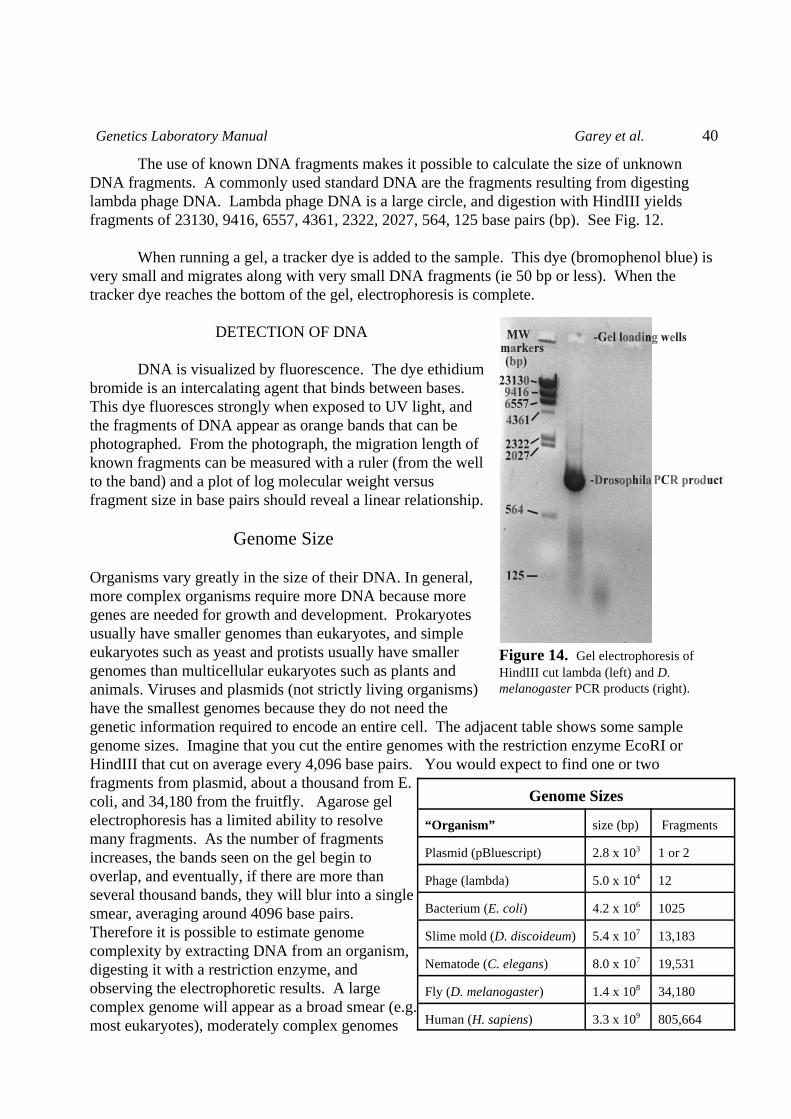
Genetics Laboratory Manual Garey et al. 40
Genome Sizes
“Organism” size (bp) Fragments
Plasmid (pBluescript) 2.8 x 10³ 1 or 2
Phage (lambda) 5.0 x 10⁴ 12
Bacterium (E. coli) 4.2 x 10⁶ 1025
Slime mold (D. discoideum) 5.4 x 10⁷ 13,183
Nematode (C. elegans) 8.0 x 10⁷ 19,531
Fly (D. melanogaster) 1.4 x 10⁸ 34,180
Human (H. sapiens) 3.3 x 10⁹ 805,664
Figure 14. Gel electrophoresis ofHindIII cut lambda (left) and D.melanogaster PCR products (right).
The use of known DNA fragments makes it possible to calculate the size of unknownDNA fragments. A commonly used standard DNA are the fragments resulting from digestinglambda phage DNA. Lambda phage DNA is a large circle, and digestion with HindIII yieldsfragments of 23130, 9416, 6557, 4361, 2322, 2027, 564, 125 base pairs (bp). See Fig. 12.
When running a gel, a tracker dye is added to the sample. This dye (bromophenol blue) isvery small and migrates along with very small DNA fragments (ie 50 bp or less). When thetracker dye reaches the bottom of the gel, electrophoresis is complete.
DETECTION OF DNA
DNA is visualized by fluorescence. The dye ethidiumbromide is an intercalating agent that binds between bases. This dye fluoresces strongly when exposed to UV light, andthe fragments of DNA appear as orange bands that can bephotographed. From the photograph, the migration length ofknown fragments can be measured with a ruler (from the wellto the band) and a plot of log molecular weight versusfragment size in base pairs should reveal a linear relationship.
Genome Size
Organisms vary greatly in the size of their DNA. In general,more complex organisms require more DNA because moregenes are needed for growth and development. Prokaryotesusually have smaller genomes than eukaryotes, and simpleeukaryotes such as yeast and protists usually have smallergenomes than multicellular eukaryotes such as plants andanimals. Viruses and plasmids (not strictly living organisms)have the smallest genomes because they do not need thegenetic information required to encode an entire cell. The adjacent table shows some samplegenome sizes. Imagine that you cut the entire genomes with the restriction enzyme EcoRI orHindIII that cut on average every 4,096 base pairs. You would expect to find one or twofragments from plasmid, about a thousand from E.coli, and 34,180 from the fruitfly. Agarose gelelectrophoresis has a limited ability to resolvemany fragments. As the number of fragmentsincreases, the bands seen on the gel begin tooverlap, and eventually, if there are more thanseveral thousand bands, they will blur into a singlesmear, averaging around 4096 base pairs. Therefore it is possible to estimate genomecomplexity by extracting DNA from an organism,digesting it with a restriction enzyme, andobserving the electrophoretic results. A largecomplex genome will appear as a broad smear (e.g.most eukaryotes), moderately complex genomes
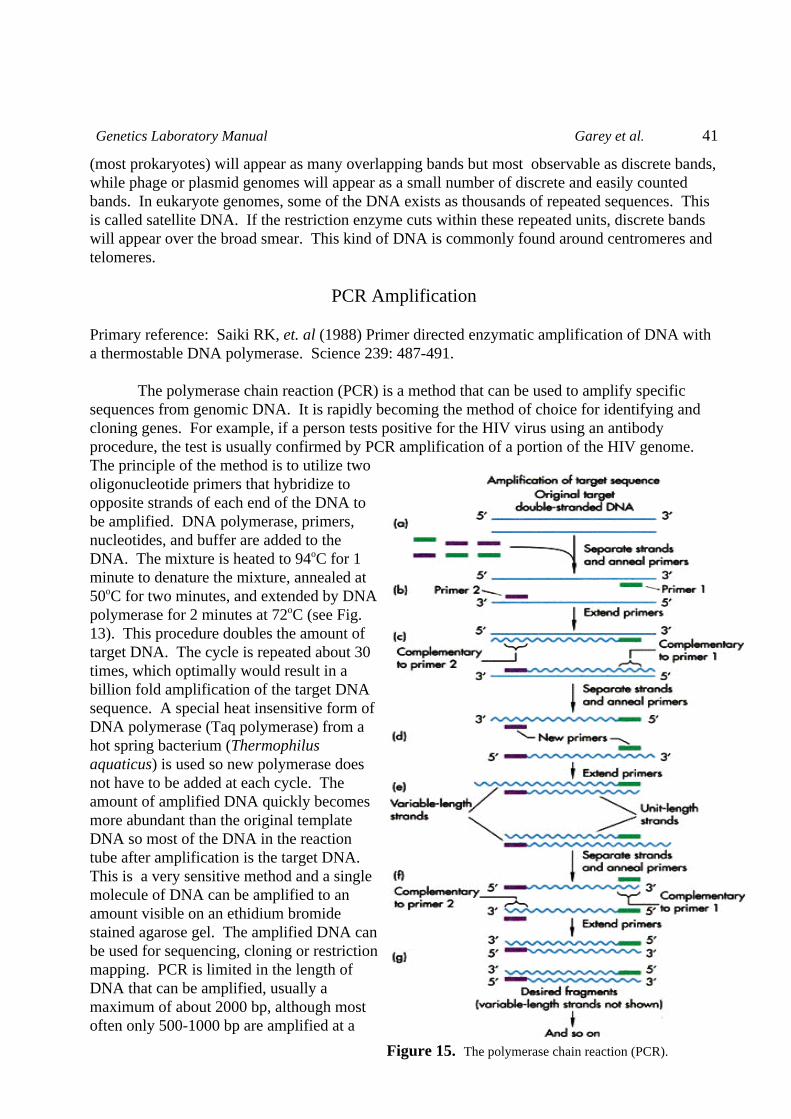
Genetics Laboratory Manual Garey et al. 41
Figure 15. The polymerase chain reaction (PCR).
(most prokaryotes) will appear as many overlapping bands but most observable as discrete bands,while phage or plasmid genomes will appear as a small number of discrete and easily countedbands. In eukaryote genomes, some of the DNA exists as thousands of repeated sequences. Thisis called satellite DNA. If the restriction enzyme cuts within these repeated units, discrete bandswill appear over the broad smear. This kind of DNA is commonly found around centromeres andtelomeres.
PCR Amplification
Primary reference: Saiki RK, et. al (1988) Primer directed enzymatic amplification of DNA witha thermostable DNA polymerase. Science 239: 487-491.
The polymerase chain reaction (PCR) is a method that can be used to amplify specificsequences from genomic DNA. It is rapidly becoming the method of choice for identifying andcloning genes. For example, if a person tests positive for the HIV virus using an antibodyprocedure, the test is usually confirmed by PCR amplification of a portion of the HIV genome. The principle of the method is to utilize twooligonucleotide primers that hybridize toopposite strands of each end of the DNA tobe amplified. DNA polymerase, primers, nucleotides, and buffer are added to theDNA. The mixture is heated to 94oC for 1minute to denature the mixture, annealed at50oC for two minutes, and extended by DNApolymerase for 2 minutes at 72oC (see Fig.13). This procedure doubles the amount oftarget DNA. The cycle is repeated about 30times, which optimally would result in abillion fold amplification of the target DNAsequence. A special heat insensitive form ofDNA polymerase (Taq polymerase) from ahot spring bacterium (Thermophilusaquaticus) is used so new polymerase doesnot have to be added at each cycle. Theamount of amplified DNA quickly becomesmore abundant than the original templateDNA so most of the DNA in the reactiontube after amplification is the target DNA. This is a very sensitive method and a singlemolecule of DNA can be amplified to anamount visible on an ethidium bromidestained agarose gel. The amplified DNA canbe used for sequencing, cloning or restrictionmapping. PCR is limited in the length ofDNA that can be amplified, usually amaximum of about 2000 bp, although mostoften only 500-1000 bp are amplified at a
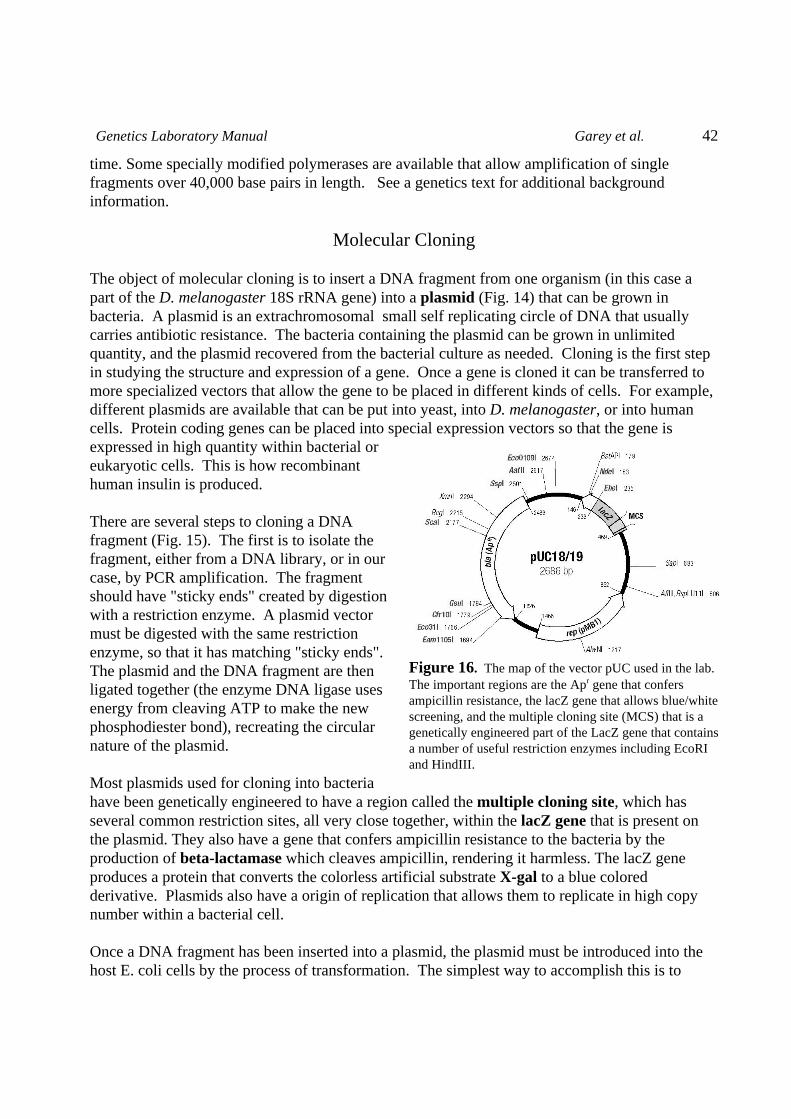
Genetics Laboratory Manual Garey et al. 42
Figure 16. The map of the vector pUC used in the lab. The important regions are the Apr gene that confersampicillin resistance, the lacZ gene that allows blue/whitescreening, and the multiple cloning site (MCS) that is agenetically engineered part of the LacZ gene that containsa number of useful restriction enzymes including EcoRIand HindIII.
time. Some specially modified polymerases are available that allow amplification of singlefragments over 40,000 base pairs in length. See a genetics text for additional backgroundinformation.
Molecular Cloning
The object of molecular cloning is to insert a DNA fragment from one organism (in this case apart of the D. melanogaster 18S rRNA gene) into a plasmid (Fig. 14) that can be grown inbacteria. A plasmid is an extrachromosomal small self replicating circle of DNA that usuallycarries antibiotic resistance. The bacteria containing the plasmid can be grown in unlimitedquantity, and the plasmid recovered from the bacterial culture as needed. Cloning is the first stepin studying the structure and expression of a gene. Once a gene is cloned it can be transferred tomore specialized vectors that allow the gene to be placed in different kinds of cells. For example,different plasmids are available that can be put into yeast, into D. melanogaster, or into humancells. Protein coding genes can be placed into special expression vectors so that the gene isexpressed in high quantity within bacterial oreukaryotic cells. This is how recombinanthuman insulin is produced.
There are several steps to cloning a DNAfragment (Fig. 15). The first is to isolate thefragment, either from a DNA library, or in ourcase, by PCR amplification. The fragmentshould have "sticky ends" created by digestionwith a restriction enzyme. A plasmid vectormust be digested with the same restrictionenzyme, so that it has matching "sticky ends". The plasmid and the DNA fragment are thenligated together (the enzyme DNA ligase usesenergy from cleaving ATP to make the newphosphodiester bond), recreating the circularnature of the plasmid.
Most plasmids used for cloning into bacteriahave been genetically engineered to have a region called the multiple cloning site, which hasseveral common restriction sites, all very close together, within the lacZ gene that is present onthe plasmid. They also have a gene that confers ampicillin resistance to the bacteria by theproduction of beta-lactamase which cleaves ampicillin, rendering it harmless. The lacZ geneproduces a protein that converts the colorless artificial substrate X-gal to a blue coloredderivative. Plasmids also have a origin of replication that allows them to replicate in high copynumber within a bacterial cell.
Once a DNA fragment has been inserted into a plasmid, the plasmid must be introduced into thehost E. coli cells by the process of transformation. The simplest way to accomplish this is to
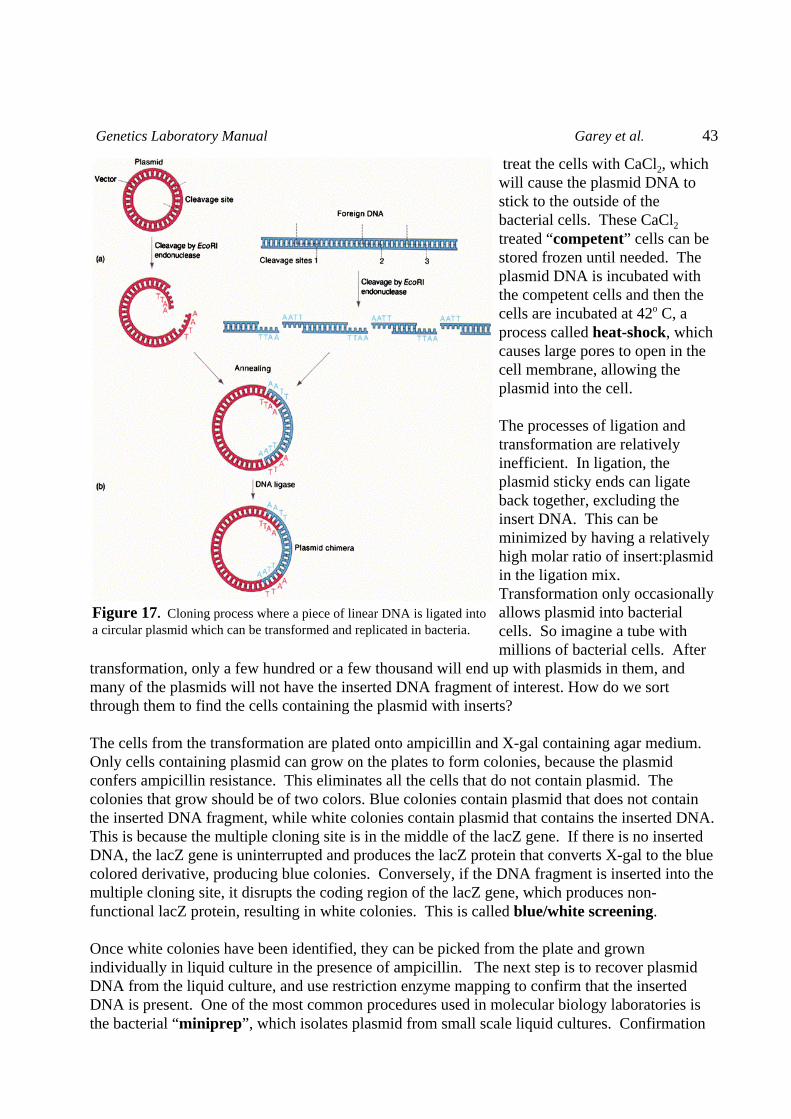
Genetics Laboratory Manual Garey et al. 43
Figure 17. Cloning process where a piece of linear DNA is ligated intoa circular plasmid which can be transformed and replicated in bacteria.
treat the cells with CaCl2, whichwill cause the plasmid DNA tostick to the outside of thebacterial cells. These CaCl2
treated “competent” cells can bestored frozen until needed. Theplasmid DNA is incubated withthe competent cells and then thecells are incubated at 42o C, aprocess called heat-shock, whichcauses large pores to open in thecell membrane, allowing theplasmid into the cell.
The processes of ligation andtransformation are relativelyinefficient. In ligation, theplasmid sticky ends can ligateback together, excluding theinsert DNA. This can beminimized by having a relativelyhigh molar ratio of insert:plasmidin the ligation mix. Transformation only occasionallyallows plasmid into bacterialcells. So imagine a tube withmillions of bacterial cells. After
transformation, only a few hundred or a few thousand will end up with plasmids in them, andmany of the plasmids will not have the inserted DNA fragment of interest. How do we sortthrough them to find the cells containing the plasmid with inserts?
The cells from the transformation are plated onto ampicillin and X-gal containing agar medium. Only cells containing plasmid can grow on the plates to form colonies, because the plasmidconfers ampicillin resistance. This eliminates all the cells that do not contain plasmid. Thecolonies that grow should be of two colors. Blue colonies contain plasmid that does not containthe inserted DNA fragment, while white colonies contain plasmid that contains the inserted DNA. This is because the multiple cloning site is in the middle of the lacZ gene. If there is no insertedDNA, the lacZ gene is uninterrupted and produces the lacZ protein that converts X-gal to the bluecolored derivative, producing blue colonies. Conversely, if the DNA fragment is inserted into themultiple cloning site, it disrupts the coding region of the lacZ gene, which produces non-functional lacZ protein, resulting in white colonies. This is called blue/white screening.
Once white colonies have been identified, they can be picked from the plate and grownindividually in liquid culture in the presence of ampicillin. The next step is to recover plasmidDNA from the liquid culture, and use restriction enzyme mapping to confirm that the insertedDNA is present. One of the most common procedures used in molecular biology laboratories isthe bacterial “miniprep”, which isolates plasmid from small scale liquid cultures. Confirmation
Genetics Laboratory Manual Garey et al. 44
is necessary because some white colonies will be false-positives that do not contain the expectedinsert DNA, usually because some very small extraneous DNA fragment was inserted or becausethe plasmid self-ligated improperly so that the lacZ gene has a frameshift mutation. Miniprepsare carried out by first centrifuging a milliliter of culture and resuspending the cells in a buffercontaining lysozyme, which helps digest away the cell wall. Then sodium dodecyl sulfate (SDS-a strong detergent that lyses cell membranes) is added in the presence of sodium hydroxide, aprocess known as alkaline lysis, which releases the DNA from the bacterial cells. We now havecrude extract containing proteins, a large quantity of bacterial genomic DNA, and a small amountof plasmid DNA. The next step is to add a reagent (3M K, 5M Na Acetate) which precipitates themuch larger genomic DNA, leaving the smaller plasmid DNA in solution. After centrifugation,the supernatant, now containing plasmid DNA and protein, can be phenol extracted to remove theprotein. Phenol is an acidic organic solvent that removes protein (but not DNA) from the aqueousphase, leaving only plasmid DNA in the aqueous phase. The DNA solution is mixed with anequal volume of phenol and mixed thoroughly by vortexing. The sample is centrifuged andshould contain two or three layers. The top layer is the clear aqueous phase with the DNA, themiddle layer (if any) is a mixture of protein, water and phenol. The bottom phase (yellow) is thephenol that also contains protein that was extracted from the aqueous phase. Only the topaqueous phase is transferred to a clean tube, leaving behind the interphase and phenol phase (seeFigure 17 on page 53).
Restriction Mapping
Restriction mapping is a way of identifying DNA fragments based on the principle that any givenDNA sequence has a unique pattern of restriction endonuclease sites. We will use a simple formof restriction mapping to confirm that a plasmid has an insert. Imagine that a 1.2 kb fragment ofDNA (with HindIII sites at either end) is ligated into a 3 kb plasmid. Ten different white coloniesare grown in culture and plasmid DNA isolated from each by alkaline lysis minipreps. Eachplasmid sample can be digested with HindIII, and then electrophoresed on an agarose gel. Two ofthe gel lanes show only a 3 kb band (false positives), while eight of the gel lanes show a 3 kb anda 1.2 kb band and are positive clones.
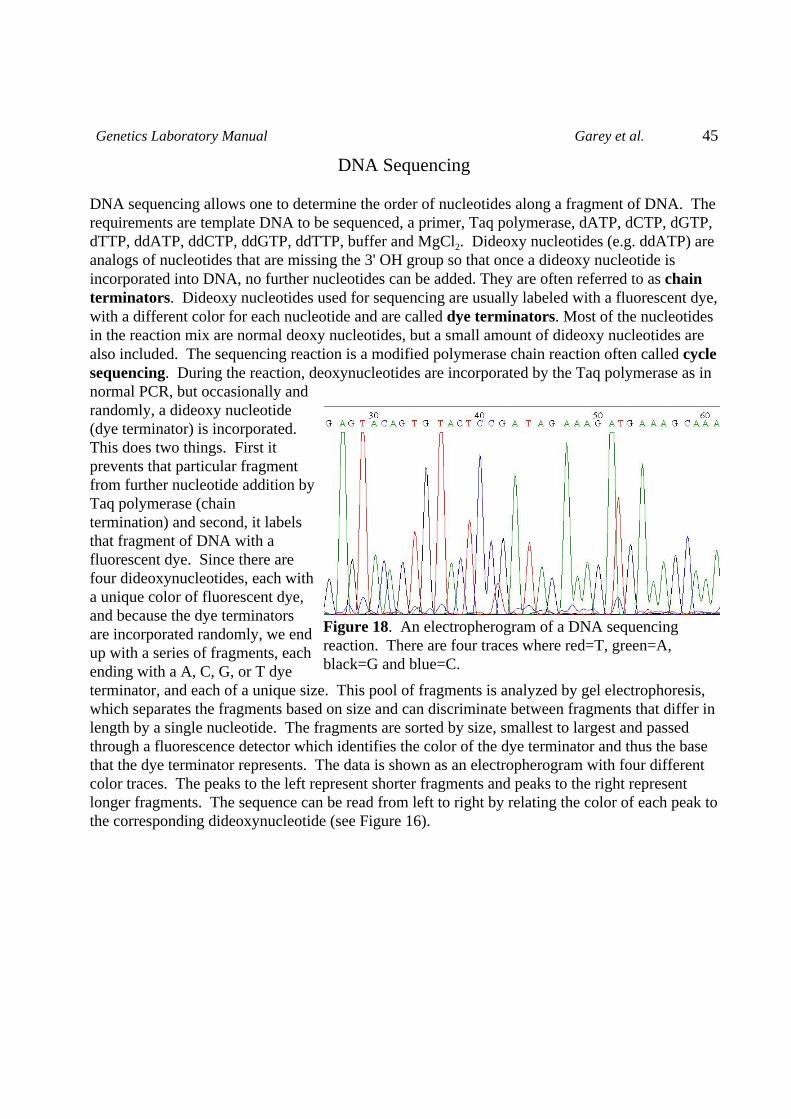
Genetics Laboratory Manual Garey et al. 45
Figure 18. An electropherogram of a DNA sequencingreaction. There are four traces where red=T, green=A,black=G and blue=C.
DNA Sequencing
DNA sequencing allows one to determine the order of nucleotides along a fragment of DNA. Therequirements are template DNA to be sequenced, a primer, Taq polymerase, dATP, dCTP, dGTP,dTTP, ddATP, ddCTP, ddGTP, ddTTP, buffer and MgCl2. Dideoxy nucleotides (e.g. ddATP) areanalogs of nucleotides that are missing the 3' OH group so that once a dideoxy nucleotide isincorporated into DNA, no further nucleotides can be added. They are often referred to as chainterminators. Dideoxy nucleotides used for sequencing are usually labeled with a fluorescent dye,with a different color for each nucleotide and are called dye terminators. Most of the nucleotidesin the reaction mix are normal deoxy nucleotides, but a small amount of dideoxy nucleotides arealso included. The sequencing reaction is a modified polymerase chain reaction often called cyclesequencing. During the reaction, deoxynucleotides are incorporated by the Taq polymerase as innormal PCR, but occasionally andrandomly, a dideoxy nucleotide(dye terminator) is incorporated. This does two things. First itprevents that particular fragmentfrom further nucleotide addition byTaq polymerase (chaintermination) and second, it labelsthat fragment of DNA with afluorescent dye. Since there arefour dideoxynucleotides, each witha unique color of fluorescent dye,and because the dye terminatorsare incorporated randomly, we endup with a series of fragments, eachending with a A, C, G, or T dyeterminator, and each of a unique size. This pool of fragments is analyzed by gel electrophoresis,which separates the fragments based on size and can discriminate between fragments that differ inlength by a single nucleotide. The fragments are sorted by size, smallest to largest and passedthrough a fluorescence detector which identifies the color of the dye terminator and thus the basethat the dye terminator represents. The data is shown as an electropherogram with four differentcolor traces. The peaks to the left represent shorter fragments and peaks to the right representlonger fragments. The sequence can be read from left to right by relating the color of each peak tothe corresponding dideoxynucleotide (see Figure 16).
Genetics Laboratory Manual Garey et al. 46
PROCEDURES
Digestion of DNA.
Make sure you understand how to use the micro pipettors. Use the appropriate unit for thevolume being transferred. Ask your TA if you are not sure. Remember not to push the plungerpast the “blow-out” point before drawing liquid into the tip.
You will be given four samples of DNA, most likely a plasmid, phage, bacteria and fly DNA. Setup a digestion as follows in four labeled microfuge tubes:
DNA sample DNA 10X buffer BSA Water EnzymeBacteria 10 ul 10 ul 1 ul 77 ul 2 ulPhage 10 ul 10 ul 1 ul 77 ul 2 ulplasmid 10 ul 10 ul 1 ul 77 ul 2 ul
Cap each tube and mix by tapping or flicking the tube with your finger, then give the tube a 10second spin to bring the contents to the bottom. Incubate for 2 hours to overnight.
Add 0.1 volume of 3M NaAc and 2 volumes of 100% ethanol, place in the freezer for one hour toovernight (or longer as is convenient). This is the standard protocol to precipitate DNA by thecombination of high salt and high ethanol concentration.
Centrifuge the DNA for 10 minutes. You should be able to see a tiny white pellet. Pour out theethanol gently, and allow the tube to drain onto a paper towel, then allow to air dry for 15minutes.
Resuspend the pellet in 15 ul of 1X gel loading buffer. Run on a 0.9% agarose gel using Hind IIIcut lambda as a molecular weight marker:
Running a Gel:
1. Add 0.9 g agarose to 100 ml 1X TAE buffer. Put flask in microwave oven with a loose (non-metallic) cap. Heat at 80% power for 1 minute 45 seconds. This should dissolve the agarosewithout boiling over. After heating, remove and allow to cool to about 60oC, swirlingoccasionally.
50X TAE: 242 g Tris base57.1 ml glacial acetic acid4 ml 0.5 M EDTA, pH 8.0bring volume to 1 liter with distilled water
2. Prepare the gel bed by taping up the ends. Pour the hot agarose into the gel bed, place thecomb in its slot, and allow the gel to cool. It should turn slightly milky as it cools.
Genetics Laboratory Manual Garey et al. 47
3. Fill the apparatus with 1X TAE + 500 �g/liter EtBr. Remember EtBr is a chemical mutagen,so be sure to wear gloves and be very careful. Another common electrophoresis buffer is TBE(Tris-Borate-EDTA), which works equally well.
4. Remove the tape from the gel bed and place in apparatus. There should be just enough bufferto cover the gel. Remove the comb. Remember, the electrophoresis buffer contains ethidiumbromide, a mutagen. Wear gloves when handling the gel.
5. Load the samples. Gently pipette the sample in each well. Be careful not to poke the pipettetip through the bottom of the well because your sample would then leak underneath the gel and belost.
6. Run the gel at 100 V for 1.5 hr.
7. After the gel has run, it must be photographed. Your TA will probably photograph the gel foryou. Here is the procedure. Place the gel (be sure to wear gloves when handling the gel) on a UVlightbox. (The DNA bands should fluoresce an orange color due to the ethidium bromide (A UVfilter is placed over the camera lense to block out the UV light, so that only the fluorescent orangecolor from the DNA-ethidium bromide produces an image on the film). Put the plastic shielddown over the light box and turn on the power. The plastic shield blocks the shortwave UV butallows the orange color to pass through. Photograph the gel on the UV lightbox (place a piece ofplastic wrap between the lightbox and gel to keep the light box dry. Use Polaroid type 667 film f11, 1 second. The camera has a fixed focus and a hood. Do not look directly at the UV light(wear safety goggles). Place the hood over the gel, press the trigger, then pull the film tab, andextract the film. Wait 15 seconds, then peel the photo from the rest of the film.
Short Wave UV light is dangerous. Use face shields and safety glasses when workingaround the UV light.
8. Note that for equimolar ratios of DNA fragments, the longer the fragment - the more intensethe fluorescence A 10 kb fragment will be 10 times as bright as a 1 kb fragment if the bandscontain the same number of moles of fragment. For this reason the 564 bp band will be very faint,and the 125 bp fragment will not show up at all.
ANALYSIS Did you see distinct bands in all lanes, or did you see smears in some? How manybands in each lane? Estimate the average molecular weight of the DNA in each lane (e.g. centerof fluorescence. Calculate the molecular weight of the plasmid using a standard curve with theHindIII markers.
PCR Amplification
You will PCR amplify a portion of the 18S rRNA gene of D. melanogaster. The gene isabout 2 kb in length and is present as multiple copies in the genome. You will amplify 1100 bp ofthe gene (5' end; see sequence below). We will begin with 0.5 �g of total genomic DNA. SeeFig. 12 for an example of the PCR products following agarose gel electrophoresis.
Genetics Laboratory Manual Garey et al. 48
A PCR Reagent kit will be used to amplify the DNA. The amplification will be performed in a0.2 ml microcentrifuge tube with a total reaction volume of 100 ul composed of the followingingredients to be added in the exact order listed:
Water 69 ul10X rxn buffer 10 �l (200 mM Tris-HCl pH 8.75, 100 mM KCl,1 mg/ml BSA)50 mM MgCl2 6 ulNucleotide mix 2 �l 12.5 mM each dATP, dCTP, dGTP, dTTPprimer 1 (18S4) 5 �l (10 uM)primer 2 (18S5) 5 �l (10 uM)Your DNA 2 �l (~0.5 ug)Taq polymerase 1 �l (5 units/ul)
TEMPERATURE CYCLING: Your TA will show you how to use the thermal cycler. Itshould take 3-4 hours to run. After the run, remove your sample and store in the refrigerator.
The program should be as follows:94o 30 sec (initial denaturing)begin cycling94o 15 sec (denature)50o 30 sec (anneal)72o 2 min (extension)cycle 35 times72o 10 min (time to fill any gaps)4o until you stop it, for storage
Spun Column Purification of PCR products
The Qiagen columns contain silica-gel which bind DNA (PCR product) but not unincorporatednucleotides or proteins under high salt conditions (Buffer PB). Unincorporated nucleotides andother impurities are washed away with an ethanol containing buffer (PE). Then the PCRproducts can be eluted with low salt buffer (e.g. water) .
Procedure:
1. Obtain a Qiagen column from your TA. 2. Add five volumes of buffer PB to your PCR products (e.g. 500 ul PB to 100ul products).3. Place the column in a 2 ml collection tube and apply the sample.4. Spin for 60 seconds5. Empty the collection tube and replace the column.6. Add 750 ul buffer PE to column and spin for 60 seconds.7. Place column on fresh 1.5 ml tube, add 50 ul distilled water and spin for 60 seconds.8. Collect the purified PCR product from the 1.5 ml tube.
ANALYSIS You will then analyze the DNA by agarose gel electrophoresis (0.9% gel, as in theprevious lab - see above). Remove 5 �l of each PCR sample (save the remainder), add 2 �l of gel
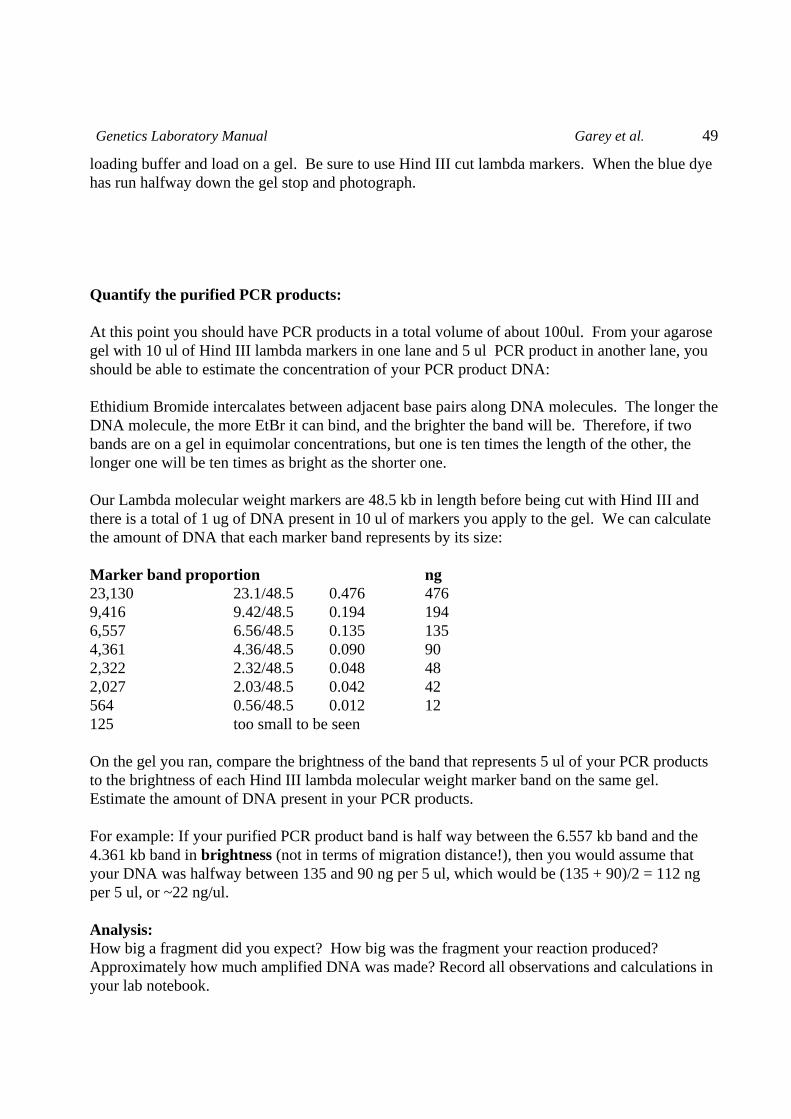
Genetics Laboratory Manual Garey et al. 49
loading buffer and load on a gel. Be sure to use Hind III cut lambda markers. When the blue dyehas run halfway down the gel stop and photograph.
Quantify the purified PCR products:
At this point you should have PCR products in a total volume of about 100ul. From your agarosegel with 10 ul of Hind III lambda markers in one lane and 5 ul PCR product in another lane, youshould be able to estimate the concentration of your PCR product DNA:
Ethidium Bromide intercalates between adjacent base pairs along DNA molecules. The longer theDNA molecule, the more EtBr it can bind, and the brighter the band will be. Therefore, if twobands are on a gel in equimolar concentrations, but one is ten times the length of the other, thelonger one will be ten times as bright as the shorter one.
Our Lambda molecular weight markers are 48.5 kb in length before being cut with Hind III andthere is a total of 1 ug of DNA present in 10 ul of markers you apply to the gel. We can calculatethe amount of DNA that each marker band represents by its size:
Marker band proportion ng23,130 23.1/48.5 0.476 4769,416 9.42/48.5 0.194 1946,557 6.56/48.5 0.135 1354,361 4.36/48.5 0.090 902,322 2.32/48.5 0.048 482,027 2.03/48.5 0.042 42564 0.56/48.5 0.012 12125 too small to be seen
On the gel you ran, compare the brightness of the band that represents 5 ul of your PCR productsto the brightness of each Hind III lambda molecular weight marker band on the same gel. Estimate the amount of DNA present in your PCR products.
For example: If your purified PCR product band is half way between the 6.557 kb band and the4.361 kb band in brightness (not in terms of migration distance!), then you would assume thatyour DNA was halfway between 135 and 90 ng per 5 ul, which would be (135 + 90)/2 = 112 ngper 5 ul, or ~22 ng/ul.
Analysis:How big a fragment did you expect? How big was the fragment your reaction produced? Approximately how much amplified DNA was made? Record all observations and calculations inyour lab notebook.
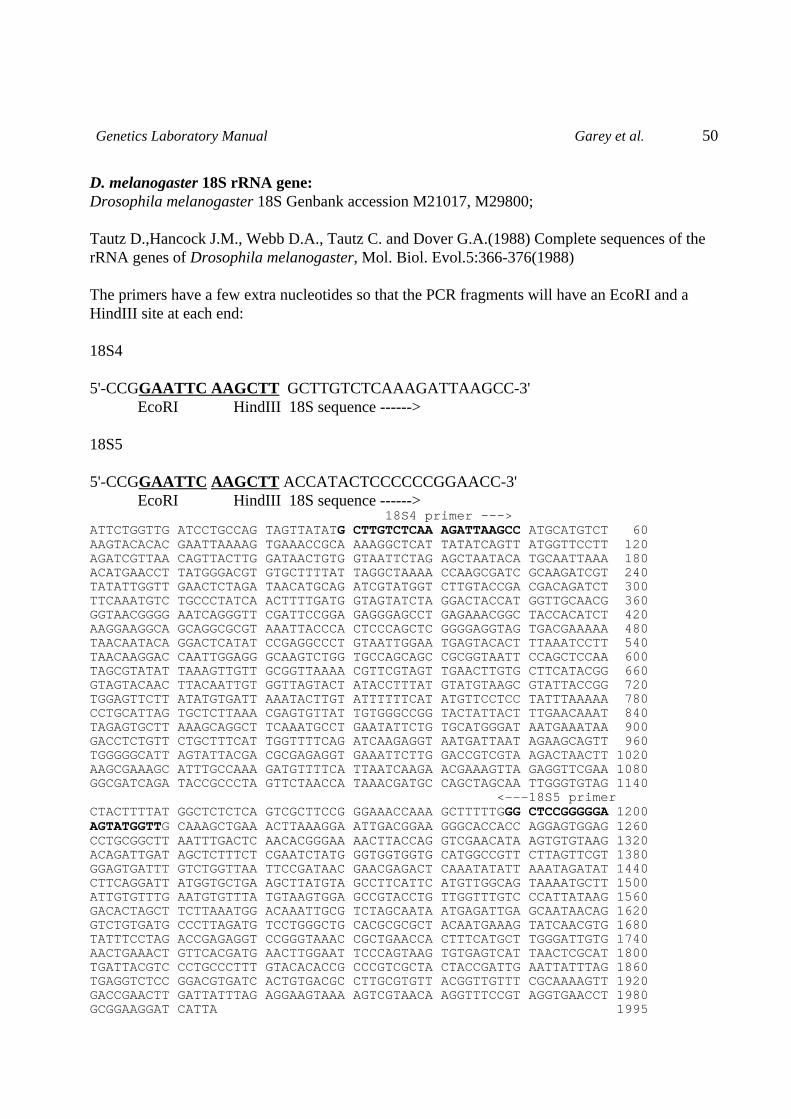
Genetics Laboratory Manual Garey et al. 50
D. melanogaster 18S rRNA gene:Drosophila melanogaster 18S Genbank accession M21017, M29800;
Tautz D.,Hancock J.M., Webb D.A., Tautz C. and Dover G.A.(1988) Complete sequences of therRNA genes of Drosophila melanogaster, Mol. Biol. Evol.5:366-376(1988) The primers have a few extra nucleotides so that the PCR fragments will have an EcoRI and aHindIII site at each end:
18S4
5'-CCGGAATTC AAGCTT GCTTGTCTCAAAGATTAAGCC-3'EcoRI HindIII 18S sequence ------>
18S5
5'-CCGGAATTC AAGCTT ACCATACTCCCCCCGGAACC-3' EcoRI HindIII 18S sequence ------> 18S4 primer --->ATTCTGGTTG ATCCTGCCAG TAGTTATATG CTTGTCTCAA AGATTAAGCC ATGCATGTCT 60AAGTACACAC GAATTAAAAG TGAAACCGCA AAAGGCTCAT TATATCAGTT ATGGTTCCTT 120AGATCGTTAA CAGTTACTTG GATAACTGTG GTAATTCTAG AGCTAATACA TGCAATTAAA 180ACATGAACCT TATGGGACGT GTGCTTTTAT TAGGCTAAAA CCAAGCGATC GCAAGATCGT 240TATATTGGTT GAACTCTAGA TAACATGCAG ATCGTATGGT CTTGTACCGA CGACAGATCT 300TTCAAATGTC TGCCCTATCA ACTTTTGATG GTAGTATCTA GGACTACCAT GGTTGCAACG 360GGTAACGGGG AATCAGGGTT CGATTCCGGA GAGGGAGCCT GAGAAACGGC TACCACATCT 420AAGGAAGGCA GCAGGCGCGT AAATTACCCA CTCCCAGCTC GGGGAGGTAG TGACGAAAAA 480TAACAATACA GGACTCATAT CCGAGGCCCT GTAATTGGAA TGAGTACACT TTAAATCCTT 540TAACAAGGAC CAATTGGAGG GCAAGTCTGG TGCCAGCAGC CGCGGTAATT CCAGCTCCAA 600TAGCGTATAT TAAAGTTGTT GCGGTTAAAA CGTTCGTAGT TGAACTTGTG CTTCATACGG 660GTAGTACAAC TTACAATTGT GGTTAGTACT ATACCTTTAT GTATGTAAGC GTATTACCGG 720TGGAGTTCTT ATATGTGATT AAATACTTGT ATTTTTTCAT ATGTTCCTCC TATTTAAAAA 780CCTGCATTAG TGCTCTTAAA CGAGTGTTAT TGTGGGCCGG TACTATTACT TTGAACAAAT 840TAGAGTGCTT AAAGCAGGCT TCAAATGCCT GAATATTCTG TGCATGGGAT AATGAAATAA 900GACCTCTGTT CTGCTTTCAT TGGTTTTCAG ATCAAGAGGT AATGATTAAT AGAAGCAGTT 960TGGGGGCATT AGTATTACGA CGCGAGAGGT GAAATTCTTG GACCGTCGTA AGACTAACTT 1020AAGCGAAAGC ATTTGCCAAA GATGTTTTCA TTAATCAAGA ACGAAAGTTA GAGGTTCGAA 1080GGCGATCAGA TACCGCCCTA GTTCTAACCA TAAACGATGC CAGCTAGCAA TTGGGTGTAG 1140 <---18S5 primer CTACTTTTAT GGCTCTCTCA GTCGCTTCCG GGAAACCAAA GCTTTTTGGG CTCCGGGGGA 1200AGTATGGTTG CAAAGCTGAA ACTTAAAGGA ATTGACGGAA GGGCACCACC AGGAGTGGAG 1260CCTGCGGCTT AATTTGACTC AACACGGGAA AACTTACCAG GTCGAACATA AGTGTGTAAG 1320ACAGATTGAT AGCTCTTTCT CGAATCTATG GGTGGTGGTG CATGGCCGTT CTTAGTTCGT 1380GGAGTGATTT GTCTGGTTAA TTCCGATAAC GAACGAGACT CAAATATATT AAATAGATAT 1440CTTCAGGATT ATGGTGCTGA AGCTTATGTA GCCTTCATTC ATGTTGGCAG TAAAATGCTT 1500ATTGTGTTTG AATGTGTTTA TGTAAGTGGA GCCGTACCTG TTGGTTTGTC CCATTATAAG 1560GACACTAGCT TCTTAAATGG ACAAATTGCG TCTAGCAATA ATGAGATTGA GCAATAACAG 1620GTCTGTGATG CCCTTAGATG TCCTGGGCTG CACGCGCGCT ACAATGAAAG TATCAACGTG 1680TATTTCCTAG ACCGAGAGGT CCGGGTAAAC CGCTGAACCA CTTTCATGCT TGGGATTGTG 1740AACTGAAACT GTTCACGATG AACTTGGAAT TCCCAGTAAG TGTGAGTCAT TAACTCGCAT 1800TGATTACGTC CCTGCCCTTT GTACACACCG CCCGTCGCTA CTACCGATTG AATTATTTAG 1860TGAGGTCTCC GGACGTGATC ACTGTGACGC CTTGCGTGTT ACGGTTGTTT CGCAAAAGTT 1920GACCGAACTT GATTATTTAG AGGAAGTAAA AGTCGTAACA AGGTTTCCGT AGGTGAACCT 1980GCGGAAGGAT CATTA 1995
Genetics Laboratory Manual Garey et al. 51
DNA Sequencing
1. Based on the agarose gel analysis of your PCR product, determine the volume of PCR productthat would contain 100 ng of DNA to use for template.
2. Assemble the reaction in a 0.2 ml PCR tube:
8 ul Terminator Ready Reaction Mix (TRR)4 ul Primer (3.2 pico moles)X ul Template DNA (your PCR product, see #1 above)X ul deionized water (to bring the total volume to 20 ul)
3. Your TA will assist you in loading the sample in the thermocycler which will carry out thecycle sequencing reaction as follows:
96o 10 seconds (denature)50o 5 seconds (annealing)60o 4 minutes (extension)repeat 25 cycles4o hold
4. This step is critical because it removes the excess dye terminators which will introduce noiseinto the electropherogram, making it useless:
A. Transfer the 20 ul reaction mix to a 1.5 ml microcentrifuge tubeB. Add 74 ul of 70% ethanol with 0.5 mM MgCl2, vortex ten secondsC. Incubate sample at room temperature for 10 minutes to allow precipitationD. Centrifuge for 15 minutes in microcentrifugeE. Carefully remove the supernatant with a pipette without disturbing the pelletF. Inspect for residual supernatant. If present, spin 10 seconds and remove supernatantG. Dry the pellet
5. Check with the TA because the following steps may be done by the TA or by you:
A. Resuspend the pellet in 25 ul Terminator suppression buffer (TSR)B. Vortex for 20 seconds, heat at 95o for 2 minutesC. Chill on ice, vortex, spin for 10 secondsD. Load on DNA sequencer
Analysis
You will receive a print-out of the electropherogram. How good is the sequence? Are the peaksequally spaced and distinct? Where in the sequence do you find ambiguous bases (N’s)? YourTA will take you to the computer lab and help you run the sequence on a Blast search athttp://www.ncbi.nlm.nih.gov/BLAST/ What gene/organism is the best match?
Genetics Laboratory Manual Garey et al. 52
CLONING PROJECT
This part of the lab will require you and your lab partner to think through all of the steps,and devise a plan and schedule to carry out the necessary experiments. Your grade will bebased on the quality of your lab report as well as how far along you get. With good timemanagement, you should be able to complete the project by the end of the semester. If you do notmanage your time well, or are careless with the experiments you may not completely finish by theend of the semester. What follows are the necessary protocols you will need to carry out theproject.
The remainder of the semester will be spent cloning the 18S rRNA gene fragment into a plasmid. You will then identify the colonies containing recombinant plasmids by blue/white screening,select 6 individual white colonies and two individual blue colonies, and prepare plasmidpreparations (mini-preps) from each colony. Finally you will cut each plasmid preparation withHind III and examine the results on agarose gel electrophoresis to confirm the presence of theinserted 18S rRNA gene fragment.
Digestion of PCR products and Plasmid
The primers used to amplify the 18S rRNA gene contain tails with EcoRI and HindIII restrictionsites, so by digesting with HindIII you can produce the sticky ends needed for cloning purposes. You also need to digest the plasmid with the same enzyme to produce compatible sticky ends toaccept the insert, so it is easiest to digest the two together in a single reaction. A molar ratioaround 1:4 to 1:10 plasmid:insert will minimize the number of false positives (self-ligatingplasmid) and plasmids with multiple inserts.
X ul plasmid DNA (0.5 ug)X ul 18S rRNA gene (1-2 ug)10 ul 10X HindIII buffer1 ul BSA3 ul HindIII enzymeX ul water (to total of 100ul)
mix gently by flicking the tube with your finger, quick spin, incubate 2-4 hr at 37oC.
Do not incubate overnight–extended digestions often lead to the loss of the sticky ends!!!
Phenol extraction series:
This is used to clean up your digested plasmid/PCR products prior to cloning.
Crude DNA preparations and DNA that has been digested with restriction enzymes are
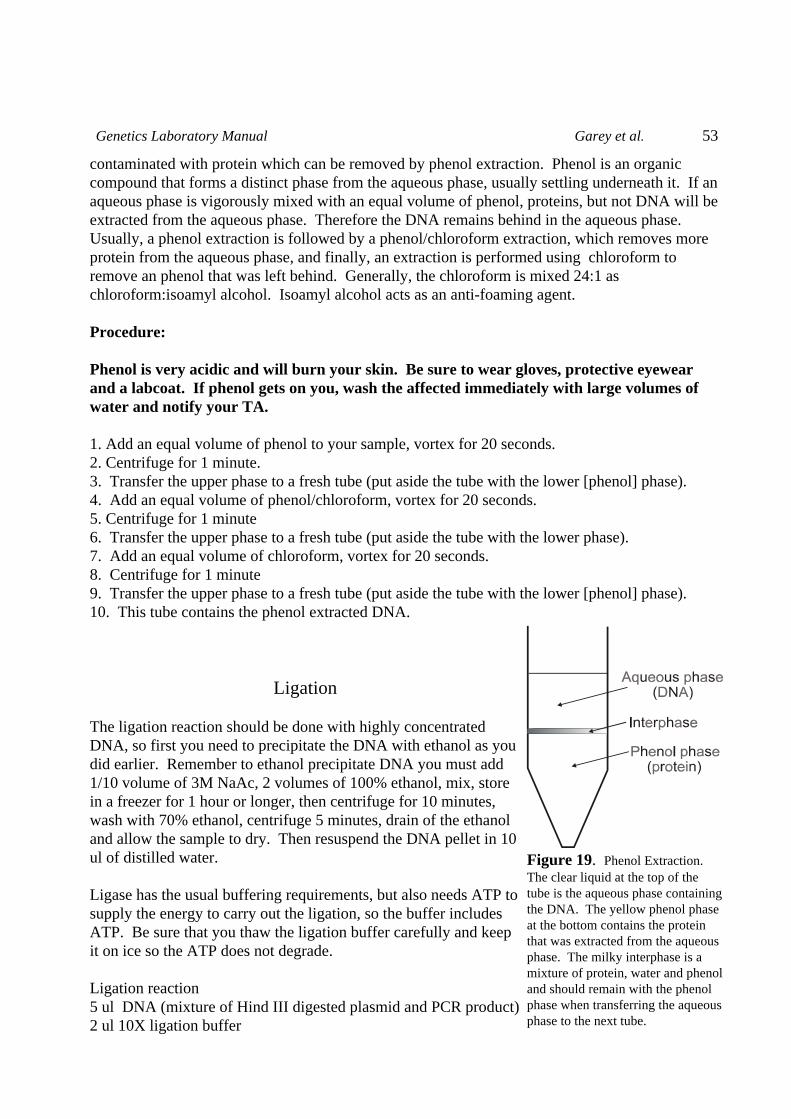
Genetics Laboratory Manual Garey et al. 53
Figure 19. Phenol Extraction. The clear liquid at the top of thetube is the aqueous phase containingthe DNA. The yellow phenol phaseat the bottom contains the proteinthat was extracted from the aqueousphase. The milky interphase is amixture of protein, water and phenoland should remain with the phenolphase when transferring the aqueousphase to the next tube.
contaminated with protein which can be removed by phenol extraction. Phenol is an organiccompound that forms a distinct phase from the aqueous phase, usually settling underneath it. If anaqueous phase is vigorously mixed with an equal volume of phenol, proteins, but not DNA will beextracted from the aqueous phase. Therefore the DNA remains behind in the aqueous phase. Usually, a phenol extraction is followed by a phenol/chloroform extraction, which removes moreprotein from the aqueous phase, and finally, an extraction is performed using chloroform toremove an phenol that was left behind. Generally, the chloroform is mixed 24:1 aschloroform:isoamyl alcohol. Isoamyl alcohol acts as an anti-foaming agent.
Procedure:
Phenol is very acidic and will burn your skin. Be sure to wear gloves, protective eyewearand a labcoat. If phenol gets on you, wash the affected immediately with large volumes ofwater and notify your TA.
1. Add an equal volume of phenol to your sample, vortex for 20 seconds.2. Centrifuge for 1 minute.3. Transfer the upper phase to a fresh tube (put aside the tube with the lower [phenol] phase).4. Add an equal volume of phenol/chloroform, vortex for 20 seconds.5. Centrifuge for 1 minute6. Transfer the upper phase to a fresh tube (put aside the tube with the lower phase).7. Add an equal volume of chloroform, vortex for 20 seconds.8. Centrifuge for 1 minute9. Transfer the upper phase to a fresh tube (put aside the tube with the lower [phenol] phase).10. This tube contains the phenol extracted DNA.
Ligation
The ligation reaction should be done with highly concentratedDNA, so first you need to precipitate the DNA with ethanol as youdid earlier. Remember to ethanol precipitate DNA you must add1/10 volume of 3M NaAc, 2 volumes of 100% ethanol, mix, storein a freezer for 1 hour or longer, then centrifuge for 10 minutes,wash with 70% ethanol, centrifuge 5 minutes, drain of the ethanoland allow the sample to dry. Then resuspend the DNA pellet in 10ul of distilled water.
Ligase has the usual buffering requirements, but also needs ATP tosupply the energy to carry out the ligation, so the buffer includesATP. Be sure that you thaw the ligation buffer carefully and keepit on ice so the ATP does not degrade.
Ligation reaction5 ul DNA (mixture of Hind III digested plasmid and PCR product)2 ul 10X ligation buffer
Genetics Laboratory Manual Garey et al. 54
12 ul distilled water1 ul ligase
incubate 14oC overnight, Store frozen until needed
Transforming cells with ligated plasmid:
Reagents needed:
Competent CellsLigation MixControl plasmid100 mM IPTG2% X-gal Ampicillin/LB plates
1. Thaw competent DH5� cells on ice.
2. Mix 100 ul competent cells with 5 ul of your ligation mix in a glass tube and place on ice. Thisis your experimental sample.
3. Mix 50 ul competent cells with 1 ul control plasmid in a glass tube and place on ice. This isyour positive control.
4. Place 50 ul competent cells in a glass tube and place on ice. This is your negative control.
5. Incubate the tubes on ice for 30 minutes.
6. Heat shock at 42oC for 1 minute.
7. Add 200 ul LB broth and incubate tubes at 37oC for 30 minutes.
8. Prepare cells for plating in microcentrifuge tubes as follows:
Genetics Laboratory Manual Garey et al. 55
Cell amount of cells IPTG LB broth
Negative control 100 ul 10 ul 40 ul
Positive control 100 ul 10 ul 40 ul
Experimental 2 ul 10 ul 138 ul
Experimental 14 ul 10 ul 126 ul
Experimental 140 ul 10 ul 0 ul
9. Lay 5 prewarmed Ampicillin/LB plates on the counter upside down. Label each with yourname, date, lab section, cell type (e.g. positive control, experimental) and the amount of cells (e.g.140 ul). Be sure the labels are NOT written on the lid!
10. Turn the plates right side up and pipette the entire contents of each tube onto the surface of theappropriate plate. Be sure to use a fresh pipette tip for each transfer. Dip the spreader in ethanoland flame it. Then spread the contents of each plate to evenly distribute the cells on the surface ofthe agar. Be sure to dip the spreader in ethanol and flame it between each plate. Leave the platesright side up for 10 -30 minutes, then place them upside down in the 37oC incubator in a stack. They are upside down so that in the event of condensation, the condensate will drip onto the lidsrather than the surface of the agar. Incubate overnight, then store the plates at 4oC. If the platesare to be stored more than a few days, seal the edges of the plate with parafilm or tape to preventthem from drying out. The bacteria will remain viable for 4-6 weeks.
11. Results: The negative control should have no colonies at all. The positive control shouldhave a large number of small blue colonies. There should be no white colonies. Theexperimental control plates should have a mixture of blue and white colonies. The most coloniesshould be on the plate with 140 ul of cells, and the least (or none) on the plate with 2 ul of cells. The white colonies are those that should have your PCR fragment.
Miniprep of plasmid DNA
1. Using a sterile toothpick or inoculating loop, pick 3 white colonies from an experimental platewhere the colonies are clearly separate from other colonies (do not pick a colony that is touchinganother colony). Place each colony separately into an LB containing tube. Add 20 ul/10 ml 25mg/ml ampicillin to the tube. Pick 1 blue colony from the positive control plate into another LBcontaining tube with ampicillin.
2. Grow overnight at 37oC with shaking. Store at 4oC until needed, but no longer than 24 hours.
3. Shake the tube to be sure the cells are completely resuspended and transfer 1.5 ml from eachculture into a microfuge tube. Centrifuge for 1 minute, then pour out the supernatant, and drainthe tube onto a paper towel.
4. Add 100 ul 4 mg/ml Lysozyme in Alkaline Lysis Buffer to each tube. Incubate at 5 minutes at
Genetics Laboratory Manual Garey et al. 56
room temperature.
5. Make the following solution in a separate tube:
240 ul 1 N NaOH120 ul 10% SDS840 ul H2O
Add 200 ul of the above solution to each miniprep.
6. Mix the contents by gently inverting the tubes 3 times only, then incubate 5 minutes on ice.
7. Add 150 ul 3M K 5M Ac. Vortex the tubes holding the tube upside down in the vortexer forten seconds. Incubate on ice for 5 minutes.
8. Centrifuge for 5 minutes, and transfer the supernatant to a new tube (discard the tube with thepellet).
9. Add 500 ul of phenol/CHCl3, vortex for 30 seconds, centrifuge 1 minute, and transfer theaqueous (top) phase to a new tube. Add 2 volumes of 100% ethanol, incubate on ice for 20minutes.
10. Centrifuge for 5 minutes, pour off the ethanol and add 500 ul of 70% ethanol, centrifuge 5minutes, drain and allow the pellet to air dry. Resuspend the pellet in 20 ul of TE/RNAse. TheRNAse digests the RNA that co-purifies with the DNA and would interfere with visualization ofthe DNA in subsequent electrophoresis.
Analysis of the Minipreps (Restriction Mapping)
Digest the miniprep DNA exactly as you carried out the genomic DNA digest earlierexcept use 10 ul of miniprep DNA and adjust the reaction components for a total volume of 20 ul. After the digestion, load the entire digested DNA and run the gel as before. You should runplasmid from each of the white colonies and from the blue colony. Be sure to run Hind III cutlambda DNA as a molecular weight marker and run some uncut control plasmid as well.
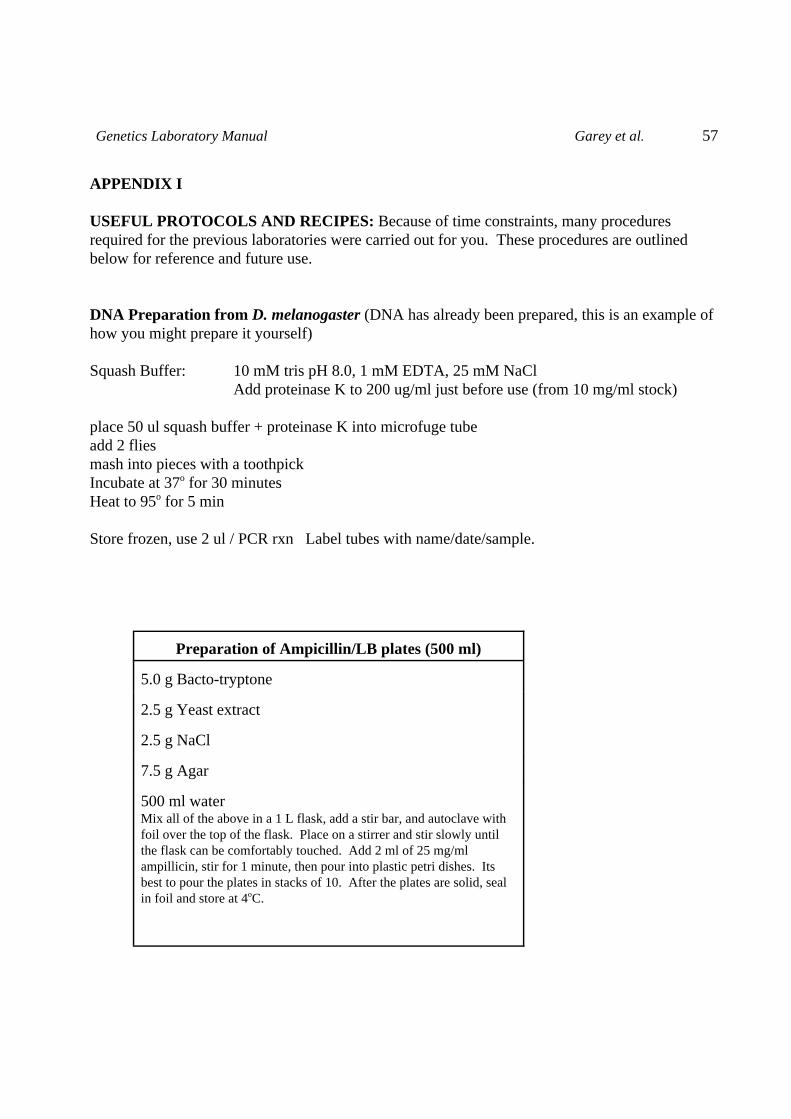
Genetics Laboratory Manual Garey et al. 57
Preparation of Ampicillin/LB plates (500 ml)
5.0 g Bacto-tryptone
2.5 g Yeast extract
2.5 g NaCl
7.5 g Agar
500 ml waterMix all of the above in a 1 L flask, add a stir bar, and autoclave withfoil over the top of the flask. Place on a stirrer and stir slowly untilthe flask can be comfortably touched. Add 2 ml of 25 mg/mlampillicin, stir for 1 minute, then pour into plastic petri dishes. Itsbest to pour the plates in stacks of 10. After the plates are solid, sealin foil and store at 4oC.
APPENDIX I
USEFUL PROTOCOLS AND RECIPES: Because of time constraints, many proceduresrequired for the previous laboratories were carried out for you. These procedures are outlinedbelow for reference and future use.
DNA Preparation from D. melanogaster (DNA has already been prepared, this is an example ofhow you might prepare it yourself)
Squash Buffer: 10 mM tris pH 8.0, 1 mM EDTA, 25 mM NaClAdd proteinase K to 200 ug/ml just before use (from 10 mg/ml stock)
place 50 ul squash buffer + proteinase K into microfuge tubeadd 2 fliesmash into pieces with a toothpickIncubate at 37o for 30 minutesHeat to 95o for 5 min
Store frozen, use 2 ul / PCR rxn Label tubes with name/date/sample.
Genetics Laboratory Manual Garey et al. 58
Preparation of CaCl2 treated competent cellsThis has already been done for you, but here is how you would do it:1. Grow a 10 ml overnight culture of an appropriate strain of E. coli for your project. In this caseit would be the DH5� strain. The overnight culture will be grown in 10 ml LB medium.
500 ml LB medium5.0 g Bacto-tryptone2.5 g Yeast extract2.5 g NaCl
dissolve in 500 ml water, place in appropriate culture tubes and autoclave
Inoculate a 10 ml culture with a single DH5� colony or 10 ul of frozen stock. Grow overnight at37oC with shaking (this will be called overnight culture, and can be stored at 4oC for severaldays).
Use 500 ul of overnight culture to inoculate 50 ml of LB in a 250 ml flask (use a cotton plug orloose cap to seal the flask during and after autoclaving.
Grow at 37oC with shaking and measure absorbance at 600nm every hour. Bacterial culturesgrow slowly for the first few hours but quickly enter log phase where they grow very rapidly.Once the cells reach saturation, they cease to grow, and begin to die. You want to harvest thecells during log phase. An absorbance of 0.6 to 0.8 at 600nm is a good indication that cells are inlog phase. So, when the absorbance is between 0.6 and 0.8, centrifuge the culture at 6,000 RPMfor 5 minutes at 4oC using autoclaved centrifuge tubes (e.g. Sorvall SS34 rotor). Discard thesupernatant and resuspend the cells in 20 ml of sterile, chilled 50 mM CaCl2. Incubate on ice for20 minutes, centrifuge as above, discard supernatant, and resuspend pellet in 4 ml of 50 mMCaCl2 and store on ice until needed (in ice bucket with ice in a refrigerator works well). The cellsbecome more competent as they incubate on ice, peaking around 24 hr. After 24 hr, you can addsterile glycerol to a total of 15% of the total volume, aliquot the cells into microfuge tubes (200 ul/tube) and store them indefinitely at -80oC.

Genetics Laboratory Manual Garey et al. 59
DNA Mini Prep Solutions
TE (Tris-EDTA)0.05 M Tris, pH 8.00.001 M EDTA
Alkaline Lysis Buffer50 mM Glucose10 mM EDTA25 mM Tris Hcl4 mg/ml lysozyme (add just prior to use)
3M K/ 5M acetate (100 ml) 60 ml 5 M potassium acetate11.5 ml galacial acetic acid28.5 ml distilled water