Embed Size (px)
Citation preview
Human Impact on Freshwater Ecosystem Services: A GlobalPerspectiveWalter K. Dodds,* Joshuah S. Perkin, and Joseph E. Gerken
Division of Biology, Kansas State University, 116 Ackert Hall, Manhattan 66506, Kansas, United States
*S Supporting Information
ABSTRACT: Human environmental change influences freshwaters as well as theregulating, provisioning, and cultural services that ecosystems provide worldwide.Here, we assess the global human impact on the potential value of six freshwaterecosystem services (ES) and estimate the proportion of each used globally (themean value across all countries is in parentheses): biodiversity (0.37), disturbanceregulation (0.24), commodities (0.39), greenhouse gases (0.09), water availability(0.10), and water quality (0.33). We also created a composite index of the impact.Using different valuation schemes, we found that humans have used potentialglobal freshwater ES scaled by a relative value of roughly 4−20%, with a median of16%. All countries use a considerable amount of the potential ES value, invalidatingthe idea that wealthier countries have less impact on their ES once they havedeveloped. The data suggest that humans have diminished the potential ESprovided by freshwaters across the globe and that factors associated with highpopulation growth rates are related to the overall degradation.
■ INTRODUCTION
Anthropogenic impacts on freshwaters are global and includeflow alteration, pollution, species extinctions,1 species invasions,thermal alterations, global climate change, and increases inultraviolet radiation. Given that humans use a substantialportion of the supply of freshwater globally,2 require supplies offreshwater for survival, and are altering water security across theplanet,3 a global perspective on impact is warranted. One wayto characterize the global impacts on freshwaters now and inthe future is to place them into the context of the ecosystemservices (ES, the benefits humans obtain from ecosystems) thatfreshwaters provide to humanity. Such analyses can pinpointdiverse effects and complex interactions among the driversinfluencing the potential availability of freshwater as well as thesupply rates of ES worldwide.4
The relationships among the drivers of changes in ES aregenerally complex, and managers must often weigh theimportance of one ES at the expense of another.5−7
Eutrophication exemplifies the contrasting anthropogenicimpacts on ES. Nutrient addition can stimulate primaryproducers and can increase fish production, but it can decreasediversity and damage water quality with taste, odor, and toxicityproblems associated with cyanobacterial blooms.8 Conse-quently, managers could be forced to decide how the ES offish production are weighted against water quality. Once such aframework is in place; multiobjective management approachescan optimize benefits and minimize harm.9
Factors (drivers) influencing ES have been identified formany spatial and temporal scales (e.g., Limburg et al.10). Theincorporation of ES into a broader context in which theirrelative rankings are included as well as how the components of
the ES are related to each other is just beginning to be explored(e.g., Naidoo et al.11 and Nelson et al.6). The preservation andmaintenance of water quality and quantity requires cross-disciplinary cooperation,12 and an understanding of ES alongwith how human activities influence their availability mightguide such cooperation.13 As a next step, ES14,15 can be used torank management options in cases such as restoration,16 waterquality,13 and eutrophication control.8
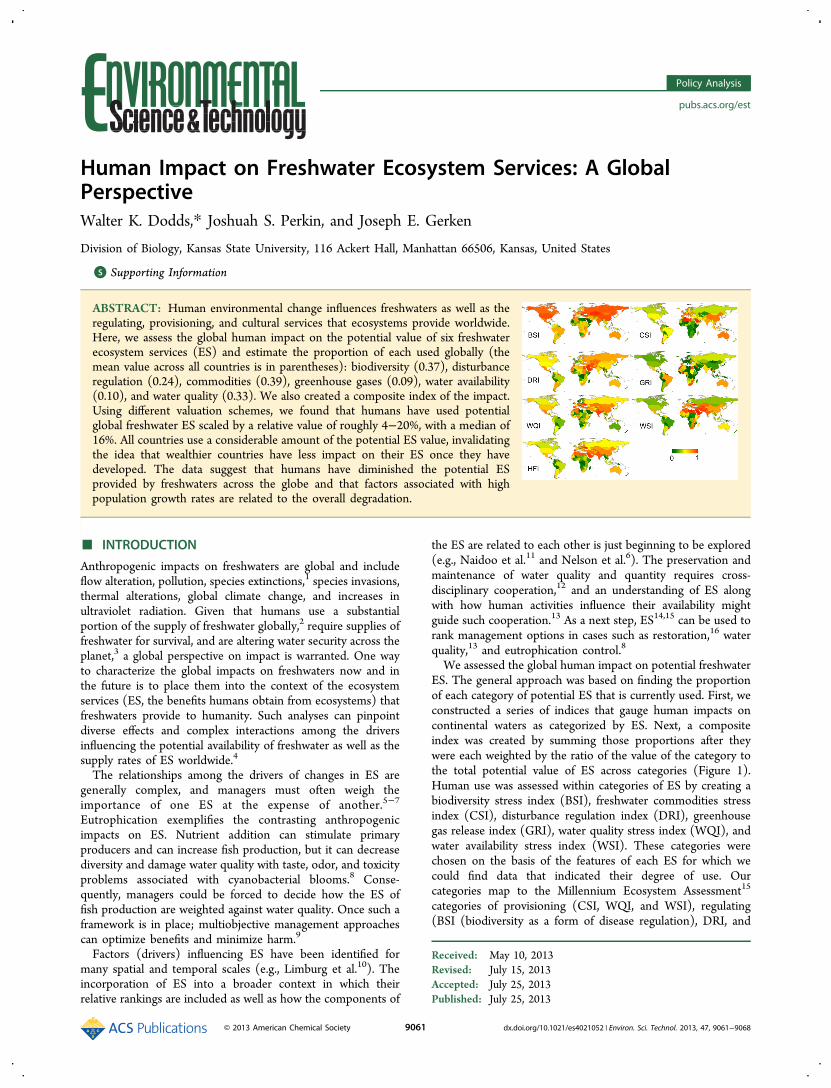
We assessed the global human impact on potential freshwaterES. The general approach was based on finding the proportionof each category of potential ES that is currently used. First, weconstructed a series of indices that gauge human impacts oncontinental waters as categorized by ES. Next, a compositeindex was created by summing those proportions after theywere each weighted by the ratio of the value of the category tothe total potential value of ES across categories (Figure 1).Human use was assessed within categories of ES by creating abiodiversity stress index (BSI), freshwater commodities stressindex (CSI), disturbance regulation index (DRI), greenhousegas release index (GRI), water quality stress index (WQI), andwater availability stress index (WSI). These categories werechosen on the basis of the features of each ES for which wecould find data that indicated their degree of use. Ourcategories map to the Millennium Ecosystem Assessment15
categories of provisioning (CSI, WQI, and WSI), regulating(BSI (biodiversity as a form of disease regulation), DRI, and
Received: May 10, 2013Revised: July 15, 2013Accepted: July 25, 2013Published: July 25, 2013
Policy Analysis
pubs.acs.org/est
© 2013 American Chemical Society 9061 dx.doi.org/10.1021/es4021052 | Environ. Sci. Technol. 2013, 47, 9061−9068
GRI,) and supporting (BSI), but they do not overlap with thecultural category. We then explored how different drivers (e.g.,population and gross domestic product) influence the degree ofimpact on each categorical index of ES as well as the compositeindex. We took advantage of the idea that ES have beenassigned values and that each ES has a maximum potentialvalue (i.e., there are limits on the rate that ES are providedglobally). However, our analyses were not sensitive to theactual values assigned but rather to the relative proportion ofthe value assigned to each category. Thus, we were able to usethe relative rankings of ES on the basis of published values toscale the indices relative to each other and create an overallindex of global human freshwater impact (HFI).
■ MATERIALS AND METHODS
Global Freshwater Ecosystem Services. We started witha set of categories of ES with global data available in whichprior valuation frameworks had been assessed.14,15 We did notinclude cultural values in our impact assessment because ofdifficulty with global accounting for these values. Weconstructed indices of anthropogenic stress on each of thesecategories of freshwater ES using global data sets (more on thislater and in the Supporting Information). The variables were
calculated at the finest possible grain size, but the final valueswere calculated per country because that is the unit underwhich most global data were available.We estimated the BSI by dividing the number of freshwater
threatened fish species (IUCN red list) by the total freshwaterfish species richness17 for each country. We also estimated theproportional reduction in aquatic invertebrate diversity usingpreviously published empirical relationships between thepercentage reduction in invertebrate species richness and thetotal water nitrogen concentration.18−20 Each of these twoaspects of diversity was weighted equally in our analyses,although we acknowledge the portion of the index regardingfish is likely a more robust measure of impact given the greateravailability of data, and we treat the components separately insome statistical analyses.We estimated CSI using the relationship between the wild
fisheries capture production and freshwater aquacultureproduction because an indication of the overexploitation offishery stocks occurs when capture production is replaced byaquaculture production.21
We estimated DRI, streamflow regulation in particular, usingpreviously published estimates of the relative residence time ofwater in large reservoirs, as determined by hydrologic
Figure 1. Conceptual diagram of the calculation of the proportion of ecosystem services used and how they are weighted to calculate overall impact.The values for proportional weighting are based on the median values from the literature and are reported in Table 1. See the text for the discussionon the specifics of how each box was calculated.
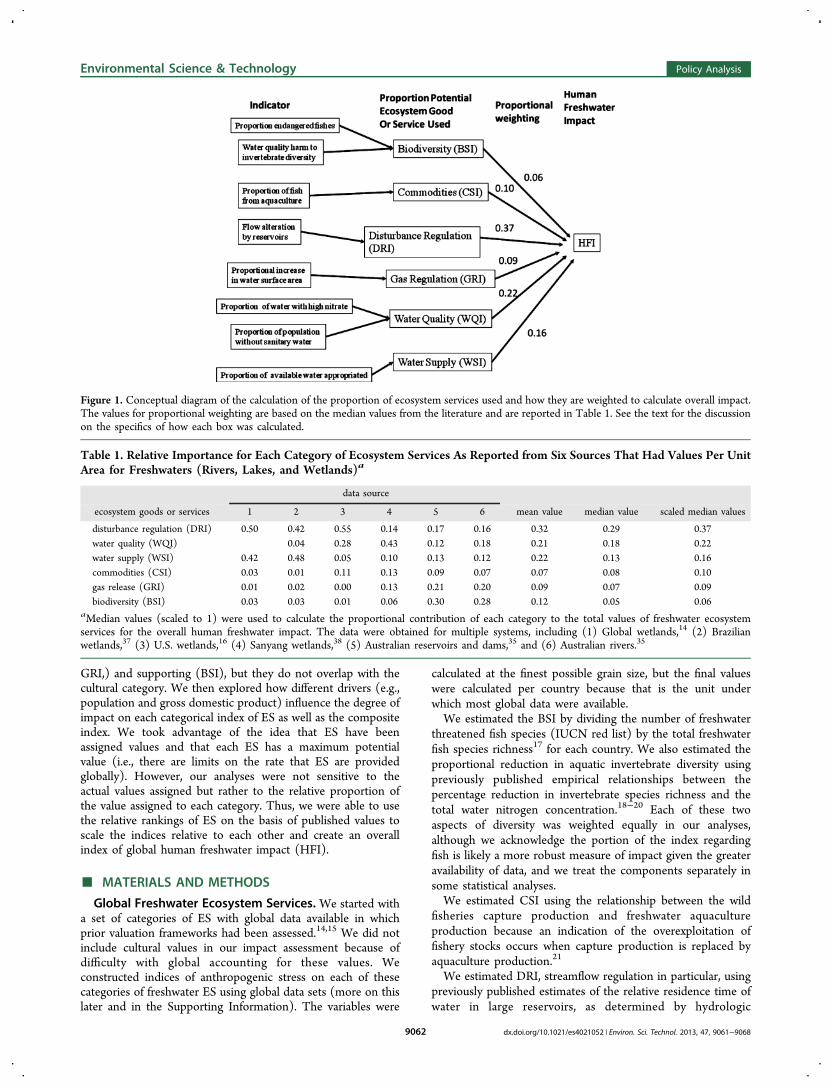
Table 1. Relative Importance for Each Category of Ecosystem Services As Reported from Six Sources That Had Values Per UnitArea for Freshwaters (Rivers, Lakes, and Wetlands)a
data source
ecosystem goods or services 1 2 3 4 5 6 mean value median value scaled median values
disturbance regulation (DRI) 0.50 0.42 0.55 0.14 0.17 0.16 0.32 0.29 0.37water quality (WQI) 0.04 0.28 0.43 0.12 0.18 0.21 0.18 0.22water supply (WSI) 0.42 0.48 0.05 0.10 0.13 0.12 0.22 0.13 0.16commodities (CSI) 0.03 0.01 0.11 0.13 0.09 0.07 0.07 0.08 0.10gas release (GRI) 0.01 0.02 0.00 0.13 0.21 0.20 0.09 0.07 0.09biodiversity (BSI) 0.03 0.03 0.01 0.06 0.30 0.28 0.12 0.05 0.06
aMedian values (scaled to 1) were used to calculate the proportional contribution of each category to the total values of freshwater ecosystemservices for the overall human freshwater impact. The data were obtained for multiple systems, including (1) Global wetlands,14 (2) Brazilianwetlands,37 (3) U.S. wetlands,16 (4) Sanyang wetlands,38 (5) Australian reservoirs and dams,35 and (6) Australian rivers.35
Environmental Science & Technology Policy Analysis
dx.doi.org/10.1021/es4021052 | Environ. Sci. Technol. 2013, 47, 9061−90689062
modeling.22 Residence time is an indirect estimate that assumescountries that have highly modified their hydrology byimpounding large portions of their runoff have also alteredthe natural capacity for disturbance regulation. An increase inimpoundments also increases the surface area of water, leadingto increases in greenhouse gas production. We estimated GRIby accounting for the relative increase in the surface area offreshwater attributable to reservoirs.23
We calculated WQI using the amount of surface waterexceeding 10 mg L−1 nitrate−N23 and the relative populationdensity of people without access to sewage-treatment facilities(World Health Organization) to indicate the relative potentialfor contamination by human diseases. Nitrate contaminationand a lack of access to clean water were weighted equally.Finally, we measured WSI by accounting for the proportion ofavailable water used by humans in each country according tothe CIA World Factbook.We calculated the final values for the indices on a per-
country basis because much of the data were only available atthis resolution. All indices were scaled from 0 to 1 for mappingbut not for statistical analyses. For mapping, each index wasweighted on the basis of neighboring countries when mappingcountries for which data were not available (SupportingInformation). We used only countries for which all data wereavailable for statistical analyses.Human Freshwater Impact and Drivers. The HFI for
each country was estimated by weighting each of the categoricalindices by their proportional contribution to the literature-derived ES values. The overall proportion of the contribution ofeach ES, as calculated across all studies, was scaled to 1 becausethe sum of the medians of the proportions came out to beslightly less than 1. These values as well as the amount of thevalue was lost because of impact within each category wereused to calculate impact per country:
∑==
P P IHFIi
j
i i i1
,total value ,max(1)
With j categories of each impact index (I; i.e., BSI, CSI, DRI,GRI, WQI, and WSI), then the overall weighted index ofhuman freshwater impact (HFI) is the sum of the products ofthe proportion of total value of ES made up by index I(Pi,total value), the maximum proportion of index I that isinfluenced by human impact (Pi,max), and the value of eachindex I. Pi,total value was computed from the literature, and theindividual indices (I) were rescaled proportionally to the part oftotal potential value lost with the maximum effect for anindividual index (Pi,max). Although for some indices, the totalpotential value lost was 1 (i.e., some countries use all of theavailable water supply), for others it is not (i.e., diversity doesnot go to 0 with most forms of pollution, just to a much lowerlevel). For more detailed information on how this proportionwas set, see the Supporting Information. For mapping, HFI wasalso scaled from 0 to 1 for each country by dividing eachestimate by the greatest value among all countries, HFImax. Thevalues of HFI for countries that had missing data wereinterpolated for mapping (but not for statistical analyses) byweighting each neighboring country’s index value on the basisof the proportion of the total border shared (SupportingInformation).Given the divergence in the relative contributions among the
published literature values, we calculated a scaled median acrossall of the studies and conducted a sensitivity analysis of the HFI
to the variances across the studies to account for the fact thatdifferent studies reported different total values for ES andapportioned them differently among the categories. Weassessed the accuracy of this value in two ways to explore thebiases related to country size and the amount of water in eachcountry. First, we weighted the contribution of each country’sHFI by the surface area of the country relative to that of thesum area of all countries. Second, we weighted the countries bythe surface area of water in each country relative to the sum ofthe total global water surface area and by the water availabilityin each country relative to the sum of total water availableacross all countries.We chose drivers that we thought could have global impacts
on ES and that data were available on a global scale. Drivers ofES that were investigated included population growth rate,economic activity, intensity of agricultural land use modifica-tion, intensity of agricultural production, and populationdensity. (For the data sources, see the Supporting Information.)
Statistical Analyses. All statistics were done in Statisticaver. 9.0 (Statsoft, Tulsa, OK) on data from 114 countries forwhich all indices and all drivers could be assigned values. The114 countries likely represent global conditions because theyaccount for about 95% of the world population. Gross domesticproduct per km2 varied by almost four orders of magnitudeacross these 114 countries, and the proportion of cropland andpopulation density varied 138- and 437-fold, respectively. Forstatistical analyses, the proportional values were arcsintransformed for normality only when they were not normal,and other variables (gross domestic product per km2, grossdomestic product per capita, and population density per km2)were log transformed when necessary. Economic andpopulation growth rates did not require transformation becausetheir distributions did not deviate from normal (p > 0.05,Kolmogorov−Smirnov). The relationships among the trans-formed indices and the potential drivers were examined byPearson correlation to investigate the relationships among theindices, to control for mulit-colinearity among the drivers, andto find relationships of the drivers with the indices. The grossdomestic product in each country was closely related to thevalues of agricultural production, energy use, and the number ofreservoirs, so only gross domestic product per km2 was used inthe regression analyses.Regression analysis of the relationship between the
component indices and the HFI was used to understandwhich indices most strongly influenced the variation in HFI.Multiple forward stepwise linear regressions were used to assessmore complex interactions among the drivers and the indices.The results were compared to model selections with MallowsCP (an information criteria index that can account for problemsassociated with adding additional drivers that increase statisticalsignificance but offer little increased predictive ability), but theyvaried little from the straightforward regression results.Environmental impact can follow an environmental Kuznets
curve,24 which leads to an expectation of an inverted U-shapedrelationship of pollution as per-capita GDP rises.25 We used aregression to fit all of our indices except for WQI against per-capita GDP (because per-capita GDP was used to calculateWQI) with a second-order polynomial. An inverted curve wasindicated if the first-order term was positive, the second-orderterm was negative, and both terms were significant.
Environmental Science & Technology Policy Analysis
dx.doi.org/10.1021/es4021052 | Environ. Sci. Technol. 2013, 47, 9061−90689063
■ RESULTS
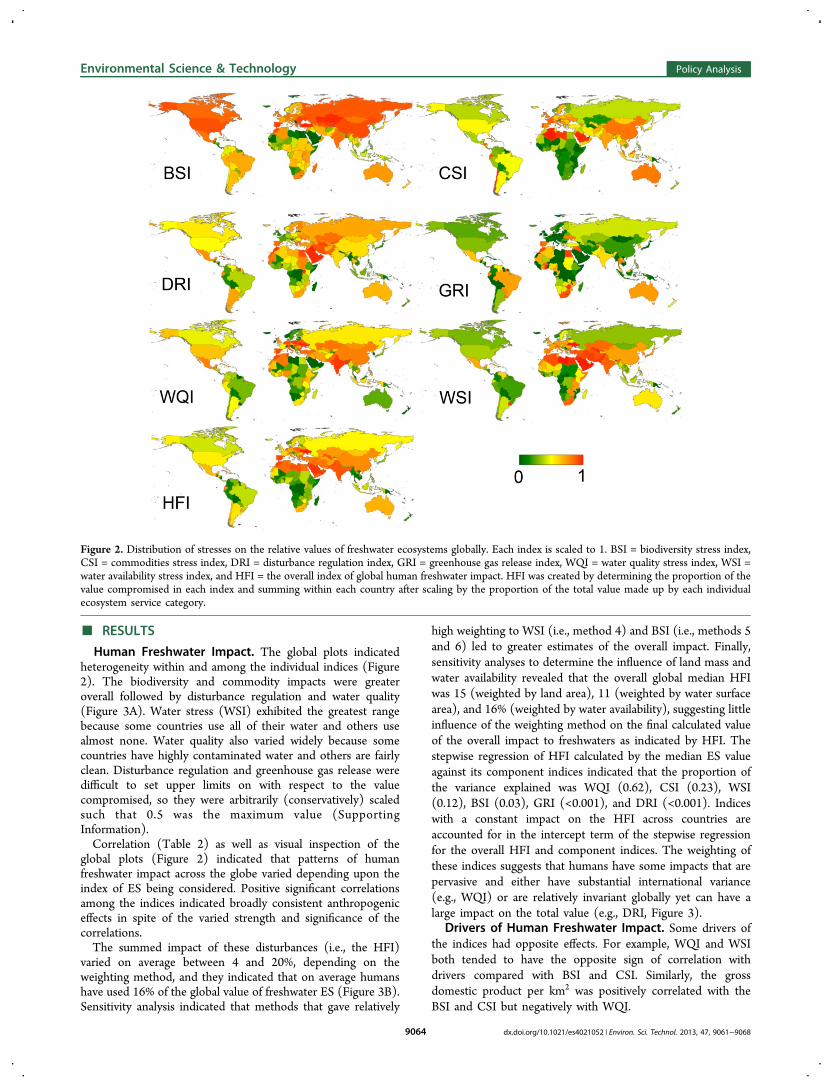
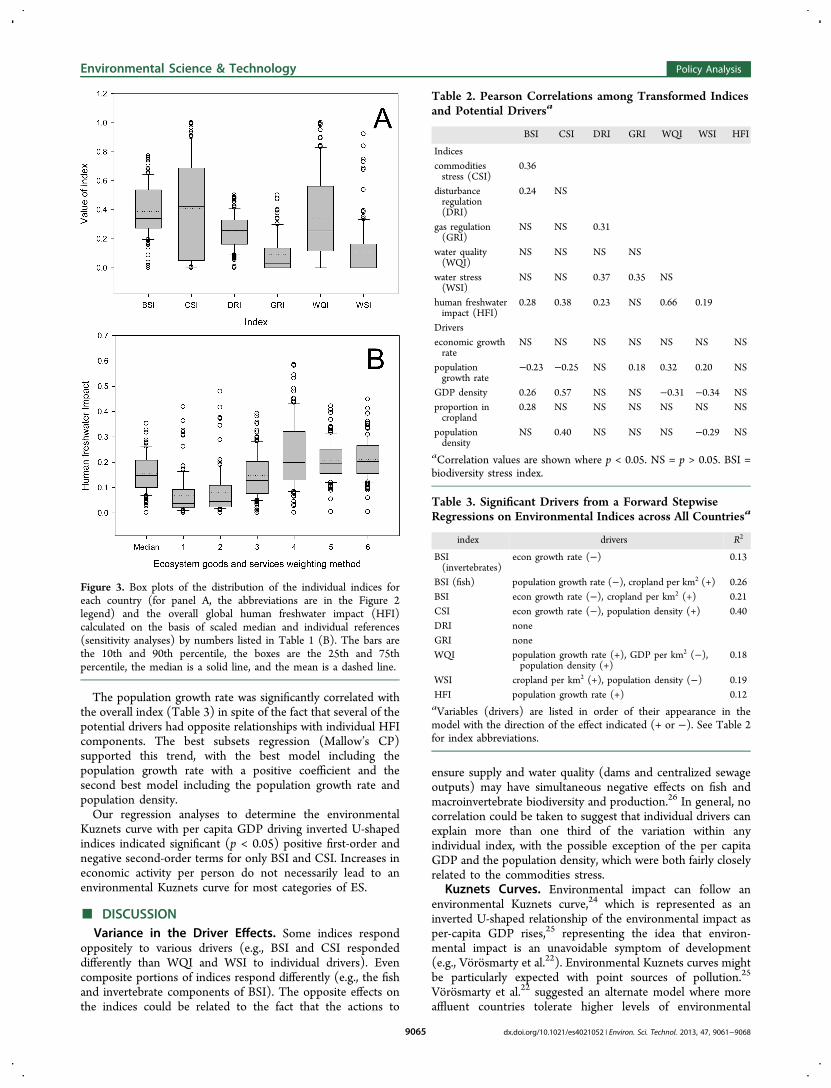
Human Freshwater Impact. The global plots indicatedheterogeneity within and among the individual indices (Figure2). The biodiversity and commodity impacts were greateroverall followed by disturbance regulation and water quality(Figure 3A). Water stress (WSI) exhibited the greatest rangebecause some countries use all of their water and others usealmost none. Water quality also varied widely because somecountries have highly contaminated water and others are fairlyclean. Disturbance regulation and greenhouse gas release weredifficult to set upper limits on with respect to the valuecompromised, so they were arbitrarily (conservatively) scaledsuch that 0.5 was the maximum value (SupportingInformation).Correlation (Table 2) as well as visual inspection of the
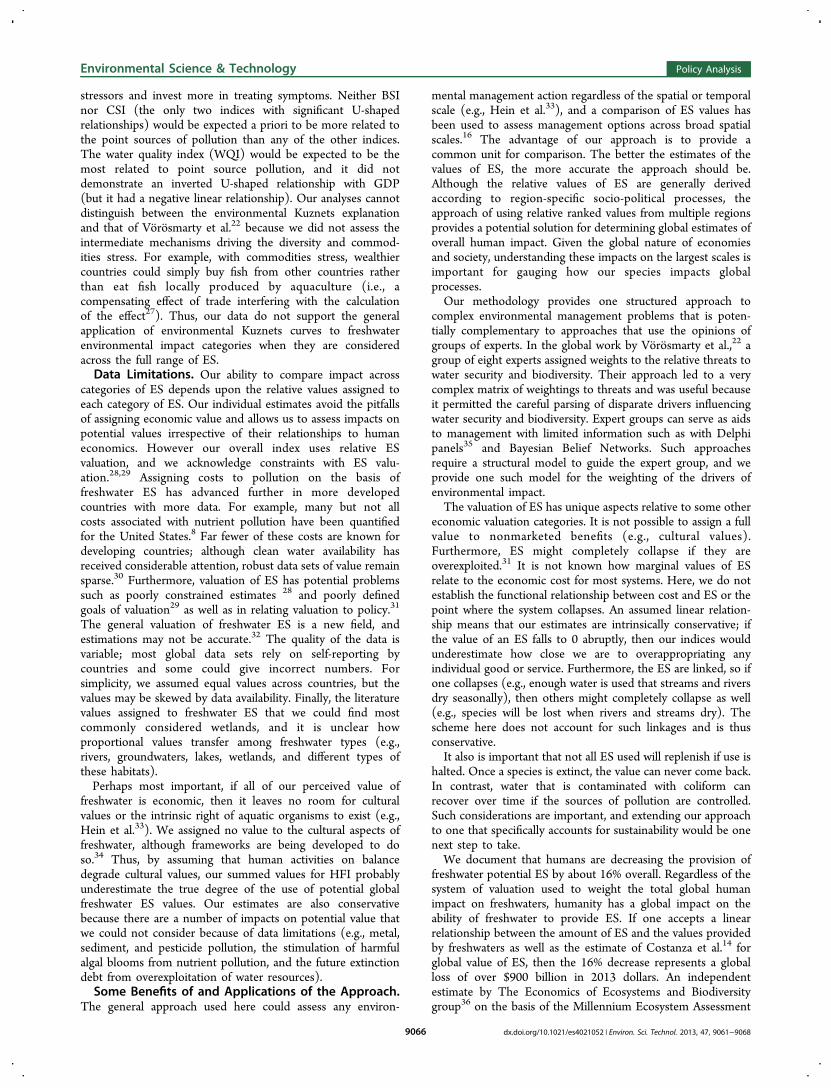
global plots (Figure 2) indicated that patterns of humanfreshwater impact across the globe varied depending upon theindex of ES being considered. Positive significant correlationsamong the indices indicated broadly consistent anthropogeniceffects in spite of the varied strength and significance of thecorrelations.The summed impact of these disturbances (i.e., the HFI)
varied on average between 4 and 20%, depending on theweighting method, and they indicated that on average humanshave used 16% of the global value of freshwater ES (Figure 3B).Sensitivity analysis indicated that methods that gave relatively
high weighting to WSI (i.e., method 4) and BSI (i.e., methods 5and 6) led to greater estimates of the overall impact. Finally,sensitivity analyses to determine the influence of land mass andwater availability revealed that the overall global median HFIwas 15 (weighted by land area), 11 (weighted by water surfacearea), and 16% (weighted by water availability), suggesting littleinfluence of the weighting method on the final calculated valueof the overall impact to freshwaters as indicated by HFI. Thestepwise regression of HFI calculated by the median ES valueagainst its component indices indicated that the proportion ofthe variance explained was WQI (0.62), CSI (0.23), WSI(0.12), BSI (0.03), GRI (<0.001), and DRI (<0.001). Indiceswith a constant impact on the HFI across countries areaccounted for in the intercept term of the stepwise regressionfor the overall HFI and component indices. The weighting ofthese indices suggests that humans have some impacts that arepervasive and either have substantial international variance(e.g., WQI) or are relatively invariant globally yet can have alarge impact on the total value (e.g., DRI, Figure 3).
Drivers of Human Freshwater Impact. Some drivers ofthe indices had opposite effects. For example, WQI and WSIboth tended to have the opposite sign of correlation withdrivers compared with BSI and CSI. Similarly, the grossdomestic product per km2 was positively correlated with theBSI and CSI but negatively with WQI.
Figure 2. Distribution of stresses on the relative values of freshwater ecosystems globally. Each index is scaled to 1. BSI = biodiversity stress index,CSI = commodities stress index, DRI = disturbance regulation index, GRI = greenhouse gas release index, WQI = water quality stress index, WSI =water availability stress index, and HFI = the overall index of global human freshwater impact. HFI was created by determining the proportion of thevalue compromised in each index and summing within each country after scaling by the proportion of the total value made up by each individualecosystem service category.
Environmental Science & Technology Policy Analysis
dx.doi.org/10.1021/es4021052 | Environ. Sci. Technol. 2013, 47, 9061−90689064
The population growth rate was significantly correlated withthe overall index (Table 3) in spite of the fact that several of thepotential drivers had opposite relationships with individual HFIcomponents. The best subsets regression (Mallow’s CP)supported this trend, with the best model including thepopulation growth rate with a positive coefficient and thesecond best model including the population growth rate andpopulation density.Our regression analyses to determine the environmental
Kuznets curve with per capita GDP driving inverted U-shapedindices indicated significant (p < 0.05) positive first-order andnegative second-order terms for only BSI and CSI. Increases ineconomic activity per person do not necessarily lead to anenvironmental Kuznets curve for most categories of ES.
■ DISCUSSIONVariance in the Driver Effects. Some indices respond
oppositely to various drivers (e.g., BSI and CSI respondeddifferently than WQI and WSI to individual drivers). Evencomposite portions of indices respond differently (e.g., the fishand invertebrate components of BSI). The opposite effects onthe indices could be related to the fact that the actions to
ensure supply and water quality (dams and centralized sewageoutputs) may have simultaneous negative effects on fish andmacroinvertebrate biodiversity and production.26 In general, nocorrelation could be taken to suggest that individual drivers canexplain more than one third of the variation within anyindividual index, with the possible exception of the per capitaGDP and the population density, which were both fairly closelyrelated to the commodities stress.
Kuznets Curves. Environmental impact can follow anenvironmental Kuznets curve,24 which is represented as aninverted U-shaped relationship of the environmental impact asper-capita GDP rises,25 representing the idea that environ-mental impact is an unavoidable symptom of development(e.g., Vorosmarty et al.22). Environmental Kuznets curves mightbe particularly expected with point sources of pollution.25
Vorosmarty et al.22 suggested an alternate model where moreaffluent countries tolerate higher levels of environmental
Figure 3. Box plots of the distribution of the individual indices foreach country (for panel A, the abbreviations are in the Figure 2legend) and the overall global human freshwater impact (HFI)calculated on the basis of scaled median and individual references(sensitivity analyses) by numbers listed in Table 1 (B). The bars arethe 10th and 90th percentile, the boxes are the 25th and 75thpercentile, the median is a solid line, and the mean is a dashed line.
Table 2. Pearson Correlations among Transformed Indicesand Potential Driversa
BSI CSI DRI GRI WQI WSI HFI
Indicescommoditiesstress (CSI)
0.36
disturbanceregulation(DRI)
0.24 NS
gas regulation(GRI)
NS NS 0.31
water quality(WQI)
NS NS NS NS
water stress(WSI)
NS NS 0.37 0.35 NS
human freshwaterimpact (HFI)
0.28 0.38 0.23 NS 0.66 0.19
Driverseconomic growthrate
NS NS NS NS NS NS NS
populationgrowth rate
−0.23 −0.25 NS 0.18 0.32 0.20 NS
GDP density 0.26 0.57 NS NS −0.31 −0.34 NSproportion incropland
0.28 NS NS NS NS NS NS
populationdensity
NS 0.40 NS NS NS −0.29 NS
aCorrelation values are shown where p < 0.05. NS = p > 0.05. BSI =biodiversity stress index.
Table 3. Significant Drivers from a Forward StepwiseRegressions on Environmental Indices across All Countriesa
index drivers R2
BSI(invertebrates)
econ growth rate (−) 0.13
BSI (fish) population growth rate (−), cropland per km2 (+) 0.26BSI econ growth rate (−), cropland per km2 (+) 0.21CSI econ growth rate (−), population density (+) 0.40DRI noneGRI noneWQI population growth rate (+), GDP per km2 (−),
population density (+)0.18
WSI cropland per km2 (+), population density (−) 0.19HFI population growth rate (+) 0.12aVariables (drivers) are listed in order of their appearance in themodel with the direction of the effect indicated (+ or −). See Table 2for index abbreviations.
Environmental Science & Technology Policy Analysis
dx.doi.org/10.1021/es4021052 | Environ. Sci. Technol. 2013, 47, 9061−90689065
stressors and invest more in treating symptoms. Neither BSInor CSI (the only two indices with significant U-shapedrelationships) would be expected a priori to be more related tothe point sources of pollution than any of the other indices.The water quality index (WQI) would be expected to be themost related to point source pollution, and it did notdemonstrate an inverted U-shaped relationship with GDP(but it had a negative linear relationship). Our analyses cannotdistinguish between the environmental Kuznets explanationand that of Vorosmarty et al.22 because we did not assess theintermediate mechanisms driving the diversity and commod-ities stress. For example, with commodities stress, wealthiercountries could simply buy fish from other countries ratherthan eat fish locally produced by aquaculture (i.e., acompensating effect of trade interfering with the calculationof the effect27). Thus, our data do not support the generalapplication of environmental Kuznets curves to freshwaterenvironmental impact categories when they are consideredacross the full range of ES.Data Limitations. Our ability to compare impact across
categories of ES depends upon the relative values assigned toeach category of ES. Our individual estimates avoid the pitfallsof assigning economic value and allows us to assess impacts onpotential values irrespective of their relationships to humaneconomics. However our overall index uses relative ESvaluation, and we acknowledge constraints with ES valu-ation.28,29 Assigning costs to pollution on the basis offreshwater ES has advanced further in more developedcountries with more data. For example, many but not allcosts associated with nutrient pollution have been quantifiedfor the United States.8 Far fewer of these costs are known fordeveloping countries; although clean water availability hasreceived considerable attention, robust data sets of value remainsparse.30 Furthermore, valuation of ES has potential problemssuch as poorly constrained estimates 28 and poorly definedgoals of valuation29 as well as in relating valuation to policy.31
The general valuation of freshwater ES is a new field, andestimations may not be accurate.32 The quality of the data isvariable; most global data sets rely on self-reporting bycountries and some could give incorrect numbers. Forsimplicity, we assumed equal values across countries, but thevalues may be skewed by data availability. Finally, the literaturevalues assigned to freshwater ES that we could find mostcommonly considered wetlands, and it is unclear howproportional values transfer among freshwater types (e.g.,rivers, groundwaters, lakes, wetlands, and different types ofthese habitats).Perhaps most important, if all of our perceived value of
freshwater is economic, then it leaves no room for culturalvalues or the intrinsic right of aquatic organisms to exist (e.g.,Hein et al.33). We assigned no value to the cultural aspects offreshwater, although frameworks are being developed to doso.34 Thus, by assuming that human activities on balancedegrade cultural values, our summed values for HFI probablyunderestimate the true degree of the use of potential globalfreshwater ES values. Our estimates are also conservativebecause there are a number of impacts on potential value thatwe could not consider because of data limitations (e.g., metal,sediment, and pesticide pollution, the stimulation of harmfulalgal blooms from nutrient pollution, and the future extinctiondebt from overexploitation of water resources).Some Benefits of and Applications of the Approach.
The general approach used here could assess any environ-
mental management action regardless of the spatial or temporalscale (e.g., Hein et al.33), and a comparison of ES values hasbeen used to assess management options across broad spatialscales.16 The advantage of our approach is to provide acommon unit for comparison. The better the estimates of thevalues of ES, the more accurate the approach should be.Although the relative values of ES are generally derivedaccording to region-specific socio-political processes, theapproach of using relative ranked values from multiple regionsprovides a potential solution for determining global estimates ofoverall human impact. Given the global nature of economiesand society, understanding these impacts on the largest scales isimportant for gauging how our species impacts globalprocesses.Our methodology provides one structured approach to
complex environmental management problems that is poten-tially complementary to approaches that use the opinions ofgroups of experts. In the global work by Vorosmarty et al.,22 agroup of eight experts assigned weights to the relative threats towater security and biodiversity. Their approach led to a verycomplex matrix of weightings to threats and was useful becauseit permitted the careful parsing of disparate drivers influencingwater security and biodiversity. Expert groups can serve as aidsto management with limited information such as with Delphipanels35 and Bayesian Belief Networks. Such approachesrequire a structural model to guide the expert group, and weprovide one such model for the weighting of the drivers ofenvironmental impact.The valuation of ES has unique aspects relative to some other
economic valuation categories. It is not possible to assign a fullvalue to nonmarketed benefits (e.g., cultural values).Furthermore, ES might completely collapse if they areoverexploited.31 It is not known how marginal values of ESrelate to the economic cost for most systems. Here, we do notestablish the functional relationship between cost and ES or thepoint where the system collapses. An assumed linear relation-ship means that our estimates are intrinsically conservative; ifthe value of an ES falls to 0 abruptly, then our indices wouldunderestimate how close we are to overappropriating anyindividual good or service. Furthermore, the ES are linked, so ifone collapses (e.g., enough water is used that streams and riversdry seasonally), then others might completely collapse as well(e.g., species will be lost when rivers and streams dry). Thescheme here does not account for such linkages and is thusconservative.It also is important that not all ES used will replenish if use is
halted. Once a species is extinct, the value can never come back.In contrast, water that is contaminated with coliform canrecover over time if the sources of pollution are controlled.Such considerations are important, and extending our approachto one that specifically accounts for sustainability would be onenext step to take.We document that humans are decreasing the provision of
freshwater potential ES by about 16% overall. Regardless of thesystem of valuation used to weight the total global humanimpact on freshwaters, humanity has a global impact on theability of freshwater to provide ES. If one accepts a linearrelationship between the amount of ES and the values providedby freshwaters as well as the estimate of Costanza et al.14 forglobal value of ES, then the 16% decrease represents a globalloss of over $900 billion in 2013 dollars. An independentestimate by The Economics of Ecosystems and Biodiversitygroup36 on the basis of the Millennium Ecosystem Assessment
Environmental Science & Technology Policy Analysis
dx.doi.org/10.1021/es4021052 | Environ. Sci. Technol. 2013, 47, 9061−90689066
methodology15 gives similar median values per hectare forfreshwater habitats, providing independent confirmation of theglobal totals and the different accounting schemesHumans are appropriating roughly half of all available water,
or about 1/6 of all freshwater,12 and this is consistent with our
observation that about 1/6 of the potential freshwater value tohumanity is used. Fortunately, many of the impacts accountedfor here are reversible over reasonable amounts of time (withthe exceptions being for all species extinctions, most speciesintroductions, and cases of groundwater extraction). Moredetailed approaches, such as those outlined by Keeler et al.,13
could further inform management approaches to solving thesecomplex and intertwined problems.Our documentation of the loss of value provides additional
compelling evidence that may help society understand thatfreshwater is a limitedresource, that the values that freshwatersprovide humanity have an upper limit, and that our water issubject to numerous threats. Humans have clearly compro-mised the ability of freshwater ecosystems to supply all of theES that humanity requires to increase its standard of living andfeed a growing population. Some of these ES can renewthemselves (water supply), whereas others (e.g., biodiversity)will be lost forever. The overall index was most stronglyinfluenced by the population growth rate, so lowering humanpopulation growth rates could potentially help minimize someof the damage we are doing to freshwaters.
■ ASSOCIATED CONTENT*S Supporting InformationDescriptions, methodology, and equations for each index;description and data sources for drivers; description andmethodology for calculating the human freshwater impact(HFI); detailed mapping methodology; and additional refs.This material is available free of charge via the Internet athttp://pubs.acs.org.
■ AUTHOR INFORMATIONCorresponding Author*Phone: 785 532 6998; Fax 785 532 6653; E-mail: [email protected] ContributionsThe manuscript was written through contributions of allauthors. All authors have given approval to the final version ofthe manuscript.NotesThe authors declare no competing financial interest.
■ ACKNOWLEDGMENTSWe thank Erika Martin, James Whitney, Kyle Winders, andAlex Reisinger for ideas in the early stages of this project andthe LAB aquatic journal club for review. The anonymousreviewers of this manuscript did a commendable and thoroughjob, and we are grateful for their input. We thank WilfredWollheim (University of New Hampshire) for providing thepreviously published data for global nitrogen distribution. ThisArticle is publication #14-052-J from the Kansas AgriculturalExperiment Station.
■ REFERENCES(1) Dudgeon, D.; Arthington, A. H.; Gessner, M. O.; Kawabata, Z.;Knowler, D. J.; Leveque, C.; Naiman, R. J.; Preiur-Richard, A.; Soto,D.; Stiassny, M. L. J.; Sullivan, C. A. Freshwater biodiversity:
importance, threats, status and conservation challenges. Biol. Rev.2006, 81, 163−182.(2) Postel, S. L.; Daily, G.; Ehrlich, P. R. Human appropriation ofrenewable fresh water. Science 1996, 271, 785−788.(3) Arnell, N. W. Climate change and global water resources. GlobalEnviron. Change 1999, 9, S31−S49.(4) Zimmerman, J. B.; Mihelcic, J. R.; Smith, J. Global stressors onwater quality and quantity. Environ. Sci. Technol. 2008, 42, 4247−4254.(5) Naidoo, R.; Balmford, A.; Ferraro, P. J.; Polasky, S.; Ricketts, T.H.; Rouget, M. Integrating economic costs into conservation planning.Trends Ecol. Evol. 2006, 21, 681−687.(6) Nelson, E.; Mendoza, G.; Regetz, J.; Polasky, S.; Tallis, H.;Cameron, D. R.; Chan, K. M. A.; Daily, G. C.; Goldstein, J.; Kareiva, P.M.; Lonsdorf, E.; Naidoo, R.; Ricketts, T. H.; Shaw, M. R. Modelingmultiple ecosystem services, biodiversity conservation, commodityproduction, and tradeoffs at landscape scales. Front. Ecol. Environ.2009, 7, 4−11.(7) Jordan, S. J.; Hayes, S. E.; Yoskowitz, D.; Smith, L. M.; Summers,J. K.; Russell, M.; Benson, W. H. Accounting for natural resources andenvironmental sustainability: linking ecosystem services to humanwell-being. Environ. Sci. Technol. 2010, 44, 1530−1536.(8) Dodds, W. K.; Bouska, W. W.; Eitzmann, J. L.; Pilger, T. J.; Pitts,K. L.; Riley, A. J.; Schloeser, J. T.; Thornbrugh, D. J. Eutrophication ofUS freshwaters: analysis of potential economic damages. Environ. Sci.Technol. 2009, 43, 12−19.(9) Kuby, M. J.; Fagan, W. F.; ReVelle, C. S.; Graf, W. L. Amultiobjective optimization model for dam removal: an exampletrading off salmon passage with hydropower and water storage in theWillamette basin. Adv. Water Resour. 2005, 28, 845−855.(10) Limburg, K. E.; O’Neill, R. V.; Costanza, R.; Farber, S. Complexsystems and valuation. Ecol. Econ. 2002, 41, 409−420.(11) Naidoo, R.; Balmford, A.; Costanza, R.; Fisher, B.; Green, R. E.;Lehner, B.; Malcolm, T. R.; Ricketts, T. H. Global mapping ofecosystem services and conservation priorities. Proc. Natl. Acad. Sci.U.S.A. 2008, 105, 9495−9500.(12) Postel, S. L. Entering an era of water scarcity: the challengesahead. Ecol. Appl. 2000, 10, 941−948.(13) Keeler, B. L.; Polasky, S.; Brauman, K. A.; Johnson, K. A.; Finlay,J. C.; O’Neill, A.; Kovacs, K.; Dalzell, B. Linking water quality and well-being for improved assessment and valuation of ecosystem services.Proc. Natl. Acad. Sci. U.S.A. 2012, 109, 18619−18624.(14) Costanza, R.; d’Arge, R.; de Groot, R.; Farber, S.; Grasso, M.;Hannon, B.; Limburg, K.; Naeem, S.; O’Neill, R. V.; Paruelo, J.;Raskin, R. G.; Sutton, P.; van den Belt, M. The value of the world’secosystem services and natural capital. Ecol. Econ. 1997, 387, 253−260.(15) Ecosystems and Human Well-Being: Synthesis; Island Press:Washington, DC, 2005.(16) Dodds, W. K.; Wilson, K. C.; Rehmeier, R. L.; Knight, G. L.;Wiggam, S.; Falke, J. A.; Dalgleish, H. J.; Bertrand, K. N. Comparingecosystem goods and services provided by restored and native lands.BioScience 2008, 58, 837−845.(17) Froese, R.; Pauly, D. FishBase: A global information system onfishes. 2011. http://www.fishbase.org (accessed September 1, 2011).(18) Wang, L.; Robertson, D.; Garrison, P. Linkages betweennutrients and assemblages of macroinvertebrates and fish in wadeablestreams: implications to nutrient criteria development. Environ.Manage. 2007, 39, 194−212.(19) Evans-White, M. A.; Dodds, W. K.; Huggins, D. G.; Baker, D. S.Thresholds in macroinvertebrate biodiversity and stoichiometry acrosswater-quality gradients in central plains (USA) streams. J. N. Am.Benthol. Soc. 2009, 28, 855−868.(20) Chambers, P. A.; McGoldrick, D. J.; Brua, R. B.; Vis, C.; Culp, J.M.; Benoy, G. A. Development of environmental thresholds fornitrogen and phosphorus in streams. J. Environ. Qual. 2012, 41, 7−20.(21) Naylor, R. L.; Goldburg, R. J.; Primavera, J. H.; Kautsky, N.;Beveridge, M. C. M.; Clay, J.; Folke, C.; Lubchenco, J.; Mooney, H.;Troell, M. Effect of aquaculture on world fish supplies. Nature 2000,405, 1017−1024.
Environmental Science & Technology Policy Analysis
dx.doi.org/10.1021/es4021052 | Environ. Sci. Technol. 2013, 47, 9061−90689067
(22) Vorosmarty, C.; McIntyre, P.; Gessner, M.; Dudgeon, D.;Prusevich, A.; Green, P.; Glidden, S.; Bunn, S.; Sullivan, C.; Liermann,C. Global threats to human water security and river biodiversity.Nature 2010, 467, 555−561.(23) Wollheim, W. M.; Vorosmarty, C. J.; Bouwman, A. F.; Green, P.A.; Harrison, J.; Linder, E.; Peterson, B. J.; Seitzinger, S.; Syvitski, J. P.M. Global N removal by freshwater aquatic systems: a spatiallydistributed, within-basin approach. Global Biogeochem. Cycles 2008,GB2026 DOI: 10.1029/2007GB002963.(24) Grossman, G. M.; Krueger, A. B. Environmental impacts of aNorth American free trade agreement. Nat. Bur. Econ. Res. 1991, 3914-1−3914-57.(25) Dinda, S. Environmental Kuznets curve hypothesis: a survey.Ecol. Econ. 2004, 49, 431−455.(26) Canobbio, S.; Messanotte, V.; Sanfilippo, U.; Benvenuto, F.Effects of multiple stressors on water quality and macroinvertebrateassemblages in an effluent-dominated stream. Water, Air, Soil Pollut.2009, 198, 359−371.(27) Stern, D. Economic growth and environmental degradation: theenvironmental Kuznets curve and sustainable development.World Dev.1996, 24, 1151−1160.(28) Kahn, J. R. The Economic Approach to Environmental and NaturalResources; Dryden Press: Fort Worth, TX, 1995.(29) Costanza, R. Social goals and the valuation of ecosystemservices. Ecosystems 2000, 3, 4−10.(30) Gundry, S.; Wright, J.; Conroy, R. A systematic review of thehealth outcomes related to household water quality in developingcountries. J. Water Health 2004, 2, 1−14.(31) Fisher, B.; Turner, K.; Zylstra, M.; Brouwer, R.; de Groot, R.;Farber, S.; Ferraro, P.; Green, R.; Hadley, D.; Harlow, J.; Jefferiss, P.;Kirkby, C.; Morling, P.; Mowatt, S.; Naidoo, R.; Paavola, J.; Strassburg,B.; Yu, D.; Balmford, A. Ecosystem services and economic theory:integration for policy-relevant research. Ecol. Appl. 2008, 18, 2050−2067.(32) Chee, Y. E. An ecological perspective on the valuation ofecosystem services. Biol. Conserv. 2004, 120, 549−565.(33) Hein, L.; van Koppen, K.; de Groot, R. S.; van Ierland, E. C.Spatial scales, stakeholders and the valuation of ecosystem services.Ecol. Econ. 2006, 57, 209−228.(34) Chan, K. M. A.; Guerry, A. D.; Balvanera, P.; Klain, S.;Satterfield, T.; Basurto, X.; Bostrom, A.; Chuenpagdee, R.; Gould, R.;Halpern, B. S.; Hannahs, N.; Levine, J.; Norton, B.; Ruckelshaus, M.;Russell, R.; Tam, J.; Woodside, U. Where are cultural and social inecosystem services? A framework for constructive engagement.BioScience 2012, 62, 744−756.(35) Curtis, I. A. Valuing ecosystem goods and services: a newapproach using a surrogate market and the combination of a multiplecriteria analysis and a Delphi panel to assign weights. Ecol. Econ. 2004,50, 163−194.(36) Russi, D.; ten Brink, P.; Farmer, A. The economics ofecosystems and biodiversity for water and wetlands. http://www.ramsar.org/pdf/TEEB/TEEB_Water-Wetlands_Final-Consultation-Draft.pdf.(37) Schuyt, K.; Brander, L. Living waters: the economic values ofthe world’s wetlands. http://vincsfreefr/IMG/wetlandsbrochurefinal.pdf (accessed September 1, 2011), World Wildlife Fund: Gland,Switzerland.(38) Tong, C. R. A.; Feagin, J. L.; Zhang, X.; Zhu, X.; Wang, W.; He,W. Ecosystem service values and restoration in the urban Sanyangwetland of Wenzhou, China. Ecol. Eng. 2007, 29, 249−258.
Environmental Science & Technology Policy Analysis
dx.doi.org/10.1021/es4021052 | Environ. Sci. Technol. 2013, 47, 9061−90689068