Embed Size (px)
Citation preview
Human Population Growth Through Time
Tens of thousands of years
123 years
33 years
14 years
13 years
12 years
Current world population: 7.35 Billion (Nov. 2016)http://www.worldometers.info/world-population/
13 years20127 billion
1804
1927
1974
1999
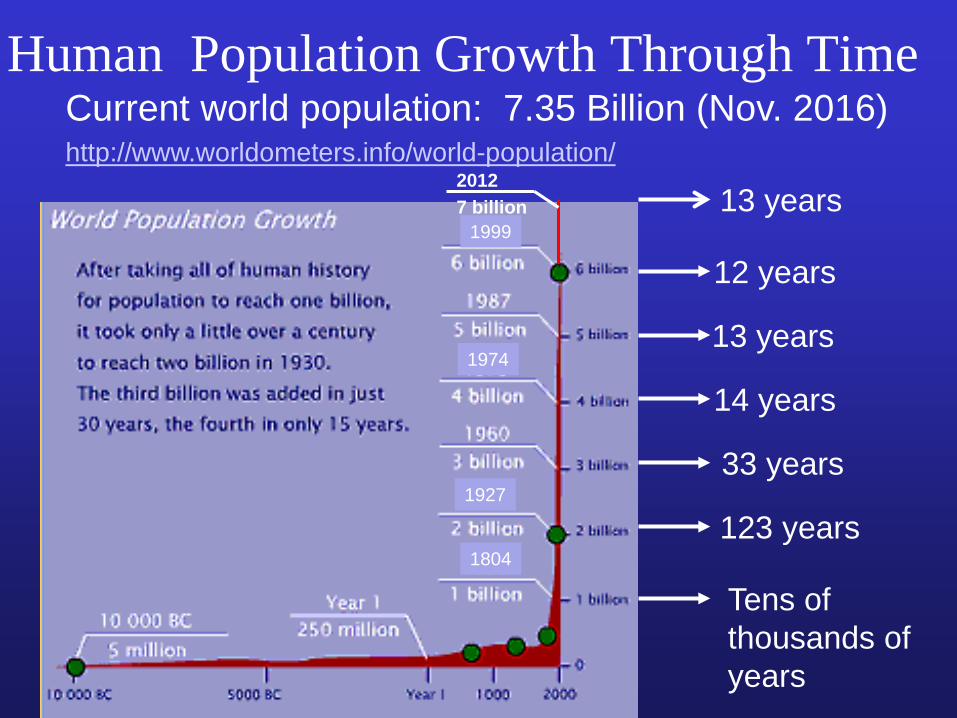
Birth and Death RatesBirth rate is reported as the number of births per __________ peopleDeath rate is reported as the number of deaths per _________ people
Population Change = { Births + _____________} – {Deaths + _______________}
Calculating Population Change
Immigration Emigration
zero population growth (ZPG) occurs when factors that increase and decrease population size are in balance.
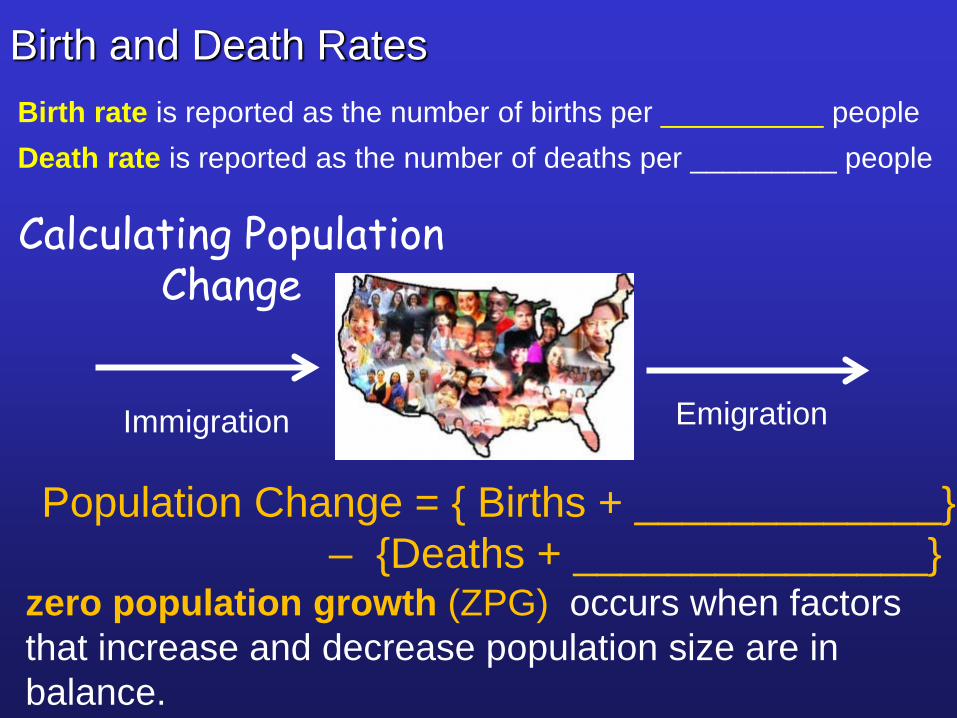
PopulationChange
Annual rate of population increase is expressed as a percentage.
Birth rates are higher in ______________ nations (highest on the _________ continent)
Country A has a birth rate of 12 per 1000 in 2000, and a death rate of 9 per 1000 in the same year. What is its rate of growth in the year 2000 (assuming no net immigration or emigration), as a percent?Since the birth and death rates are given per 1000, need to convert the difference to a percent. ____________________
Doubling time of a population can be calculated by the rule of 70: Doubling time = 70/percentage growth rateIf a population of howler monkeys increases by 3.5% per year, how long will it take the population to double? ____________
Fertility RatesReplacement Fertility: Number of children a couple must have to
replace themselves.____ in developed nations____ in developing nations
(due to higher infant mortality)Total Fertility Rate (TFR): Average number of children a woman will
have in her child-bearing years.Global average: ____Developed nations: _____Developing nations: _____
https://ourworldindata.org/fertility/#total-fertility-rate-from-1950-to-2015
National Geographic: Population density maphttp://www.nationalgeographic.com/earthpulse/population.html
http://metrocosm.com/history-of-cities/
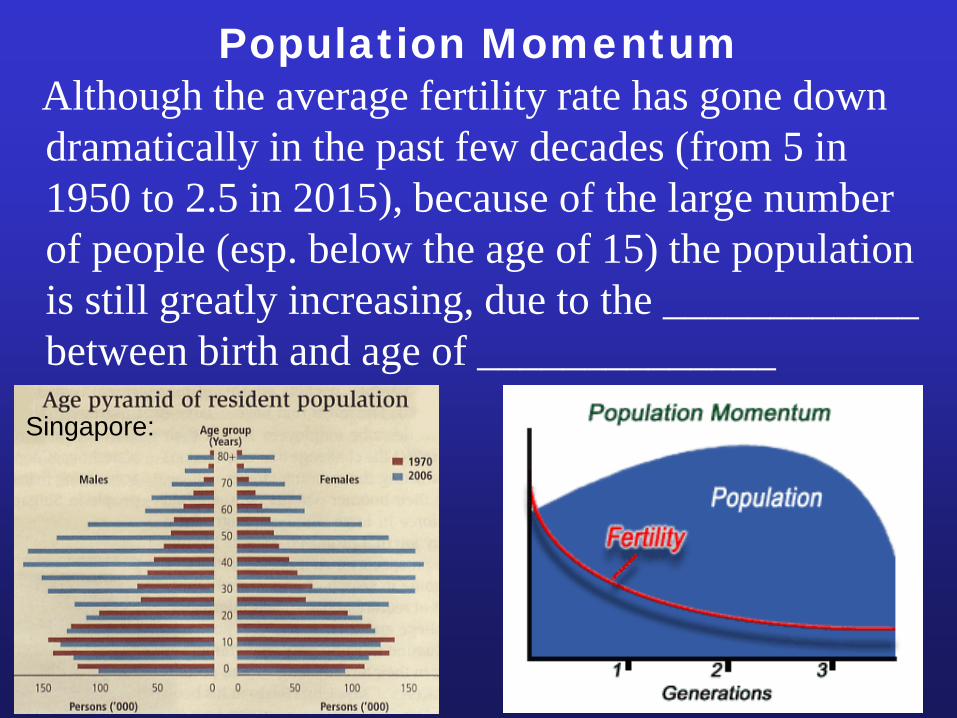
Population MomentumAlthough the average fertility rate has gone down dramatically in the past few decades (from 5 in 1950 to 2.5 in 2015), because of the large number of people (esp. below the age of 15) the population is still greatly increasing, due to the ____________ between birth and age of ______________
Singapore:
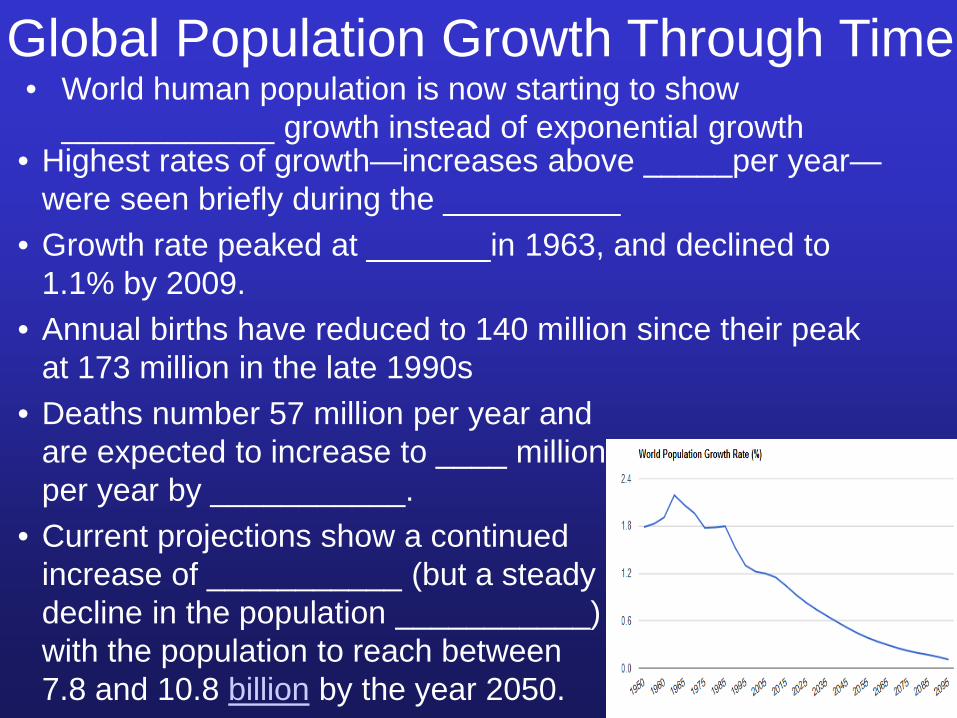
• Highest rates of growth—increases above _____per year—were seen briefly during the __________
• Growth rate peaked at _______in 1963, and declined to 1.1% by 2009.
• Annual births have reduced to 140 million since their peak at 173 million in the late 1990s
• Deaths number 57 million per year andare expected to increase to ____ million per year by ___________.
• Current projections show a continued increase of ___________ (but a steady decline in the population ___________) with the population to reach between 7.8 and 10.8 billion by the year 2050.
Global Population Growth Through Time• World human population is now starting to show
____________ growth instead of exponential growth
Factors That Can Decrease Fertility Rates
• increase in average level of education & __________;• increased educational & employment opportunities for _______________;
• greater availability of private & public ___________;• decrease in importance of _______________;
• increased ________________;• higher average ________________;• increased _________ of raising & educating children;• _____________ infant mortality (larger families if infant death common)
• greater availability of reliable _______________• greater availability of legal ______________• change in religious beliefs, traditions, & cultural normsaway from encouraging _______________.
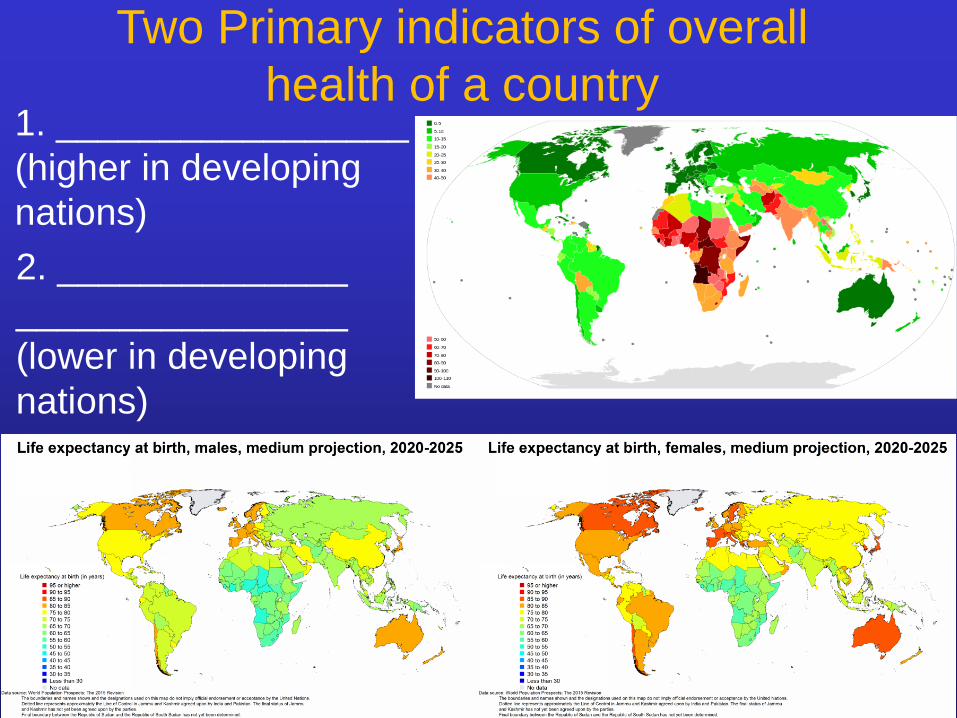
Two Primary indicators of overall health of a country
1. _________________ (higher in developing nations)2. ______________ ________________ (lower in developing nations)
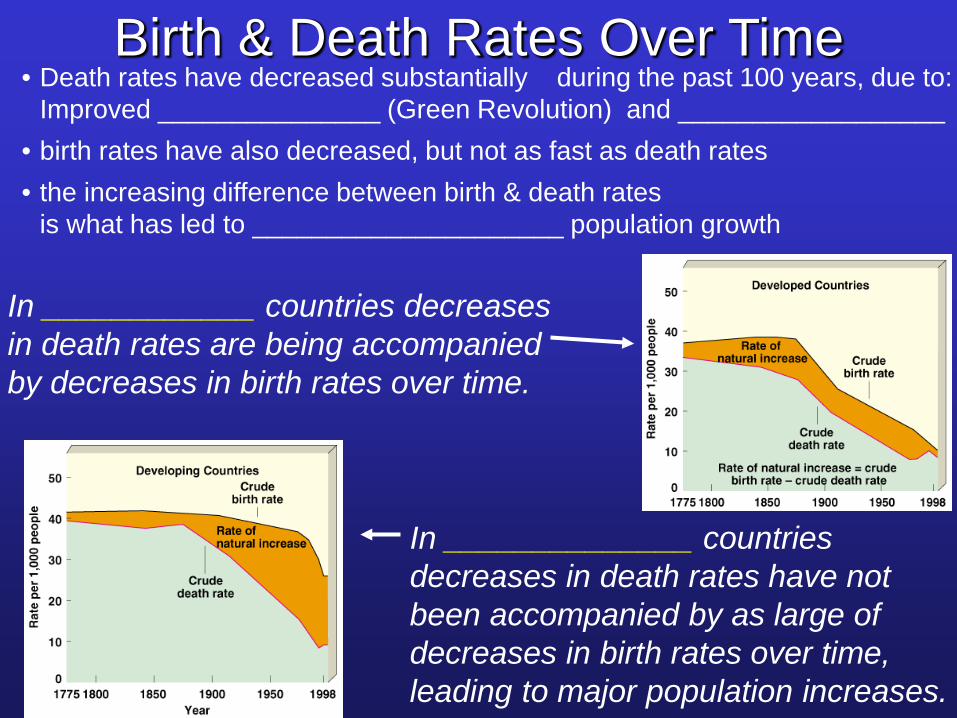
Birth & Death Rates Over Time
In ____________ countries decreases in death rates are being accompanied by decreases in birth rates over time.
In ______________ countries decreases in death rates have not been accompanied by as large of decreases in birth rates over time, leading to major population increases.
• Death rates have decreased substantially during the past 100 years, due to: Improved _______________ (Green Revolution) and __________________
• birth rates have also decreased, but not as fast as death rates• the increasing difference between birth & death rates
is what has led to _____________________ population growth
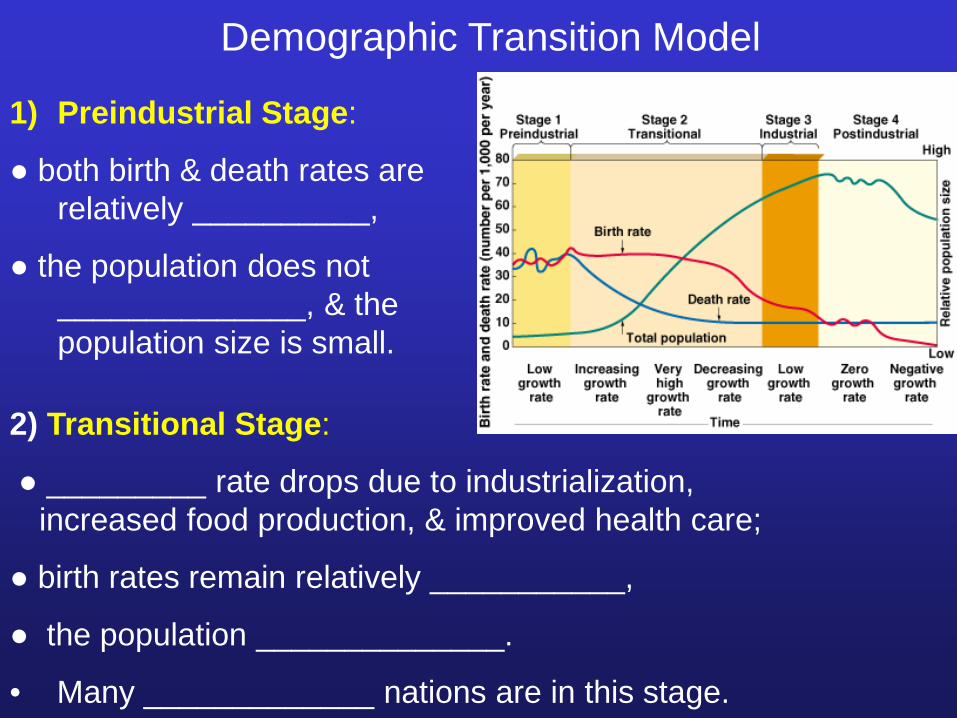
Demographic Transition Model
2) Transitional Stage:
● _________ rate drops due to industrialization, increased food production, & improved health care;
● birth rates remain relatively ___________,
● the population ______________.
• Many _____________ nations are in this stage.
1) Preindustrial Stage:
● both birth & death rates are relatively __________,
● the population does not ______________, & the population size is small.
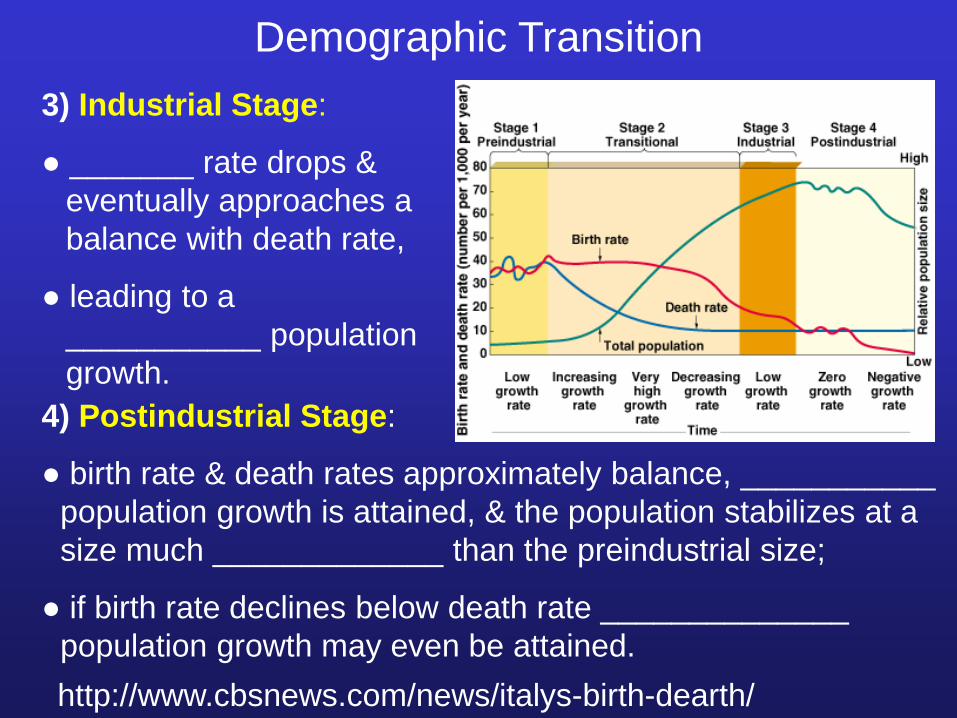
Demographic Transition3) Industrial Stage:
● _______ rate drops & eventually approaches a balance with death rate,
● leading to a ___________ population growth.
4) Postindustrial Stage:
● birth rate & death rates approximately balance, ___________ population growth is attained, & the population stabilizes at a size much _____________ than the preindustrial size;
● if birth rate declines below death rate ______________ population growth may even be attained.http://www.cbsnews.com/news/italys-birth-dearth/
Population Age Structure
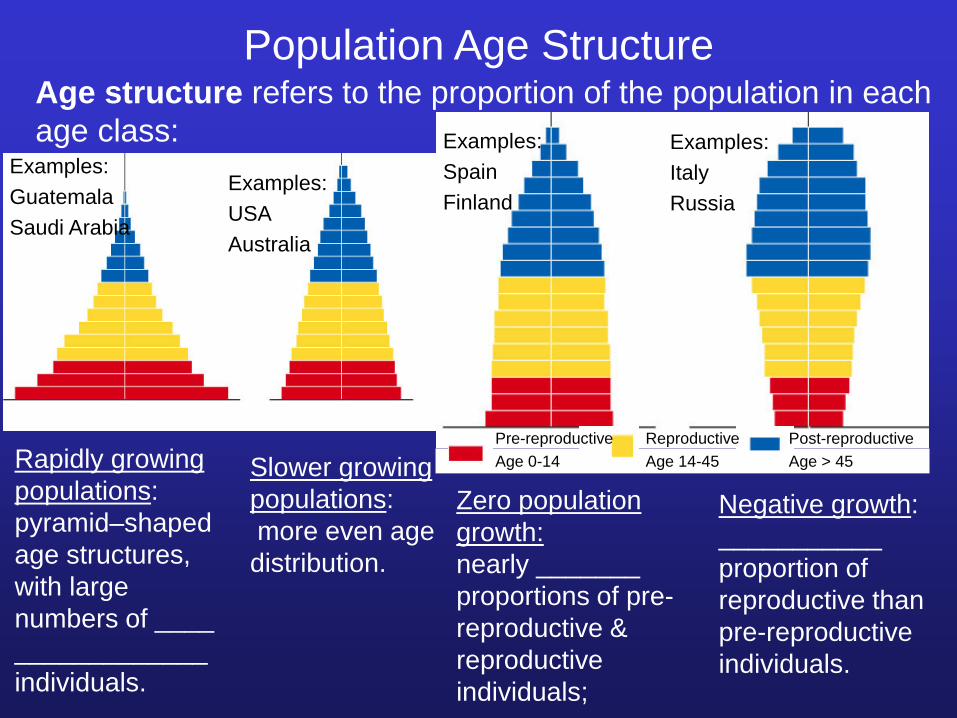
Rapidly growing populations: pyramid–shaped age structures, with large numbers of ____ _____________ individuals.
Male FemaleExamples:GuatemalaSaudi Arabia
Age structure refers to the proportion of the population in each age class:
Pre-reproductiveAge 0-14
Post-reproductiveAge > 45
ReproductiveAge 14-45Slower growing
populations:more even age distribution.
Examples:USAAustralia
Zero population growth:nearly _______ proportions of pre-reproductive & reproductive individuals;
Negative growth: ___________ proportion of reproductive than pre-reproductive individuals.
Examples:SpainFinland
Examples:ItalyRussia
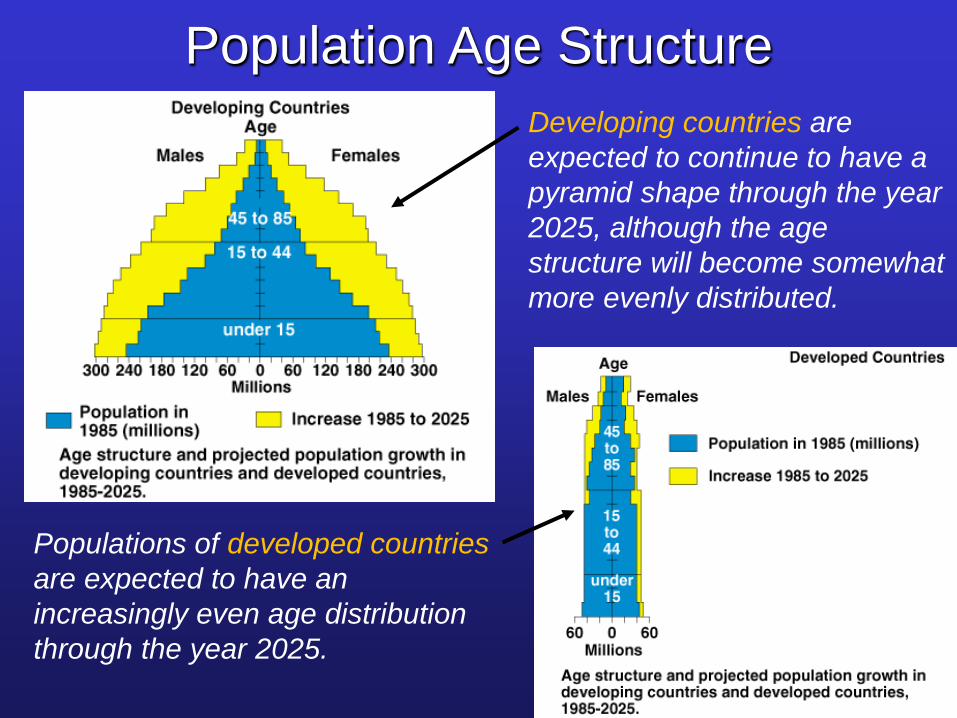
Population Age StructureDeveloping countries are expected to continue to have a pyramid shape through the year 2025, although the age structure will become somewhat more evenly distributed.
Populations of developed countries are expected to have an increasingly even age distribution through the year 2025.
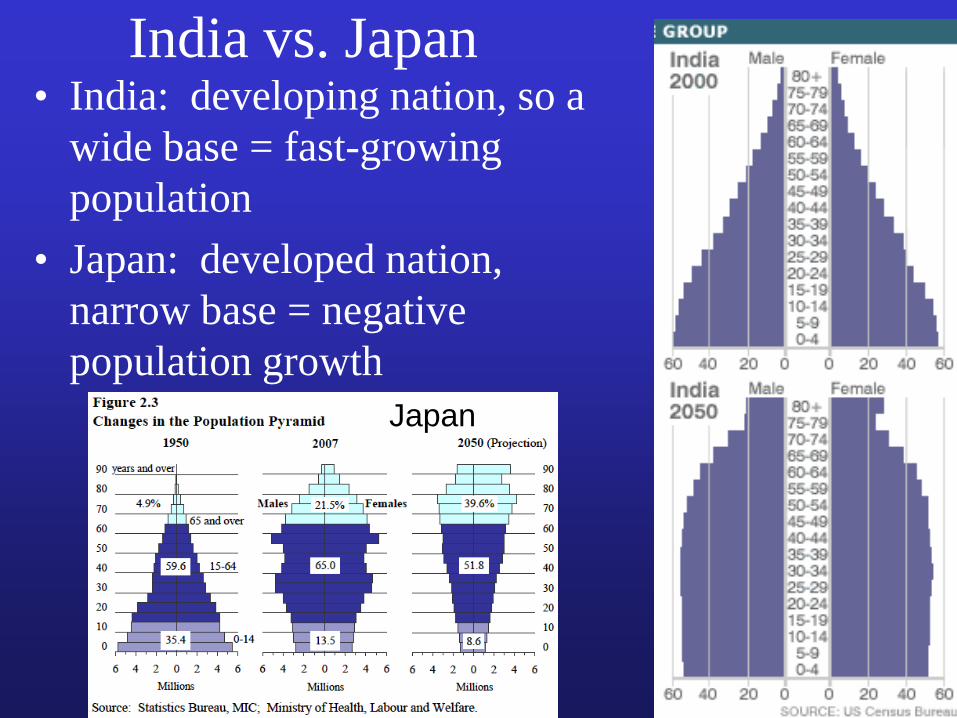
India vs. Japan• India: developing nation, so a
wide base = fast-growing population
• Japan: developed nation, narrow base = negative population growth
Japan
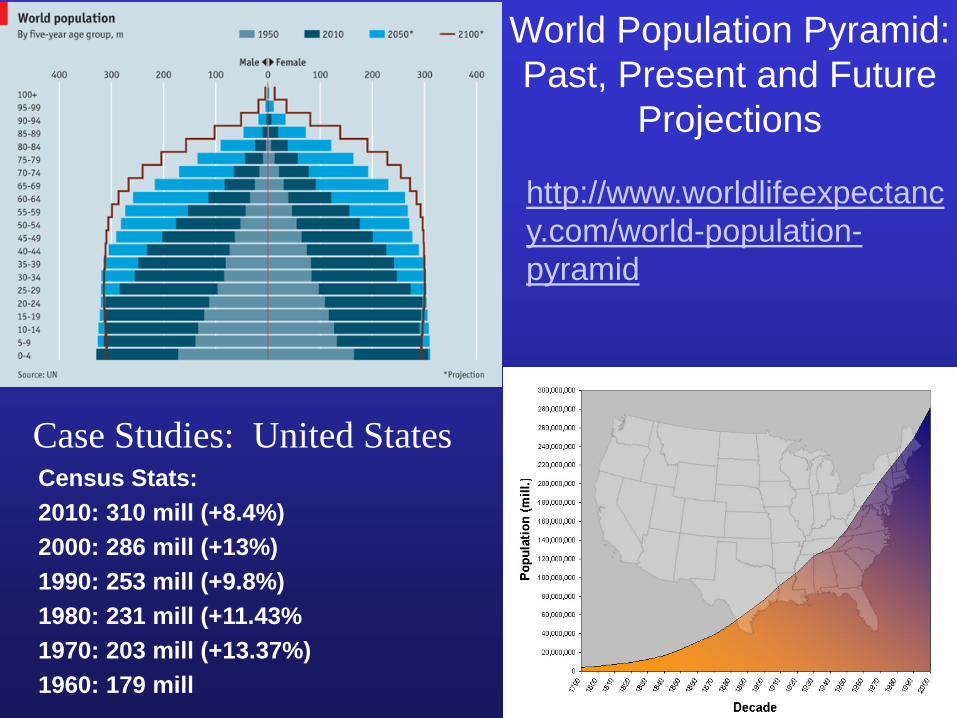
World Population Pyramid: Past, Present and Future
Projections
http://www.worldlifeexpectancy.com/world-population-pyramid
Case Studies: United StatesCensus Stats:2010: 310 mill (+8.4%)2000: 286 mill (+13%)1990: 253 mill (+9.8%)1980: 231 mill (+11.43%1970: 203 mill (+13.37%)1960: 179 mill
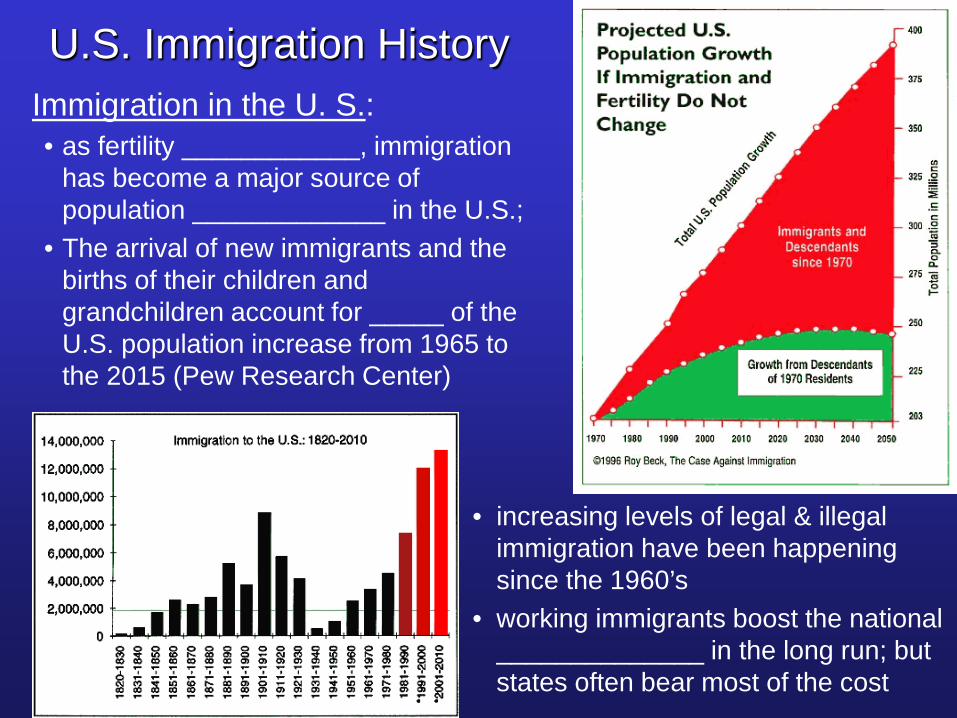
U.S. Immigration HistoryImmigration in the U. S.:• as fertility ____________, immigration
has become a major source of population _____________ in the U.S.;
• The arrival of new immigrants and the births of their children and grandchildren account for _____ of the U.S. population increase from 1965 to the 2015 (Pew Research Center)
• increasing levels of legal & illegal immigration have been happening since the 1960’s
• working immigrants boost the national ______________ in the long run; but states often bear most of the cost
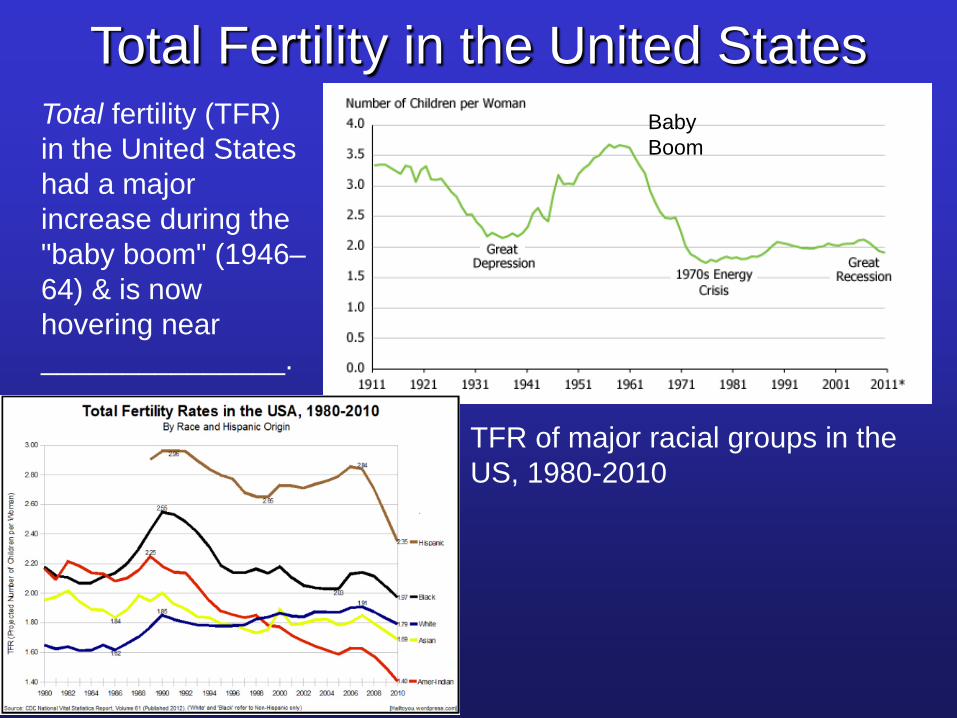
Total Fertility in the United StatesTotal fertility (TFR) in the United States had a major increase during the "baby boom" (1946–64) & is now hovering near _______________.
Baby Boom
TFR of major racial groups in the US, 1980-2010
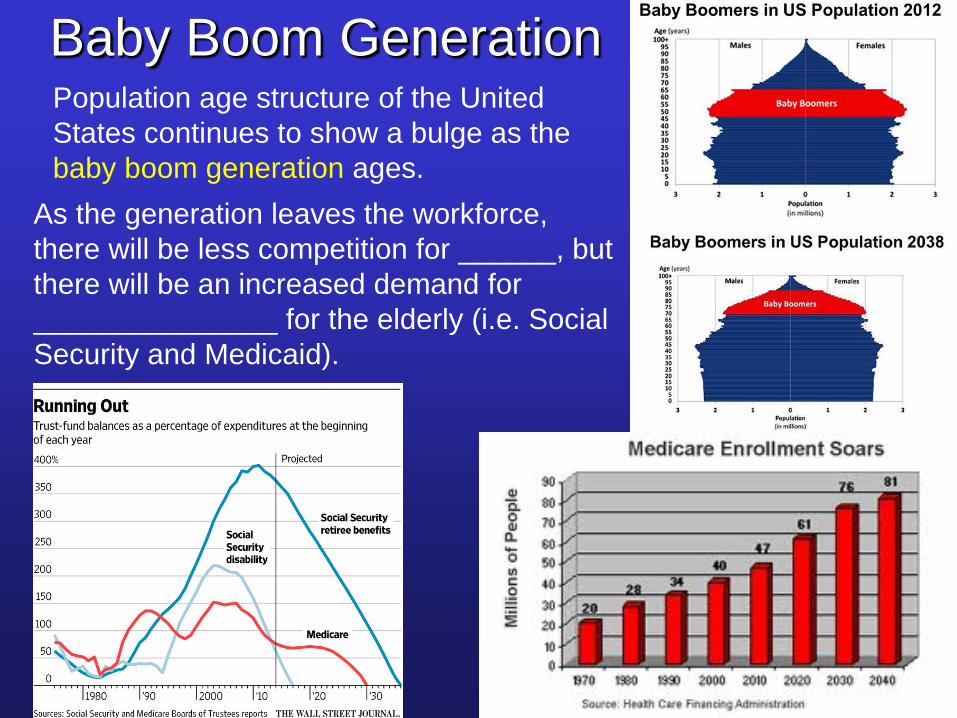
Baby Boom GenerationPopulation age structure of the United States continues to show a bulge as the baby boom generation ages.
As the generation leaves the workforce, there will be less competition for ______, but there will be an increased demand for _______________ for the elderly (i.e. Social Security and Medicaid).
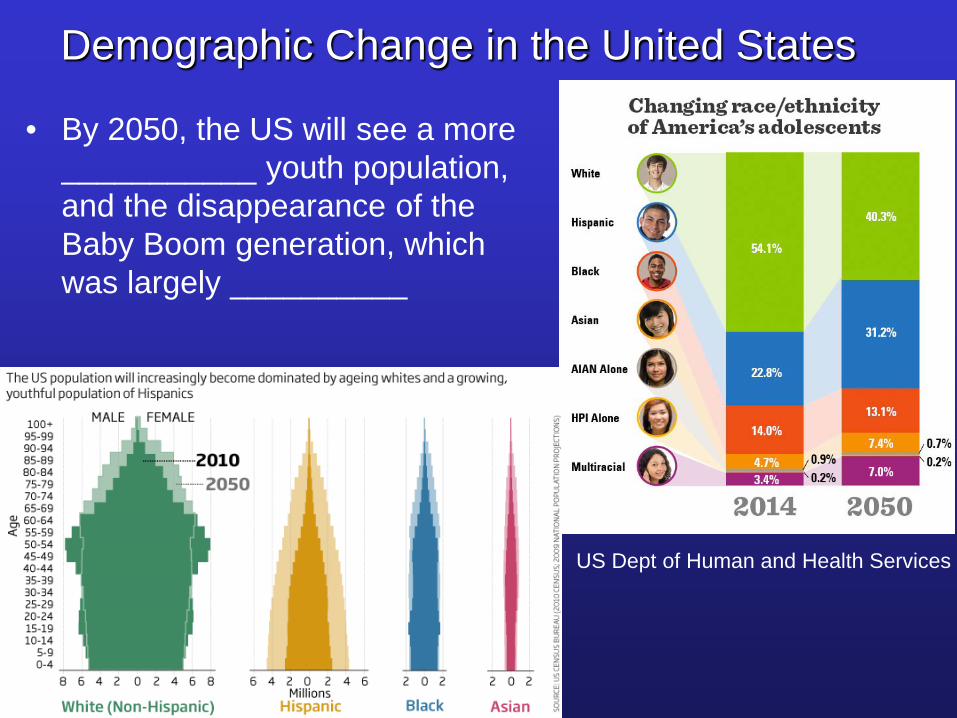
Demographic Change in the United States
US Dept of Human and Health Services
• By 2050, the US will see a more ___________ youth population, and the disappearance of the Baby Boom generation, which was largely __________
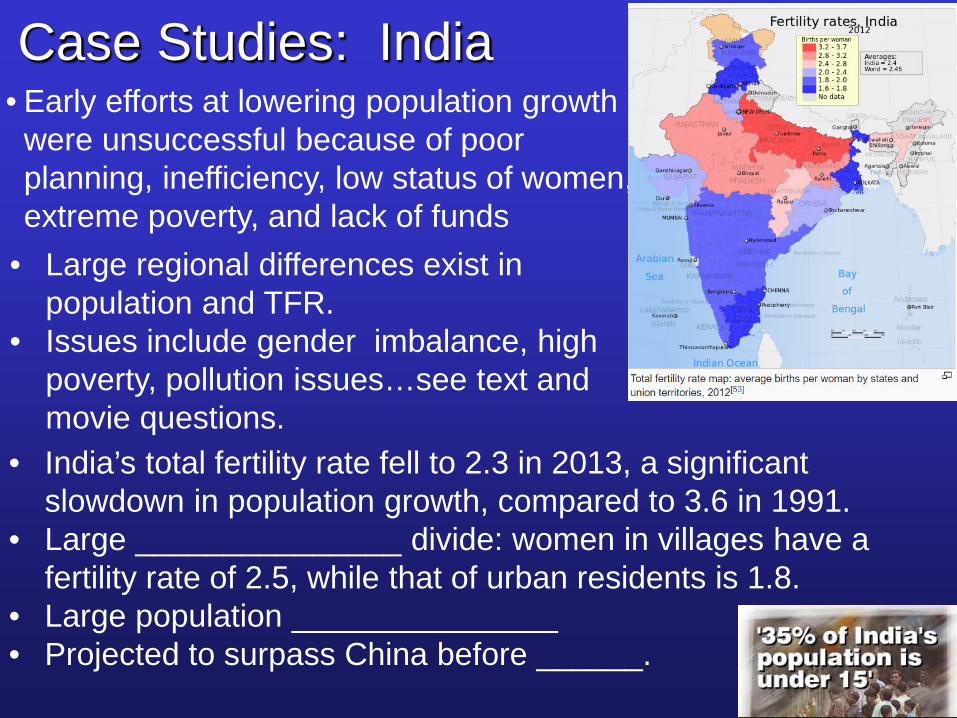
Case Studies: India• Early efforts at lowering population growth
were unsuccessful because of poor planning, inefficiency, low status of women, extreme poverty, and lack of funds
• Large regional differences exist in population and TFR.
• Issues include gender imbalance, high poverty, pollution issues…see text and movie questions.
• India’s total fertility rate fell to 2.3 in 2013, a significant slowdown in population growth, compared to 3.6 in 1991.
• Large _______________ divide: women in villages have a fertility rate of 2.5, while that of urban residents is 1.8.
• Large population _______________• Projected to surpass China before ______.
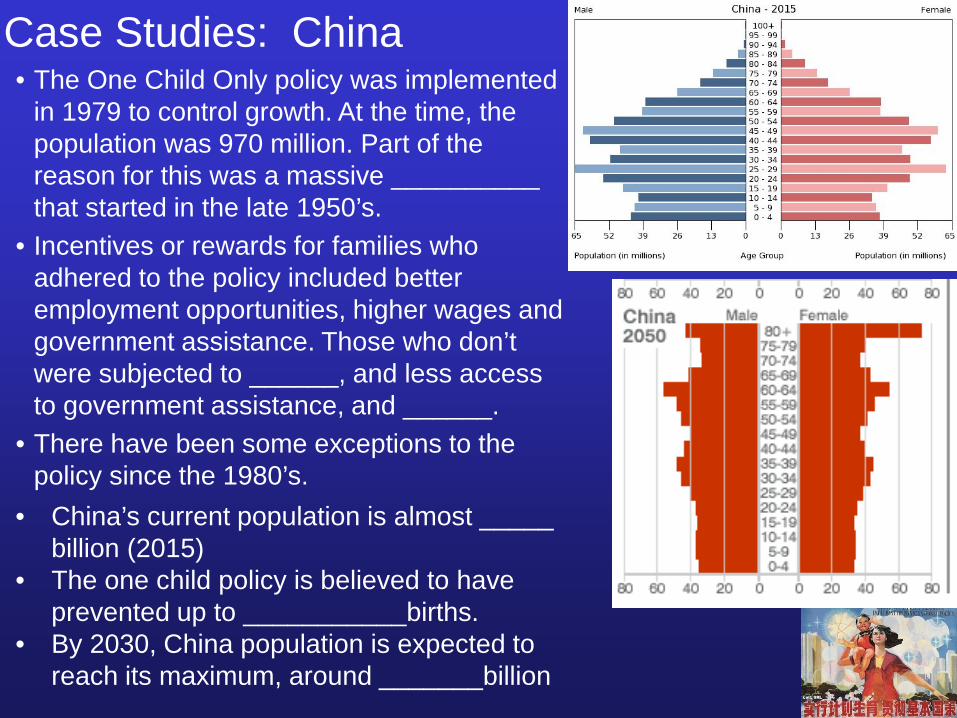
Case Studies: China• The One Child Only policy was implemented
in 1979 to control growth. At the time, the population was 970 million. Part of the reason for this was a massive __________ that started in the late 1950’s.
• Incentives or rewards for families who adhered to the policy included better employment opportunities, higher wages and government assistance. Those who don’t were subjected to ______, and less access to government assistance, and ______.
• There have been some exceptions to the policy since the 1980’s.
• China’s current population is almost _____ billion (2015)
• The one child policy is believed to have prevented up to ___________births.
• By 2030, China population is expected to reach its maximum, around _______billion
Case Studies: China• By 2050, China is projected to have _____________ population growth• Projected population in 2050: 1.41 billion• In October, 2015 China relaxed the policy so all couples can now have ____
children• One reason for relaxing the policy is the _______ of China’s population. By
2030, 25% of China’s population will be over 60.• Many couples in cities are not expected to have a second child, due to the
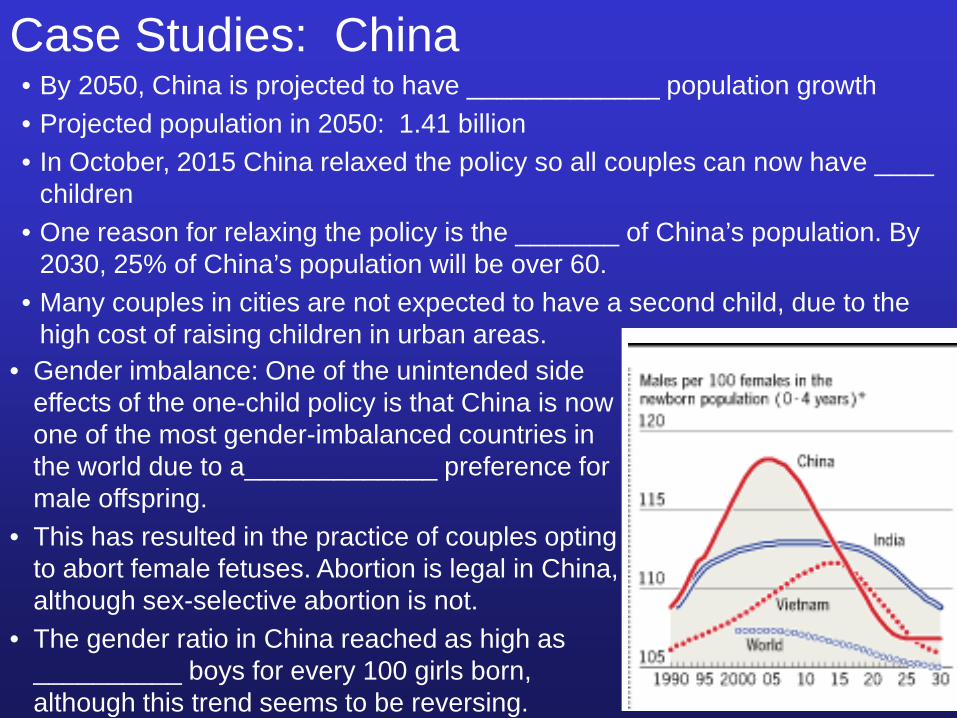
high cost of raising children in urban areas.• Gender imbalance: One of the unintended side
effects of the one-child policy is that China is now one of the most gender-imbalanced countries in the world due to a_____________ preference for male offspring.
• This has resulted in the practice of couples opting to abort female fetuses. Abortion is legal in China, although sex-selective abortion is not.
• The gender ratio in China reached as high as __________ boys for every 100 girls born, although this trend seems to be reversing.
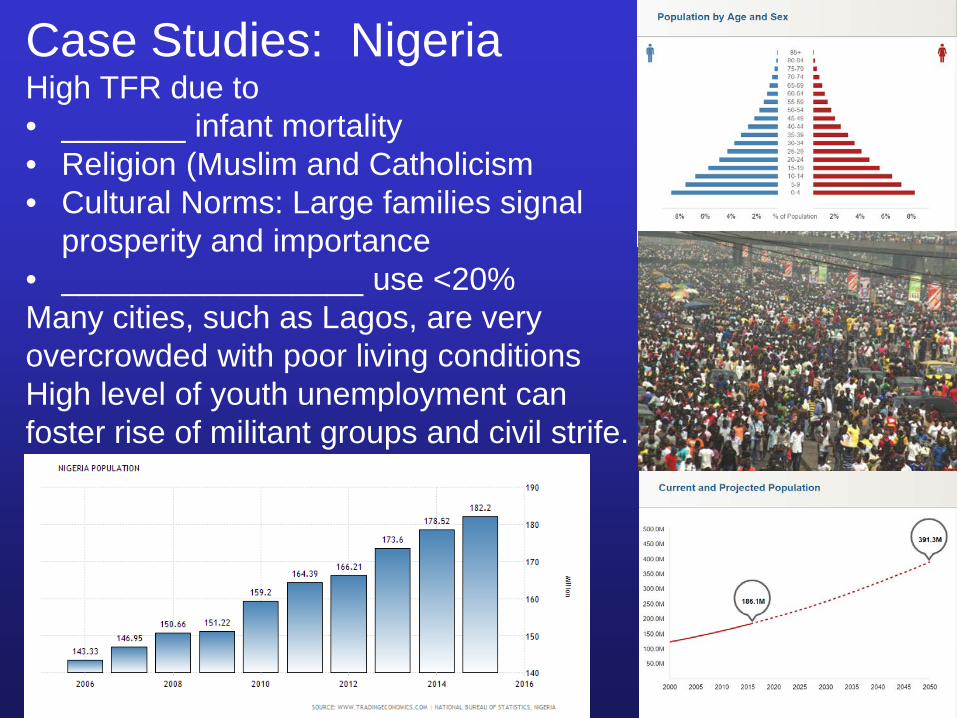
Case Studies: NigeriaHigh TFR due to • _______ infant mortality• Religion (Muslim and Catholicism• Cultural Norms: Large families signal
prosperity and importance• _________________ use <20%Many cities, such as Lagos, are very overcrowded with poor living conditionsHigh level of youth unemployment can foster rise of militant groups and civil strife.
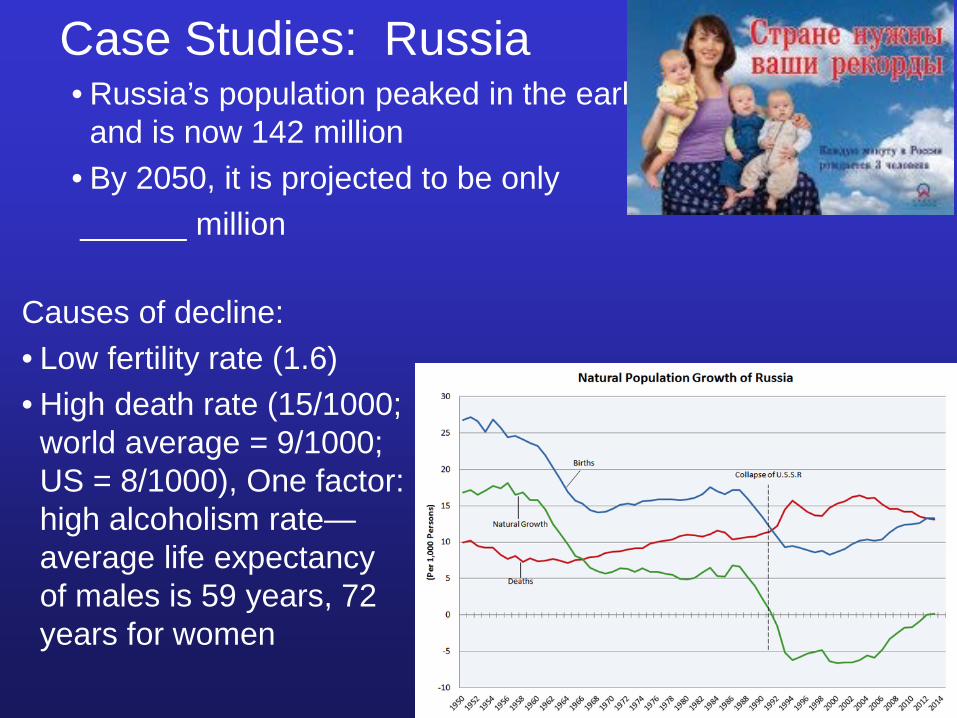
Case Studies: Russia• Russia’s population peaked in the early 1990’s at 148 million
and is now 142 million• By 2050, it is projected to be only______ million
Causes of decline: • Low fertility rate (1.6) • High death rate (15/1000;
world average = 9/1000; US = 8/1000), One factor: high alcoholism rate—average life expectancy of males is 59 years, 72 years for women
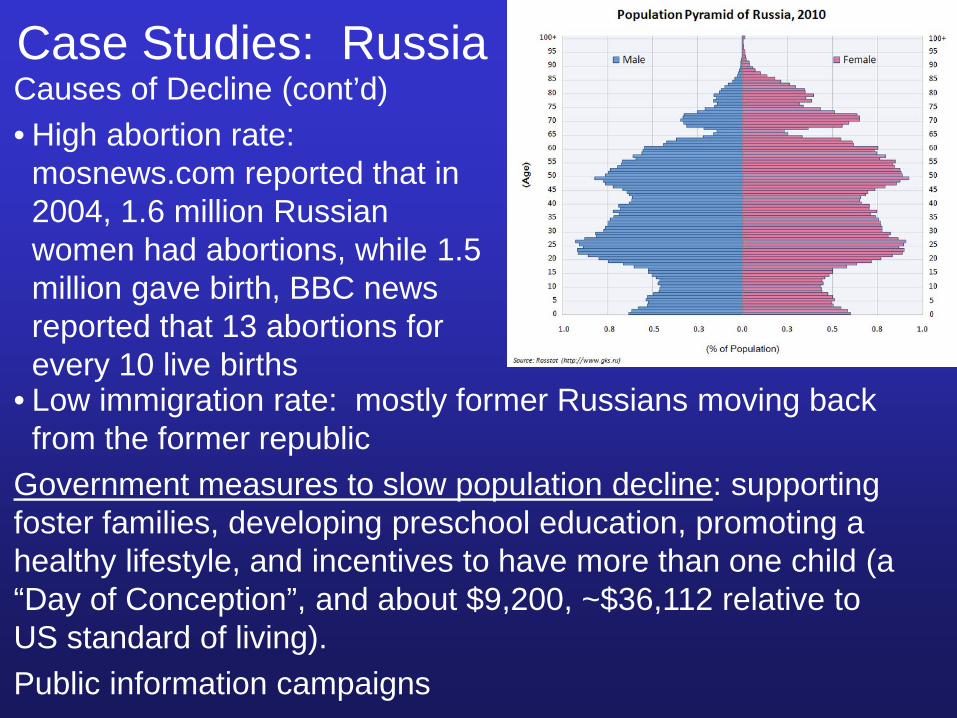
Causes of Decline (cont’d)• High abortion rate:
mosnews.com reported that in 2004, 1.6 million Russian women had abortions, while 1.5 million gave birth, BBC news reported that 13 abortions for every 10 live births
Case Studies: Russia
• Low immigration rate: mostly former Russians moving back from the former republic
Government measures to slow population decline: supporting foster families, developing preschool education, promoting a healthy lifestyle, and incentives to have more than one child (a “Day of Conception”, and about $9,200, ~$36,112 relative to US standard of living).Public information campaigns
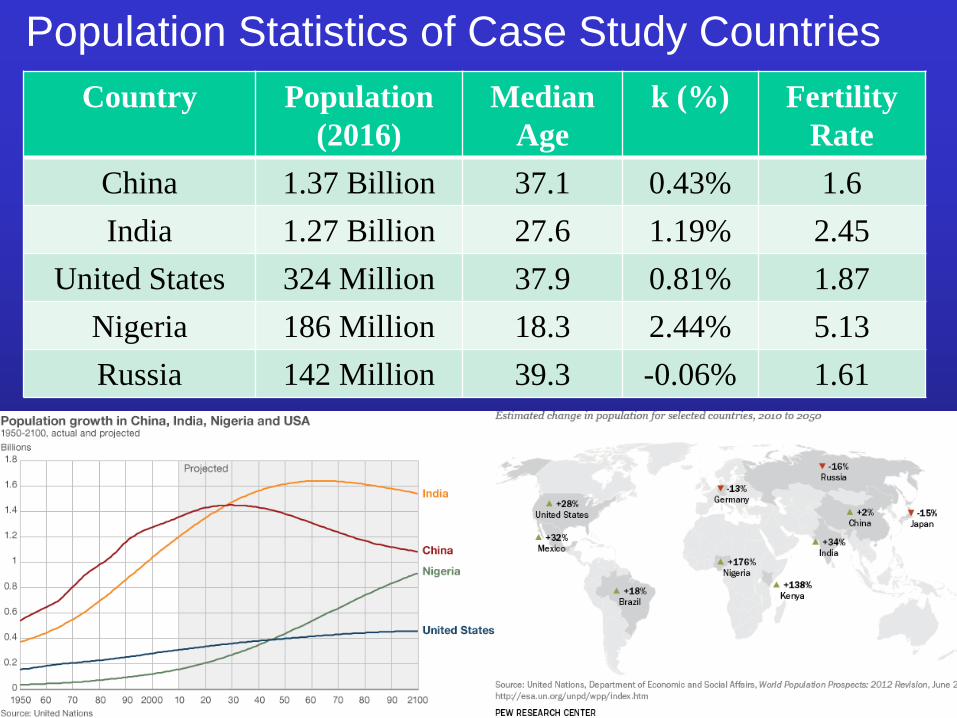
Population Statistics of Case Study CountriesCountry Population
(2016)Median
Agek (%) Fertility
RateChina 1.37 Billion 37.1 0.43% 1.6India 1.27 Billion 27.6 1.19% 2.45
United States 324 Million 37.9 0.81% 1.87Nigeria 186 Million 18.3 2.44% 5.13Russia 142 Million 39.3 -0.06% 1.61
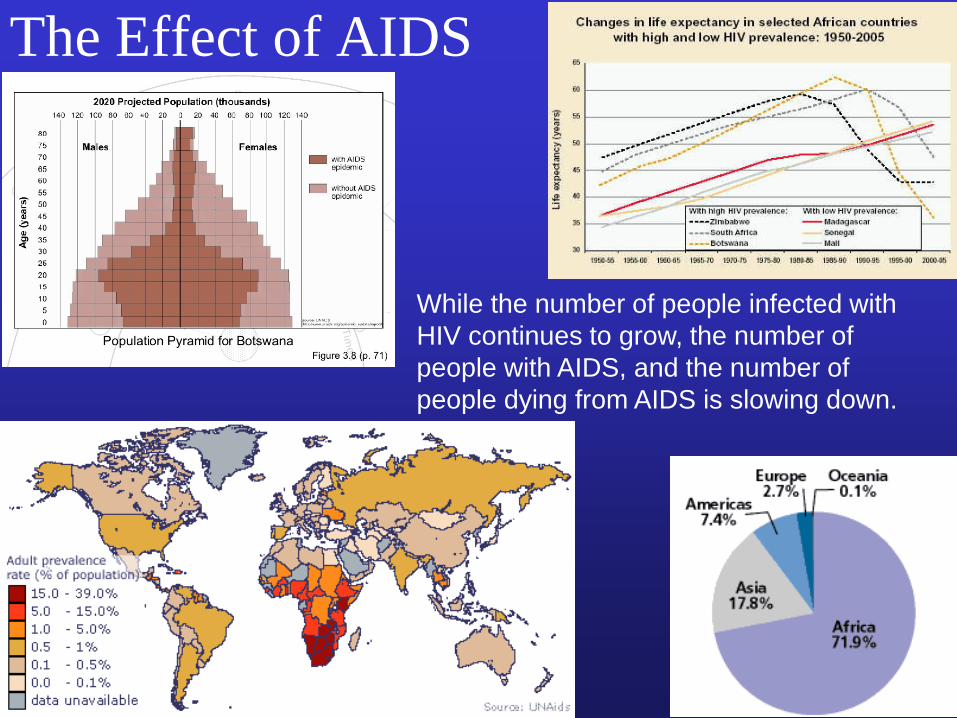
The Effect of AIDS
While the number of people infected with HIV continues to grow, the number of people with AIDS, and the number of people dying from AIDS is slowing down.
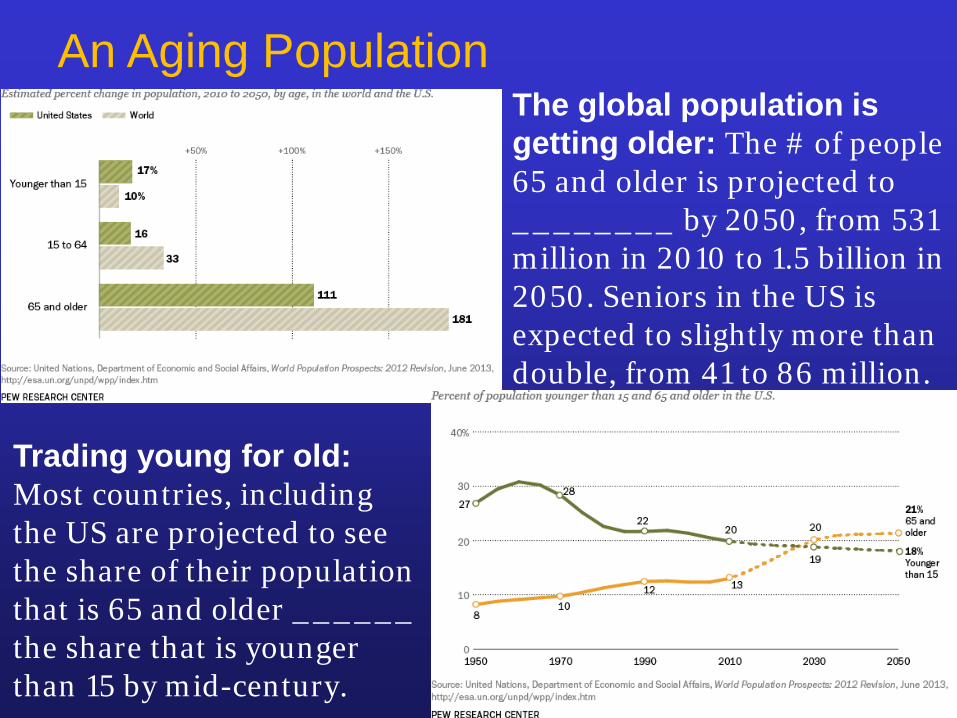
An Aging PopulationThe global population is getting older: The # of people 65 and older is projected to ________ by 2050, from 531 million in 2010 to 1.5 billion in 2050. Seniors in the US is expected to slightly more than double, from 41 to 86 million.
Trading young for old: Most countries, including the US are projected to see the share of their population that is 65 and older ______ the share that is younger than 15 by mid-century.
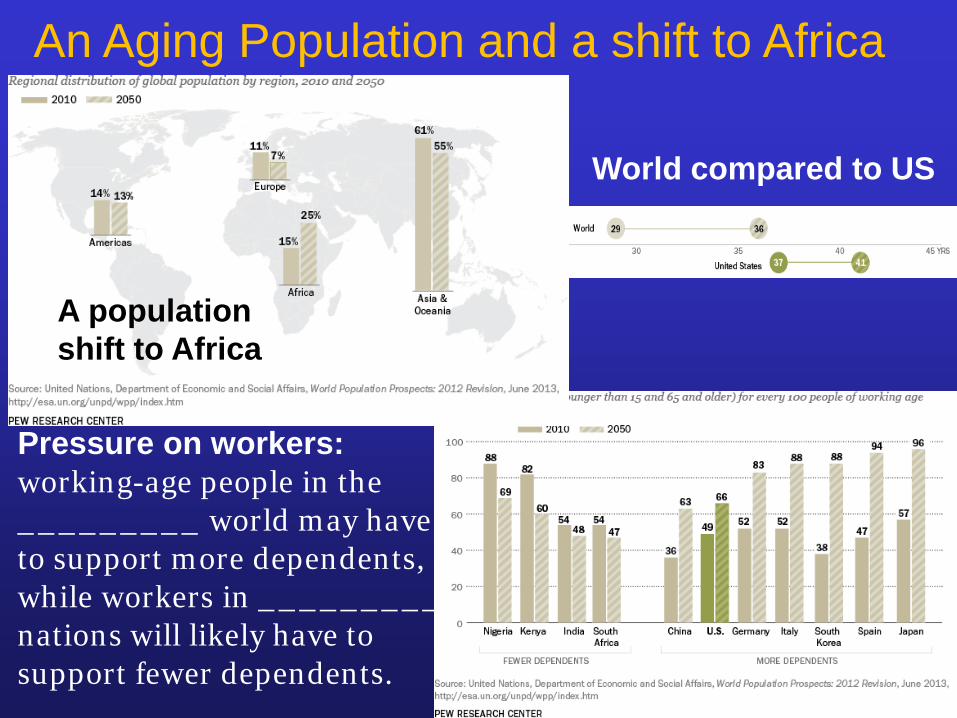
An Aging Population and a shift to Africa
World compared to US
Pressure on workers:working-age people in the _________ world may have to support more dependents, while workers in _________ nations will likely have to support fewer dependents.
A population shift to Africa
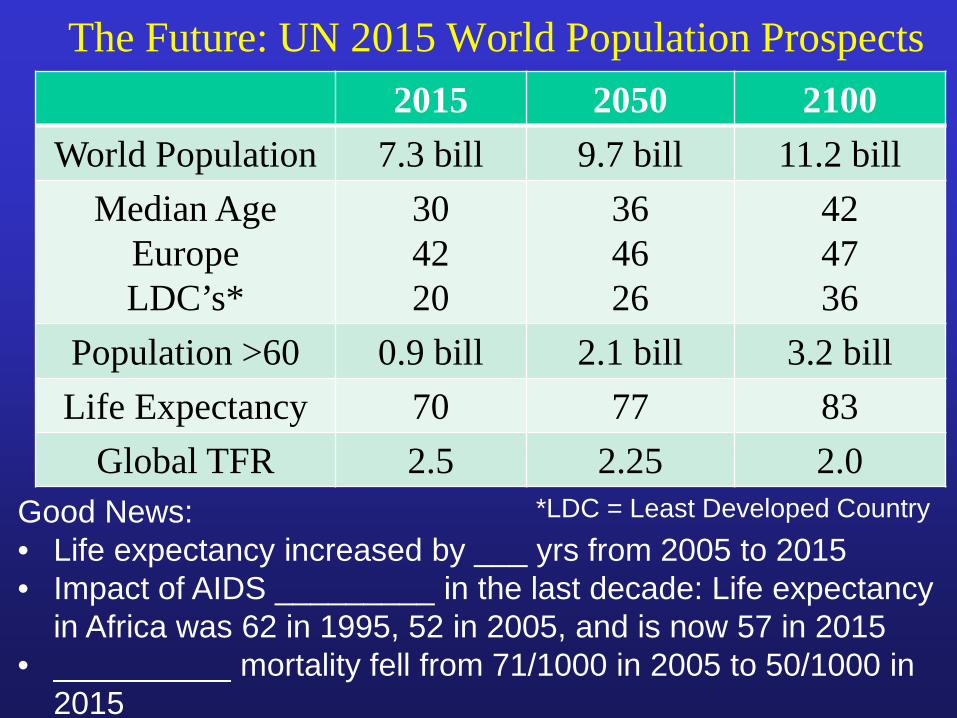
The Future: UN 2015 World Population Prospects2015 2050 2100
World Population 7.3 bill 9.7 bill 11.2 billMedian Age
EuropeLDC’s*
304220
364626
424736
Population >60 0.9 bill 2.1 bill 3.2 billLife Expectancy 70 77 83
Global TFR 2.5 2.25 2.0Good News:• Life expectancy increased by ___ yrs from 2005 to 2015• Impact of AIDS _________ in the last decade: Life expectancy
in Africa was 62 in 1995, 52 in 2005, and is now 57 in 2015• __________ mortality fell from 71/1000 in 2005 to 50/1000 in
2015
*LDC = Least Developed Country
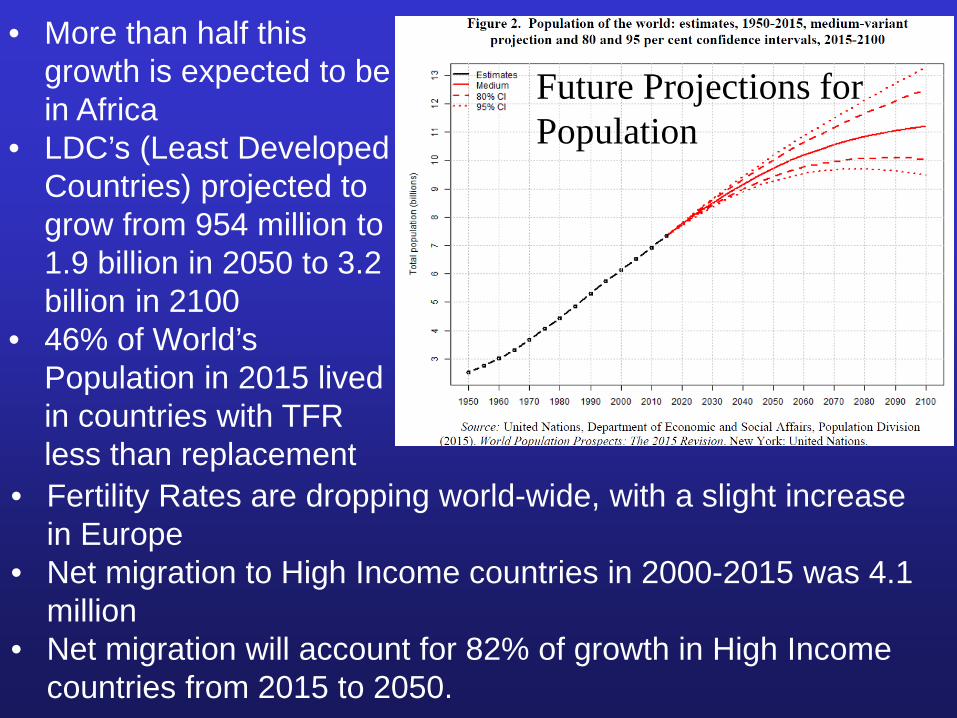
• Fertility Rates are dropping world-wide, with a slight increase in Europe
• Net migration to High Income countries in 2000-2015 was 4.1 million
• Net migration will account for 82% of growth in High Income countries from 2015 to 2050.
• More than half this growth is expected to be in Africa
• LDC’s (Least Developed Countries) projected to grow from 954 million to 1.9 billion in 2050 to 3.2 billion in 2100
• 46% of World’s Population in 2015 lived in countries with TFR less than replacement
Future Projections for Population