Embed Size (px)
Citation preview
HUMAN RESOURCE MANAGEMENT APPLICATION IN IT INDUSTRY,
THIRUVANANTHAPURAM
Dr.R.Sreedevi, Assistant Professor, Department of Commerce, Holy Cross College
(Autonomous) Nagercoil, Tamil Nadu 629002. Email:[email protected]
Dr.K.P.Sivakumar, Assistant Librarian, Noorul Islam Centre for Higher Education, Kumaracoil
Tamilnadu 629 180.Email:[email protected]
Abstract
Competitive advantage of a company can be generated from Human Resources (HR) and
company performance is influenced by set of effective HR applications. Companies today need
to be fast growing, efficient, profitable, flexible, adaptable, and future-ready and have a
dominant market position. Without these qualities, firms believe that it is virtually impossible to
be competitive in today's global economy. Under present market forces and strict competition,
the software companies are forced to be competitive. Software companies must seek ways to
become more efficient, productive, flexible and innovative under constant pressure to improve
results. HR applications help increasing in productivity and quality and to gain the competitive
advantage of a workforce strategically aligned with the organization goals and objective.
The proposed title of the article is “Human Resource Management Applications in IT
Industry,Thiruvananthapuram”. The main objective of this article is to analyze the HR activities
such as job stress and green HR practices in IT industry. This study also aims to solve the issues
of IT professionals during their work time.
Information Technology is one of the most important industries in Indian economy. The
IT industry of India has recorded a huge growth in recent years. IT contributes 8% of country‟s
economy. Even though the employment opportunities are increasing year by year, the workload
and work pressure are also increasing rapidly. Employees are, simply put, not respected and
cared for. The main objective of this article is to identify the factors causing stress to the IT
professionals and giving suitable remedial suggestions to overcome this. The primary data is
collected from the IT Professionals from different IT companies of Technopark Trivandrum. The
secondary data‟s are from books, journals and websites. For this research, 382 samples of
respondents were selected from the IT Professionals of Technopark Trivandrum, by means of
Convenient Sampling method. The researcher used chi-square test, ANOVA, and correlation for
this research.
Aut Aut Research Journal
Volume XI, Issue IV, April/2020
ISSN NO: 0005-0601
Page No:241
This article is concluded with some suggestions to the IT industry to increase
productivity and performance among the IT professionals.
INTRODUCTION
Information Technology (IT) is termed as the growth and implementation of computer-
based information system, hardware and in particular software applications. Now, it has
progressed in all the fields of computing and technology.
Today, everything and anything is being computerized across the world. Almost every
country is linked by the World Wide Web. Almost all companies, business endeavors and
government department both Central and State are linked through either intranet or internet. So
the IT sector is very important to the growth of any nation. Human resource is the key factor in
the progress of IT sector. So the dedication of IT professionals towards the job is vital for the
healthy growth of this industry.
In the modern world where the competition is hard among different production units,
human resource is believed as the most precious and challengeable asset of an organization. An
organization, may be small or large, formal or informal, is composed of heterogeneous human
resources who differ from each other in their skill, knowledge and psychology. Thus, human
resource is the finest asset of any type of the organization.
IT INDUSTRY IN INDIA
Indian Information Technology industry has a tremendous growth over the last decade.
IT industry is composed of information technology enabled services, software industry and
business process outsourcing industry. India is assessed as a forerunner in software development.
Also India leads to a desired target for IT-enabled services.
India is home to a numeral of IT monsters. Indian labor market has changed by the large
and medium players of IT industry such as Infosys, TCS, Wipro, etc. in various places. The
software industry is constantly developing in India. It is a leading destination for the IT and ITES
services worldwide. The top 20 IT companies have added over 64 percent to the combined
revenue according to a study by Dataquest Research in 2011.
Aut Aut Research Journal
Volume XI, Issue IV, April/2020
ISSN NO: 0005-0601
Page No:242
The IT industry in India was kick-started by highly talented entrepreneurs from India. But
the helpful policies of the government worked as a catalyst in shaping the future of IT industry in
India as a growth driver. The special status allotted to the industry by the government through
tax holidays and other incentives helped it in a great way to compete with vendors from
developed countries and secure huge orders.
HUMAN RESOURCE MANAGEMENT
Human Resource Management is the managing of people in organizations and their
problems related to communication, training, performance, motivation, safety, etc. In brief,
HRM is the skill of managing people at work for achieving organizations goal.
Human Resource Management today has to play a more strategic and business
partnership role. Every organization controls a portfolio of powerful tools, through which it can
influence or seek to influence employee attitude and behavior. The Human Resource
Management applications constitute an important subset of the above portfolio.
Human Resource Applications can satisfy an employee„s need to feel comfortable in the
work-relationship with the organization and can make him/her feel comfortable in the work
environment.
HUMAN RESOURCE MANAGEMENT APPLICATIONS
Human resource management applications can be explained in different aspects. HRM
applications as a plan to attract motivate and retain the employee for the endurance of business
and organization (Schuler and Jackson, 1987). Moreover, HRM applications are described as a
set of plans and policies which are described and implemented inside the organization to achieve
its goals. Likewise, (Minbaeva, 2005) stated HRM applications as a set of applications to run the
organizations human resources with certain competencies to produce organizations knowledge to
continue competitive advantage. Similarly, HRM applications are certain specific practices and
policies that are planned to attract, motivate and retain the employees of the organization for the
befit of attaining its goals.
STATEMENT OF THE PROBLEM
Information Technology is one of the dominant industries in India. This industry has
witnessed a massive growth in recent decades. Even though the employment opportunities are
increasing year by year, the workload and work pressure are also increasing rapidly. The Indian
Aut Aut Research Journal
Volume XI, Issue IV, April/2020
ISSN NO: 0005-0601
Page No:243

workforce in information technology industry has obtained the name of 'low cost' technical
workers with 'high quality' of work. This makes the industry in a growing part with good growth
rate.
The effectiveness of human resources employed depends to a larger extent how they are
inducted, developed, evaluated and maintained. Moreover the organizations growth and success
depends upon the success of its employees. Hence organization needs to formulate best strategies
for its human resources and facilitate in achievement of organizational objectives. The present
title focuses on various HRM applications in terms of job stress and green HR in IT industry.
SCOPE OF THE STUDY
Information Technology is the most significant industry in India. The growth of IT
industry is noted in the recent decades. The growth of IT industry can be revealed by its
contribution to the country by means of GDP (Gross Domestic Product), employment
opportunities, exports and revenues. Hence the study focused Thiruvananthapuram IT Industry in
Kerala. Since Kerala is one of the positive locations for IT industries to flourish with all sort of
resources.
An organization can reach its maximum potential, if each employee develops and achieve
goals that support personal and organizational success. Even though the employment
opportunities are increasing year by year, the workload and work pressure are also increasing
rapidly. This leads to strain which is called as occupational stress. This article analyzed various
factors of job stress in the workplace of IT professionals.
Human resource management not only helps the organization but also helps the progress
of a nation. With the help of devoted and efficient manpower potential only a nations resources
can managed and used. The growth of a country depends upon the skills and attitudes of its
human resources. In order to analyze the healthy working environment in terms of environmental
policies and practices, this article covered the various green HR practices available and followed
in the industry.
OBJECTIVES OF THE STUDY
The objectives of the present study are specified as follows.
To analyse socio economic profile of the IT Professionals selected from
Thiruvananthapuram.
Aut Aut Research Journal
Volume XI, Issue IV, April/2020
ISSN NO: 0005-0601
Page No:244

To analyze job stress in workplace of IT professionals in Thiruvananthapuram.
To analyze the green HR practices in IT industry Thiruvananthapuram.
HYPOTHESES
Based on the above objectives the following hypotheses have been framed and tested.
H10: There is no association between job stress and demographic factors of the IT Professionals.
H20: There is no association between green HR policies and level of employment of the IT
Professionals.
RESERCH METHODOLOGY
Research Design
Both primary and secondary data were gathered from internal and external sources. The
primary data were collected through structured questionnaire. The respondents for this study
were selected through multistage sampling method. The researcher adapted descriptive study to
solve the research problem.
Sampling Procedure
This study is about the Human resource management applications prevailing in the
Information Technology industry in Thiruvananthapuram.. The respondents are the IT
professionals working in Thiruvananthapuram IT industry. The researcher adapted descriptive
study to solve the research problem. Both primary and secondary data were gathered from
internal and external sources. The primary data were collected through structured questionnaire.
Since the population size of IT Professionals in Thiruvananthapuram is quite big (46,000), the
researcher used convenient sampling for the study. Sample size for the study is 382. The required
samples are selected randomly from the IT firms.
Sources of Data Collection
This study is based on both primary and secondary data. To get an authentic data the
researcher collected the primary data by means of a questionnaire. To collect primary data a
structured questionnaire has been used. Primary data is collected from top level, middle level and
low level employees. For getting different views from other researchers and authors secondary
data also gathered for the study.
Tools Used for Analysis
The various data are analysed with the help of SPSS 20.0 Descriptive and inferential
statistical tools were used to obtain different measures. The researcher used Statistical tests like
Aut Aut Research Journal
Volume XI, Issue IV, April/2020
ISSN NO: 0005-0601
Page No:245
Chi-Square test, ANOVA, and Correlation for the analysis of collected data. These tools are
identified by the researcher to get optimum results for the proposed hypothesis.
LIMITATIONS OF THE STUDY
This study is limited to the IT companies in Technopark, Thiruvananthapuram .Each
study has its own limitations which are beyond the control of the researcher. The researcher
collected 382 samples for the study. Most of the employees are very reluctant to give
information. Some of the employees are reluctant to cooperate, because of their busy schedule.
The conclusion of the study is purely based on sample opinion of the IT Professional. Therefore
the inference from the study may not be generalized.
REVIEW OF LITERATURE
Oladinrinet al., (2014) analysed the sources of stress and the impact of stress on
productivity among the construction professionals. Also this study examined the effective ways
of managing stress among these professionals. Descriptive statistical analysis is used in this
study. This study concluded that staff shortage and conflicting roles are the main reasons for job
stress. Stress can be avoided by dividing work and correct planning in sharing the task. From the
study, it is also concluded that stress has a greater impact on productivity of professionals.
Arulrajah et.al., (2015) studied the different practices of green HR practices based on the
existent literature. It reveals that much of the past research focused on a few functions of HRM
such as recruitment, training and development, performance evaluation and reward management
in integrating environmental management with HRM though HRM has more potential and scope
in improving organisation‟s environmental performance. Hence, this review incorporates diverse
functions of HRM to explore the respective green HRM practices under those functions. The
findings of the review have identified and highlighted several green HRM practices under the
human resource management functions. The HRM functions are classified into 12 functions.
They are planning, job design, recruitments, selection, job design, training, performance
evaluation, motivation, discipline, and health and safety management and employee relations.
The contribution of this paper lies in extending the scope and depth of green HRM in
materializing sustainable environmental performance of organisations.
Kennedy and Anne (2015) examined the role of employee outcome have any influence
over the human resource management practices and performance of employees. This study
carried out in a developing country context. Data were collected from the employees of
Aut Aut Research Journal
Volume XI, Issue IV, April/2020
ISSN NO: 0005-0601
Page No:246

government organizations with the help of structured questionnaire. To analyze the collected
data, multiple regression analysis was used. The results shows that HRM practices have a
significant influence on organizational performance. Regression analysis indicates that the
employee outcome mediates the influence of HRM practices and performance of employees.
ANALYSIS AND INTERPRETATION OF DATA
This is the most significant part of the study. It deals with the appropriate analysis and the
interpretation of the data pertaining to the study with appropriate statistical tools and techniques.
All the findings and conclusion of the study depend upon the analysis of data.
SOCIO ECONOMIC PROFILE OF IT PROFESSIONALS
This section gives the socio economic profile of the IT Professionals selected from
Thiruvananthapuram. This section comprises of the IT Professionals age, gender, marital status,
designation, educational qualifications, experiences and annual income.
Table.1 showing the classification of Gender, Age and Marital Status of IT Professionals in
Kerala
Description No. of Respondents Percentage
Gender Male 205 53.7
Female 177 46.3
Age
Below 25 years 157 41.1
25-30 years 138 36.1
30-35 years 68 17.8
35-40 years 13 3.4
Above 40 years 6 1.6
Marital Status Married 174 45.5
Unmarried 208 54.5
Source: Primary Data
Table 1 exhibits that out of 382 respondents, 205 respondents are male which constitutes 53.7
per cent of the respondents, whereas, 177 respondents are female constituting 46.3 per cent of the
respondents. It is observed that male employees are found to be flexible in working in the IT
industry than the female, who need to address the night shifts and family care. Therefore, it is
Aut Aut Research Journal
Volume XI, Issue IV, April/2020
ISSN NO: 0005-0601
Page No:247

found that male category is the bread winner of IT industry job than the female, who are highly
motivated and suitable to working conditions in the IT industry.
Table 1 reveals that 54.5 per cent of the IT professionals were unmarried and 45.5 per cent of the
IT professionals were married. It is inferred from the above table that most of the IT
professionals (54.5 per cent) were unmarried. Therefore, it could be interpreted that IT industry
nature of the job is very apt to the unmarried who are away from family.
The above Table 1 illustrates that 157 IT professionals are in the age group of below 25 years
constituting 41.1 per cent of the respondents, 36.1 per cent of the respondents belong to the age
group of 25 to 30 years, 17.8 per cent of the respondents belong to the age group of 30 to 35
years, 3.4 per cent of the respondents are in the age group of 35 to 40 years and only 1.6 per cent
of the respondents are in the age group of above 40 years. It is clear that 41.1 per cent of the
respondents lie in the age group of below 25 years which is the highest and 1.6 per cent of the
respondents lie in the age group of above 40 years which is the lowest of all. Thus it is inferred
that the IT industry catch the attention of IT professionals in the age group of below 25 years.
There is the lowest percentage of the respondents who continue to be the employees of the IT
industry who are in the age group of above 40 years. It is further inferred that, IT jobs are
peculiarly suitable to youngsters who are below 25 years.
Table 2: Table showing the Classification of Education, Designation, Experience and Annual
Income of IT Professionals in Thiruvananthapuram
Description No. of Respondents Percentage
Education
BCA/Bsc/B.Tech/BE 243 63.6
ME/M.Tech 21 5.5
MBA 33 8.6
MCA 79 20.7
Ph.D 6 1.6
Experience
One Year 87 22.8
1 to 3 Years 132 34.6
3 to 5 Years 59 15.4
5 to 10 Years 76 19.9
Above 10 Years 28 7.3
Aut Aut Research Journal
Volume XI, Issue IV, April/2020
ISSN NO: 0005-0601
Page No:248
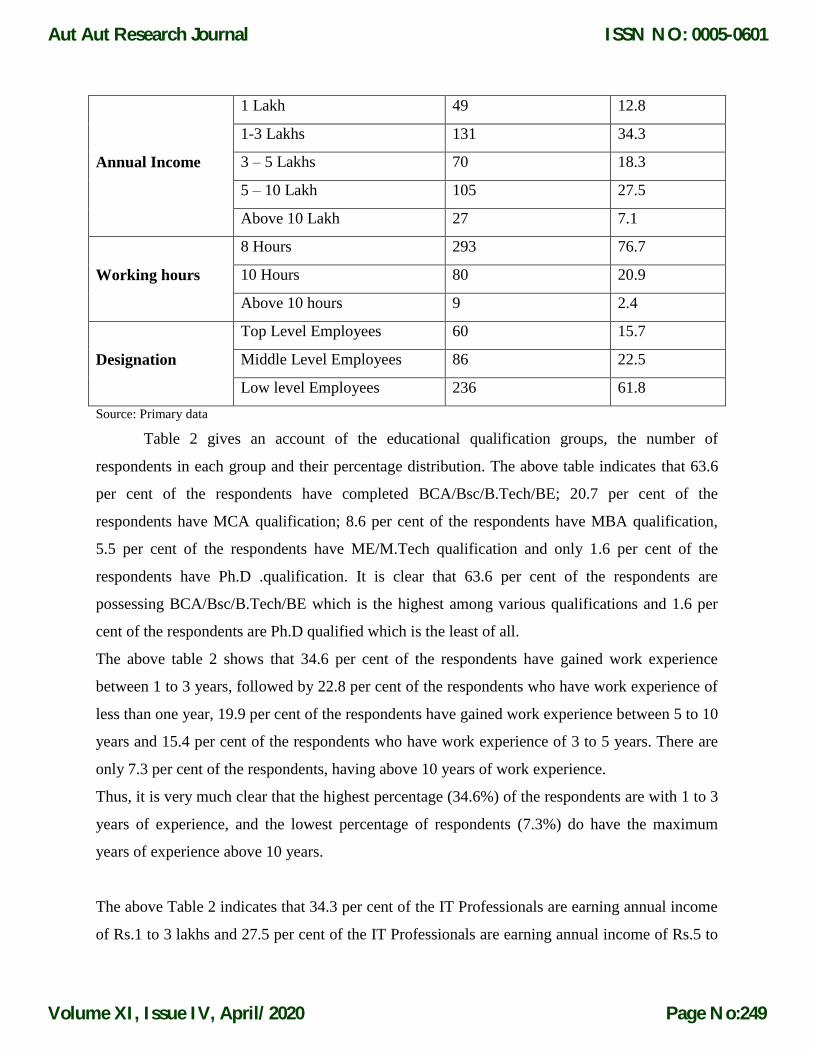
Annual Income
1 Lakh 49 12.8
1-3 Lakhs 131 34.3
3 – 5 Lakhs 70 18.3
5 – 10 Lakh 105 27.5
Above 10 Lakh 27 7.1
Working hours
8 Hours 293 76.7
10 Hours 80 20.9
Above 10 hours 9 2.4
Designation
Top Level Employees 60 15.7
Middle Level Employees 86 22.5
Low level Employees 236 61.8
Source: Primary data
Table 2 gives an account of the educational qualification groups, the number of
respondents in each group and their percentage distribution. The above table indicates that 63.6
per cent of the respondents have completed BCA/Bsc/B.Tech/BE; 20.7 per cent of the
respondents have MCA qualification; 8.6 per cent of the respondents have MBA qualification,
5.5 per cent of the respondents have ME/M.Tech qualification and only 1.6 per cent of the
respondents have Ph.D .qualification. It is clear that 63.6 per cent of the respondents are
possessing BCA/Bsc/B.Tech/BE which is the highest among various qualifications and 1.6 per
cent of the respondents are Ph.D qualified which is the least of all.
The above table 2 shows that 34.6 per cent of the respondents have gained work experience
between 1 to 3 years, followed by 22.8 per cent of the respondents who have work experience of
less than one year, 19.9 per cent of the respondents have gained work experience between 5 to 10
years and 15.4 per cent of the respondents who have work experience of 3 to 5 years. There are
only 7.3 per cent of the respondents, having above 10 years of work experience.
Thus, it is very much clear that the highest percentage (34.6%) of the respondents are with 1 to 3
years of experience, and the lowest percentage of respondents (7.3%) do have the maximum
years of experience above 10 years.
The above Table 2 indicates that 34.3 per cent of the IT Professionals are earning annual income
of Rs.1 to 3 lakhs and 27.5 per cent of the IT Professionals are earning annual income of Rs.5 to
Aut Aut Research Journal
Volume XI, Issue IV, April/2020
ISSN NO: 0005-0601
Page No:249

10 lakhs. There is 18.3 per cent of the IT Professionals are earning annual income of Rs.3 to 5
lakhs, 12.8 per cent of the IT Professionals are earning annual income of Rs.1 lakh and only 7.1
per cent of the respondents are earning above Rs.10 lakhs. It is obvious that very lowest (7.1%)
of the respondents are earning annual income above Rs.10 lakhs. The highest (34.3%) of the
respondents are earning annual income of Rs.1 to 3 lakhs.
Table 2 clearly shows that majority of 76.7 per cent of the employees are working 8 hours, about
20.9 per cent of the employees are working 10 hours and only 2.4 per cent of the employees are
working above 10 hours.
Table 2 shows that majority of 61.8 per cent of the employees are low level employees, 22.5 per
cent of the employees are middle level employees and the remaining 15.7 per cent of the
employees are top level employees in IT industry.
INFERENTIAL ANALYSIS ON SAMPLE
Inferential statistics is applied to interpret the collected data by using probability theory
and other mathematical tools.
Factors of Job Stress among Different Gender Group of IT Professionals
In order to test whether there is any relationship between gender of the employees and
factors of job stress; „Chi-square‟ test is used. The hypothesis is,
Ho: There is no significant difference in factors of job stress among different gender group of IT
professionals.
The results of the Chi-square test applied for the gender group of employees on the job
stress is presented in Table.
Table 3: Table Showing the Chi-Square Test for Factors of Job Stress among Different Gender
Group of IT Professionals
Factors Chi-Square Value p Value Inference
Uneven Work Target 103.836 0.000 Significant
Lack of Stimulus and drive 19.972 0.173 Not significant
Weak Environment 52.088 0.000 Significant
Lack of Opportunity for Self
Development 102.940 0.000 Significant
Source: Calculated Primary Data
Aut Aut Research Journal
Volume XI, Issue IV, April/2020
ISSN NO: 0005-0601
Page No:250

From the above table, in case of the gender of the employees and the factors of job stress
“Uneven work target, Weak environment and Lack of opportunity for self development.” the null
hypothesis is rejected at 5 percentage level of significance since the „p‟ value is less than 0.05.
Hence it is concluded that there is a significant relationship between gender of the employees
and factors of job stress that “Uneven work target, Weak environment and Lack of opportunity
for self development”.
Factors of Job Stress among different Age Group of IT Professionals
In order to check whether there is any relationship between age group of the employees
and factors of job stress; „ANOVA‟ test is used with the following hypothesis as,
Ho: There is no significant difference in factors of job stress among different age group of IT
industry employees in.
The resulted mean score among different age group of IT professionals on the factors of job
stress and the respective „F‟ statistics are presented in Table.
Table 4 showing the ANOVA for Significant Difference between age group of IT professionals
With Respect to the Job stress factors
Factors Age Sum of
Squares df
Mean
Square F
p
Value
Uneven Work
Target
Between Groups 343.185 4 85.796
2.968 0.020* Within Groups 10896.553 377 28.903
Total 11239.738 381 -
Lack of
Stimulus and
Drive
Between Groups 135.890 4 33.973
2.812 0.025* Within Groups 4482.043 371 12.081
Total 4617.934 381 -
Weak
Environment
Between Groups 200.286 4 50.071
2.630 0.034* Within Groups 7178.461 377 19.041
Total 7378.746 381
Lack of
Opportunity
Between Groups 370.523 4 92.631 1.594 0.175
Within Groups 21909.469 377 58.115
Aut Aut Research Journal
Volume XI, Issue IV, April/2020
ISSN NO: 0005-0601
Page No:251

for Self
Development. Total 22279.992 381 -
Note: *Denotes Significance 5% Level
Source: Calculated Primary Data
Table shows that a significant difference among the different age group of employees
were identified regarding the different factors of job stress are time pressure factor, lack of
recognition factor and lack of infrastructural facility factor since the respective “F” statistics was
significant at 5 per cent level with „p‟ value is less than 0.05. It reveals that there is a significant
relationship between age of the employees and factors of job stress that “uneven work target,
Lack of stimulus and drive and Weak environment”.
Factors of Job Stress among Different Education of IT Professionals
In order to analysis whether there is any relationship between education of the employees and
factors of job stress, „ANOVA‟ test is used. The following hypothesis is,
Ho: There is no significant difference in factors of job stress among different education of IT
industry employees in.
The resulted mean score among different education of employees on the factors of job stress and
the respective „F‟ statistics are presented in Table.
Table: 5 Table Showing the ANOVA for Significant Difference between Educational
qualifications of IT Professionals with Respect to the Job Stress factors
Factors Educational
Qualification
Sum of
Squares df
Mean
Square F p Value
Uneven Work
Target
Between Groups 235.064 4 58.766
2.013 .092* Within Groups 11004.674 377 29.190
Total 11239.738 381 -
Lack of Stimulus
and Drive
Between Groups 103.356 4 25.839
2.123 .077* Within Groups 4514.578 377 12.169
Total 4617.934 381 -
Weak
Environment
Between Groups 206.963 4 51.741
2.720 0.029 Within Groups 7171.784 377 19.023
Total 7378.746 381 -
Lack of
Opportunity for
Between Groups 466.251 4 116.563 2.015 0.092*
Within Groups 21813.741 377 57.861
Aut Aut Research Journal
Volume XI, Issue IV, April/2020
ISSN NO: 0005-0601
Page No:252

Self
Development Total 22279.992 381 -
*Denotes 5% Level of Significance
Source: Calculated Primary Data
Table shows that a significant difference among the different education of employees were
identified regarding the different factors of job stress on weak environment since the respective
“F” statistics was significant at 5 per cent level. The „p‟ value is less than 0.05. It shows that
there is a significant relationship between education of the employees and factors of job stress
that “weak environment”.
Factors of Job Stress among Different Experience of IT Professionals
In order to examine whether there is any relationship between experience of the
employees and factors of job stress, „ANOVA‟ test is used.
Ho: There is no significant difference in factors of job stress among different experience of IT
industry employees in.
The resulted mean score among different experience of employees on the factors of job stress
and the respective „F‟ statistics are presented in Table.
Table 6: Table Showing the ANOVA for Significant Difference between Experiences of IT
Professionals with Respect to the Job Stress Factors
Factors Experience Sum of
Squares df
Mean
Square F p Value
Uneven Work
Target
Between Groups 141.646 4 35.411
1.203 0.309** Within Groups 11098.093 377 29.438
Total 11239.738 381 -
Lack of Stimulus
and Drive
Between Groups 84.479 4 21.120
1.728 0.143** Within Groups 4533.454 371 12.220
Total 4617.934 375 -
Weak
Environment
Between Groups 77.657 4 19.414
1.002 0.406** Within Groups 7301.089 377 19.366
Total 7378.746 381 -
Lack of
Opportunity for
Self
Between Groups 170.306 4 42.576
0.726 0.575** Within Groups 22109.687 377 58.646
Total 22279.992 381 -
Aut Aut Research Journal
Volume XI, Issue IV, April/2020
ISSN NO: 0005-0601
Page No:253

Development
Source: Calculated Primary Data
Table shows that no significant difference among the different experience of employees
were identified regarding the different factors of job stress uneven work target, lack of stimulus
and drive, weak environment and Lack of opportunity for self development since the respective
“F” statistics were not significant at 5 per cent level. Since the „p‟ value is higher than 0.05. It is
finalized that there is no significant relationship between experience of the employees and
factors of job stress that “uneven work target, lack of stimulus and drive, weak environment and
Lack of opportunity for self development”.
Factors of Job Stress among Different Annual Income of IT Professionals
In order to investigate whether there is any relationship between annual income of the
employees and factors of job stress; „ANOVA‟ test with the following hypothesis is used.
Ho: There is no significant difference in factors of job stress among different annual income of IT
industry employees in.
The resulted mean score among different annual income of employees on the factors of job stress
and the respective „F‟ statistics are presented in Table 7
Table 7: Table Showing the ANOVA for Significant Difference between Annual Incomes of IT
Professionals with Respect to the Job Stress Factors
Factors Annual income Sum of
Squares df
Mean
Square F p Value
Uneven Work
Target
Between Groups 833.256 4 208.314
7.547 .000**** Within Groups 10406.482 377 27.603
Total 11239.738 381
Lack of
Stimulus and
Drive
Between Groups 340.544 4 85.136
7.384 .000**** Within Groups 4277.390 377 11.529
Total 4617.934 381
Weak
Environment
Between Groups 701.131 4 175.283
9.896 .000**** Within Groups 6677.615 377 17.713
Total 7378.746 381
Lack of
Opportunity for
Self
Between Groups 1293.256 4 323.314
5.808 .000**** Within Groups 20986.736 377 55.668
Total 22279.992 381
Aut Aut Research Journal
Volume XI, Issue IV, April/2020
ISSN NO: 0005-0601
Page No:254
Development
Source: Calculated Primary Data
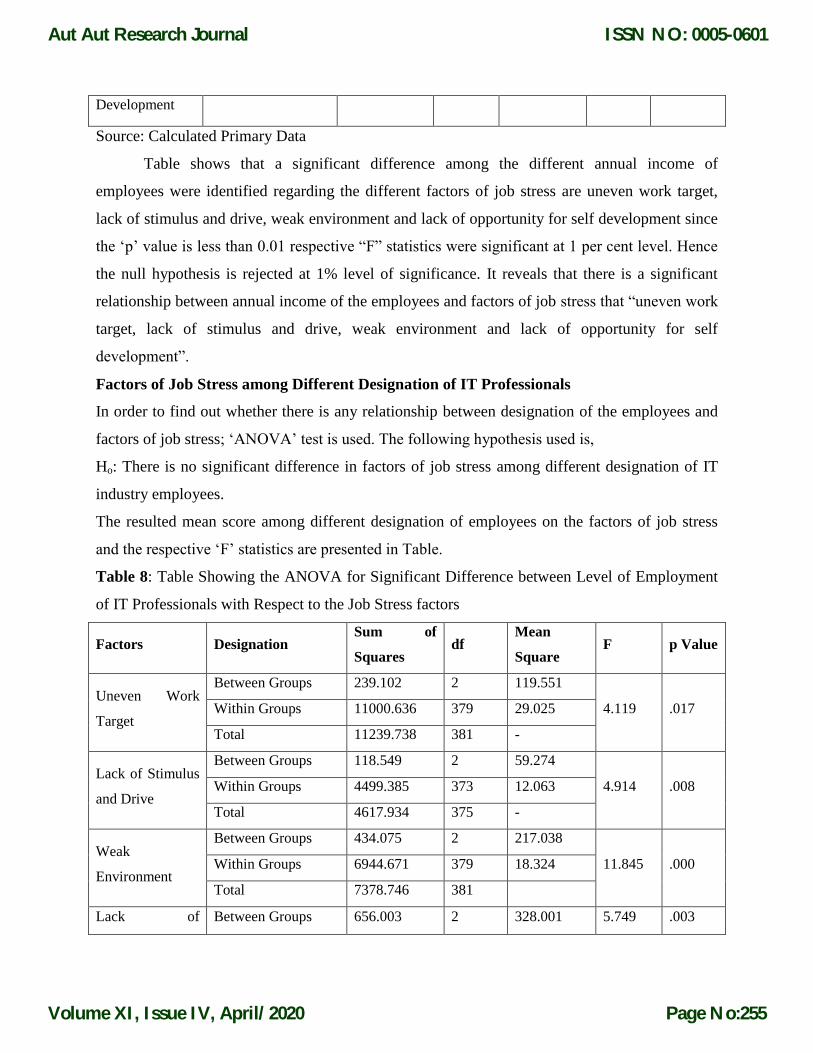
Table shows that a significant difference among the different annual income of
employees were identified regarding the different factors of job stress are uneven work target,
lack of stimulus and drive, weak environment and lack of opportunity for self development since
the „p‟ value is less than 0.01 respective “F” statistics were significant at 1 per cent level. Hence
the null hypothesis is rejected at 1% level of significance. It reveals that there is a significant
relationship between annual income of the employees and factors of job stress that “uneven work
target, lack of stimulus and drive, weak environment and lack of opportunity for self
development”.
Factors of Job Stress among Different Designation of IT Professionals
In order to find out whether there is any relationship between designation of the employees and
factors of job stress; „ANOVA‟ test is used. The following hypothesis used is,
Ho: There is no significant difference in factors of job stress among different designation of IT
industry employees.
The resulted mean score among different designation of employees on the factors of job stress
and the respective „F‟ statistics are presented in Table.
Table 8: Table Showing the ANOVA for Significant Difference between Level of Employment
of IT Professionals with Respect to the Job Stress factors
Factors Designation Sum of
Squares df
Mean
Square F p Value
Uneven Work
Target
Between Groups 239.102 2 119.551
4.119 .017 Within Groups 11000.636 379 29.025
Total 11239.738 381 -
Lack of Stimulus
and Drive
Between Groups 118.549 2 59.274
4.914 .008 Within Groups 4499.385 373 12.063
Total 4617.934 375 -
Weak
Environment
Between Groups 434.075 2 217.038
11.845 .000 Within Groups 6944.671 379 18.324
Total 7378.746 381
Lack of Between Groups 656.003 2 328.001 5.749 .003
Aut Aut Research Journal
Volume XI, Issue IV, April/2020
ISSN NO: 0005-0601
Page No:255

Opportunity for
Self
Development
Within Groups 21623.989 379 57.055
Total 22279.992 381 -
Source: Calculated Primary Data
Table shows that a significant difference among the different designation of employees
were identified regarding the different factors of job stress are uneven work target, lack of
stimulus and drive, weak environment and Lack of opportunity for self development since the
respective “F” statistics were significant at 5 per cent level. Hence the „p‟ value is less than 0.05.
It shows a significant relationship between level of employment of the employees and factors of
job stress that “uneven work target, lack of stimulus and drive, weak environment and Lack of
opportunity for self development”.
Green HR Practices
There is a need for environmental management across the world. Adoption of
environment friendly policies in organization has got its name as green HRM. This section deals
with the factor analysis of various green HR practices prevailing in the IT industry. And these
limited factors are then analyzed with the demographic factors of IT professionals. Also the
awareness of green HR practices among different level of employment was examined with the
help of Chi-square test.
Awareness of Green HR Practices and Level of Employment of IT Professionals
In order to validate the relationship between designation of the employees and green hr
campaign programmes for employees to provide awareness about green hr issues, the following
hypothesis were formulated.
Ho: There is no significant relationship between green HR practices among different level of
employment of IT professionals in.
The results of the Chi-Square test applied for the organization is conducting green hr
campaign programmes for employees to provide awareness about green hr issues among
different designation of the employees are presented in table.
Table 9: Table Showing the Chi-Square Test for Association between Level of Employment and
awareness about the Green HR Practices in IT Industry, Kerala
Level of
employment
Awareness about the Green HR
Practices in IT Industry Total
Chi Square
Value P Value
Aut Aut Research Journal
Volume XI, Issue IV, April/2020
ISSN NO: 0005-0601
Page No:256
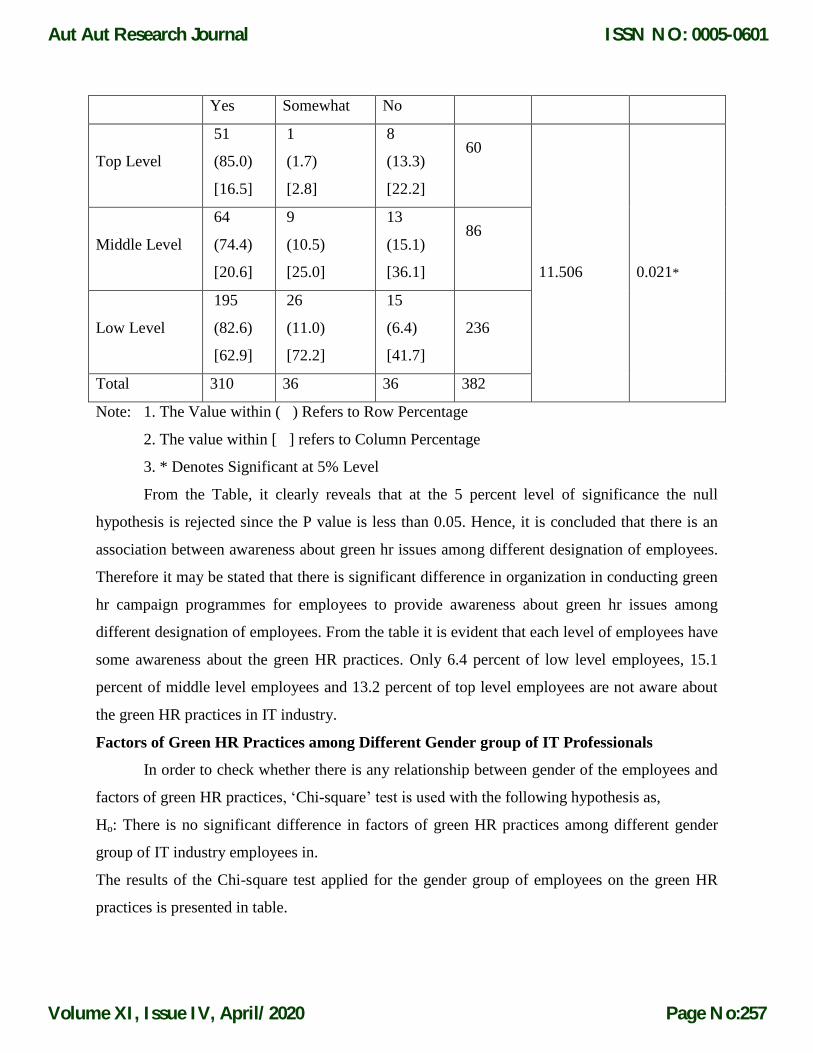
Yes Somewhat No
Top Level
51
(85.0)
[16.5]
1
(1.7)
[2.8]
8
(13.3)
[22.2]
60
Middle Level
64
(74.4)
[20.6]
9
(10.5)
[25.0]
13
(15.1)
[36.1]
86
11.506
0.021*
Low Level
195
(82.6)
[62.9]
26
(11.0)
[72.2]
15
(6.4)
[41.7]
236
Total 310 36 36 382
Note: 1. The Value within ( ) Refers to Row Percentage
2. The value within [ ] refers to Column Percentage
3. * Denotes Significant at 5% Level
From the Table, it clearly reveals that at the 5 percent level of significance the null
hypothesis is rejected since the P value is less than 0.05. Hence, it is concluded that there is an
association between awareness about green hr issues among different designation of employees.
Therefore it may be stated that there is significant difference in organization in conducting green
hr campaign programmes for employees to provide awareness about green hr issues among
different designation of employees. From the table it is evident that each level of employees have
some awareness about the green HR practices. Only 6.4 percent of low level employees, 15.1
percent of middle level employees and 13.2 percent of top level employees are not aware about
the green HR practices in IT industry.
Factors of Green HR Practices among Different Gender group of IT Professionals
In order to check whether there is any relationship between gender of the employees and
factors of green HR practices, „Chi-square‟ test is used with the following hypothesis as,
Ho: There is no significant difference in factors of green HR practices among different gender
group of IT industry employees in.
The results of the Chi-square test applied for the gender group of employees on the green HR
practices is presented in table.
Aut Aut Research Journal
Volume XI, Issue IV, April/2020
ISSN NO: 0005-0601
Page No:257

Table 10: Table Showing the Chi-Square Test for Association between Gender and Factors of
Green HR Practices in IT Industry, Kerala
Factors Chi-Square Value p Value Inference
Effective Recognition and Support 107.475 0.000 Significant
Environmental Responsibility 86.459 0.000 Significant
E-technology Efforts 38.925 0.001 Significant
Encouraging Energy Resources 83.241 0.000 Significant
Source: Calculated Primary Data
The above table gives the following results. Since the „p‟ value is less than 0.05 in case of
the gender of the employees and the factors of green HR practices “Effective Recognition and
support factor, Environmental responsibility factor, e-technology factor and Encouraging energy
resources factor”, the null hypothesis is rejected and it is viewed that there is a significant
relationship between gender of the employees and factors of green HR practices that “Effective
Recognition and support factor, Environmental responsibility factor, E-technology factor and
Encouraging energy resources factor”.
Factors of Green HR Practices among Different age Group of IT Industry Employees
In order to test whether there is any relationship between age group of the employees and
factors of green HR practices, „ANOVA‟ test is attempted with the following hypothesis as,
Ho: There is no significant difference in factors of green HR practices among different age group
of IT industry employees in.
The resulted mean score among different age group of employees on the factors of green HR
practices and the respective „F‟ statistics are presented in Table.
Table 11: Table Showing the ANOVA for Significant Difference between Age Group of IT
Professionals with Respect to the Green HR Practices
Factors Age Sum of
Squares df
Mean
Square F p Value
Effective
Recognition and
Support Factor
Between Groups 1107.358 4 276.840
4.420 0.002**** Within Groups 23610.600 377 62.628
Total 24717.958 381 -
Environmental Between Groups 876.758 4 219.190 5.165 0.000****
Aut Aut Research Journal
Volume XI, Issue IV, April/2020
ISSN NO: 0005-0601
Page No:258

Responsibility
Factor
Within Groups 16000.208 377 42.441
Total 16876.966 381 -
e-Technology
Efforts Factor
Between Groups 95.104 4 23.776
1.597 0.175** Within Groups 5614.134 377 14.892
Total 5709.238 381 -
Encouraging
Energy
Resources Factor
Between Groups 738.594 4 184.649
5.055 0.001**** Within Groups 13771.639 377 36.530
Total 14510.233 381 -
Source: Calculated Primary Data
Table shows that a significant difference among the different age group of employees
were identified regarding the different factors of green HR practices are effective recognition and
support factor, environmental responsibility factor and encouraging energy resources factor since
the respective “F” statistics was significant at 5 per cent level and the „p‟ value is less than 0.05.
It shows a significant relationship between age of the employees and factors of green HR
practices that “effective recognition and support factor, environmental responsibility factor and
encouraging energy resources factor”.
Factors of Green HR Practices among Different Education of IT Industry Employees
In order to examine whether there is any relationship between education of the employees
and factors of green HR practices, „ANOVA‟ test is attempted with the following hypothesis as,
Ho: There is no significant difference in factors of green HR practices among different education
of IT industry employees.
The resulted mean score among different education of employees on the factors of green HR
practices and the respective „F‟ statistics are presented in Table.
Table 12: Table showing the ANOVA for Significant Difference between Education of IT
professionals with Respect to the Green HR Practices
Factors Education Sum of
Squares df
Mean
Square F
p
Value
Effective
Recognition and
Support Factor
Between Groups 1304.979 4 326.245
5.253 0.000 Within Groups 23412.979 377 62.103
Total 24717.958 381 -
Aut Aut Research Journal
Volume XI, Issue IV, April/2020
ISSN NO: 0005-0601
Page No:259
Environmental
Responsibility
Factor
Between Groups 1109.050 4 277.262
6.629 0.000 Within Groups 15767.916 377 41.825
Total 16876.966 381 -
E-technology
Efforts Factor
Between Groups 291.550 4 72.887
5.072 0.001 Within Groups 5417.689 377 14.371
Total 5709.238 381 -
Encouraging
Energy
Resources Factor
Between Groups 555.951 4 138.988
3.755 0.005 Within Groups 13954.282 377 37.014
Total 14510.233 381 -
Source: Calculated Primary Data
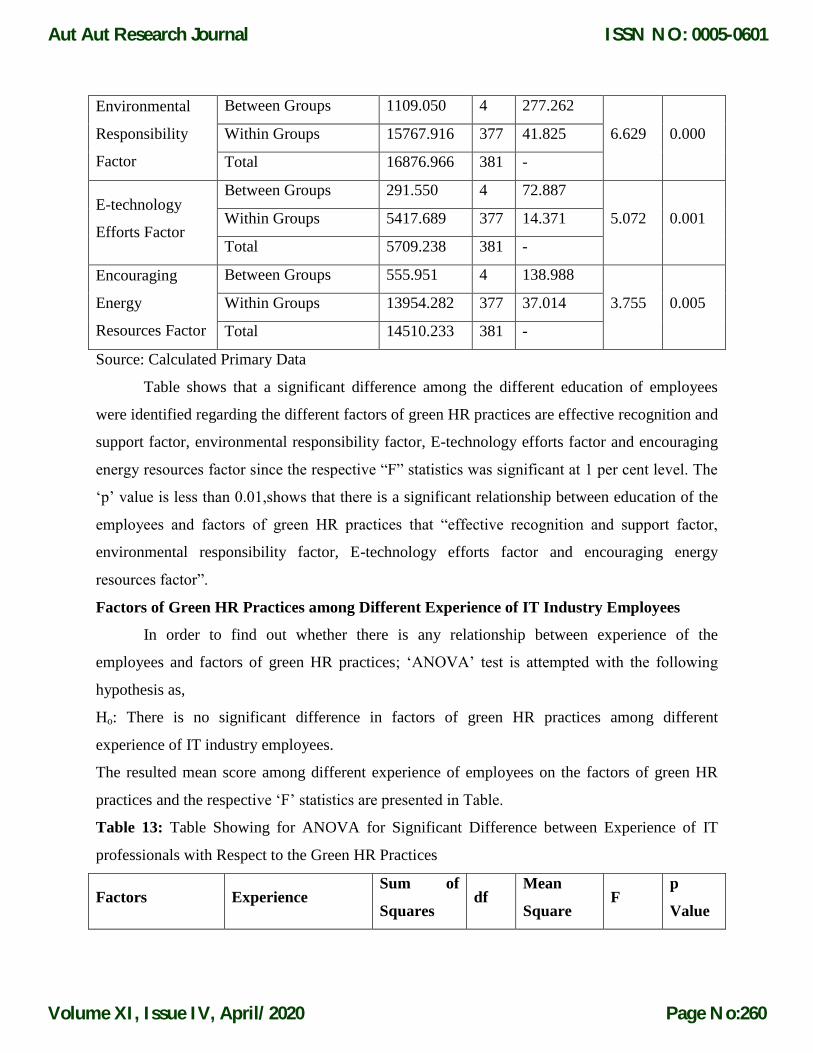
Table shows that a significant difference among the different education of employees
were identified regarding the different factors of green HR practices are effective recognition and
support factor, environmental responsibility factor, E-technology efforts factor and encouraging
energy resources factor since the respective “F” statistics was significant at 1 per cent level. The
„p‟ value is less than 0.01,shows that there is a significant relationship between education of the
employees and factors of green HR practices that “effective recognition and support factor,
environmental responsibility factor, E-technology efforts factor and encouraging energy
resources factor”.
Factors of Green HR Practices among Different Experience of IT Industry Employees
In order to find out whether there is any relationship between experience of the
employees and factors of green HR practices; „ANOVA‟ test is attempted with the following
hypothesis as,
Ho: There is no significant difference in factors of green HR practices among different
experience of IT industry employees.
The resulted mean score among different experience of employees on the factors of green HR
practices and the respective „F‟ statistics are presented in Table.
Table 13: Table Showing for ANOVA for Significant Difference between Experience of IT
professionals with Respect to the Green HR Practices
Factors Experience Sum of
Squares df
Mean
Square F
p
Value
Aut Aut Research Journal
Volume XI, Issue IV, April/2020
ISSN NO: 0005-0601
Page No:260

Effective
Recognition and
support Factor
Between Groups 1374.197 4 343.549
5.548 0.000 Within Groups 23343.761 377 61.920
Total 24717.958 381 -
Environmental
Responsibility
factor
Between Groups 668.001 4 167.000
3.884 0.004 Within Groups 16208.965 377 42.995
Total 16876.966 381 -
e-Technology
Efforts Factor
Between Groups 94.866 4 23.716
1.593 0.176 Within Groups 5614.373 377 14.892
Total 5709.238 381 -
Encouraging
Energy Resources
Factor
Between Groups 428.607 4 107.152
2.869 0.023 Within Groups 14081.626 377 37.352
Total 14510.233 381 -
Source: Calculated Primary Data
From the above Table, it is clear that the „p‟ value is less than 0.05. This shows that a
significant difference among the different experience of employees were identified regarding the
different factors of green HR practices are effective recognition and support factor,
environmental responsibility factor and encouraging energy resources factor since the respective
“F” statistics was significant at 5 per cent level and It is finalized that there is a significant
relationship between experience of the employees and factors of green HR practices that “are
effective recognition and support factor, environmental responsibility factor and encouraging
energy resources factor”.
Factors of Green HR Practices among Different Annual Income of IT Industry Employees
In order to validate whether there is any relationship between annual income of the
employees and factors of green HR practices, „ANOVA‟ test is used with the following
hypothesis as,
Ho: There is no significant difference in factors of green HR practices among different annual
income of IT industry employees in.
The resulted mean score among different annual income of employees on the factors of green
HR practices and the respective „F‟ statistics are presented in Table.
Table 14: Table showing for ANOVA for Significant Difference between Annual Income of IT
professionals with Respect to the Green HR Practices
Aut Aut Research Journal
Volume XI, Issue IV, April/2020
ISSN NO: 0005-0601
Page No:261

Factors Annual income Sum of
Squares df
Mean
Square F p Value
Effective
Recognition and
Support factor
Between Groups 1604.304 4 401.076
6.542 0.000 Within Groups 23113.654 377 61.309
Total 24717.958 381 -
Environmental
Responsibility
Factor
Between Groups 1110.747 4 277.687
6.640 0.000 Within Groups 15766.219 377 41.820
Total 16876.966 381 -
e-Technology
Efforts Factor
Between Groups 334.956 4 83.739
5.874 0.000 Within Groups 5374.283 377 14.255
Total 5709.238 381
Encouraging Energy
Resources Factor
Between Groups 1040.641 4 260.160
7.282 0.000 Within Groups 13469.592 377 35.728
Total 14510.233 381 -
Source: Calculated Primary Data
Table shows that a significant difference among the different annual income of
employees were identified regarding the different factors of green HR practices are effective
recognition and support factor, environmental responsibility factor, e-technology efforts factor
and encouraging energy resources factor since the respective “F” statistics was significant at 5
per cent level and the „p‟ value is less than 0.05. It is concluded that there is a significant
relationship between annual income of the employees and factors of green HR practices that
“effective recognition and support factor, environmental responsibility factor, e-technology
efforts factor and encouraging energy resources factor”.
Factors of Green HR Practices among Different Designation of IT Industry Employees
In order to assess whether there is any relationship between designation of the employees
and factors of green HR practices, „ANOVA‟ test is used with the following hypothesis as,
Ho: There is no significant difference in factors of green HR practices among different
designation of IT industry employees in.
The resulted mean score among different designation of employees on the factors of green HR
practices and the respective „F‟ statistics are presented in Table.
Table 15: Table Showing the Factors of Green HR Practices among Different Level of
Employment of IT Professional
Aut Aut Research Journal
Volume XI, Issue IV, April/2020
ISSN NO: 0005-0601
Page No:262

Factors Annual income Sum of
Squares df
Mean
Square F p Value
Effective
Recognition and
Support Factor
Bween Groups 942.032 2 471.016
7.508 0.001 Within Groups 23775.926 379 62.733
Total 24717.958 381 -
Environmental
Responsibility
Factor
Between Groups 331.441 2 165.721
3.796 0.023 Within Groups 16545.525 379 43.656
Total 16876.966 381
e-Technology
Efforts Factor
Between Groups 20.142 2 10.071
0.671 0.512 Within Groups 5689.097 379 15.011
Total 5709.238 381 -
Encouraging
Energy Resources
Factor
Between Groups 467.909 2 233.954
6.314 0.002 Within Groups 14042.324 379 37.051
Total 14510.233 381 -
Source: Calculated Primary Data
Table shows that a significant difference among the different designation of employees
were identified regarding the different factors of green HR practices are effective recognition and
support factor, environmental responsibility factor and e-technology efforts factor since the
respective “F” statistics was significant at 5 per cent level of significance. The „p‟ value is less
than 0.05. It is concluded that there is a significant relationship between designation of the
employees and factors of green HR practices that “effective recognition and support factor,
environmental responsibility factor and e-technology efforts factor”.
SUMMARY OF FINDINGS
Findings on Personal Profile of IT Professionals
From 382 respondents, 53.7 per cent of the respondents are male, whereas female
constituting 46.3 per cent of the respondents. It is observed that male employees are found to be
flexible in working in the IT industry than the female, who need to address the night shifts and
family care. Therefore, it is found that male category is the bread winner of IT industry job than
the female, who are highly motivated and suitable to working conditions in the IT industry.
It is identified that the majority of the respondents (54.5 per cent) were unmarried. It is
observed that IT industry nature of the job is very apt to the unmarried who are away from
family.
Aut Aut Research Journal
Volume XI, Issue IV, April/2020
ISSN NO: 0005-0601
Page No:263

It is identified that the most of the respondents are in the age group of below 25 years
constituting 41.1 per cent of the respondents and next majority 36.1 per cent of the respondents
belong to the age group of 25 to 30 years. It is found that the IT industry catch the attention of
employees in the age group of below 25 years. There is the lowest percentage of the respondents
who continue to be the employees of the IT industry who are in the age group of above 40 years.
It is further inferred that, IT jobs are peculiarly suitable to youngsters who are below 25 years.
Considering the education of professionals, 63.6 per cent of the respondents are
possessing BCA/BSc/B.Tech/BE which is the highest among various qualifications and 1.6 per
cent of the respondents are Ph.D. qualified which is the least of all.
Based on the experience of professionals, the highest percentage 34.6 of the respondents
are with 1 to 3 years of experience, and the lowest percentage of respondents 7.3 do have the
maximum years of experience above 10 years. Therefore, it is observed that IT job is not
permanent to all. Since IT workers prefer to move from one company to another company due to
more income, higher studies and repetitive work. It is understood from the table that IT jobs are
not for long run survival and it is tolerable only for a few years. As a result, lower level of work
experience bags high percentage among the IT workers.
It is found that majority of 34.3 per cent of the respondents are earning annual income of
Rs.1 to 3 lakhs and next majority of 27.5 per cent of the respondents are earning annual income
of Rs.5 to 10 lakhs. Therefore it is observed that at present IT industry are paying the
compensation to their employees between Rs.20, 000/- and Rs. 25,000/-. Their income is found
to be just sufficient for house rent and other luxurious living, which happens to be the minimum
comfort today.
It is identified that majority of 76.7 per cent of the employees are working 8 hours, about
20.9 per cent of the employees are working 10 hours and only 2.4 per cent of the employees are
working above 10 hours. It is observed that majority of 61.8 per cent of the employees are low
level employees, 22.5 per cent of the employees are middle level employees and the remaining
15.7 per cent of the employees are top level employees in IT industry.
Findings on Job Stress of IT Professionals
From the Chi-square test of Independence, the gender of IT professionals have a
significant relationship between the uneven work target, weak environment and lack of
Aut Aut Research Journal
Volume XI, Issue IV, April/2020
ISSN NO: 0005-0601
Page No:264

opportunity for self development. Lack of stimulus and drive has no influence over gender of IT
professional.
From ANOVA, age group of IT professionals has a significant difference on uneven
work target, lack of stimulus and drive and weak environment among the job stress factors. Age
groups of IT professionals have no influence over lack of opportunity for self development.
Education of IT professionals has a significant difference between the weak environment factor.
But education of IT professionals has no impact on other job stress factors such as uneven work
target, lack of stimulus and drive and lack of opportunity for self development.
It is clear from the ANOVA that the experience of IT professionals has no relationship
between uneven work target, lack of stimulus and drive, weak environment and lack of
opportunity for self development. When compared to the annual income of IT professionals,
ANOVA concluded the significant relationship between uneven work target, lack of stimulus
and drive, weak environment and lack of opportunity for self development. It is proved from
ANOVA that the different levels of employment of IT professionals have a significant
relationship between the job stress factors uneven work target, lack of stimulus and drive, weak
environment and lack of opportunity for self development.
Findings on Green HR Practices in IT Industry
It is concluded from the Chi-Square test that the different level of employment has an
impact on the awareness of green HR issues. It is evident that each level of employees has some
awareness about the green HR practices. Only 6.4 percent of low level employees, 15.1 percent
of middle level employees and 13.2 percent of top level employees are not aware about the green
HR practices in IT industry.
Based on the Chi-square test, the male and female IT professionals have a significant
relationship between the green HR practices Effective recognition and support, Environmental
responsibility, E-technology and Encouraging energy resources. From ANOVA, the different
age group of IT professionals has a significant effect on the green HR practices Effective
recognition and support, Environmental responsibility and Encouraging energy resources
factors. It is also proved from ANOVA that the educational qualification of IT professionals has
a significant relationship on Effective recognition and support, Environmental responsibility, E-
technology and Encouraging energy resources.
Aut Aut Research Journal
Volume XI, Issue IV, April/2020
ISSN NO: 0005-0601
Page No:265

From ANOVA, it is confirmed that there is a significant relationship between experience
of the IT professionals and factors of green HR practices on Effective recognition and support,
Environmental responsibility and Encouraging energy resources factors. It is evident from
ANOVA that the annual income of IT professionals has a significant difference on Effective
recognition and support, Environmental responsibility, E-technology and Encouraging energy
resources. It is also found from ANOVA that the designation of the IT professionals has an
significant effect on the factors of green HR practices that Effective recognition and support
factor, environmental responsibility factor and encouraging energy resources factor”.
CONCLUSION
The present study concludes that there is job stress among the employees in IT field. It is
increasing at a faster rate. The job stress among the IT industry employees is higher than that the
other groups of employees. The important job stressors are unrealistic time pressures and they
have to work very fast. Level of employment of employees are significantly influencing the
stress among the employees are they not clear what they duties and responsibilities, working
time is not flexible, promotional activities are not satisfied, not good working atmosphere,
unrealistic time pressures, and job descriptions is not clear. Even though, the stress reducing
techniques have been adopted by the IT companies, it is not sufficient to reduce or eliminate the
stress among the employees, because of lesser involvement and implementation of stress
reducing techniques. Even though, the rate of implementation of the stress reducing techniques is
having positive impact on the job satisfaction and performance among the employees, it is not
properly and consistently followed. If these techniques are properly implemented, the IT
companies may save the life of the youngsters and also increase their productivity. Green HRM
is the new and emergent topic in the field of IT industry. Most of the IT firms are focusing the
environment responsibility and encouraging energy resources.
This study facilitates the Human resource managers to achieve the goals of the firm by
improving the human resource practices availing in the industry. This article helps the HR
managers to elevate job stress from IT professionals.
This study has practical implications to the society in spotting of eco-friendly practices
followed by the IT industry. Since the economy is greening nowadays and the impact of daily
activities are turned into environmental based. Also, environmental responsibility is now
Aut Aut Research Journal
Volume XI, Issue IV, April/2020
ISSN NO: 0005-0601
Page No:266

changed from individuals to organizations. Stress reduction techniques followed by the IT firms‟
helps the youngsters to have a positive impact on the IT industry.
References
[1]. Abad, E., Palacio, F., Nuin, M., Zarate, A., Juarros, A., Gomez, J. M., & Marco, S. (2009).
RFID smart tag for tracebility and cold chain monitoringof foods. Journal of Food
Engineering, 93(4), 394-399.
[2]. Altangerel, O., Ruimei, W., Elahi, E., & Dash, B. (2015). Investigating the Effect of Job
Stress on Performance of Employees. International Journal of Scientific & Technology
Reserch, 4(2), 276-280.
[3]. Alwis, A. C. D. (2010). The Impact Of Electronic Human Resource Management On The
Role Of Human Resource Managers. E + M Ekonomie A Management, 47-60.
[4]. Aravamudhan, N. R. (2012). Green HR getting into the Business of Green. HRM Review,
12(1).
[5]. Arulrajah, A. A., Opatha, H. H. D. N. P., & Nawaratne, N. N. J. (2015). Green Human
Resource Management Practices: A Review. Sri Lankan Journal of Human Resource
Management, 5 (1).
[6]. Balasubramanian, V., & Chokalingam, M. (2009). A Study on Stress and Depression
experienced by women IT Professionals in Chennai, India. Psychology Research Behaviour
Management, 81-91.
[7]. Bhattacharya, S., & Basu, J. (2007). Distress, Wellness and Organizaional Role Stress
among IT Professionals: Role of life Events and Coping Resources. Journal of the Indian
Academy of Applied Psychology, 33 (2), 167-178.
[8]. Bolhari, A., Rezaeian, A., Bolhari, J., & Bairamzadeh, S. (2012). Occupational Stress level
among Informational Technology Professionals in Iran.International Journal of Information
and Electronics Engineering, 2(5).
[9]. Breaugh, J. A., & Starke, M. (2000). Research on Employee Recruitment: So many
remaining Questions. Journal of Management, 26(3), 405-434.
[10]. Budhwar, P. (1996). Development in Human Resource Management – An Analytical
Review of the American and British Model.Indian Journal of Industrial Relations, 31(3).
[11]. Charu, M. (2013). Effect of Occupational Stress on QWL: Amongst the Associates of IT
industry. Advances in Manageement, 6(5).
Aut Aut Research Journal
Volume XI, Issue IV, April/2020
ISSN NO: 0005-0601
Page No:267