Embed Size (px)
Citation preview

Epithelial Notch signaling regulates interstitialfibrosis development in the kidneys of mice andhumans
Bernhard Bielesz, … , Volker H. Haase, Katalin Susztak
J Clin Invest. 2010;120(11):4040-4054. https://doi.org/10.1172/JCI43025.
Chronic kidney disease is a leading cause of death in the United States. Tubulointerstitialfibrosis (TIF) is considered the final common pathway leading to end-stage renal disease(ESRD). Here, we used pharmacologic, genetic, in vivo, and in vitro experiments to showthat activation of the Notch pathway in tubular epithelial cells (TECs) in patients and inmouse models of TIF plays a role in TIF development. Expression of Notch in renal TECswas found to be both necessary and sufficient for TIF development. Genetic deletion of theNotch pathway in TECs reduced renal fibrosis. Consistent with this, TEC-specificexpression of active Notch1 caused rapid development of TIF. Pharmacologic inhibition ofNotch activation using a g-secretase inhibitor ameliorated TIF. In summary, our experimentsestablish that epithelial injury and Notch signaling play key roles in fibrosis developmentand indicate that Notch blockade may be a therapeutic strategy to reduce fibrosis andESRD development.
Research Article Nephrology
Find the latest version:
http://jci.me/43025/pdf
Research article
4040 TheJournalofClinicalInvestigation http://www.jci.org Volume 120 Number 11 November 2010
Epithelial Notch signaling regulates interstitial fibrosis development in the kidneys
of mice and humansBernhard Bielesz,1 Yasemin Sirin,1,2 Han Si,1 Thiruvur Niranjan,1 Antje Gruenwald,1 Seonho Ahn,1
Hideki Kato,1 James Pullman,3 Manfred Gessler,4 Volker H. Haase,5 and Katalin Susztak1,6
1Department of Medicine, Division of Nephrology, Albert Einstein College of Medicine, New York, New York, USA. 2Renal Division, University Hospital Münster, Münster, Germany. 3Department of Pathology, Albert Einstein College of Medicine, New York, New York, USA. 4Theodor-Boveri-Institut für Biowissenschaften,
Biozentrum, Lehrstuhl Entwicklungsbiochemie, Am Hubland, Würzburg, Germany. 5Department of Medicine, Division of Nephrology, Vanderbilt University, Nashville, Tennessee, USA. 6Department of Genetics, Albert Einstein College of Medicine, New York, New York, USA.
ChronickidneydiseaseisaleadingcauseofdeathintheUnitedStates.Tubulointerstitialfibrosis(TIF)isconsideredthefinalcommonpathwayleadingtoend-stagerenaldisease(ESRD).Here,weusedpharma-cologic,genetic,invivo,andinvitroexperimentstoshowthatactivationoftheNotchpathwayintubularepithelialcells(TECs)inpatientsandinmousemodelsofTIFplaysaroleinTIFdevelopment.ExpressionofNotchinrenalTECswasfoundtobebothnecessaryandsufficientforTIFdevelopment.GeneticdeletionoftheNotchpathwayinTECsreducedrenalfibrosis.Consistentwiththis,TEC-specificexpressionofactiveNotch1causedrapiddevelopmentofTIF.PharmacologicinhibitionofNotchactivationusingaγ-secretaseinhibitoramelioratedTIF.Insummary,ourexperimentsestablishthatepithelialinjuryandNotchsignal-ingplaykeyrolesinfibrosisdevelopmentandindicatethatNotchblockademaybeatherapeuticstrategytoreducefibrosisandESRDdevelopment.
IntroductionIn the United States, 20 million people have chronic kidney disease (CKD), the ninth leading cause of death in the country (1). Tubulointerstitial fibrosis (TIF) is uniformly observed and considered the final common pathway for endstage renal disease (ESRD; ref. 2). Interstitial fibrosis develops in the kidney as a primary lesion or secondary to glomerulosclerosis (3). Recent epidemiologic data suggest that patients who had an episode of acute kidney injury (AKI) are also at greater risk for CKD and TIF development later in life (4). The cellular mechanism of TIF is still not well understood. In kidneys with TIF, the cortical interstitium is massively expanded, and fibroblasts acquire myofibroblast phenotype: they express αSMA (encoded by Acta2) and have increased capacity for production of collagen fibrils and matrix. Fatemapping studies and doubleimmunostaining experiments performed in the late 1990s showed that tubular epithelial cells (TECs) can transdifferentiate into mesenchymal fibroblasts via the process of epithelial mesenchymal transdifferentiation (EMT) giving rise to myofibroblasts and TIF development (5). The role of EMT in TIF development is also supported by a wealth of in vitro experiments, in which it was shown that treatment of TECs with TGFβ leads to loss of epithelial markers (e.g., Cdh1 and Tjp1) and acquisition of myofibroblast markers (e.g., Acta2 and Vim). Transgenic expression of Snail1 — a key transcriptional regulator of EMT — in TECs induces TIF in mice (6). Moreover, TECspecific deletion of hypoxia inducible factor 1 (Hif1) blocked EMT and effectively ameliorated development of fibrosis in rodent models of TIF (7), in support of the notion that epithelial cell transdifferentiation plays a key role in TIF. However,
recently performed lineage tagging experiments failed to confirm the epithelial origin of myofibroblasts, but rather indicated that specific interstitial cells (also referred to as pericytes) proliferate and become activated myofibroblasts causing TIF (8, 9).
The Notch signaling pathway consists of several receptors, Notch1–Notch4, and their ligands, Delta and Jagged (Jag). Activation of the pathway usually occurs via expression of the ligand in a signalgiving cell. Upon interaction with the ligand, Notch undergoes a series of proteolytic cleavages in the signalreceiving cell. Finally, the cytoplasmic domain, referred to as the Notch intracellular domain, translocates to the nucleus, where it induces target genes such as the basic helixloophelix proteins Hes and Hey (10). The major biological role of Notch signaling is to control the developmental fates of cells and to make cells different from one another. Therefore, cells become distinguished from one another according to whether they predominantly send or receive Notch signals. In some cases, but not all, this is easily explained by exclusive distribution of ligand and receptor.
The Notch pathway plays a complex role orchestrating kidney development (11). In the absence of Notch signaling, the metanephric mesenchyme leads to properly formed distal tubules, but complete absence of glomerular ECs and proximal TECs (11, 12). Once development is complete, very little Notch activity can be observed in the kidney. Immunohistochemistry studies indicate almost complete absence of active Notch1 and Notch2 in human or rodent glomeruli (13, 14). Gene expression studies performed in our and other laboratories indicate increased expression of Notch receptors and ligands in different glomerular diseases (13, 15). Transgenic expression of cleaved Notch1 fragment in vivo in podocytes caused severe albuminuria and glomerulosclerosis in animals. Genetic deletion or pharmacological inhibition of Notch signaling — specifically in podocytes — protected mice from albuminuria and glomerular injury (13, 16), which indicates that podocyte
Authorshipnote: Bernhard Bielesz, Yasemin Sirin, and Han Si contributed equally to this work.
Conflictofinterest: The authors have declared that no conflict of interest exists.
Citationforthisarticle: J Clin Invest. 2010;120(11):4040–4054. doi:10.1172/JCI43025.

research article
TheJournalofClinicalInvestigation http://www.jci.org Volume 120 Number 11 November 2010 4041
Figure 1Increased expression of Notch pathway in kidneys of mouse models of TIF and patients with TIF. (A) Relative mRNA amount of Notch1, Notch2, Notch3, Jag1, Dll1, Dll4, Hes1, and HeyL determined by QRT-PCR in FA-injected (10-week-old male FvB) mice 1, 3, 5, 7, and 14 days following the injection. Kidneys were isolated individually from each animal sacrificed at different time points after FA injection (n > 3 per time point). Gene expression level was normalized to mRNA levels of control animals, and significance was calculated compared with controls. (B) Representative immunostaining images of cleaved Notch1–stained kidney sections of control and FA-injected mice. ICN1 expression in FA-treated kidneys increased compared with controls. (C) Double immunofluorescence analysis with Jag1 (Cy3, red) and Lotus Tetragonolobus lectin (LTL; FITC, green) of control and 1 week after FA treatment. Jag1 expression increased after FA injection com-pared with control animals. (D and E) Representative images of (D) cleaved NOTCH1 and (E) JAG1 immunostaining from a control healthy individual and from a patient with diabetic kidney disease (DKD) with marked TIF. *P < 0.05, Student’s t test with Bonferroni correction. Scale bars: 20 μm (B, left, and D, right), 10 μm (B, right), 50 μm (C, D, left, and E).

research article
4042 TheJournalofClinicalInvestigation http://www.jci.org Volume 120 Number 11 November 2010
Notch expression plays a critical role in glomerulosclerosis development. Increased expression of the Notch ligand Jag1 has recently been described in the tubulointerstitial compartment of chronic renal disease samples (15) and in a mouse model of TIF (17). However, the functional role of the Notch pathway in TIF development has not yet been studied.
In the current study, we performed pharmacological, genetic, in vivo, and in vitro experiments to define the role of the Notch pathway in renal tubules during chronic TIF. We found that pharmacological inhibition or genetic deletion of the Notch pathway substantially reduced TIF in rodent models. In vivo expression of Notch1 in TECs was sufficient to induce severe TIF. In vitro Notch activation was associated with epithelial to mesenchymal transition of cultured TECs. Studies using in vivo genetic overexpression of Notch1 indicated that Notch likely plays role in TIF development via controlling cell proliferation.
ResultsIncreased Jag1/Notch1/HeyL expression in a folic acid–induced kidney injury model and in kidneys of TIF/CKD patients. First, we analyzed Notch pathway–related gene expression in the folic acid–induced (FAinduced) TIF model. FA precipitates in the renal tubules, inducing acute renal failure, which was evident in our experiments by increased serum creatinine levels (see below). The AKI was followed by TIF development, evident as early as 7 days after FA injection (18, 19). Transcript levels of Notch1, Notch2, and Notch3 significantly increased following FA administration (Figure 1A). Of the different Notch ligands, Jag1 showed the most significant increase (Figure 1A). The Notch target gene Hes1 showed early and very modest upregulation after injury, whereas upregulation of HeyL was robust and sustained (Figure 1A).
We also confirmed the activation of Notch signaling in kidneys by using an antibody specific for the cleaved Notch1 fragment (Figure 1B and Supplemental Figure 1; supplemental material available online with this article; doi:10.1172/JCI43025DS1). Few TECs labeled positive in healthy murine kidneys, whereas expression of cleaved Notch1 was markedly increased in FAinduced kidney injury (Figure 1B). At 1 week after FA injury, cleaved Notch1 expression was observed in both renal TECs and interstitial cells. We also detected a significant increase in Jag1 expression, mainly in the basal aspect of proximal TECs (Figure 1C). Our results are indicative of Notch pathway activation in the FAinduced kidney injury model.
Next, we examined the expression of NOTCH1 in human kidney samples. Very few TECs labeled positive with the cleaved NOTCH1 antibody in control kidneys. However, there was an increase in cleaved NOTCH1–positive TECs in samples obtained from patients with marked TIF (Figure 1D). We also observed a significant increase in JAG1 expression in kidney biopsy samples of human subjects with TIF (Figure 1E). These results indicate increased JAG1/NOTCH1 expressions in the kidneys of patients with TIF/CKD.γ-Secretase inhibitors do not alter serum creatinine decline after AKI, but
ameliorate TIF. To determine whether Notch signaling plays a functional role in AKI and fibrosis, we treated mice with γsecretase inhibitor XX (GSIXX, referred to herein as DBZ), a pharmacological inhibitor of Notch activation (13). Injection of DBZ (500 μg/100 g/d) was started on day 0 prior to FA treatment. DBZ successfully blocked Notch activation, as reflected by complete inhibition of Hes1 and HeyL increase following FA injection (Figure 2A). There was no statistical difference in serum creatinine levels of DBZ and shaminjected animals on days 1, 3, and 7 after FA injection (Figure 2B).
Figure 2DBZ blocks Notch signaling without altering initial kidney injury and apoptosis. (A) Relative mRNA amount (determined by QRT-PCR analysis) of Notch downstream effector genes Hes1 and HeyL in the kidneys of control and FA-injected mice in the presence or absence of DBZ. Male mice (10 weeks old) were injected with FA and DBZ (n = 4–7 per group per time point) and sacrificed on days 0, 1, 3, 5, and 7. (B) Serum creatinine levels of control and FA-injected animals in the presence or absence of DBZ. (C) Number of TUNEL-positive nuclei per 1,000 cells in the renal cortex of control and FA-injected mice in the absence or presence of DBZ. (D) QRT-PCR–based determination of Trp53, Bcl2, Apaf1, Bax, and Tgfb1 in kidneys of mice 1 day following FA injection. *P < 0.05.

research article
TheJournalofClinicalInvestigation http://www.jci.org Volume 120 Number 11 November 2010 4043
DBZ did not significantly influence the number of TUNELpositive cells in the kidney (Figure 2C) or the expression of apoptosisrelated transcripts, including Trp53, Apaf1, and Bax (Figure 2D). Similarly, tubular damage score, analyzed using the semiquantitative Hamar system, was not influenced by DBZ (Supplemental Figure 2). These results indicate that inhibition of the Notch pathway did not blunt the FAinduced initial renal damage or the normalization of serum creatinine (as a marker of renal recovery).
Upon analyzing the FAinduced histological changes, we found that the degree of TIF was significantly less in DBZtreated animals (Figure 3D and Supplemental Figure 3). In conjunction, transcript levels of fibrosis markers, including collagen 1a1 (Col1a1), collagen 3a1 (Col3a1), fibronectin (Fn1), and vimentin (Vim), were
significantly reduced in animals treated with DBZ (Figure 3A). We did not find statistical differences in the expression of inflammatory markers Cd68 and Emr1 (formerly known as F4/80) (Figure 3C). There was a significant decrease in myofibroblast marker Acta2 at the mRNA and protein level when Notch signaling was inhibited (Figure 3B), which indicates that Notch signaling plays a role in fibrosis development.
To further characterize the effect of DBZ specifically on the development of TIF, we used another established TIF model, induced by unilateral ureteral obstruction (UUO). We found significantly increased transcript levels of Notch1, Jag1, Hes1, and HeyL in this model (17), which were observed on day 4 and sustained on consecutive days (Figure 4A). Daily injection of DBZ significantly reduced
Figure 3Pharmacological inhibition of Notch signaling ameliorates FA-induced TIF. (A) Relative mRNA amounts of Col1a1, Fn1, Vim, and Col3a1 in kidney samples of FA-injected mice in the presence or absence of DBZ. (B) Relative mRNA amount of Acta2, and representative Acta2 immunostaining images from the cortex and medulla of control mice and of mice 1 week after treatment with FA, in the presence or absence of DBZ. (C) Relative mRNA amounts of Cd68 and Emr1 in kidney samples of FA-injected mice. (D) Representative trichrome-stained kidney sec-tions of control mice and of mice 1 week after treatment with FA, in the presence or absence of DBZ. Note the presence of tubular dilatation and substantial fibrosis (blue) in FA-injected animals. *P < 0.05. Scale bars: 50 μm (B and D).

research article
4044 TheJournalofClinicalInvestigation http://www.jci.org Volume 120 Number 11 November 2010
expression of the Notch target gene HeyL (Figure 4C). Upon histological examination, we observed substantially less severe fibrosis in DBZinjected animals compared with shamtreated UUO mice 7 days after UUO operation (Figure 4B). Similarly, transcript levels of Col1a1, Fn1, and Acta2 were significantly attenuated in mice treated with DBZ (Figure 4C). Our results indicate that pharmacological inhibition of Notch signaling using DBZ significantly attenuated TIF in 2 separate mouse models of TIF.
TEC-specific Rbpj deletion ameliorates TIF. In the FAinduced AKI model, we observed activation of the Notch pathway in both TECs and interstitial cells (Figure 1B). To better understand the implications of TEC Notch signaling in TIF, we generated mice with TECspecific deletion of Notch signaling using the wellcharacterized Rbpjfl/fl and PEPCKCre mice (7, 20, 21). The expression of Cre was limited to TECs in this transgenic strain, as confirmed by reporter mouse line analysis (Supplemental Figure 4). PEPCKCreRbpjfl/fl mice were born at the expected Mendelian frequency, and we did not observe any renal histological or functional abnormalities in the animals (Figure 5B). On a whole kidney homogenate level, we observed an approximately 60% reduction in Rbpj mRNA in the
PEPCKCreRbpjfl/fl mice (Figure 5A), indicative of successful generation of conditional knockout animals. Renal injury was induced by FA injection in 10weekold male mice. Wildtype mice showed increased expression of HeyL, whereas this response was attenuated in the Rbpj knockout animals (Figure 5A). At 7 days after FA injection, we observed marked TIF in wildtype animals, which was substantially reduced in the PEPCKCreRbpjfl/fl animals (Figure 5B). Likewise, transcript levels of Col1a1, Vim, and Acta2 in the PEPCKCre
Rbpjfl/fl animals were significantly lower compared with FAtreated wildtype animals, and not significantly different from controls (Figure 5C). In summary, canonical (i.e., Rbpjdependent) Notch signaling appears to be dispensable at baseline in renal TECs; however, our findings suggest that increased TEC Notch signaling following injury plays a key role in TIF development.
Conditional expression of cleaved Notch1 in vivo in TECs causes TIF. As our observations indicated that Notch activation in TEC is necessary for TIF development, we sought to determine whether Notch activation in TECs alone is sufficient to induce TIF. Therefore, we generated mice with conditional inducible expression of cleaved Notch1 in mature TECs by intercrossing 2 already validated
Figure 4Pharmacological inhibition of Notch signaling ameliorates UUO-induced TIF. (A) Relative mRNA amount (determined by QRT-PCR analysis) of Notch1, Jag1, Hes1, and HeyL of sham- or UUO-operated mice (10-week-old male FvB; n = 5 per group) at 4, 6, 8, and 12 days following the UUO operation. (B) Representative images of PAS-stained kidney sections of the cortex and medulla from sham- or UUO-operated mice with or without DBZ treatment. (C) Relative mRNA amount (determined by QRT-PCR analysis) of HeyL, Col1a1, Fn1, and Acta2 in whole kidney homogenate isolated from sham- or UUO-operated mice with or without DBZ treatment on day 8. *P < 0.05 versus control (unless otherwise indicated), Student’s t test with Bonferroni correction. Scale bars: 50 μm (B).

research article
TheJournalofClinicalInvestigation http://www.jci.org Volume 120 Number 11 November 2010 4045
mouse strains: Pax8rtTA animals (22) and tetOICN1 mice (23). Wildtype, singletransgenic Pax8rtTA and tetOICN1, and doubletransgenic Pax8rtTA/ICNotch1 animals were fed doxycyclinecontaining food beginning at 4 weeks of age. Pax8rtTA/ICNotch1 animals died at about 5 weeks after the initiation of doxycyclinecontaining food. Animals were sacrificed 4 weeks after induction for the analysis, because they appeared sick. Quantitative RTPCR (QRTPCR) analysis showed increased expression of Notch target genes Hes1, Hey1, and HeyL (Figure 6A), indicating the successful expression of the transgene. Histological analysis of the kidneys showed severe tubular degeneration, dilatation, and interstitial fibrosis (Figure 6B). The phenotype was similar to TIF observed in human kidneys in the context of CKD. Expression of Fn1, Col1a1, Col3a1, Col4a1, Vim, and Acta2 markedly increased in Pax8rtTA/ICNotch1 animals, and we also observed increased expression of the inflammatory cell markers Emr1 and Cd68 in these mice (Figure 6C). These results indicate that expression of cleaved Notch1 in vivo in TECs is a strong inducer of interstitial fibrosis and that Notch1 expression alone is sufficient to drive TIF.
In cultured TECs, Notch is regulated by TGF-β1 and is a strong inducer of EMT. Next, we studied the regulation of Notch signaling in cultured renal TECs. Treatment of cultured rat TECs (NRK cells) with TGFβ1
induced expression of Jag1 and led to the accumulation of cleaved Notch1 (Figure 7A). DBZ blocked the accumulation of cleaved Notch1 fragment, but did not alter the expression of Jag1 (Figure 7A), which indicates that Notch activation most likely occurs via de novo induction of ligand expression. Treatment of the NRK cells with TGFβ1 caused differentiated epithelial cell marker loss (i.e., Cdh1) and for the cells to take on a mesenchymal phenotype (dedifferentiation and EMTlike changes). We observed increased expression of Acta2, Vim, and Col1a1 and a decrease in Cdh1 mRNA (Figure 7, A and B). Preincubation with DBZ blocked Notch cleavage and expression of EMT markers (Figure 7, A and B). TGFβ1 treatment increased the expression of the EMT regulator Snai1 (Figure 7B) in a manner dependent on Notch (i.e., DBZ). Transcript levels of other EMT regulators, such as Twist1, Foxc2, and Snai2, did not change after TGFβ1 incubation (Figure 7B and data not shown). Similar TGFβ1–induced, Notchdependent EMT was observed in human proximal TECs (HK2; data not shown). In summary, our experiments indicate that the Jag1/Notch1 axis is activated by TGFβ1 in vitro and plays a critical role in the TGFβ1–induced EMT of cultured TECs.
To directly investigate the effect of increased Notch activity, we expressed Notch1 or Notch2 intracellular domains using a tamoxifeninducible retroviral system (24). The overexpression of cleaved
Figure 5Diminished TIF following FA injection in tubule-specific Rbpj knockout mice. (A) Decreased mRNA levels of Rbpj and HeyL in PEPCKCreRbpjfl/fl mice. Male 10-week-old control (WT and Rbpjfl/fl) and PEPCKCreRbpjfl/fl littermates were injected with sham or FA, and relative mRNA expression was determined in whole kidney lysates 7 days later. (B) Representative images of PAS-stained kidney sections from control (WT and Rbpjfl/fl) and PEPCKCreRbpjfl/fl mice with or without FA injection. (C) Relative mRNA amount of Col1a1, Vim, and Acta2 in control and PEPCKCreRbpjfl/fl mice with or without FA injection. *P < 0.05, Student’s t test with Bonferroni correction. Scale bars: 50 μm (B).

research article
4046 TheJournalofClinicalInvestigation http://www.jci.org Volume 120 Number 11 November 2010
Notch1 and Notch2 (ICN1 and ICN2, respectively) was confirmed by QRTPCR analysis showing increased transcript levels of ICN1 and ICN2 as well as of their downstream targets, Hey1 and HeyL (Figure 7C). Following expression of ICN1 and ICN2, there was no detectable change in TEC apoptosis (data not shown), and protein levels of Trp53, Parp1, and cleaved caspase 3 did not change (Figure 7E). Expression of ICN1 and ICN2 led to an increase in mRNA and protein levels of Acta2, Fn1, Vim, and Col1a1 (Figure 7, D and E). Notch also induced the expression of key EMT regulator Snai2. In summary, Notch activation in cultured cells induced the expression of mesenchymal genes and loss of differentiated epithelial markers, consistent with dedifferentiation and EMT.
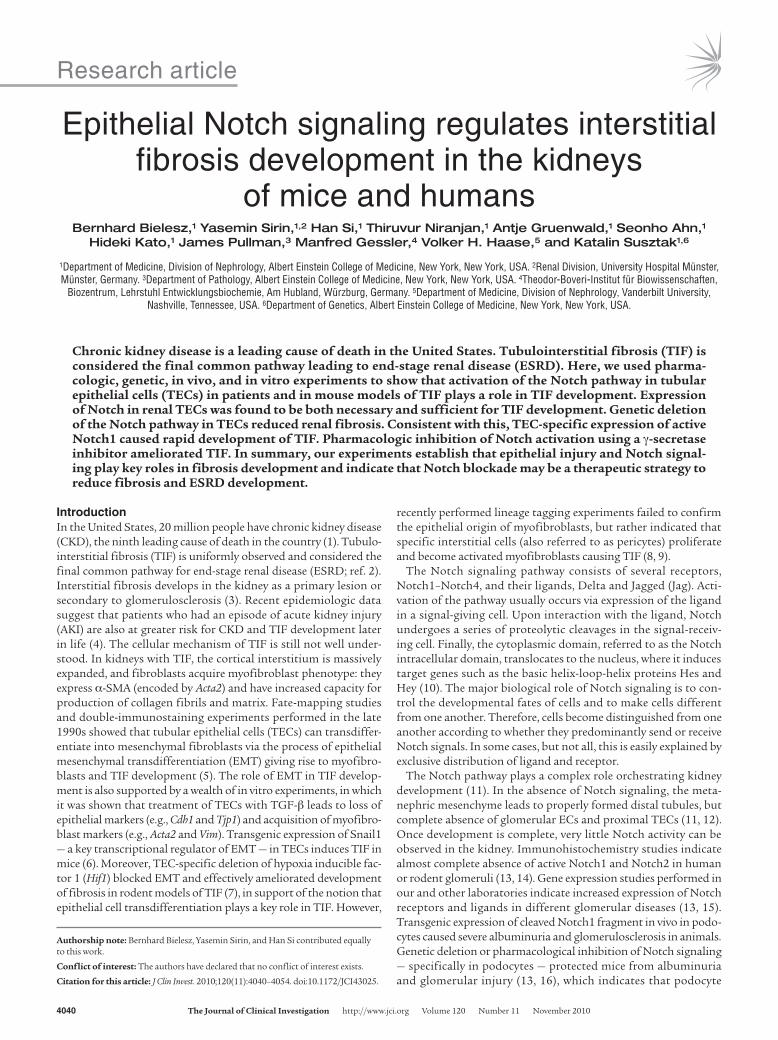
In vivo effects of Notch appear to be independent of EMT. Next, we sought to determine whether Notchinduced EMT also plays a role in the development of TIF in vivo. The hallmark of EMT is the downregulation of epithelial cadherin isoforms such as Cdh1 and expression of mesenchymal markers (25). In TECs, similar to other cells, TGFβ1 and Notchinduced EMT is mediated by Snai1 and Snai2 (26, 27). Therefore, we determined the expression of cadherin isoforms and EMT regulators in Pax8rtTA/ICNotch1 mice and found that transcript levels of epithelial cadherins, such as Cdh1 and Cdh6, were significantly increased (Figure 8A). Moreover, we failed to observe a significant change in Snai1, Snai2, Twist1, and Foxc2 expression in Pax8rtTA/ICNotch1 mice (Figure 8A and data not shown).
Next, we analyzed transcriptional regulators of EMT in the FAinduced and UUO models of TIF. We found that Twist1 and
Foxc2 were unchanged, whereas Snai1 and Snai2 levels were significantly increased, in both TIF models (Figure 8, B and E, and data not shown). Although DBZ effectively ameliorated renal fibrosis in both models (Figures 3 and 4), it did not significantly influence transcript levels of Snai1 and Snai2 (Figure 8, B and E). Upon analyzing the epithelial cadherins in these models, we found the highest Cdh1 expression mainly on distal TECs (Figure 8C), consistent with prior reports (28, 29). We did not observe a decrease in mRNA or protein expression of Cdh1 in the FA or UUOinduced TIF models (Figure 8, C and F). Similar results were obtained when other cadherin isoforms (Cdh6 and Cdh16) and epithelial markers (Tjp1) were studied (Figure 8, D and F). In summary, upon examining the different rodent TIF models and mice with TECspecific Notch1 expression, we failed to observe a decrease in expression of epithelial markers or Notchdependent regulation of key EMT transcriptional factors Snai1 and Snai2 in vivo.
Notch activation is associated with cell proliferation in vivo and in vitro. In order to better understand the mechanism of Notchinduced TIF development in vivo, we performed genomewide transcriptome analysis on whole kidney lysates of 7weekold male doxycyclinefed singletransgenic control and doubletransgenic Pax8rtTA/ICNotch1 animals using Affymetrix1.0 ST expression arrays (n = 3 mice per array per group), and data were normalized using the RMA16 method (see Methods). The stringent statistical analysis using P < 0.01 (after BenjaminiHochberg correction) and at least 2fold change identified 1,784
Figure 6Transgenic expression of ICNotch1 in TECs causes severe kidney fibrosis. (A) Relative mRNA amount of Notch targets Hes1, Hey1, and HeyL and (C) Fn1, Col1a1, Col3a1, Col4a1, Vim, Acta2, Cd68, and Emr1 in doxycycline-fed wild-type and single-transgenic controls and double-transgenic Pax8rtTA/ICNotch1 animals. Relative mRNA amount was normalized to the expression levels in control animals. (B) Rep-resentative images of PAS-stained kidney sections from wild-type and single-transgenic control and double-transgenic Pax8rtTA/ICNotch1 animals. Male littermates were placed on doxycycline containing food at 4 weeks of age and sacrificed at 8 weeks of age (n > 5 per group). Scale bars: 100 μm (B, top), 50 μm (B, middle and bottom).

research article
TheJournalofClinicalInvestigation http://www.jci.org Volume 120 Number 11 November 2010 4047
differentially expressed transcripts (Supplemental Table 1). Next, we grouped the differentially expressed genes by their ontology groups (i.e., biological process and cellular components). We identified 18 level2 gene ontology (GO) biological process terms (Table 1). In addition to the different metabolic pathways, cell cycle, cell division, and cell proliferation showed up as key regulated pathways (Table 1). Additionally, when we examined the level2 GO cellular component terms, we found extracellular matrix component as one of the key regulated pathways (Table 2), confirming our previous hypothesis.
As the gene expression analysis highlighted Notchinduced cell cycle regulation, we examined cell proliferation in Pax8rtTA/ICNotch1 animals. QRTPCR analysis showed increased expression of cell cycle regulator proteins Ccnd1, Ccnd2, Ccnb1, and Ccne1 (Figure 9B). Consistently, we observed an increased number of Pcnapositive (i.e., proliferating) cells in Pax8rtTA/ICNotch1 mice (Figure 9A), which suggests that Notch1 might
have induced cell proliferation. There was a partial overlap between Notchexpressing and proliferating cells, as not all Notchpositive cells were Pcnapositive, and some Pcnapositive cells were Notchnegative as well. Next, we performed in vitro transfection of NRK cells with ICN1 or ICN2, as described above. We found increased cell proliferation following Notch expression, as detected by increased BrdU incorporation (Figure 9C). We also detected increased transcript levels of cell cycle regulators Ccna1, Ccnd1, and Ccne1 and protein expression of Ccnd1 in Notchexpressing cells (Figure 9, D and E). These findings indicate that Notch expression is associated with cell proliferation both in vivo and in vitro.
Next, we tested whether there is a correlation between inhibition of Notch signaling, reduction in fibrosis, and cell proliferation. We examined cell proliferation by Pcna immunostaining of FAtreated kidney samples in the presence or absence of DBZ. There was a detectable and significant increase in Pcnaposi
Figure 7TGF-β1 activates Notch signaling, and Notch plays a role in EMT of cultured TECs. (A) Relative mRNA amount of Jag1 in TGF-β1–treated (5 ng/ml) NRK cells in the presence or absence of DBZ (1 μM). Western blot analysis of cleaved Notch1, Jag1, Acta2, and Actb following incubation of NRK cells with TGF-β1 in the presence or absence of DBZ is also shown. (B) Relative mRNA amount of Acta2, Cdh1, Vim, Col1a1, Snai1, and Snai2 of NRK cells treated with TGF-β1 in the presence or absence of DBZ. (C–E) NRK cells infected with ICN1, ICN2, or BMZ/EGFP retrovirus and treated with sham or tamoxifen (Tam; 1.5 μM). (C) Relative amounts of Notch1, Notch2, Hey1, and HeyL mRNA. (D) Relative amounts of Fn1, Col1a1, Vim, Acta2, Snai1, and Snai2 mRNA. (E) Western blot of Acta2, Snai1, Snai2, Actb, Trp53, Parp1, and cleaved caspase 3. Lysates were prepared 48 hours after treatment with 1.5 μM tamoxifen or sham. All experiments were repeated at least 3 times; data represent 1 of the 3 repeats. *P < 0.05, Student’s t test with Bonferroni correction.
research article
4048 TheJournalofClinicalInvestigation http://www.jci.org Volume 120 Number 11 November 2010

research article
TheJournalofClinicalInvestigation http://www.jci.org Volume 120 Number 11 November 2010 4049
tive TECs and Pcnapositive interstitial cells, evident around 3 days after FA administration (Figure 10A). Inhibition of Notch signaling by use of DBZ significantly attenuated cell proliferation in the FAinduced TIF model (Figure 10A). Similarly, DBZ treatment also reduced the expression of cell cycle regulators Ccnd2, Ccne1, and Ccnb1 (Figure 10B). Finally, we examined cell proliferation markers in human kidney biopsy samples. Similar to the murine models, there was an increased number of Pcnapositive cells, which showed a partially overlapping pattern with Notch1 expression (Figure 10C). These results indicate that Notch is associated with cell proliferation in TECs and interstitial cells in the kidney.
DiscussionTIF is a common denominator in the development and progression of CKD, regardless of its etiology (2). Therefore, understanding and halting the progression of TIF is an important clinical problem. Here, we demonstrated activation of the Notch pathway in patients with TIF and in mouse models of TIF. Whereas prior studies detected an increase in Notch1 and Jag1 mRNA levels, here we also demonstrated activation of the pathway using a cleavagespecific antibody, and additionally by showing increased expression of the kidneyspecific target gene HeyL. Moreover, we show for the first time to our knowledge that increased Notch signaling in renal TECs plays a functional role in TIF development. Expression of Notch in renal epithelial cells is sufficient to induce TIF. Genetic deletion of Notch only in TECs, or pharmacologic blockade of Notch, protected animals from TIF. The effect of Notch was mediated by the canonical Rbpjdependent pathway. Our results establish that (a) TECs play a key role in the orchestration of interstitial fibrosis and (b) Notch signaling plays a pivotal role in kidney fibrosis development.
How does TEC Notch signaling induce interstitial fibrosis? Expression of Notch in cultured epithelial cells caused the decrease in expression of differentiated epithelial cell markers and the acquisition of a mesenchymal phenotype (i.e., EMT; refs. 30, 31) via regulating the expression of key EMT regulators Snai1 and Snai2 (27). Because EMT has previously been proposed to play a role in TIF development (32, 33), one could infer from our results that Notch controls TIF via EMT induction. While this is a very attractive hypothesis, our present results do not support the notion that Notchinduced EMT is a major contributor to TIF in vivo. Loss of epithelial cell markers, particularly Cdh1, is considered to be a
Figure 8In vivo expression of Notch does not correlate with markers of EMT. (A) Relative mRNA amount of Cdh1, Cdh2, Cdh6, Cdh16, Snai1, and Snai2 in wild-type and single-transgenic control and double-transgenic Pax8rtTA/ICNotch1 animals. Relative mRNA amount was normalized to control expression. Representative immunostaining images of Cdh1 of control and Pax8rtTA/ICNotch1 animals are also shown. (B) Relative mRNA amount of Snai1, Snai2, and Twist1 in kidney samples of FA-injected mice in the presence or absence of DBZ. (C) Relative mRNA amount of Cdh1 and representative immunostaining images of Cdh1 of control (day 0) mice and FA-treated mice in the presence or absence of DBZ. (D) Relative mRNA amount of Cdh6, Cdh16, and Tjp1 in kid-ney samples of FA-injected mice in the presence or absence of DBZ. (E) Relative mRNA amount of Snai1, Snai2, Twist1, and Foxc2 and (F) Cdh1, Tjp1, and S100a4 in control animals and the UUO-induced TIF model in the presence or absence of DBZ. *P < 0.05, Student’s t test with Bonferroni correction. Scale bars: 50 μm (A and C).
Table 1Gene ontology classification of differentially expressed transcripts in Pax8rtTA/ICNotch1 mice versus controls: biological process
GO ID Term Count % FDR Fold enrichmentGO:0006066 Alcohol metabolic process 65 4.587156 9.24 × 10⁻⁷ 2.263178874GO:0006810 Transport 263 18.56034 1.15 × 10⁻⁶ 1.4075923GO:0006950 Response to stress 130 9.174312 0.149444772 1.376257423GO:0007049 Cell cycleA 70 4.940014 2.339035851 1.436034436GO:0008283 Cell proliferation 32 2.258292 9.20593601 1.62390661GO:0009056 Catabolic process 128 9.033169 6.11 × 10⁻⁴ 1.54271128GO:0009605 Response to external stimulus 76 5.363444 0.534155428 1.488475336GO:0019748 Secondary metabolic process 16 1.129146 0.352885695 2.906557484GO:0022402 Cell cycle process 50 3.528582 1.395445636 1.59472381GO:0042221 Response to chemical stimulus 109 7.692308 0.00535989 1.540319816GO:0044237 Cellular metabolic process 549 38.74382 2.34 × 10⁻⁴ 1.174911474GO:0044238 Primary metabolic process 543 38.3204 2.208306602 1.095837921GO:0048771 Tissue remodeling 11 0.776288 4.117329598 2.933613205GO:0051234 Establishment of localization 265 18.70148 9.10 × 10⁻⁷ 1.408672699GO:0051301 Cell division 40 2.822865 0.576564695 1.784274612GO:0055085 Transmembrane transport 91 6.422018 8.22 × 10⁻¹³ 2.479656853GO:0055114 Oxidation reduction 196 13.83204 2.43 × 10–59 3.655904335GO:0065008 Regulation of biological quality 114 8.045166 6.175857407 1.272427714
Shown are level 2 gene biological process ontological terms that were overrepresented in Pax8rtTA/ICNotch1 animals compared with controls. Gene expression analysis was performed using Affymetrix ST1.0 Mouse gene expression arrays. We identified 1,784 differentially expressed transcripts that showed at least 2-fold change in gene expression and P < 0.01. (Differentially expressed transcripts are listed in Supplemental Table 1.) David 2.0 was used to identify overrepresented ontology groups; statistical significance was determined by modified Fisher exact test (P < 0.01, or FDR < 10). The number and percent of transcripts in each group, FDR, and fold enrichment are shown. Key regulated pathways are denoted by bold text. AGas2l3, S100a6, Prc1, Kntc1, Aurkb, Cd2ap, Cdt1, Cgref1, Mcm7, Tubb5, H2afx, Ccna2, Aspm, Mtus1, Kif11, Lig1, Rbl1, 4632434i11rik, Tpx2, Topbp1, Cdk6, Mcm2, Myh9, Mcm3, Tacc3, Esco2, Ncapd2, Mcm6, Mfn2, Ccnd1, Uhrf1, Mad2l1, Bub1bgadd45a, Nek6, Nek2, Pola1, Chek1, Anln, Ncaph, Ncapg2, F630043a04rik, Npm1, Bub1, Zwilch, Hells, Trip13, Mki67, Psrc1, Nuf2, Cenpf, Gas2, Cenpe, Racgap1, Smc2, Brca1, Smc4, 2610039c10rik, Ccnb1, Cdkn1a, Ccnb2, Plk1, Mapk13, Id4, Chaf1b, Myh10.

research article
4050 TheJournalofClinicalInvestigation http://www.jci.org Volume 120 Number 11 November 2010
fundamental event in EMT. The Notchinduced EMT of cultured TECs is associated with loss of cell polarity and decreased expression of Cdh1 and Tjp1 (25, 34). On the contrary, expression of Notch1 in vivo in TECs (using the Pax8rtTA/ICNotch1 mouse model) was actually associated with increased expression of Cdh1 (and Cdh6). We also failed to observe a decrease in expression of Cdh1 in the UUO or FAinduced TIF models. Similarly, when we searched published gene expression studies, we consistently found an increase in Cdh1 and Tjp1 levels in the TIF of human CKD samples (http://www. nephromine.org; ref. 35). Fatemapping experiments using PEPCKCre mice also failed to identify epithelial cells in the interstitium (Supplemental Figure 4 and data not shown). These observations suggest that if EMT occurs in vivo at all, its contribution to TIF is relatively small. However, the robust regulation of key EMT drivers Snai1 and Snai2 in the FA and UUO TIF models would argue against the locality of EMT. Transcript levels of Snai1 and Snai2 and TIF development were also discordant: whereas TIF was significantly decreased by γsecretase inhibitor, Snai1 and Snai2 expressions were not. Moreover, we observed severe TIF following Notch1 overexpression without a change in Snai1 and Snai2 expression. Our present findings indicate that Snai1 and Snai2 are not regulated by Notch in TECs in vivo. It is also important to note that Notch1 expression in vivo in TECs resulted in a much more severe phenotype than in vivo Snai1 overexpression in TECs (6), which indicates that Notch might activate a broader set of programs causing TIF. These results are also consistent with recent lineage tagging experiments disputing the contribution of EMT to kidney fibrosis development (36).
If epithelial cells do not turn into myofibroblasts, how do epithelial cells orchestrate interstitial fibrosis development? Our in vitro findings showed that Notch expression was associated with TEC proliferation and cyclin D1 expression (as also described in other cells; ref. 37). Coculturing Jag1expressing stromal cells with TECs or fibroblasts was also sufficient to induce expression of cyclin D1, both in epithelial cells and in fibroblasts (data not shown).
Not only did Notch activation associate with proliferation in vitro, but Notch activity correlated with cell proliferation in vivo as well: inhibiting Notch signaling by DBZ decreased proliferation in the FA model, while in vivo expression of Notch in TECs induced cell proliferation. Interestingly, we observed proliferation in epithelial cells and interstitial cells and in Notchpositive and neighboring Notchnegative cells (Figure 9A and Figure 10C). Notch is known to have nonautonomous effects in many different circumstances, including the skin, where it affects tumor development by altering the microenvironment (38). Similarly, endothelial Jag1/Notch signaling induces vascular smooth muscle differentiation (i.e., expression of SMA) and proliferation (39, 40). Although further studies will need to be performed to define the role and effect of epithelial cell signaling on the surrounding stroma and TIF development, this concept could reconcile the seemingly inconsistent prior results, a large body of evidence that indicated a key role for TECs in TIF development (7, 41) and the absence of epithelial cell lineage in the activated myofibroblast population (36). Activation of different signaling pathways, including TGFβ/Smad3 and HIF expression in epithelial cells, has been proposed to regulate TIF (7, 41). Given the known interactions among Notch, TGFβ (42), and hypoxia/HIF (43, 44) signaling, it is possible that these pathways eventually converge in mediating fibrosis development.
A few recent papers show increased cell proliferation in TIF models and indicate that limiting cell proliferation could improve fibrosis development (45–47). Therefore, it might be interesting to speculate the role of cell proliferation in humans with TIF and in murine TIF models. There are number of different possibilities. Cell proliferation is usually associated with a lessdifferentiated state, and therefore proliferating cells might be more prone to lay down matrix proteins. For example, a fibrotic stroma can be found around proliferating cancer cells (48). In our experiments, TEC Notch expression was associated with expression of Col1a1, Fn1, and others (Figures 6 and 7). Furthermore, proliferation of TECs might also lead to tubular
Table 2GO classification of differentially expressed transcripts in Pax8rtTA/ICNotch1 mice versus controls: cellular component
GO ID Term Count % FDR Fold enrichmentGO:0000267 Cell fraction 82 5.786874 7.04 × 10⁻⁴ 1.750200445GO:0005622 Intracellular 878 61.96189 5.20 × 10⁻⁶ 1.113227436GO:0031012 Extracellular matrixA 39 2.752294 3.779074891 1.605559205GO:0031090 Organelle membrane 141 9.9506 5.78 × 10⁻¹⁷ 2.217128111GO:0031967 Organelle envelope 120 8.468596 4.52 × 10⁻²³ 2.82688202GO:0043227 Membrane-bounded organelle 660 46.57728 5.39 × 10⁻⁵ 1.156292466GO:0043229 Intracellular organelle 729 51.44672 1.46 × 10⁻⁴ 1.132859329GO:0044420 Extracellular matrix partB 24 1.693719 4.52 × 10⁻⁴ 3.318513675GO:0044421 Extracellular region part 85 5.998589 1.403795807 1.397005649GO:0044422 Organelle part 324 22.86521 2.55 × 10⁻⁴ 1.281590169GO:0044424 Intracellular part 865 61.04446 1.56 × 10⁻⁹ 1.146451163GO:0044446 Intracellular organelle part 320 22.58292 5.37 × 10⁻⁴ 1.274486571GO:0045177 Apical part of cell 31 2.187721 1.74 × 10⁻⁴ 2.89963266
Shown are level 2 gene cellular component ontological terms that were overrepresented in Pax8rtTA/ICNotch1 animals compared with controls. Gene expression analysis was performed using Affymetrix ST1.0 Mouse gene expression arrays. We identified 1,784 differentially expressed transcripts that showed at least 2-fold change in gene expression and P < 0.01. (Differentially expressed transcripts are listed in Supplemental Table 1.) David 2.0 was used to identify overrepresented ontology groups; statistical significance was determined by modified Fisher exact test (P < 0.01, or FDR < 10). The number and percent of transcripts in each group, FDR, and fold enrichment are shown. Key regulated pathways are denoted by bold text. ANepn, Podn, Adamts16, Tnc, Adamtsl4, Col3a1, Eln, Timp3, Trf, Tgfb1, Timp1, Gpc4, Gpc3, Loc545845, Tgfbi, Col12a1, Fbn2, Agrn, Fn1, Spon1, Col4a4, Col4a3, Col4a2, Col4a1, Lad1, Egfl6, Fbn1, Col15a1, Ntn4, Nid2, Mmp14, Anxa2, Lama1, Wnt7b, Lama5, Lamb1, Col1a2, Adamts1, Lamc2, Lamc1, Col1a1, Adamts2. BTnc, Col3a1, Timp3, Trf, Timp1, Agrn, Fbn2, Fn1, Col4a4, Col4a3, Col4a2, Col4a1, Lad1, Egfl6, Fbn1, Ntn4, Col15a1, Nid2, Anxa2, Lama1, Lama5, Lamb1, Col1a2, Lamc2, Adamts1, Col1a1, Lamc1.

research article
TheJournalofClinicalInvestigation http://www.jci.org Volume 120 Number 11 November 2010 4051
dilatation observed in — and considered to be the hallmark of — kidney fibrosis. Nevertheless, it is believed that epithelial cell mass is not increased in TIF/CKD. Therefore, increased cell proliferation might be necessary to compensate for the increased TEC apoptosis rate in TIF/CKD (49). In case the kidney does not have an intrinsic stem cell population and only contains progenitor cells, the increased cell turnover rate could cause depletion of the progenitor pool and thus lead to organ dysfunction, as progenitor cells are only able to divide a limited number of times.
Interestingly, increased Notch signaling has been observed in renal cell cancer (RCC), and inhibition of Notch signaling was able to block RCC growth (50). However, while we observed increased TEC proliferation and some degree of dysplasia in mice with TECspecific Notch1 overexpression, we did not detect RCC (data not shown), which indicates that Notch activation alone might be unable to induce RCC.
Reactivation of developmental pathways, including the Notch pathway, has been noted in AKI models (51). Although no experimental evidence exists to support the hypothesis, it would be logical to believe that renal regeneration follows the pattern of renal development. However, our results show that pharmacological inhibition of the Notch pathway using DBZ did not alter normalization of the serum creatinine following AKI, despite the
decreased cell proliferation rate (51). These results indicate that renal regeneration can occur in the absence of Notch signaling and further support the idea that Notch inhibitors can be used to prevent renal fibrosis development (13).
In summary, our results demonstrated that activation of the Notch pathway in TECs is a critical regulator of TIF development. Pharmacological inhibition of the Notch activation by γsecretase inhibitors may represent a novel treatment, as TIF is a final common pathway in CKD/ESRD development.
MethodsPatients. Human kidney samples were collected from archived kidney biopsies and from nephrectomies at the Albert Einstein College of Medicine Department of Pathology. All cases were obtained from biopsyproven DKD with CKD and substantial TIF. The study was approved by the Albert Einstein College of Medicine and Montefiore Medical Center IRBs (approval no. 2002222). Samples used in this study were anonymized: the human data or samples initially collected with identifiers before research use have been irreversibly stripped of all identifiers by use of an arbitrary alphanumeric code, and the key to the code is destroyed, making it impossible for anyone to link the samples to the sources. Therefore, no informed consent was obtained from the research participants.
Figure 9TEC expression of Notch induces cell proliferation in vivo and in vitro. (A) Double-immunostaining images of cleaved Notch1 (green) and PCNA (red) of doxycycline-fed male wild-type and single-transgenic control and double-transgenic Pax8rtTA/ICNotch1 animals. (B) Relative mRNA amount of Ccnb1, Ccnd1, Ccnd2, and Ccne1 in doxycycline fed male wild-type and single-transgenic control and double-transgenic Pax8rtTA/ICNotch1 animals. (C) Increased proliferation rate of cultured NRK cells fol-lowing ICN1 or ICN2 expression. NRK cells were infected with ICN1, ICN2, or BMZ/EGFP retrovirus and treated with sham or tamoxifen (0.75–3 μM). Proliferation was measured by BrdU assay per the manufacturer’s instructions. (D) Relative mRNA amount of Ccna1, Ccnd1, and Ccne1 in control, EGFP-, ICN1-, and ICN2-infected cells. (E) Western blot analysis of Ccnd1 and Actb expression in EGFP-, ICN1-, and ICN2- infected cells. Scale bars: 50 μm (A).

research article
4052 TheJournalofClinicalInvestigation http://www.jci.org Volume 120 Number 11 November 2010
Animals. Male FvB wildtype mice (~25 g, 10 weeks old) were purchased from Jackson Laboratory. Mice were injected with FA (250 mg/kg, dissolved in NaHCO3) intraperitoneally. For the UUO model, mice underwent ligation of the left ureter, and shamoperated mice were used as controls. DBZ (dissolved in methylcellulose and Tween80) was administered intraperitoneally (500 μg/100 g) once per day.
Rbpjfl mice were provided by T. Honjo (Kyoto University, Kyoto, Japan). To generate mice with Rbpj deletion specifically in tubules, we crossed Rbpjfl/fl mice (21) with transgenic PEPCKCre mice (7). To induce the transgene expression, animals were switched to NH4Cl containing water beginning at 4 weeks of age for 3–4 weeks. tetOICN1 mice were provided by D. Melton (Howard Hughes Medical Institute, Harvard University, Cambridge, Massachusetts, USA). Transgenic mice carrying the tetOICN1 and Pax8rtTA transgenes have previously been described (22, 23). Mice were placed on doxycyclinecontaining chow (Bioserv S3888) starting at 4 weeks of age. Transgenic mice were identified by genomic PCR analysis using transgenespecific primers. Only male mice were used in the study. Serum creatinine was determined by enzymatic assay (Creatinine Assay Kit, DICT500; BioAssay Systems) following the manufacturer’s instructions. All animal studies were approved by the Animal Care Committee at the Albert Einstein College of Medicine.
QRT-PCR. We prepared total RNA from mouse kidney and from cultured cells using TRIzol reagent (Invitrogen) and the RNeasy Mini kit (Qiagen),
respectively. The quality was analyzed on agarose gels, and the quantity was measured using NanoDrop. We reverse transcribed 1 μg total RNA using the cDNA Archival Kit (Applied Biosystems). QRTPCR was performed using an ABI 7900HTSequence Detection System, with SYBR Green Master Mix, 3step standard cycling conditions, sequencespecific primers. We examined the melting curve to verify that a single product was amplified. For quantitative analysis, all samples were normalized to Ubiquitin C gene expression using the ΔΔCT value method.
Histological analysis. We used formalinfixed, paraffinembedded kidney sections stained with periodic acid Schiff (PAS) or Gomori trichrome. Slides were examined, and pictures were taken with a Nikon Eclipse TE300 microscope and SPOT Diagnostic CCD camera.
Immunohistochemistry. Immunohistochemistry was performed as described previously (13), and labeling was visualized using peroxidaseconjugated antibodies to mouse or to rabbit immunoglobulin using the Vectastain Elite kit and 3,3diaminobenzidine (DAB; Vector Labs). TUNEL staining was performed using a TUNEL kit (Chemicon) following the manufacturer’s instructions. For fluorescence labeling, 5μm frozen sections were fixed in icecold acetone, blocked with 0.2% fish skin gelatin solution, incubated with primary antibodies to Jag1 (Santa Cruz SC9303) and Lotus Tetragonolobus lectin (LTL; Vector Laboratory), developed using FITCconjugated antimouse secondary antibody or Cy3conjugated antirabbit antibodies (Jackson Laboratories), and
Figure 10TEC expression of Notch correlates with cell proliferation in vivo in mice and humans. (A) Number of PCNA-positive nuclei counted per low-power field of FA-injected animals in the presence or absence of DBZ at 0, 1, 3, 5, and 7 days following FA administration. PCNA immunostaining of kidneys from controls and FA-injected animals in the presence or absence of DBZ is also shown. Data are presented from n = 2–12 fields per mouse per group. (B) Relative mRNA amount of Ccnd2, Ccne1, and Ccnb1 in kidneys of controls and FA-injected mice in the presence or absence of DBZ at 1, 3, 5, and 7 days following FA injection. (C) Double-immunostaining images of cleaved Notch1 (green) and PCNA (red) from kidney samples of healthy control and diseased (diabetic kidney disease with marked TIF) human subjects. *P < 0.05, Student’s t test with Bonferroni correction. Scale bars: 50 μm (A and C).

research article
TheJournalofClinicalInvestigation http://www.jci.org Volume 120 Number 11 November 2010 4053
mounted with Fluoromount. The following antibodies were used: Pcna (Millipore/Chemicon CBL407), activated Notch1 (Abcam ab8925), Ki67 (Vector Labs VPK451), ecadherin (Cell Signaling 4065, Abcam ab1416), Jag1 (Santa Cruz sc8303), and SMA (SigmaAldrich A5228).
Cell culture. Normal rat kidney tubule epithelium (NRK) cells were purchased from ATCC and grown according to the manufacturer’s instructions. Cells were expanded to 90% confluence, followed by serum deprivation in 0.2% FBS for 24 hours prior to stimulation with 5 ng/ml recombinant human TGFβ1 (Peprotech) in the absence or presence of 1 μM DBZ (Syncom) added 1 hour before TGFβ1.
Infection of NRK cells. NRK cells were infected with MIGR/ICN1/EGFP or MIGR/ICN2/EGFP (referred to herein as ICN1 or ICN2, respectively; ref. 52) or pBMNEGFP (Orbigen) retroviruses. The ICN1 and ICN2 constructs were provided by W. Pear (University of Pennsylvania, Philadelphia, Pennsylvania, USA). Briefly, we transfected Phoenix Eco packaging cells (Orbigen) and collected supernatant 60–72 hours after the transfection. NRK cells were infected with viruscontaining supernatant in the presence of polybrene (4 μg/ml). 24 hours later, cells were treated with tamoxifen to induce ICN1 or ICN2 expression or were left untreated. Infection efficiency, estimated under fluorescence microscope by the presence of GFPpositive cells, ranged 70%–80%.
Cell proliferation. Cell proliferation was studied using BrdUbased colorimetric cell proliferation assay kit from Exalpha Biological Inc. following the manufacturer’s instructions. Cells were incubated with BrdU for 24 hours.
Western blotting. We used the following primary antibodies: activated Notch1 (Abcam ab8925), Jag1 (Santa Cruz sc8303), Acta2 (SigmaAldrich A5228), Trp53 (Santa Cruz sc6243), Ccnd1 (Santa Cruz sc56302), cleaved PARP and cleaved caspase 3 (Cell Signaling), Snai1 (Cell Signaling 3879), Snai2 (Santa Cruz sc10436), and Actb (Abcam ab8226).
Microarray experiment. Mouse tissue total RNA was prepared from whole kidneys using TRIzol (Invitrogen). Gene expression studies were performed using the Affymetrix One Cycle labeling kit per the manufacturer’s instructions. For analysis of gene expression data after hybridization and scanning, raw data files were imported into Genespring Software. Database and expression levels were normalized using the RMA16 algorithm. This normalization method is a mathematical technique used to reduce discrepancies in hybridization pat
terns that might result from variables in target amplification, hybridization conditions, staining, or probe array lot. Normalizations standardize the data to facilitate identification of genuine gene expression difference.
GO classification and overrepresentation of biological themes. All significant gene entries were subjected to GO classification. Significant overrepresentation of GOclassified biological processes was determined by comparing the number of genes in the biological process that were significantly differentially expressed in a particular mouse strain with the total number of genes relevant to that biological process printed on the array, using publicly available DAVID 2.0 software (http://david.abcc.ncifcrf.gov/). Significance was determined by modified Fisher exact test (EASE score, P < 0.01, at least 2fold change).
Statistics. Results are presented as mean ± SD. To analyze the difference between 2 groups, 2tailed Student’s t test was used. Bonferroni correction was used when more than 2 groups were present. A P value less than 0.05 was considered significant.
AcknowledgmentsThese studies were supported by NIH grant 5R01DK076077 to K. Susztak. H. Si was a recipient of a postdoctoral fellowship from the National Kidney Foundation. Y. Sirin is supported by a grant from the Innovative Medizinische Forschung of University of Muenster (Muenster, Germany). We thank T. Hostetter and S. Somlo for the discussion.
Received for publication March 17, 2010, and accepted in revised form September 1, 2010.
Address correspondence to: Katalin Susztak, Division of Nephrology, Albert Einstein College of Medicine, 1300 Morris Park Ave., New York, New York 10461, USA. Phone: 718.430.3498; Fax: 718.430.8963; Email: [email protected].
Portions of this work were presented at the American Society of Nephrology annual meeting in San Diego, California, USA, on October 30, 2009.
1. Centers for Disease Control and Prevention (CDC). Statespecific trends in chronic kidney failureUnited States, 1990–2001. MMWR Morb Mortal Wkly Rep. 2004;53(39):918–920.
2. Nath KA. Tubulointerstitial changes as a major determinant in the progression of renal damage. Am J Kidney Dis. 1992;20(1):1–17.
3. Kriz W, et al. How does podocyte damage result in tubular damage? Kidney Blood Press Res. 1999; 22(1–2):26–36.
4. Golestaneh L, Melamed ML, Hostetter TH. Uremic memory: the role of acute kidney injury in longterm outcomes. Kidney Int. 2009;76(8):813–814.
5. Kalluri R, Neilson EG. Epithelialmesenchymal transition and its implications for fibrosis. J Clin Invest. 2003;112(12):1776–1784.
6. Boutet A, De Frutos CA, Maxwell PH, Mayol MJ, Romero J, Nieto MA. Snail activation disrupts tissue homeostasis and induces fibrosis in the adult kidney. EMBO J. 2006;25(23):5603–5613.
7. Higgins DF, et al. Hypoxia promotes fibrogenesis in vivo via HIF1 stimulation of epithelialtomesenchymal transition. J Clin Invest. 2007;117(12):3810–3820.
8. Humphreys BD, et al. Intrinsic epithelial cells repair the kidney after injury. Cell Stem Cell. 2008;2(3):284–291.
9. Lin SL, Kisseleva T, Brenner DA, Duffield JS. Pericytes and perivascular fibroblasts are the primary source of collagenproducing cells in
obstructive fibrosis of the kidney. Am J Pathol. 2008;173(6):1617–1627.
10. Leimeister C, Schumacher N, Gessler M. Expression of Notch pathway genes in the embryonic mouse metanephros suggests a role in proximal tubule development. Gene Expr Patterns. 2003; 3(5):595–598.
11. Cheng HT, Kopan R. The role of Notch signaling in specification of podocyte and proximal tubules within the developing mouse kidney. Kidney Int. 2005;68(5):1951–1952.
12. Kopan R, Cheng HT, Surendran K. Molecular insights into segmentation along the proximaldistal axis of the nephron. J Am Soc Nephrol. 2007; 18(7):2014–2020.
13. Niranjan T, et al. The Notch pathway in podocytes plays a role in the development of glomerular disease. Nat Med. 2008;14(3):290–298.
14. Waters AM, et al. Ectopic notch activation in developing podocytes causes glomerulosclerosis. J Am Soc Nephrol. 2008;19(6):1139–1157.
15. Walsh DW, et al. Coregulation of Gremlin and Notch signalling in diabetic nephropathy. Biochim Biophys Acta. 2008;1782(1):10–21.
16. Niranjan T, Murea M, Susztak K. The pathogenic role of notch activation in podocytes. Nephron Exp Nephrol. 2009;111(4):e73–79.
17. Morrissey J, et al. Transforming growth factorbeta induces renal epithelial jagged1 expression in fibrotic disease. J Am Soc Nephrol. 2002;
13(6):1499–1508. 18. Surendran K, McCaul SP, Simon TC. A role for
Wnt4 in renal fibrosis. Am J Physiol Renal Physiol. 2002;282(3):F431–F441.
19. Lin J, et al. Kielin/chordinlike protein, a novel enhancer of BMP signaling, attenuates renal fibrotic disease. Nat Med. 2005;11(4):387–393.
20. Oka C, et al. Disruption of the mouse RBPJ kappa gene results in early embryonic death. Development. 1995;121(10):3291–3301.
21. Kato H, et al. Involvement of RBPJ in biological functions of mouse Notch1 and its derivatives. Development. 1997;124(20):4133–4141.
22. TraykovaBrauch M, et al. An efficient and versatile system for acute and chronic modulation of renal tubular function in transgenic mice. Nat Med. 2008;14(9):979–984.
23. Stanger BZ, Datar R, Murtaugh LC, Melton DA. Direct regulation of intestinal fate by Notch. Proc Natl Acad Sci U S A. 2005;102(35):12443–12448.
24. ZweidlerMcKay PA, et al. Notch signaling is a potent inducer of growth arrest and apoptosis in a wide range of B cell malignancies. Blood. 2005; 106(12):3898–3906.
25. Kalluri R. EMT: when epithelial cells decide to become mesenchymallike cells. J Clin Invest. 2009;119(6):1417–1419.
26. Timmerman LA, et al. Notch promotes epithelialmesenchymal transition during cardiac development and oncogenic transformation. Genes Dev.

research article
4054 TheJournalofClinicalInvestigation http://www.jci.org Volume 120 Number 11 November 2010
2004;18(1):99–115. 27. Niessen K, Fu Y, Chang L, Hoodless PA, McFadden
D, Karsan A. Slug is a direct Notch target required for initiation of cardiac cushion cellularization. J Cell Biol. 2008;182(2):315–325.
28. Kirk A, Campbell S, Bass P, Mason J, Collins J. Differential expression of claudin tight junction proteins in the human cortical nephron. Nephrol Dial Transplant. 2010;25(7):2107–2119.
29. Prozialeck WC, Lamar PC, Appelt DM. Differential expression of Ecadherin, Ncadherin and betacatenin in proximal and distal segments of the rat nephron. BMC Physiol. 2004;4:10.
30. Zavadil J, et al. Genetic programs of epithelial cell plasticity directed by transforming growth factorbeta. Proc Natl Acad Sci U S A. 2001;98(12):6686–6691.
31. Niimi H, Pardali K, Vanlandewijck M, Heldin CH, Moustakas A. Notch signaling is necessary for epithelial growth arrest by TGFbeta. J Cell Biol. 2007; 176(5):695–707.
32. Zeisberg M, et al. BMP7 counteracts TGFbeta1induced epithelialtomesenchymal transition and reverses chronic renal injury. Nat Med. 2003; 9(7):964–968.
33. Iwano M, Plieth D, Danoff TM, Xue C, Okada H, Neilson EG. Evidence that fibroblasts derive from epithelium during tissue fibrosis. J Clin Invest. 2002;110(3):341–350.
34. Lee JM, Dedhar S, Kalluri R, Thompson EW. The epithelialmesenchymal transition: new insights in signaling, development, and disease. J Cell Biol. 2006;172(7):973–981.
35. Nephromine. Nephromine Research Web site. http://
www.nephromine.org. Accessed September 1, 2010. 36. Humphreys BD, et al. Fate tracing reveals the peri
cyte and not epithelial origin of myofibroblasts in kidney fibrosis. Am J Pathol. 2010;176(1):85–97.
37. Stahl M, Ge C, Shi S, Pestell RG, Stanley P. Notch1induced transformation of RKE1 cells requires upregulation of cyclin D1. Cancer Res. 2006;66(15):7562–7570.
38. Demehri S, Turkoz A, Kopan R. Epidermal Notch1 loss promotes skin tumorigenesis by impacting the stromal microenvironment. Cancer Cell. 2009;16(1):55–66.
39. High FA, et al. An essential role for Notch in neural crest during cardiovascular development and smooth muscle differentiation. J Clin Invest. 2007;117(2):353–363.
40. High FA, Lu MM, Pear WS, Loomes KM, Kaestner KH, Epstein JA. Endothelial expression of the Notch ligand Jagged1 is required for vascular smooth muscle development. Proc Natl Acad Sci U S A. 2008;105(6):1955–1959.
41. Sato M, Muragaki Y, Saika S, Roberts AB, Ooshima A. Targeted disruption of TGFbeta1/Smad3 signaling protects against renal tubulointerstitial fibrosis induced by unilateral ureteral obstruction. J Clin Invest. 2003;112(10):1486–1494.
42. Zavadil J, Cermak L, SotoNieves N, Bottinger EP. Integration of TGFbeta/Smad and Jagged1/Notch signalling in epithelialtomesenchymal transition. EMBO J. 2004;23(5):1155–1165.
43. Gustafsson MV, et al. Hypoxia requires notch signaling to maintain the undifferentiated cell state. Dev Cell. 2005;9(5):617–628.
44. Sahlgren C, Gustafsson MV, Jin S, Poellinger L, Lendahl U. Notch signaling mediates hypoxiainduced tumor cell migration and invasion. Proc Natl Acad Sci U S A. 2008;105(17):6392–6397.
45. Grgic I, et al. Renal fibrosis is attenuated by targeted disruption of KCa3.1 potassium channels. Proc Natl Acad Sci U S A. 2009;106(34):14518–14523.
46. Grande MT, et al. Deletion of HRas decreases renal fibrosis and myofibroblast activation following ureteral obstruction in mice. Kidney Int. 2010;77(6):509–518.
47. Yang L, Besschetnova TY, Brooks CR, Shah JV, Bonventre JV. Epithelial cell cycle arrest in G2/M mediates kidney fibrosis after injury. Nat Med. 2010;16(5):535–543.
48. Ikushima H, Miyazono K. TGFbeta signalling: a complex web in cancer progression. Nat Rev Cancer. 2010;10(6):415–424.
49. Susztak K, Ciccone E, McCue P, Sharma K, Bottinger EP. Multiple metabolic hits converge on CD36 as novel mediator of tubular epithelial apoptosis in diabetic nephropathy. PLoS Med. 2005;2(2):e45.
50. Sjolund J, et al. Suppression of renal cell carcinoma growth by inhibition of Notch signaling in vitro and in vivo. J Clin Invest. 2008;118(1):217–228.
51. Kobayashi T, et al. Expression and function of the Delta1/Notch2/Hes1 pathway during experimental acute kidney injury. Kidney Int. 2008; 73(11):1240–1250.
52. Schouwey K, et al. Notch1 and Notch2 receptors influence progressive hair graying in a dosedependent manner. Dev Dyn. 2007;236(1):282–289.
![Title Author(s) Doc URL · ESRD through a final common pathway in which progressive interstitial fibrosis is associated with tubular atrophy and peritubular capillary loss [5]. Recent](https://img.pdfslide.net/doc/110x75/5fe8b55c60f05d717b2bb435/title-authors-doc-url-esrd-through-a-final-common-pathway-in-which-progressive.jpg)


![Comprehensive ESRD Care Initiative LDO Model€¦ · Comprehensive ESRD Care Initiative LDO Model . July [15], 2015 . ... Comprehensive ESRD Care Initiative Participation Agreement](https://img.pdfslide.net/doc/110x75/5af2cc657f8b9a95468ba91b/comprehensive-esrd-care-initiative-ldo-model-comprehensive-esrd-care-initiative.jpg)