Embed Size (px)
Citation preview
Hydrodynamic Forces on Spillway Torque-Tube GatesLuis A. de Béjar, M.ASCE1; and Richard L. Stockstill, F.ASCE2
Abstract: The critical hydraulic configuration for a set of torque-tube gates controlling the flow through the navigable portion of aspillway was experimentally identified. In this paper, an analytical model for the upstream pressure field on a typical gate within the setis constructed. The gate rotation from the maximum elevation �gate in closed position� and the hydraulic torque transmitted by thepressure field to the gate tube are formulated. Mean values of parameters of response are often sufficient for the preliminary design of agate. The dispersions of these parameters of response, which are necessary for the final design of a gate, may be computed using thecorresponding mean-square values. These were obtained empirically in a flume from experiments on a 1/15-scale physical model of a setof three prototype gates for the Montgomery Point Lock and Dam project. Theoretical predictions of parameter mean and mean-squarevalues compare well with the average corresponding statistics obtained experimentally.
DOI: 10.1061/�ASCE�HY.1943-7900.0000216
CE Database subject headings: Hydraulic pressure; Hydraulic structures; Spillways; Gates; Hydrodynamics.
Author keywords: Hydraulic forces; Hydraulic pressure field; Hydraulic physical models; Hydraulic structures; Navigable spillways;Torque-tube gates.
Introduction
The flow through the navigable portion of a river barrier may beconveniently controlled by a parallel array of torque-tube gates,as Fig. 1 illustrates �see, for example, Fletcher and de Béjar 1995for a detailed description of the hydraulic structural 10-gatescheme in the Montgomery Point Lock and Dam project�.
The torque-tube type of flap gate is operated by controlling themagnitude of the torsional moment applied to the structural tuberigidly connected to the gate panel at its lower horizontal edge�Sehgal et al. 1997�. Fig. 2�a� shows a typical torque-tube gate forflow control in navigational spillways. In the case of the Mont-gomery Point Lock and Dam project, the generally curved gateskin adopts a circular profile, and the gate elevation is identifiedby the angle that the tangent to the skin circle makes with thehorizontal plane at the connection to the tube. The gates operate atan elevation ranging from zero �an open, horizontal, position� to70° in the closed-gate condition.
Each possible combination of individual operational gate el-evations within a given gate set is subjected to complex hydraulicloading, and the task of identifying the critical gate configurationgoverning the hydraulic structural design necessarily involves theapplication of both analytical and experimental techniques.
Investigations during the past two decades have directed atten-tion to experimental analysis �Naudascher 1991; Naudascher and
Rockwell 1994� and to updating design guidelines of spillwaygates �Sehgal 1996; Sagar 1995�. In particular, Sehgal �1996� andViparro and Hansen �1993� discussed general features of thetorque-tube type of flap gate, but due to the complexity of hydrau-lic conditions, recommendations regarding design loads are lim-ited. This paper presents experimentally verified mathematicalmodels that address this need for the case of navigable spillwaytorque-tube gates.
An analytical description of the pressure distribution on theupstream face of a typical gate in the critical configuration isderived, and the associated torque transmitted to the gate tube iscomputed �Fig. 2�b��. The theoretical pressures and torque arecompared to the laboratory data from experiments on a carefullyinstrumented 1/15-scale physical model of a prototype Montgom-ery Point gate at the U.S. Army Engineer Research and Develop-ment Center, and the second-moment characterization of thetube’s torque response to the imposed loads is verified.
During the experiments, it was recognized that the largest hy-draulic forces acting on a single central gate occur when all gatesin the experimental flume simultaneously face the flow in a fullyclosed position �de Béjar 1995�. Fig. 3 illustrates this critical con-figuration. This figure shows the basic depths recorded in the flowoverpassing the system of gates: the depth of the nappe at the gatecrest �hf =59 mm�, the smallest depth in the free-falling cascade�33 mm�, and the depth of the enclosed tailwater pool �128 mm�.For the purpose of evaluating design hydraulic forces on the gatewith a ventilated nappe, it is conservative to ignore the hydro-static pressure field on the back of the gate. This tailwater pres-sure was verified as minor for other gate configurations in theexperiments, as, for example, when the central gate in a set ofthree is fully closed and the adjacent lateral gates are in a fullopen position, or when only the central gate in a set of three isfully open and the adjacent lateral gates are in a full closed posi-tion.
At the outset, some limitations of the mathematical models tobe developed are noted: �1� The change in the flow pressure fielddue to the gate vibrations is neglected and �2� the models accu-
1Research Structural Engineer, U.S. Army Engineer Research & De-velopment Center �ERDC�, Vicksburg, MS 39180-6199 �correspondingauthor�. E-mail: [email protected]
2Research Hydraulic Engineer, U.S. Army Engineer Research & De-velopment Center �ERDC�, Vicksburg, MS 39180-6199. E-mail:[email protected]
Note. This manuscript was submitted on April 15, 2009; approved onFebruary 26, 2010; published online on March 4, 2010. Discussion periodopen until March 1, 2011; separate discussions must be submitted forindividual papers. This paper is part of the Journal of Hydraulic Engi-neering, Vol. 136, No. 10, October 1, 2010. ©ASCE, ISSN 0733-9429/2010/10-681–692/$25.00.
JOURNAL OF HYDRAULIC ENGINEERING © ASCE / OCTOBER 2010 / 681
Downloaded 19 Sep 2011 to 134.164.68.175. Redistribution subject to ASCE license or copyright. Visithttp://www.ascelibrary.org
Report Documentation Page Form ApprovedOMB No. 0704-0188
Public reporting burden for the collection of information is estimated to average 1 hour per response, including the time for reviewing instructions, searching existing data sources, gathering andmaintaining the data needed, and completing and reviewing the collection of information. Send comments regarding this burden estimate or any other aspect of this collection of information,including suggestions for reducing this burden, to Washington Headquarters Services, Directorate for Information Operations and Reports, 1215 Jefferson Davis Highway, Suite 1204, ArlingtonVA 22202-4302. Respondents should be aware that notwithstanding any other provision of law, no person shall be subject to a penalty for failing to comply with a collection of information if itdoes not display a currently valid OMB control number.
1. REPORT DATE OCT 2010 2. REPORT TYPE
3. DATES COVERED 00-00-2010 to 00-00-2010
4. TITLE AND SUBTITLE Hydrodynamic Forces On Spillway Torque-Tube Gates
5a. CONTRACT NUMBER
5b. GRANT NUMBER
5c. PROGRAM ELEMENT NUMBER
6. AUTHOR(S) 5d. PROJECT NUMBER
5e. TASK NUMBER
5f. WORK UNIT NUMBER
7. PERFORMING ORGANIZATION NAME(S) AND ADDRESS(ES) U.S. Army Engineer Research & Development Center (ERDC),ResearchStructural Engineer,Vicksburg,MS,39180
8. PERFORMING ORGANIZATIONREPORT NUMBER
9. SPONSORING/MONITORING AGENCY NAME(S) AND ADDRESS(ES) 10. SPONSOR/MONITOR’S ACRONYM(S)
11. SPONSOR/MONITOR’S REPORT NUMBER(S)
12. DISTRIBUTION/AVAILABILITY STATEMENT Approved for public release; distribution unlimited
13. SUPPLEMENTARY NOTES Journal of Engineering Mechanics, October 2010, pgs 681-692
14. ABSTRACT The critical hydraulic configuration for a set of torque-tube gates controlling the flow through thenavigable portion of a spillway was experimentally identified. In this paper, an analytical model for theupstream pressure field on a typical gate within the set is constructed. The gate rotation from themaximum elevation gate in closed position and the hydraulic torque transmitted by the pressure field tothe gate tube are formulated. Mean values of parameters of response are often sufficient for thepreliminary design of a gate. The dispersions of these parameters of response, which are necessary for thefinal design of a gate, may be computed using the corresponding mean-square values. These were obtainedempirically in a flume from experiments on a 1/15-scale physical model of a set of three prototype gates forthe Montgomery Point Lock and Dam project. Theoretical predictions of parameter mean andmean-square values compare well with the average corresponding statistics obtained experimentally.
15. SUBJECT TERMS
16. SECURITY CLASSIFICATION OF: 17. LIMITATION OF ABSTRACT Same as
Report (SAR)
18. NUMBEROF PAGES
12
19a. NAME OFRESPONSIBLE PERSON
a. REPORT unclassified
b. ABSTRACT unclassified
c. THIS PAGE unclassified
Standard Form 298 (Rev. 8-98) Prescribed by ANSI Std Z39-18
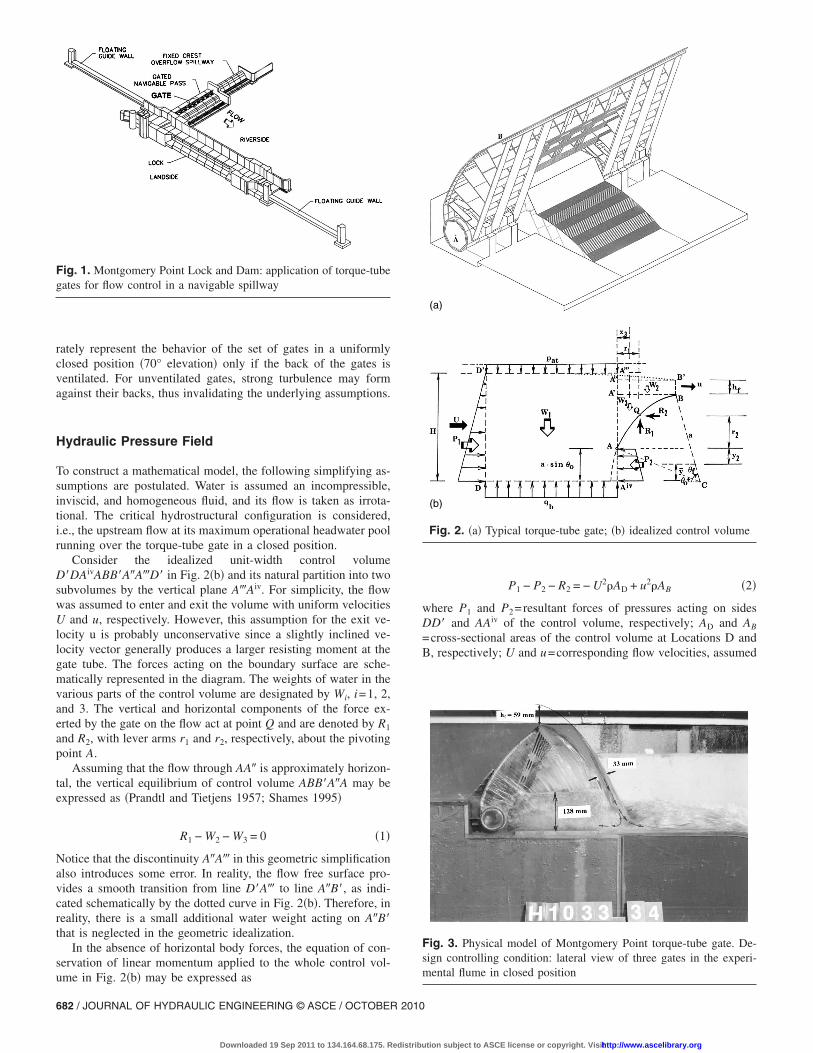
rately represent the behavior of the set of gates in a uniformlyclosed position �70° elevation� only if the back of the gates isventilated. For unventilated gates, strong turbulence may formagainst their backs, thus invalidating the underlying assumptions.
Hydraulic Pressure Field
To construct a mathematical model, the following simplifying as-sumptions are postulated. Water is assumed an incompressible,inviscid, and homogeneous fluid, and its flow is taken as irrota-tional. The critical hydrostructural configuration is considered,i.e., the upstream flow at its maximum operational headwater poolrunning over the torque-tube gate in a closed position.
Consider the idealized unit-width control volumeD�DAivABB�A�A�D� in Fig. 2�b� and its natural partition into twosubvolumes by the vertical plane A�Aiv. For simplicity, the flowwas assumed to enter and exit the volume with uniform velocitiesU and u, respectively. However, this assumption for the exit ve-locity u is probably unconservative since a slightly inclined ve-locity vector generally produces a larger resisting moment at thegate tube. The forces acting on the boundary surface are sche-matically represented in the diagram. The weights of water in thevarious parts of the control volume are designated by Wi, i=1, 2,and 3. The vertical and horizontal components of the force ex-erted by the gate on the flow act at point Q and are denoted by R1
and R2, with lever arms r1 and r2, respectively, about the pivotingpoint A.
Assuming that the flow through AA� is approximately horizon-tal, the vertical equilibrium of control volume ABB�A�A may beexpressed as �Prandtl and Tietjens 1957; Shames 1995�
R1 − W2 − W3 = 0 �1�
Notice that the discontinuity A�A� in this geometric simplificationalso introduces some error. In reality, the flow free surface pro-vides a smooth transition from line D�A� to line A�B�, as indi-cated schematically by the dotted curve in Fig. 2�b�. Therefore, inreality, there is a small additional water weight acting on A�B�that is neglected in the geometric idealization.
In the absence of horizontal body forces, the equation of con-servation of linear momentum applied to the whole control vol-ume in Fig. 2�b� may be expressed as
P1 − P2 − R2 = − U2�AD + u2�AB �2�
where P1 and P2=resultant forces of pressures acting on sidesDD� and AAiv of the control volume, respectively; AD and AB
=cross-sectional areas of the control volume at Locations D andB, respectively; U and u=corresponding flow velocities, assumed
(a)
(b)
Fig. 2. �a� Typical torque-tube gate; �b� idealized control volume
Fig. 3. Physical model of Montgomery Point torque-tube gate. De-sign controlling condition: lateral view of three gates in the experi-mental flume in closed position
Fig. 1. Montgomery Point Lock and Dam: application of torque-tubegates for flow control in a navigable spillway
682 / JOURNAL OF HYDRAULIC ENGINEERING © ASCE / OCTOBER 2010
Downloaded 19 Sep 2011 to 134.164.68.175. Redistribution subject to ASCE license or copyright. Visithttp://www.ascelibrary.org
to have a direction normal to the respective cross-sectional areas;and �=mass density of water.
Notice that the assumption of a zero hydrostatic pressure onthe segment BB� implies that this segment is taken a short dis-tance into the free jet. The approximation of a zero gauge-pressure free jet is adequate for small values of hf �Street et al.1996�.
The theorem of moment of momentum about point A, appliedto the whole control volume, produces the following equation:
P1�H
3− a sin �0� + W2
a
2�cos �0 − cos � f� + W3 · x3 + P2 · y2
− R1 · r1 − R2 · r2 = − �H
2− a sin �0�U2�AD
+ �a�sin � f − sin �0� +hf
2�u2�AB �3�
where H and hf =approach depth and the brink depth, respec-tively; �0 and � f =elevation angles of points A and B, which arethe respective ends of the circular gate AB in closed position; anda=gate radius.
Since point Q is on the circle, the following relationship issatisfied
�a cos �0 − r1�2 + �a sin �0 + r2�2 = a2 �4�
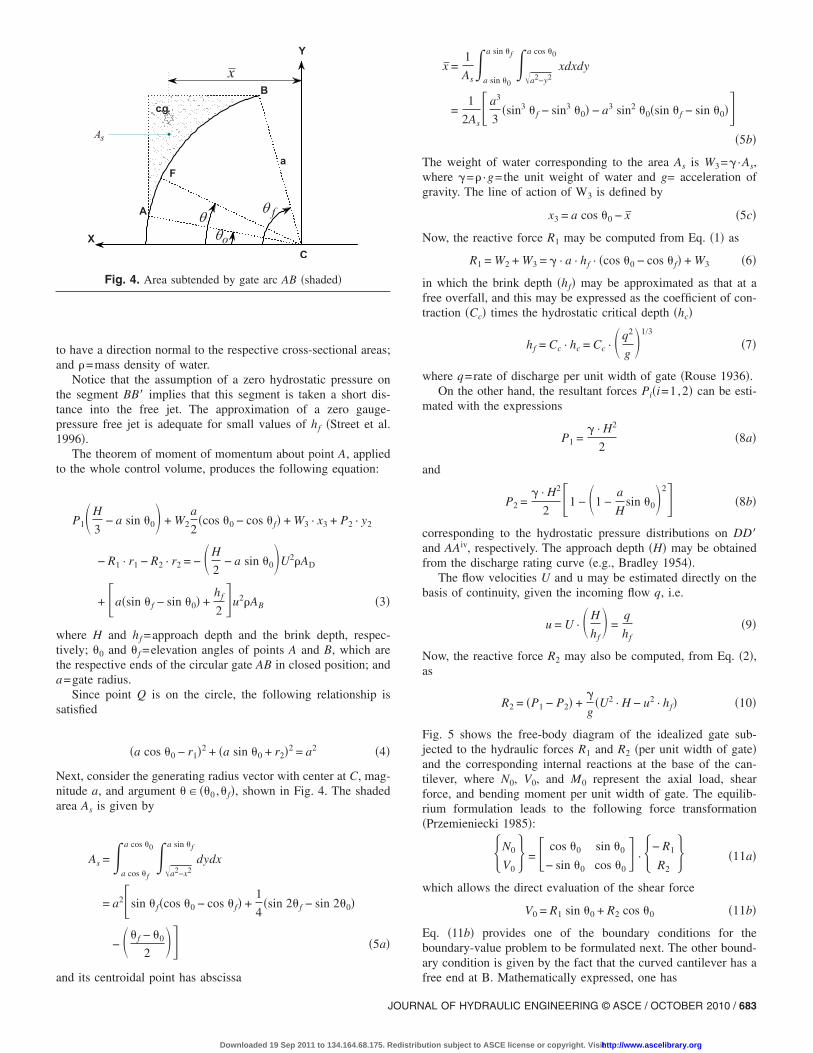
Next, consider the generating radius vector with center at C, mag-nitude a, and argument �� ��0 ,� f�, shown in Fig. 4. The shadedarea As is given by
As =�a cos �f
a cos �0 ��a2−x2
a sin �f
dydx
= a2�sin � f�cos �0 − cos � f� +1
4�sin 2� f − sin 2�0�
− �� f − �0
2�� �5a�
and its centroidal point has abscissa
x =1
As�
a sin �0
a sin �f ��a2−y2
a cos �0
xdxdy
=1
2As�a3
3�sin3 � f − sin3 �0� − a3 sin2 �0�sin � f − sin �0��
�5b�
The weight of water corresponding to the area As is W3=� ·As,where �=� ·g=the unit weight of water and g= acceleration ofgravity. The line of action of W3 is defined by
x3 = a cos �0 − x �5c�
Now, the reactive force R1 may be computed from Eq. �1� as
R1 = W2 + W3 = � · a · hf · �cos �0 − cos � f� + W3 �6�
in which the brink depth �hf� may be approximated as that at afree overfall, and this may be expressed as the coefficient of con-traction �Cc� times the hydrostatic critical depth �hc�
hf = Cc · hc = Cc · �q2
g�1/3
�7�
where q=rate of discharge per unit width of gate �Rouse 1936�.On the other hand, the resultant forces Pi�i=1,2� can be esti-
mated with the expressions
P1 =� · H2
2�8a�
and
P2 =� · H2
2�1 − �1 −
a
Hsin �0�2� �8b�
corresponding to the hydrostatic pressure distributions on DD�and AAiv, respectively. The approach depth �H� may be obtainedfrom the discharge rating curve �e.g., Bradley 1954�.
The flow velocities U and u may be estimated directly on thebasis of continuity, given the incoming flow q, i.e.
u = U · �H
hf� =
q
hf�9�
Now, the reactive force R2 may also be computed, from Eq. �2�,as
R2 = �P1 − P2� +�
g�U2 · H − u2 · hf� �10�
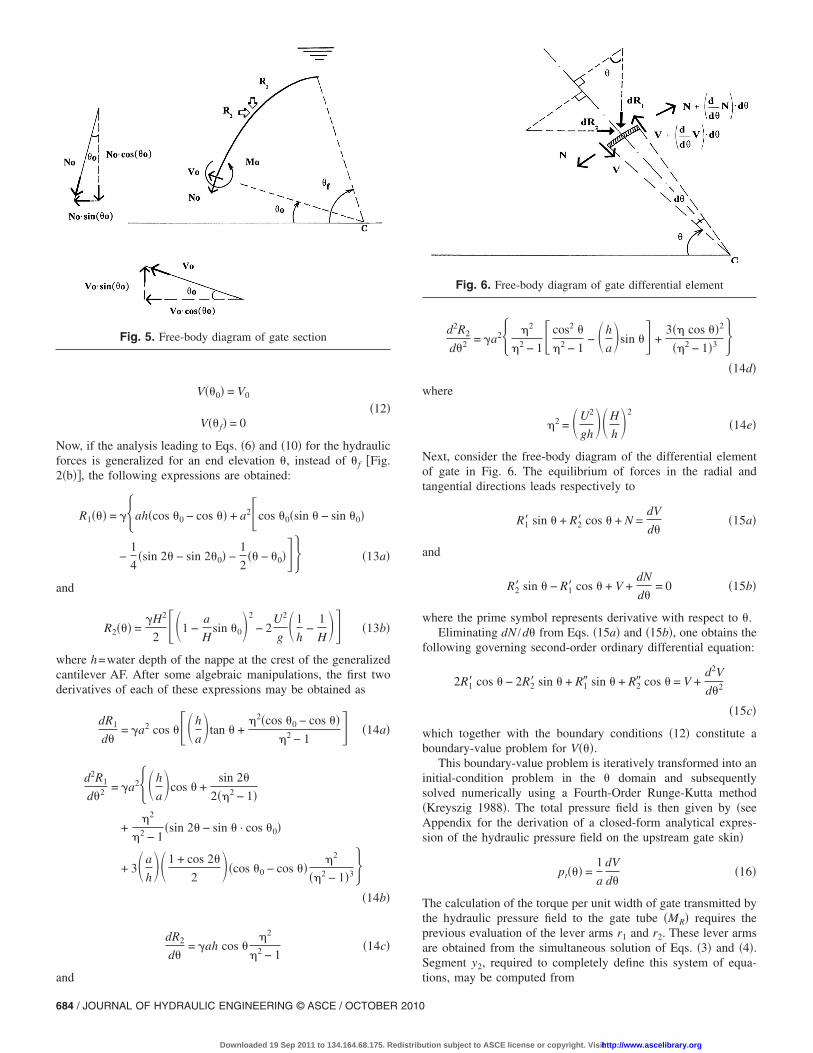
Fig. 5 shows the free-body diagram of the idealized gate sub-jected to the hydraulic forces R1 and R2 �per unit width of gate�and the corresponding internal reactions at the base of the can-tilever, where N0, V0, and M0 represent the axial load, shearforce, and bending moment per unit width of gate. The equilib-rium formulation leads to the following force transformation�Przemieniecki 1985�:
N0
V0 = � cos �0 sin �0
− sin �0 cos �0� · − R1
R2 �11a�
which allows the direct evaluation of the shear force
V0 = R1 sin �0 + R2 cos �0 �11b�
Eq. �11b� provides one of the boundary conditions for theboundary-value problem to be formulated next. The other bound-ary condition is given by the fact that the curved cantilever has afree end at B. Mathematically expressed, one has
?????
X
Y
a
C
A
B
F
x
sA
c.g.
o
f
Fig. 4. Area subtended by gate arc AB �shaded�
JOURNAL OF HYDRAULIC ENGINEERING © ASCE / OCTOBER 2010 / 683
Downloaded 19 Sep 2011 to 134.164.68.175. Redistribution subject to ASCE license or copyright. Visithttp://www.ascelibrary.org
V��0� = V0
�12�V�� f� = 0
Now, if the analysis leading to Eqs. �6� and �10� for the hydraulicforces is generalized for an end elevation �, instead of � f �Fig.2�b��, the following expressions are obtained:
R1��� = �ah�cos �0 − cos �� + a2�cos �0�sin � − sin �0�
−1
4�sin 2� − sin 2�0� −
1
2�� − �0�� �13a�
and
R2��� =�H2
2��1 −
a
Hsin �0�2
− 2U2
g�1
h−
1
H�� �13b�
where h=water depth of the nappe at the crest of the generalizedcantilever AF. After some algebraic manipulations, the first twoderivatives of each of these expressions may be obtained as
dR1
d�= �a2 cos ���h
a�tan � +
�2�cos �0 − cos ���2 − 1
� �14a�
d2R1
d�2 = �a2�h
a�cos � +
sin 2�
2��2 − 1�
+�2
�2 − 1�sin 2� − sin � · cos �0�
+ 3�a
h��1 + cos 2�
2��cos �0 − cos ��
�2
��2 − 1�3�14b�
dR2
d�= �ah cos �
�2
�2 − 1�14c�
and
d2R2
d�2 = �a2 �2
�2 − 1� cos2 �
�2 − 1− �h
a�sin �� +
3�� cos ��2
��2 − 1�3 �14d�
where
�2 = �U2
gh��H
h�2
�14e�
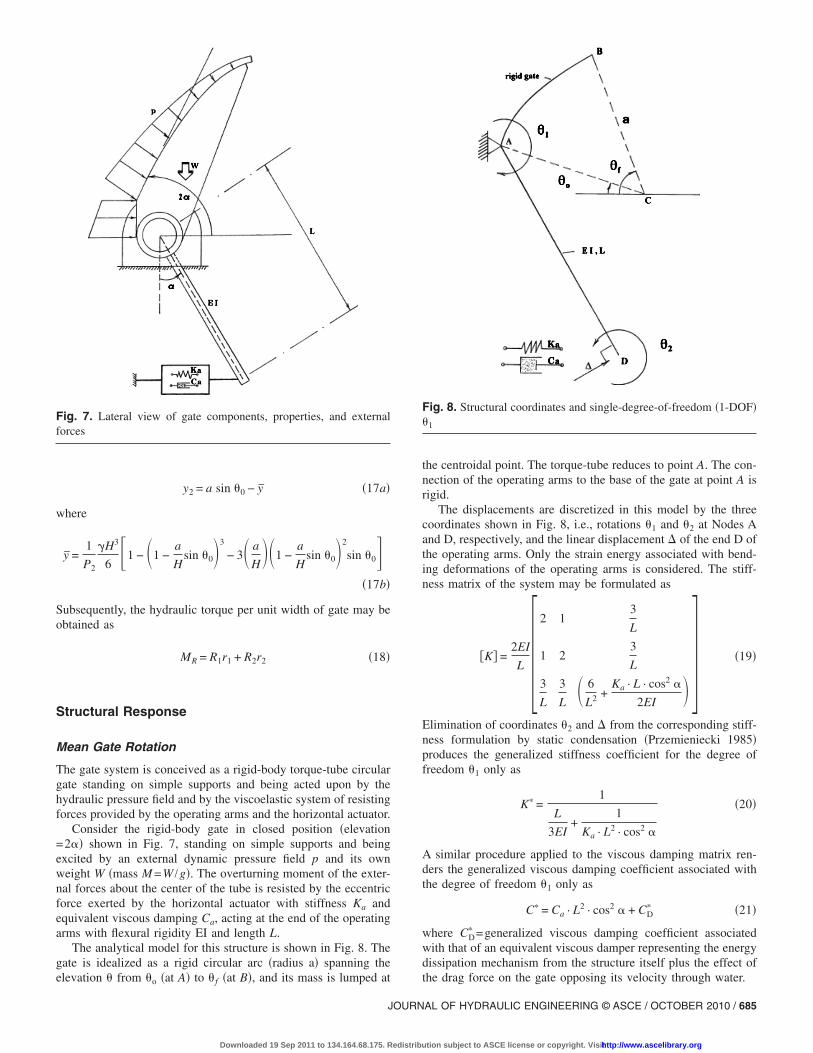
Next, consider the free-body diagram of the differential elementof gate in Fig. 6. The equilibrium of forces in the radial andtangential directions leads respectively to
R1� sin � + R2� cos � + N =dV
d��15a�
and
R2� sin � − R1� cos � + V +dN
d�= 0 �15b�
where the prime symbol represents derivative with respect to �.Eliminating dN /d� from Eqs. �15a� and �15b�, one obtains the
following governing second-order ordinary differential equation:
2R1� cos � − 2R2� sin � + R1� sin � + R2� cos � = V +d2V
d�2
�15c�
which together with the boundary conditions �12� constitute aboundary-value problem for V���.
This boundary-value problem is iteratively transformed into aninitial-condition problem in the � domain and subsequentlysolved numerically using a Fourth-Order Runge-Kutta method�Kreyszig 1988�. The total pressure field is then given by �seeAppendix for the derivation of a closed-form analytical expres-sion of the hydraulic pressure field on the upstream gate skin�
pt��� =1
a
dV
d��16�
The calculation of the torque per unit width of gate transmitted bythe hydraulic pressure field to the gate tube �MR� requires theprevious evaluation of the lever arms r1 and r2. These lever armsare obtained from the simultaneous solution of Eqs. �3� and �4�.Segment y2, required to completely define this system of equa-tions, may be computed from
Fig. 5. Free-body diagram of gate section
Fig. 6. Free-body diagram of gate differential element
684 / JOURNAL OF HYDRAULIC ENGINEERING © ASCE / OCTOBER 2010
Downloaded 19 Sep 2011 to 134.164.68.175. Redistribution subject to ASCE license or copyright. Visithttp://www.ascelibrary.org
y2 = a sin �0 − y �17a�
where
y =1
P2
�H3
6�1 − �1 −
a
Hsin �0�3
− 3� a
H��1 −
a
Hsin �0�2
sin �0��17b�
Subsequently, the hydraulic torque per unit width of gate may beobtained as
MR = R1r1 + R2r2 �18�
Structural Response
Mean Gate Rotation
The gate system is conceived as a rigid-body torque-tube circulargate standing on simple supports and being acted upon by thehydraulic pressure field and by the viscoelastic system of resistingforces provided by the operating arms and the horizontal actuator.
Consider the rigid-body gate in closed position �elevation=2�� shown in Fig. 7, standing on simple supports and beingexcited by an external dynamic pressure field p and its ownweight W �mass M =W /g�. The overturning moment of the exter-nal forces about the center of the tube is resisted by the eccentricforce exerted by the horizontal actuator with stiffness Ka andequivalent viscous damping Ca, acting at the end of the operatingarms with flexural rigidity EI and length L.
The analytical model for this structure is shown in Fig. 8. Thegate is idealized as a rigid circular arc �radius a� spanning theelevation � from �o �at A� to � f �at B�, and its mass is lumped at
the centroidal point. The torque-tube reduces to point A. The con-nection of the operating arms to the base of the gate at point A isrigid.
The displacements are discretized in this model by the threecoordinates shown in Fig. 8, i.e., rotations �1 and �2 at Nodes Aand D, respectively, and the linear displacement � of the end D ofthe operating arms. Only the strain energy associated with bend-ing deformations of the operating arms is considered. The stiff-ness matrix of the system may be formulated as
�K� =2EI
L 2 1
3
L
1 23
L
3
L
3
L� 6
L2 +Ka · L · cos2 �
2EI� � �19�
Elimination of coordinates �2 and � from the corresponding stiff-ness formulation by static condensation �Przemieniecki 1985�produces the generalized stiffness coefficient for the degree offreedom �1 only as
K� =1
L
3EI+
1
Ka · L2 · cos2 �
�20�
A similar procedure applied to the viscous damping matrix ren-ders the generalized viscous damping coefficient associated withthe degree of freedom �1 only as
C� = Ca · L2 · cos2 � + CD� �21�
where CD� =generalized viscous damping coefficient associated
with that of an equivalent viscous damper representing the energydissipation mechanism from the structure itself plus the effect ofthe drag force on the gate opposing its velocity through water.
Fig. 7. Lateral view of gate components, properties, and externalforces
Fig. 8. Structural coordinates and single-degree-of-freedom �1-DOF��1
JOURNAL OF HYDRAULIC ENGINEERING © ASCE / OCTOBER 2010 / 685
Downloaded 19 Sep 2011 to 134.164.68.175. Redistribution subject to ASCE license or copyright. Visithttp://www.ascelibrary.org
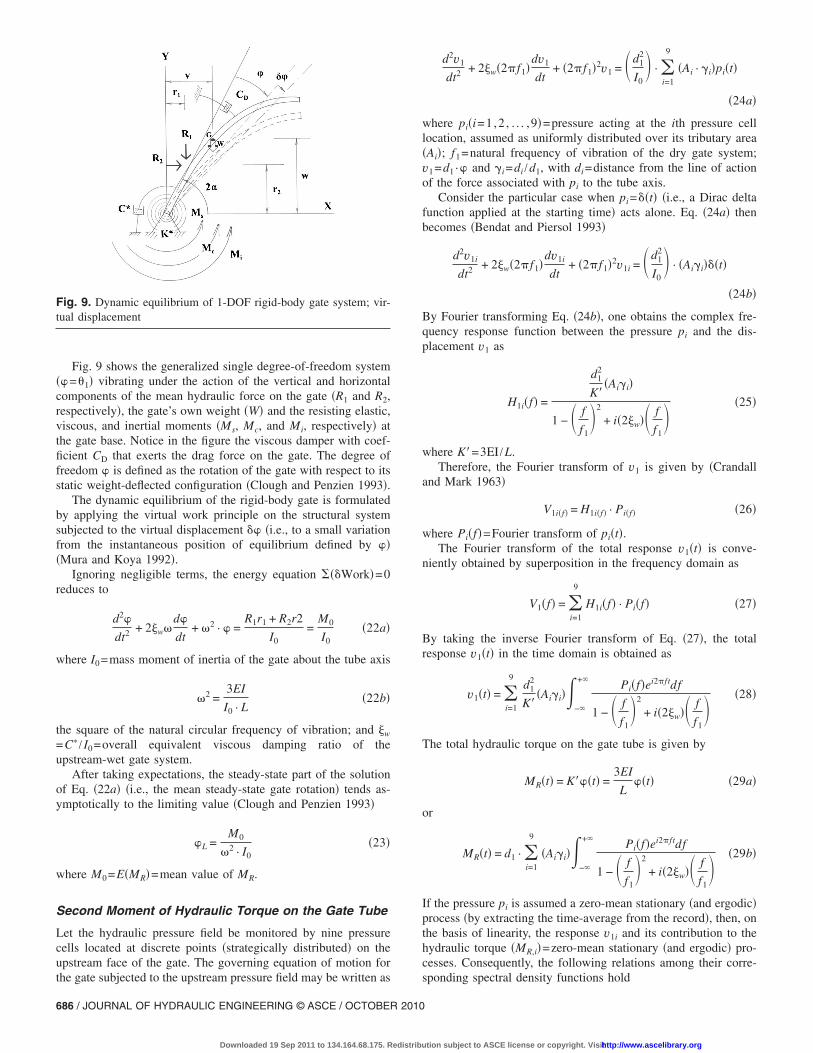
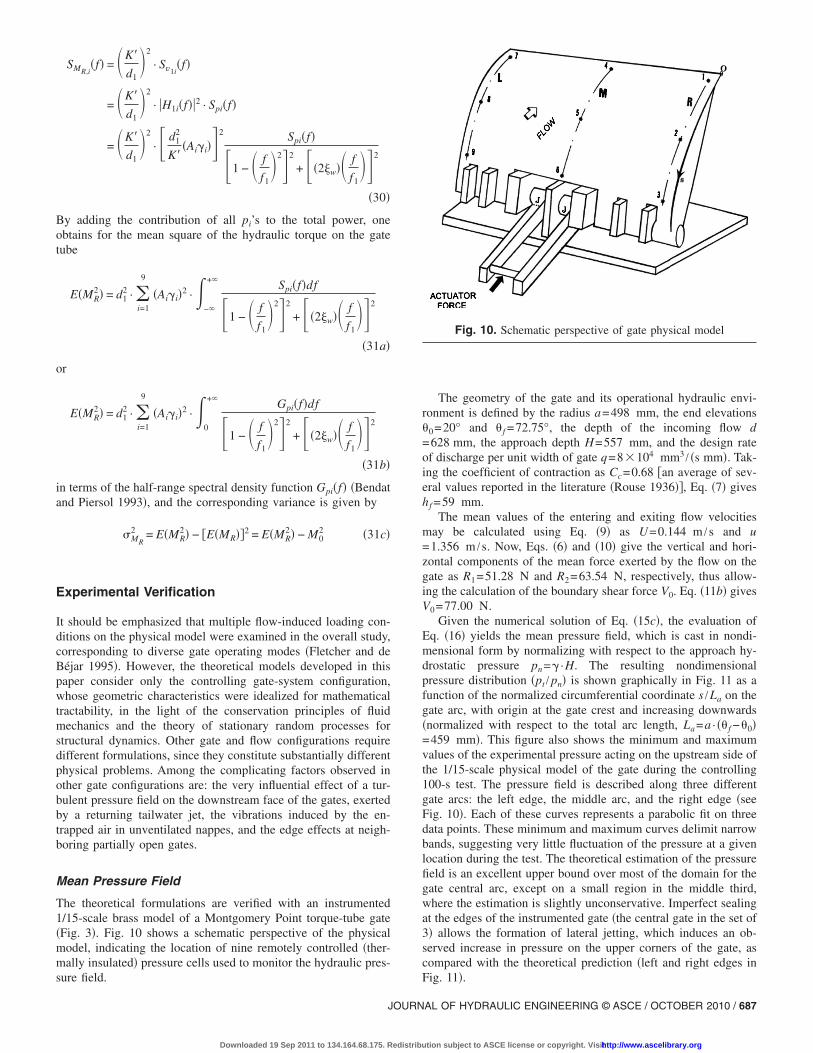
Fig. 9 shows the generalized single degree-of-freedom system��=�1� vibrating under the action of the vertical and horizontalcomponents of the mean hydraulic force on the gate �R1 and R2,respectively�, the gate’s own weight �W� and the resisting elastic,viscous, and inertial moments �Ms, Mc, and Mi, respectively� atthe gate base. Notice in the figure the viscous damper with coef-ficient CD that exerts the drag force on the gate. The degree offreedom � is defined as the rotation of the gate with respect to itsstatic weight-deflected configuration �Clough and Penzien 1993�.
The dynamic equilibrium of the rigid-body gate is formulatedby applying the virtual work principle on the structural systemsubjected to the virtual displacement �� �i.e., to a small variationfrom the instantaneous position of equilibrium defined by ���Mura and Koya 1992�.
Ignoring negligible terms, the energy equation ��Work�=0reduces to
d2�
dt2 + 2w�d�
dt+ �2 · � =
R1r1 + R2r2
I0=
M0
I0�22a�
where I0=mass moment of inertia of the gate about the tube axis
�2 =3EI
I0 · L�22b�
the square of the natural circular frequency of vibration; and w
=C� / I0=overall equivalent viscous damping ratio of theupstream-wet gate system.
After taking expectations, the steady-state part of the solutionof Eq. �22a� �i.e., the mean steady-state gate rotation� tends as-ymptotically to the limiting value �Clough and Penzien 1993�
�L =M0
�2 · I0�23�
where M0=E�MR�=mean value of MR.
Second Moment of Hydraulic Torque on the Gate Tube
Let the hydraulic pressure field be monitored by nine pressurecells located at discrete points �strategically distributed� on theupstream face of the gate. The governing equation of motion forthe gate subjected to the upstream pressure field may be written as
d2v1
dt2 + 2w�2�f1�dv1
dt+ �2�f1�2v1 = �d1
2
I0� · �
i=1
9
�Ai · �i�pi�t�
�24a�
where pi�i=1,2 , . . . ,9�=pressure acting at the ith pressure celllocation, assumed as uniformly distributed over its tributary area�Ai�; f1=natural frequency of vibration of the dry gate system;v1=d1 ·� and �i=di /d1, with di=distance from the line of actionof the force associated with pi to the tube axis.
Consider the particular case when pi=��t� �i.e., a Dirac deltafunction applied at the starting time� acts alone. Eq. �24a� thenbecomes �Bendat and Piersol 1993�
d2v1i
dt2 + 2w�2�f1�dv1i
dt+ �2�f1�2v1i = �d1
2
I0� · �Ai�i���t�
�24b�
By Fourier transforming Eq. �24b�, one obtains the complex fre-quency response function between the pressure pi and the dis-placement v1 as
H1i�f� =
d12
K��Ai�i�
1 − � f
f1�2
+ i�2w�� f
f1� �25�
where K�=3EI /L.Therefore, the Fourier transform of v1 is given by �Crandall
and Mark 1963�
V1i�f� = H1i�f� · Pi�f� �26�
where Pi�f�=Fourier transform of pi�t�.The Fourier transform of the total response v1�t� is conve-
niently obtained by superposition in the frequency domain as
V1�f� = �i=1
9
H1i�f� · Pi�f� �27�
By taking the inverse Fourier transform of Eq. �27�, the totalresponse v1�t� in the time domain is obtained as
v1�t� = �i=1
9d1
2
K��Ai�i��
−
+ Pi�f�ei2�ftdf
1 − � f
f1�2
+ i�2w�� f
f1� �28�
The total hydraulic torque on the gate tube is given by
MR�t� = K���t� =3EI
L��t� �29a�
or
MR�t� = d1 · �i=1
9
�Ai�i��−
+ Pi�f�ei2�ftdf
1 − � f
f1�2
+ i�2w�� f
f1� �29b�
If the pressure pi is assumed a zero-mean stationary �and ergodic�process �by extracting the time-average from the record�, then, onthe basis of linearity, the response v1i and its contribution to thehydraulic torque �MR,i�=zero-mean stationary �and ergodic� pro-cesses. Consequently, the following relations among their corre-sponding spectral density functions hold
Fig. 9. Dynamic equilibrium of 1-DOF rigid-body gate system; vir-tual displacement
686 / JOURNAL OF HYDRAULIC ENGINEERING © ASCE / OCTOBER 2010
Downloaded 19 Sep 2011 to 134.164.68.175. Redistribution subject to ASCE license or copyright. Visithttp://www.ascelibrary.org
SMR,i�f� = �K�
d1�2
· Sv1i�f�
= �K�
d1�2
· �H1i�f��2 · Spi�f�
= �K�
d1�2
· � d12
K��Ai�i��2 Spi�f�
�1 − � f
f1�2�2
+ ��2w�� f
f1��2
�30�
By adding the contribution of all pi’s to the total power, oneobtains for the mean square of the hydraulic torque on the gatetube
E�MR2� = d1
2 · �i=1
9
�Ai�i�2 ·�−
+ Spi�f�df
�1 − � f
f1�2�2
+ ��2w�� f
f1��2
�31a�
or
E�MR2� = d1
2 · �i=1
9
�Ai�i�2 ·�0
+ Gpi�f�df
�1 − � f
f1�2�2
+ ��2w�� f
f1��2
�31b�
in terms of the half-range spectral density function Gpi�f� �Bendatand Piersol 1993�, and the corresponding variance is given by
�MR
2 = E�MR2� − �E�MR��2 = E�MR
2� − M02 �31c�
Experimental Verification
It should be emphasized that multiple flow-induced loading con-ditions on the physical model were examined in the overall study,corresponding to diverse gate operating modes �Fletcher and deBéjar 1995�. However, the theoretical models developed in thispaper consider only the controlling gate-system configuration,whose geometric characteristics were idealized for mathematicaltractability, in the light of the conservation principles of fluidmechanics and the theory of stationary random processes forstructural dynamics. Other gate and flow configurations requiredifferent formulations, since they constitute substantially differentphysical problems. Among the complicating factors observed inother gate configurations are: the very influential effect of a tur-bulent pressure field on the downstream face of the gates, exertedby a returning tailwater jet, the vibrations induced by the en-trapped air in unventilated nappes, and the edge effects at neigh-boring partially open gates.
Mean Pressure Field
The theoretical formulations are verified with an instrumented1/15-scale brass model of a Montgomery Point torque-tube gate�Fig. 3�. Fig. 10 shows a schematic perspective of the physicalmodel, indicating the location of nine remotely controlled �ther-mally insulated� pressure cells used to monitor the hydraulic pres-sure field.
The geometry of the gate and its operational hydraulic envi-ronment is defined by the radius a=498 mm, the end elevations�0=20° and � f =72.75°, the depth of the incoming flow d=628 mm, the approach depth H=557 mm, and the design rateof discharge per unit width of gate q=8�104 mm3 / �s mm�. Tak-ing the coefficient of contraction as Cc=0.68 �an average of sev-eral values reported in the literature �Rouse 1936��, Eq. �7� giveshf =59 mm.
The mean values of the entering and exiting flow velocitiesmay be calculated using Eq. �9� as U=0.144 m /s and u=1.356 m /s. Now, Eqs. �6� and �10� give the vertical and hori-zontal components of the mean force exerted by the flow on thegate as R1=51.28 N and R2=63.54 N, respectively, thus allow-ing the calculation of the boundary shear force V0. Eq. �11b� givesV0=77.00 N.
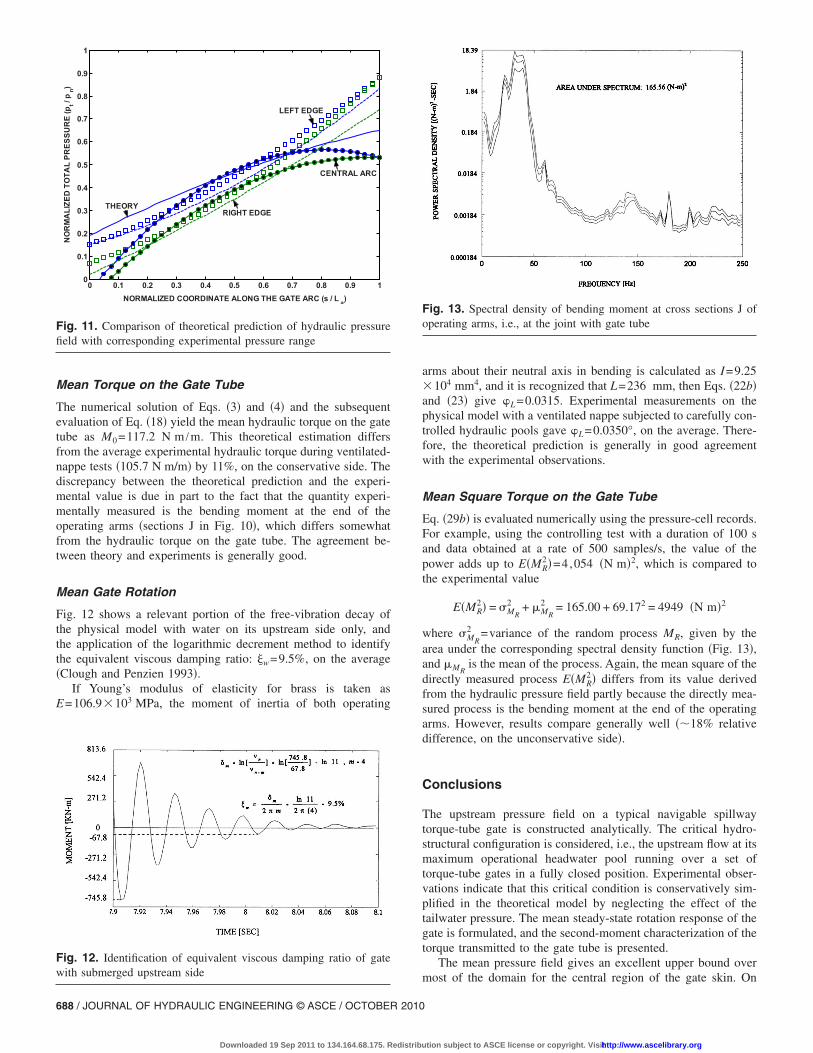
Given the numerical solution of Eq. �15c�, the evaluation ofEq. �16� yields the mean pressure field, which is cast in nondi-mensional form by normalizing with respect to the approach hy-drostatic pressure pn=� ·H. The resulting nondimensionalpressure distribution �pt / pn� is shown graphically in Fig. 11 as afunction of the normalized circumferential coordinate s /La on thegate arc, with origin at the gate crest and increasing downwards�normalized with respect to the total arc length, La=a · �� f −�0�=459 mm�. This figure also shows the minimum and maximumvalues of the experimental pressure acting on the upstream side ofthe 1/15-scale physical model of the gate during the controlling100-s test. The pressure field is described along three differentgate arcs: the left edge, the middle arc, and the right edge �seeFig. 10�. Each of these curves represents a parabolic fit on threedata points. These minimum and maximum curves delimit narrowbands, suggesting very little fluctuation of the pressure at a givenlocation during the test. The theoretical estimation of the pressurefield is an excellent upper bound over most of the domain for thegate central arc, except on a small region in the middle third,where the estimation is slightly unconservative. Imperfect sealingat the edges of the instrumented gate �the central gate in the set of3� allows the formation of lateral jetting, which induces an ob-served increase in pressure on the upper corners of the gate, ascompared with the theoretical prediction �left and right edges inFig. 11�.
Fig. 10. Schematic perspective of gate physical model
JOURNAL OF HYDRAULIC ENGINEERING © ASCE / OCTOBER 2010 / 687
Downloaded 19 Sep 2011 to 134.164.68.175. Redistribution subject to ASCE license or copyright. Visithttp://www.ascelibrary.org
Mean Torque on the Gate Tube
The numerical solution of Eqs. �3� and �4� and the subsequentevaluation of Eq. �18� yield the mean hydraulic torque on the gatetube as M0=117.2 N m /m. This theoretical estimation differsfrom the average experimental hydraulic torque during ventilated-nappe tests �105.7 N m/m� by 11%, on the conservative side. Thediscrepancy between the theoretical prediction and the experi-mental value is due in part to the fact that the quantity experi-mentally measured is the bending moment at the end of theoperating arms �sections J in Fig. 10�, which differs somewhatfrom the hydraulic torque on the gate tube. The agreement be-tween theory and experiments is generally good.
Mean Gate Rotation
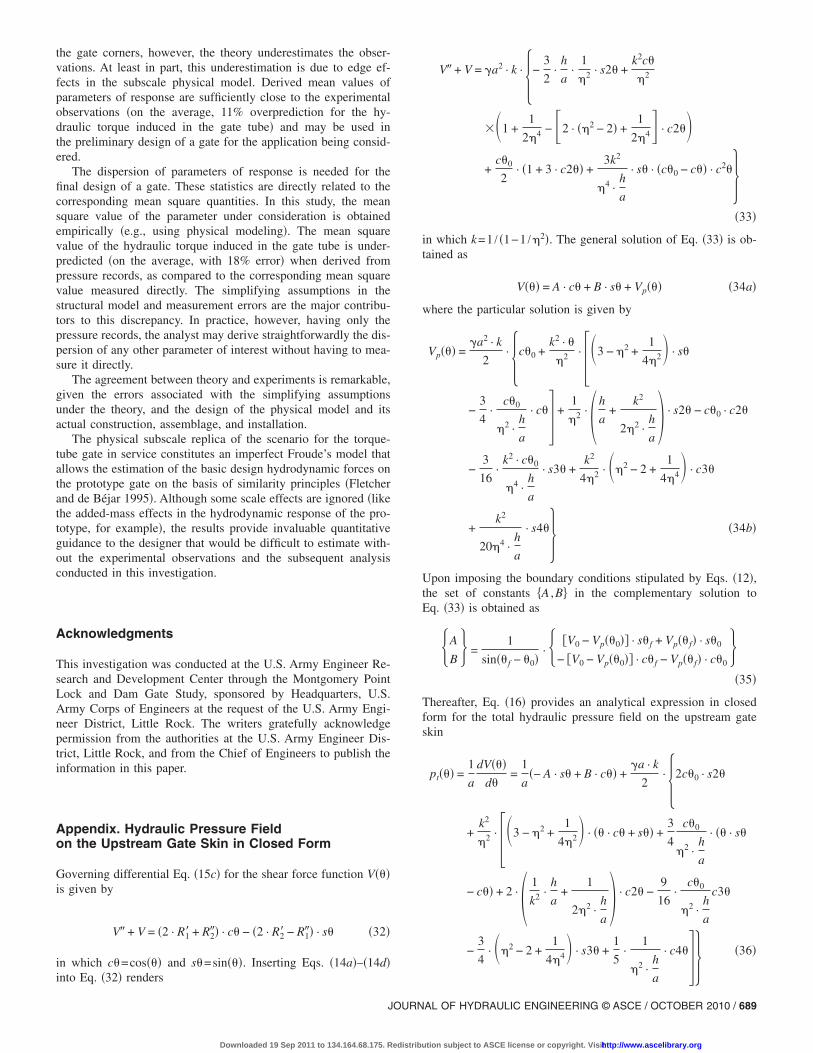
Fig. 12 shows a relevant portion of the free-vibration decay ofthe physical model with water on its upstream side only, andthe application of the logarithmic decrement method to identifythe equivalent viscous damping ratio: w=9.5%, on the average�Clough and Penzien 1993�.
If Young’s modulus of elasticity for brass is taken asE=106.9�103 MPa, the moment of inertia of both operating
arms about their neutral axis in bending is calculated as I=9.25�104 mm4, and it is recognized that L=236 mm, then Eqs. �22b�and �23� give �L=0.0315. Experimental measurements on thephysical model with a ventilated nappe subjected to carefully con-trolled hydraulic pools gave �L=0.0350°, on the average. There-fore, the theoretical prediction is generally in good agreementwith the experimental observations.
Mean Square Torque on the Gate Tube
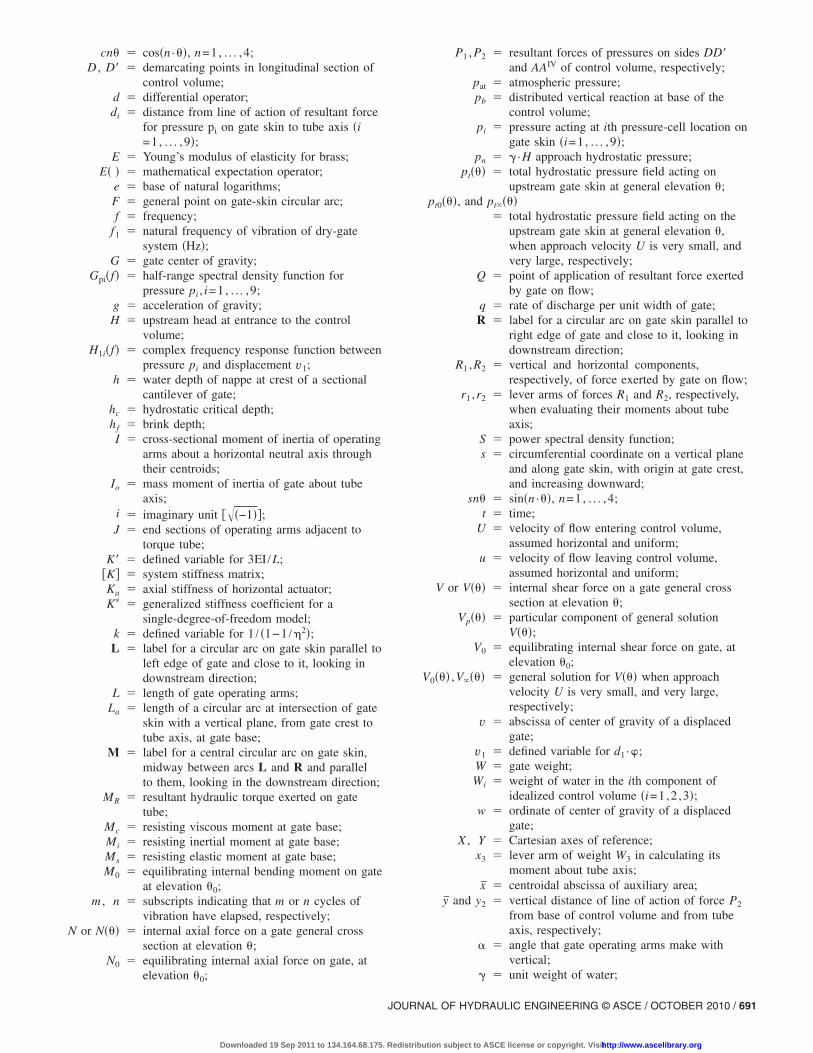
Eq. �29b� is evaluated numerically using the pressure-cell records.For example, using the controlling test with a duration of 100 sand data obtained at a rate of 500 samples/s, the value of thepower adds up to E�MR
2�=4,054 �N m�2, which is compared tothe experimental value
E�MR2� = �MR
2 + �MR
2 = 165.00 + 69.172 = 4949 �N m�2
where �MR
2 =variance of the random process MR, given by thearea under the corresponding spectral density function �Fig. 13�,and �MR
is the mean of the process. Again, the mean square of thedirectly measured process E�MR
2� differs from its value derivedfrom the hydraulic pressure field partly because the directly mea-sured process is the bending moment at the end of the operatingarms. However, results compare generally well ��18% relativedifference, on the unconservative side�.
Conclusions
The upstream pressure field on a typical navigable spillwaytorque-tube gate is constructed analytically. The critical hydro-structural configuration is considered, i.e., the upstream flow at itsmaximum operational headwater pool running over a set oftorque-tube gates in a fully closed position. Experimental obser-vations indicate that this critical condition is conservatively sim-plified in the theoretical model by neglecting the effect of thetailwater pressure. The mean steady-state rotation response of thegate is formulated, and the second-moment characterization of thetorque transmitted to the gate tube is presented.
The mean pressure field gives an excellent upper bound overmost of the domain for the central region of the gate skin. On
0 0.1 0.2 0.3 0.4 0.5 0.6 0.7 0.8 0.9 10
0.1
0.2
0.3
0.4
0.5
0.6
0.7
0.8
0.9
1
NORMALIZED COORDINATE ALONG THE GATE ARC (s / L a)
NORMALIZEDTOTALPRESSURE(pt/pn)
THEORY
LEFT EDGE
RIGHT EDGE
CENTRAL ARC
Fig. 11. Comparison of theoretical prediction of hydraulic pressurefield with corresponding experimental pressure range
Fig. 12. Identification of equivalent viscous damping ratio of gatewith submerged upstream side
Fig. 13. Spectral density of bending moment at cross sections J ofoperating arms, i.e., at the joint with gate tube
688 / JOURNAL OF HYDRAULIC ENGINEERING © ASCE / OCTOBER 2010
Downloaded 19 Sep 2011 to 134.164.68.175. Redistribution subject to ASCE license or copyright. Visithttp://www.ascelibrary.org
the gate corners, however, the theory underestimates the obser-vations. At least in part, this underestimation is due to edge ef-fects in the subscale physical model. Derived mean values ofparameters of response are sufficiently close to the experimentalobservations �on the average, 11% overprediction for the hy-draulic torque induced in the gate tube� and may be used inthe preliminary design of a gate for the application being consid-ered.
The dispersion of parameters of response is needed for thefinal design of a gate. These statistics are directly related to thecorresponding mean square quantities. In this study, the meansquare value of the parameter under consideration is obtainedempirically �e.g., using physical modeling�. The mean squarevalue of the hydraulic torque induced in the gate tube is under-predicted �on the average, with 18% error� when derived frompressure records, as compared to the corresponding mean squarevalue measured directly. The simplifying assumptions in thestructural model and measurement errors are the major contribu-tors to this discrepancy. In practice, however, having only thepressure records, the analyst may derive straightforwardly the dis-persion of any other parameter of interest without having to mea-sure it directly.
The agreement between theory and experiments is remarkable,given the errors associated with the simplifying assumptionsunder the theory, and the design of the physical model and itsactual construction, assemblage, and installation.
The physical subscale replica of the scenario for the torque-tube gate in service constitutes an imperfect Froude’s model thatallows the estimation of the basic design hydrodynamic forces onthe prototype gate on the basis of similarity principles �Fletcherand de Béjar 1995�. Although some scale effects are ignored �likethe added-mass effects in the hydrodynamic response of the pro-totype, for example�, the results provide invaluable quantitativeguidance to the designer that would be difficult to estimate with-out the experimental observations and the subsequent analysisconducted in this investigation.
Acknowledgments
This investigation was conducted at the U.S. Army Engineer Re-search and Development Center through the Montgomery PointLock and Dam Gate Study, sponsored by Headquarters, U.S.Army Corps of Engineers at the request of the U.S. Army Engi-neer District, Little Rock. The writers gratefully acknowledgepermission from the authorities at the U.S. Army Engineer Dis-trict, Little Rock, and from the Chief of Engineers to publish theinformation in this paper.
Appendix. Hydraulic Pressure Fieldon the Upstream Gate Skin in Closed Form
Governing differential Eq. �15c� for the shear force function V���is given by
V� + V = �2 · R1� + R2�� · c� − �2 · R2� − R1�� · s� �32�
in which c�=cos��� and s�=sin���. Inserting Eqs. �14a�–�14d�into Eq. �32� renders
V� + V = �a2 · k · �−3
2·
h
a·
1
�2 · s2� +k2c�
�2
��1 +1
2�4 − �2 · ��2 − 2� +1
2�4� · c2��+
c�0
2· �1 + 3 · c2�� +
3k2
�4 ·h
a
· s� · �c�0 − c�� · c2���33�
in which k=1 / �1−1 /�2�. The general solution of Eq. �33� is ob-tained as
V��� = A · c� + B · s� + Vp��� �34a�
where the particular solution is given by
Vp��� =�a2 · k
2· �c�0 +
k2 · �
�2 · �3 − �2 +1
4�2� · s�
−3
4·
c�0
�2 ·h
a
· c�� +1
�2 · �h
a+
k2
2�2 ·h
a� · s2� − c�0 · c2�
−3
16·
k2 · c�0
�4 ·h
a
· s3� +k2
4�2 · ��2 − 2 +1
4�4� · c3�
+k2
20�4 ·h
a
· s4�� �34b�
Upon imposing the boundary conditions stipulated by Eqs. �12�,the set of constants �A ,B� in the complementary solution toEq. �33� is obtained as
A
B =
1
sin�� f − �0�· �V0 − Vp��0�� · s� f + Vp�� f� · s�0
− �V0 − Vp��0�� · c� f − Vp�� f� · c�0�35�
Thereafter, Eq. �16� provides an analytical expression in closedform for the total hydraulic pressure field on the upstream gateskin
pt��� =1
a
dV���d�
=1
a�− A · s� + B · c�� +
�a · k
2· �2c�0 · s2�
+k2
�2 · �3 − �2 +1
4�2� · �� · c� + s�� +3
4
c�0
�2 ·h
a
· �� · s�
− c�� + 2 · � 1
k2 ·h
a+
1
2�2 ·h
a� · c2� −
9
16·
c�0
�2 ·h
a
c3�
−3
4· ��2 − 2 +
1
4�4� · s3� +1
5·
1
�2 ·h
a
· c4��� �36�
JOURNAL OF HYDRAULIC ENGINEERING © ASCE / OCTOBER 2010 / 689
Downloaded 19 Sep 2011 to 134.164.68.175. Redistribution subject to ASCE license or copyright. Visithttp://www.ascelibrary.org

When the approach velocity U is very large �U→ �, Eq. �33� forthe shear force function V��� reduces to
V� + V = − �a2 · −c�0
2+ c� −
3
2· c�0 · c2� + c3� �37�
with the general solution
V ��� = A · c� + �B −�a2
2· �� · s� + �a2 · �c�0 · s2� +
1
8· c3��
�38�
Upon imposing the boundary conditions stipulated by Eqs. �12�,the set of constants �A ,B � in the complementary solution toEq. �37� is obtained as
A
B =
1
sin�� f − �0�· � V0 · s� f −
�a2
2· �s�0 · s� f · �� f − �0 − 2c�0 · �s� f − s�0�� +
1
4�s� f · c3�0 − s�0 · c3� f��
− V0 · c� f −�a2
2· �c�0 · s� f · �2s� f · c�0 − � f� − c� f · s�0 · �s2�0 − �0� +
1
4�c�0 · c3� f − c� f · c3�0�� � �39�
Thereafter, Eq. �16� provides an analytical expression in closed form for the total hydraulic pressure field on the upstream gate skin, asU→
pt ��� =1
a
dV ���d�
=1
a�− A · s� + B · c�� +
�a
2· �− � · c� − s� + 2c�0 · s2� −
3
4· s3�� �40�
Similarly, when the approach velocity U is very small �U→0�, Eq. �33� for the shear force function V��� reduces to
V� + V =�a2
2· 3
h
a· s2� −
1
2c� +
1
2c3� �41�
with the general solution
Vo��� = Ao · c� + Bo · s� −�a2
8· �� · s� + 4
h
a· s2� +
1
4· c3�� �42�
Upon imposing the boundary conditions stipulated by Eqs. �12�, the set of constants �Ao ,Bo� in the complementary solution to Eq. �41�is obtained as
Ao
Bo =
1
sin�� f − �0�· � V0 · s� f +
�a2
8· �s� f · ��0 · s�0 + 4
h
a· s2�0 +
1
4· c3�0� − s�0 · �� f · s� f + 4
h
a· s2� f +
1
4· c3� f��
− V0 · c� f +�a2
8· �− c� f · ��0 · s�0 + 4
h
a· s2�0 +
1
4· c3�0� + c�0 · �� f · s� f + 4
h
a· s2� f +
1
4· c3� f�� � �43�
Thereafter, Eq. �16� provides an analytical expression in closed form for the total hydraulic pressure field on the upstream gate skin, asU→0
pto��� =1
a
dVo���d�
=1
a�− Ao · s� + Bo · c�� −
�a2
8· �� · c� + s� + 8
h
a· c2� −
3
4· s3�� �44�
Notation
The following symbols are used in this paper:
Ai � tributary area for the ith pressure-celllocation;
As � auxiliary area �shaded in Fig. 4�;AB ,AD � cross sectional areas of control volume at
Locations B and D, respectively;A ,A� ,A� ,A� ,AIV
� demarcating points in longitudinal section ofcontrol volume;
�A ,B� � set of two integration constants;�A0 ,B0� � set of two integration constants when
approach velocity is very small;�A ,B � � set of two integration constants when
approach velocity is very large;
a � gate radius;B , B� � demarcating points in the longitudinal section
of control volume;C � center of gate-skin circular arc;
CD � equivalent viscous damping coefficient fordrag force on gate;
Ca � equivalent viscous damping coefficient forhorizontal actuator;
Cc � coefficient of contraction;C� � generalized overall viscous damping
coefficient for a single-degree-of-freedommodel;
CD� � generalized viscous damping coefficient for
internal energy dissipation mechanism ofgate structure combined with effect of dragforce;
690 / JOURNAL OF HYDRAULIC ENGINEERING © ASCE / OCTOBER 2010
Downloaded 19 Sep 2011 to 134.164.68.175. Redistribution subject to ASCE license or copyright. Visithttp://www.ascelibrary.org
cn� � cos�n ·��, n=1, . . . ,4;D , D� � demarcating points in longitudinal section of
control volume;d � differential operator;di � distance from line of action of resultant force
for pressure pi on gate skin to tube axis �i=1, . . . ,9�;
E � Young’s modulus of elasticity for brass;E� � � mathematical expectation operator;
e � base of natural logarithms;F � general point on gate-skin circular arc;f � frequency;
f1 � natural frequency of vibration of dry-gatesystem �Hz�;
G � gate center of gravity;Gpi�f� � half-range spectral density function for
pressure pi , i=1, . . . ,9;g � acceleration of gravity;H � upstream head at entrance to the control
volume;H1i�f� � complex frequency response function between
pressure pi and displacement v1;h � water depth of nappe at crest of a sectional
cantilever of gate;hc � hydrostatic critical depth;hf � brink depth;I � cross-sectional moment of inertia of operating
arms about a horizontal neutral axis throughtheir centroids;
Io � mass moment of inertia of gate about tubeaxis;
i � imaginary unit ���−1��;J � end sections of operating arms adjacent to
torque tube;K� � defined variable for 3EI /L;
�K� � system stiffness matrix;Ka � axial stiffness of horizontal actuator;K� � generalized stiffness coefficient for a
single-degree-of-freedom model;k � defined variable for 1 / �1−1 /�2�;L � label for a circular arc on gate skin parallel to
left edge of gate and close to it, looking indownstream direction;
L � length of gate operating arms;La � length of a circular arc at intersection of gate
skin with a vertical plane, from gate crest totube axis, at gate base;
M � label for a central circular arc on gate skin,midway between arcs L and R and parallelto them, looking in the downstream direction;
MR � resultant hydraulic torque exerted on gatetube;
Mc � resisting viscous moment at gate base;Mi � resisting inertial moment at gate base;Ms � resisting elastic moment at gate base;M0 � equilibrating internal bending moment on gate
at elevation �0;m , n � subscripts indicating that m or n cycles of
vibration have elapsed, respectively;N or N��� � internal axial force on a gate general cross
section at elevation �;N0 � equilibrating internal axial force on gate, at
elevation �0;
P1 , P2 � resultant forces of pressures on sides DD�and AAIV of control volume, respectively;
pat � atmospheric pressure;pb � distributed vertical reaction at base of the
control volume;pi � pressure acting at ith pressure-cell location on
gate skin �i=1, . . . ,9�;pn � � ·H approach hydrostatic pressure;
pt��� � total hydrostatic pressure field acting onupstream gate skin at general elevation �;
pt0���, and pt ���� total hydrostatic pressure field acting on the
upstream gate skin at general elevation �,when approach velocity U is very small, andvery large, respectively;
Q � point of application of resultant force exertedby gate on flow;
q � rate of discharge per unit width of gate;R � label for a circular arc on gate skin parallel to
right edge of gate and close to it, looking indownstream direction;
R1 ,R2 � vertical and horizontal components,respectively, of force exerted by gate on flow;
r1 ,r2 � lever arms of forces R1 and R2, respectively,when evaluating their moments about tubeaxis;
S � power spectral density function;s � circumferential coordinate on a vertical plane
and along gate skin, with origin at gate crest,and increasing downward;
sn� � sin�n ·��, n=1, . . . ,4;t � time;
U � velocity of flow entering control volume,assumed horizontal and uniform;
u � velocity of flow leaving control volume,assumed horizontal and uniform;
V or V��� � internal shear force on a gate general crosssection at elevation �;
Vp��� � particular component of general solutionV���;
V0 � equilibrating internal shear force on gate, atelevation �0;
V0��� ,V ��� � general solution for V��� when approachvelocity U is very small, and very large,respectively;
v � abscissa of center of gravity of a displacedgate;
v1 � defined variable for d1 ·�;W � gate weight;Wi � weight of water in the ith component of
idealized control volume �i=1,2 ,3�;w � ordinate of center of gravity of a displaced
gate;X , Y � Cartesian axes of reference;
x3 � lever arm of weight W3 in calculating itsmoment about tube axis;
x � centroidal abscissa of auxiliary area;y and y2 � vertical distance of line of action of force P2
from base of control volume and from tubeaxis, respectively;
� � angle that gate operating arms make withvertical;
� � unit weight of water;
JOURNAL OF HYDRAULIC ENGINEERING © ASCE / OCTOBER 2010 / 691
Downloaded 19 Sep 2011 to 134.164.68.175. Redistribution subject to ASCE license or copyright. Visithttp://www.ascelibrary.org
�i � defined as distance ratio di /d1 �i=1, . . . ,9�;� � displacement coordinate of end D of gate
operating arms;� � variation operator;
�m � logarithmic decrement after m cycles of freeoscillations;
��t� � Dirac delta function at time zero;� � symbol to denote “belonging to a certain set;”� � defined variable for �U ·H /h� /��g ·h�;� � angular elevation of a gate general cross
section;� f and �0 � angular elevations of gate crest and tube axis,
respectively;�1 and �2 � rotational coordinates at Ends A and D of
gate operating arms, respectively;� � symbol for mean of a random variable;
�n and �n+m � amplitude of moment after n and n+m cyclesof free oscillations, respectively;
w � overall equivalent viscous damping ratio ofupstream-wet gate system;
� � mass density of water; � symbol for summation operator;
�2 � symbol for variance of a random variable;� � natural circular frequency of vibration; and
� and �L � gate rotation and its limit value, respectively.
References
Bendat, J. S., and Piersol, A. G. �1993�. Engineering applications ofcorrelation and spectral analysis, 2nd Ed., Wiley, New York.
Bradley, J. N. �1954�. “Rating curves for flow over drum gates.” Trans.Am. Soc. Civ. Eng., 119, 403–420.
Clough, R. W., and Penzien, J. �1993�. Dynamics of structures, 2nd Ed.,McGraw-Hill, New York.
Crandall, S. H., and Mark, W. D. �1963�. Random vibration in mechani-cal systems, Academic, New York.
de Béjar, L. A. �1995�. “Montgomery Point Lock and Dam study: Report2. Montgomery point torque-tube gate—A structural model study.”Technical Rep. SL-95-14, U.S. Army Engineer Waterways ExperimentStation, Vicksburg, Miss.
Fletcher, B. P., and de Béjar, L. A. �1995�. “Montgomery Point Lock andDam study: Report 1. Hydraulic forces and characteristics acting onspillway gates.” Technical Rep. SL-95-14, U.S. Army Engineer Wa-terways Experiment Station, Vicksburg, Miss.
Kreyszig, E. �1988�. Advanced engineering mathematics, 6th Ed., JohnWiley and Sons, New York.
Mura, T., and Koya, T. �1992�. Variational methods in mechanics, OxfordUniversity Press, New York.
Naudascher, E. �1991�. Hydrodynamic forces, Balkema, Rotterdam, TheNetherlands.
Naudascher, E., and Rockwell, D. �1994�. Flow-induced vibrations: Anengineering guide, Balkema, Rotterdam, The Netherlands.
Prandtl, L., and Tietjens, O. J. �1957�. Fundamentals of hydro- and aero-mechanics, Dover Publications, Mineola, N.Y.
Przemieniecki, J. S. �1985�. Theory of matrix structural analysis, DoverPublications, Mineola, N.Y.
Rouse, H. �1936�. “Discharge characteristics of the free overfall.” CivilEngineering, ASCE, 6�4�, 257–260.
Sagar, B. T. A. �1995�. “ASCE Hydrogates task committee design guide-lines for high-head gates.” J. Hydr. Engrg., 121�12�, 845–852.
Sehgal, C. K. �1996�. “Design guidelines for spillway gates.” J. Hydr.Engrg., 122�3�, 155–165.
Sehgal, C. K., Morgan, M. J., Winters, L., and Eggburn, M. �1997�.“Montgomery Point Lock and Dam navigable pass gate equipment.”Proc., Int. Conf. on Hydropower, ASCE, Atlanta, Ga., 1016–1028.
Shames, I. H. �1995�. Mechanics of fluids, 3rd Ed., McGraw-Hill, NewYork.
Street, R., Watters, G. Z., and Vennard, J. �1996�. Elementary fluid me-chanics, 7th Ed., John Wiley and Sons, New York.
Viparro, V. J., and Hansen, H. �1993�. Davis’ handbook of applied hy-draulics, 4th Ed., McGraw-Hill, New York.
692 / JOURNAL OF HYDRAULIC ENGINEERING © ASCE / OCTOBER 2010
Downloaded 19 Sep 2011 to 134.164.68.175. Redistribution subject to ASCE license or copyright. Visithttp://www.ascelibrary.org