Embed Size (px)
Citation preview
Hydroforming Of Patchwork Blanks - Numerical Modeling And Experimental Validation
Klaus Lamprecht, Marion Merklein and Manfred Geiger
Chair of Manufacturing Technology, University of Erlangen-Nuremberg, Egerlandstrasse 11, 91058 Erlangen, Germany
Abstract. In comparison to the commonly applied technology of tailored blanks the concept of patchwork blanks offers a number of additional advantages. Potential application areas for patchwork blanks in automotive industry are e.g. local reinforcements of automotive closures, structural reinforcements of rails and pillars as well as shock towers. But even if there is a significant application potential for patchwork blanks in automobile production, industrial realization of this innovative technique is decelerated due to a lack of knowledge regarding the forming behavior and the numerical modeling of patchwork blanks. Especially for the numerical simulation of hydroforming processes, where one part of the forming tool is replaced by a fluid under pressure, advanced modeling techniques are required to ensure an accurate prediction of the blanks’ forming behavior. The objective of this contribution is to provide an appropriate model for the numerical simulation of patchwork blanks’ forming processes. Therefore, different finite element modeling techniques for patchwork blanks are presented. In addition to basic shell element models a combined finite element model consisting of shell and solid elements is defined. Special emphasis is placed on the modeling of the weld seam. For this purpose the local mechanical properties of the weld metal, which have been determined by means of Martens-hardness measurements and uniaxial tensile tests, are integrated in the finite element models. The results obtained from the numerical simulations are compared to experimental data from a hydraulic bulge test. In this context the focus is laid on laser- and spot-welded patchwork blanks.
INTRODUCTION
Innovative automotive body concepts are characterized by a large number of sheet metal components with local reinforcements that ensure a sufficient stiffness and an improved crashworthiness of the body-in-white while at the same time the overall vehicle weight is minimized. Typical sheet metal parts of that kind are for example local reinforcements of automotive closures, structural reinforcements of rails and pillars as well as shock towers. Possible manufacturing concepts for sheet metal components with local reinforcements are depicted in Fig. 1.
The conventional method to produce such components consists of two individual forming operations and a subsequent joining process. The most important disadvantage of this approach is that two separate forming tools are required. Thus, tooling costs are increasing while at the same time appropriate measures to achieve a sufficient fitting accuracy have
to be taken. These difficulties can be avoided if tailored blanks are applied to manufacture reinforced components. Tailored blanks are made up of two or more sheets with different thicknesses, mechanical properties and/or surface coatings. The individual parts of a tailored blank are welded together by laser or mash-seam welding before the forming operation. Numerous advantages related with the application of tailored blanks have already been widely published [1, 2, 3]. An alternative to the concept of tailored blanks is the so-called patchwork blank technique. Its principle is to attach one or more flat pieces of sheet metal, which are called “patches”, onto a basic blank in the areas where reinforcements are required. The joining operation can basically be done by laser welding, resistance spot welding or adhesive bonding prior to the forming process [2, 3, 4]. In comparison to tailored blanks, patchwork blanks offer a number of additional advantages such as the reduction of cutting operations and the abolition of expensive edge preparation. Since cutting of the basic sheet is not required in the area of the reinforcement, the amount
526

of scrap and therefore material costs may be reduced. Furthermore, the concept of patchwork blanks offers a very high flexibility regarding the geometric shape and position of the reinforcing patch [2, 3, 4, 5]. Hence, compared to tailored welded blanks, less sophisticated positioning and clamping devices are required. Additionally, in case of adhesively bonded patchwork blanks, it is possible to benefit from the vibration damping effect of the adhesive layer [3].
FIGURE 1. Possible manufacturing concepts for sheet metal components with local reinforcements (schematic).
However, even if there is a considerable application potential for patchwork blanks especially in automotive industry, industrial realization of this innovative technique is decelerated due to a lack of knowledge regarding the forming behavior and the numerical modeling of patchwork blanks. This contribution presents different finite element modeling techniques for both laser- and spot-welded patchwork blanks. Special emphasis is placed on the modeling of the weld seam. The numerical results are compared to experimental data obtained from a hydraulic bulge test.
CONSTITUTIVE BEHAVIOR OF THE WELD METAL
In order to implement the mechanical properties of the weld seam into a finite element model of a patchwork blank, knowledge about the constitutive behavior of the weld metal is required. For this purpose, the following sections present an experimental method that allows the evaluation of the actual stress-strain properties of the weld seam of both tailored and patchwork blanks.
Preparation Of Test Samples
The test samples have been produced using a CO2-laser with a power of 4.3 kW and a dual focus optic in parallel alignment. The steel grade FeP04 with an initial thickness of t0 = 1.0 mm has been used for both the basic sheet and the patch. Helium was supplied as a shielding gas during the laser welding process. In order to determine the influence of the energy input per unit length on the resulting mechanical properties, the laser feed rate vL has been varied from 3 m/min to 7 m/min. The patches have been joined to the basic sheets in a lap joint with a continuous weld line. In the first case the weld line was applied with an offset of 10 mm to the edge of the patch while in second case the weld line and the edge of the patch were aligned.
Determination Of The Heat Affected Zone
The thermal influence during the welding process causes a modification of the mechanical properties of the parent material within the heat affected zone (HAZ). Information about the mechanical properties of the weld seam as well as about the lateral dimension of the heat affected zone can be obtained from the hardness distribution in a cross section of the weld seam. A Fischerscope H100C XYp test machine, which allows an automated indentation test, was used to perform the Martens-hardness measurements according to the German standard DIN EN ISO 14577 [6]. During this test procedure the test force F acting on the indentor is increased continuously up to value of 0.2 N while the penetration depth h is recorded. The Martens-hardness value HM is calculated according to Equation (1):
2
2
2 43.26
sincos
4)( hF
hF
hAFHM
⋅≈⋅
⋅==
αα , (1)
where, in case of a perfect Vickers indenter, α = 68° is the angle between the axis of the pyramid and its faces.
As a result a two-dimensional array of Martens-hardness values is obtained from the hardness measurements [7, 8]. The parent material FeP04 is characterized by a Martens-hardness value of HM0.2 = 1238 ± 49 N/mm2. In contrast, as a result of the process-related transformation of crystalline structure a hardness increase of up to 100 % occurs within the weld region. The Widmannstätten structure in the center region of the weld seam exhibits hardness values of HM0.2 ≈ 2600 N/mm2. As a definition for the width of the heat affected zone, that distance from
Conventionalreinforcement
Forming
Blanking
Joining
Forming
Blanking
Joining
Forming
Blanking
Joining
Tailored WeldedBlanks
PatchworkBlanks
527
the weld center, where the measured hardness exceeds the mean value of the parent material for a tripled standard deviation, has been used [7]. The values for the width of the HAZ, that have been determined on basis of this definition, are summarized in Table 1. As expected, a decrease of the laser feed rate, and thus an increase of the energy input per unit length, is related with an increasing lateral extension of the heat affected zone.
TABLE 1. Width of heat affected zone depending on the laser feed rate vL.
Laser feed rate vL [m/min]
Width of HAZ [mm]
Offset: 10 mm
Width of HAZ [mm]
No offset 7 1.40 n/a 6 1.60 1.30 5 1.75 1.50 4 1.85 1.60 3 2.00 n/a
Uniaxial Tensile Tests
Advanced finite element models, that take into account the specific constitutive behavior of the weld metal, require the determination of flow curves within the weld region. Therefore, uniaxial tensile tests according to the European standard DIN EN 10002 have been performed with longitudinally welded specimens. The sample width has been reduced to the lateral dimension of the heat affected zone by wire eroding. The optical strain measurement system Aramis (GOM mbH) was used for the evaluation of the tensile tests [10, 11]. In contrast to tactile strain sensors, this two-dimensional measurement technique allows the determination of flow curves up to logarithmic strain values of εpl ≈ 0.5 [7, 8]. In order to implement the experimental data in a finite element model of a patchwork blank, the measured stress–strain values were approximated in the least squares sense with the commonly used strain hardening law according to Swift:
, (2) nplf K )( 0 εεσ +⋅=
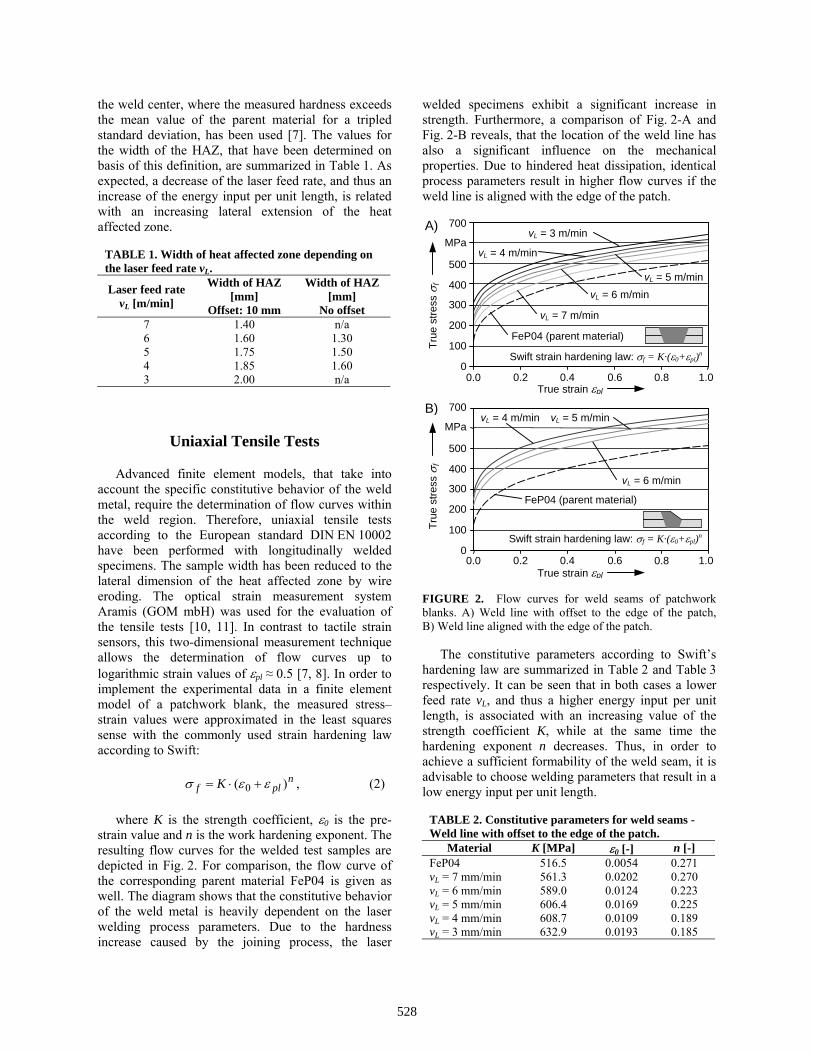
where K is the strength coefficient, ε0 is the pre-strain value and n is the work hardening exponent. The resulting flow curves for the welded test samples are depicted in Fig. 2. For comparison, the flow curve of the corresponding parent material FeP04 is given as well. The diagram shows that the constitutive behavior of the weld metal is heavily dependent on the laser welding process parameters. Due to the hardness increase caused by the joining process, the laser
welded specimens exhibit a significant increase in strength. Furthermore, a comparison of Fig. 2-A and Fig. 2-B reveals, that the location of the weld line has also a significant influence on the mechanical properties. Due to hindered heat dissipation, identical process parameters result in higher flow curves if the weld line is aligned with the edge of the patch.
700
FIGURE 2. Flow curves for weld seams of patchwork blanks. A) Weld line with offset to the edge of the patch, B) Weld line aligned with the edge of the patch.
The constitutive parameters according to Swift’s hardening law are summarized in Table 2 and Table 3 respectively. It can be seen that in both cases a lower feed rate vL, and thus a higher energy input per unit length, is associated with an increasing value of the strength coefficient K, while at the same time the hardening exponent n decreases. Thus, in order to achieve a sufficient formability of the weld seam, it is advisable to choose welding parameters that result in a low energy input per unit length.
TABLE 2. Constitutive parameters for weld seams - Weld line with offset to the edge of the patch.
Material K [MPa] ε0 [-] n [-] FeP04 516.5 0.0054 0.271 vL = 7 mm/min 561.3 0.0202 0.270 vL = 6 mm/min 589.0 0.0124 0.223 vL = 5 mm/min 606.4 0.0169 0.225 vL = 4 mm/min 608.7 0.0109 0.189 vL = 3 mm/min 632.9 0.0193 0.185
True
stre
ss σ
f
True strain εpl
0
100
200
300
400
500
0.0 0.2 0.4 0.6 0.8 1.0
MPa
Swift strain hardening law: σf = K·(ε0+εpl)n
vL = 6 m/min
vL = 4 m/min
vL = 5 m/min
FeP04 (parent material)
vL = 3 m/min
vL = 7 m/min
A)
Swift strain hardening law: σf = K·(ε0+εpl)n
vL = 6 m/min
vL = 5 m/min vL = 4 m/min
True strain εpl
0.0 0.2 0.4 0.6 0.8 1.00
100
200
300
400
500
700
MPaTr
ue s
tress
σf
FeP04 (parent material)
B)
528
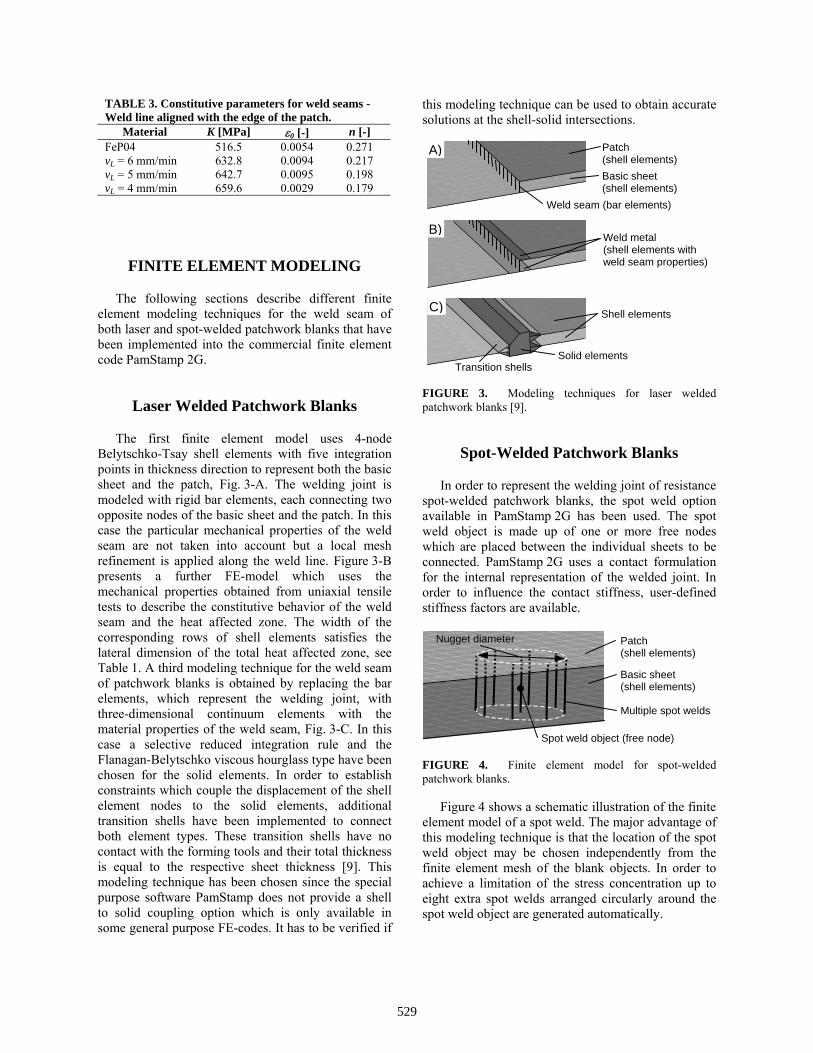
TABLE 3. Constitutive parameters for weld seams - Weld line aligned with the edge of the patch.
Material K [MPa] ε0 [-] n [-] FeP04 516.5 0.0054 0.271 vL = 6 mm/min 632.8 0.0094 0.217 vL = 5 mm/min 642.7 0.0095 0.198 vL = 4 mm/min 659.6 0.0029 0.179
FINITE ELEMENT MODELING
The following sections describe different finite element modeling techniques for the weld seam of both laser and spot-welded patchwork blanks that have been implemented into the commercial finite element code PamStamp 2G.
Laser Welded Patchwork Blanks
The first finite element model uses 4-node Belytschko-Tsay shell elements with five integration points in thickness direction to represent both the basic sheet and the patch, Fig. 3-A. The welding joint is modeled with rigid bar elements, each connecting two opposite nodes of the basic sheet and the patch. In this case the particular mechanical properties of the weld seam are not taken into account but a local mesh refinement is applied along the weld line. Figure 3-B presents a further FE-model which uses the mechanical properties obtained from uniaxial tensile tests to describe the constitutive behavior of the weld seam and the heat affected zone. The width of the corresponding rows of shell elements satisfies the lateral dimension of the total heat affected zone, see Table 1. A third modeling technique for the weld seam of patchwork blanks is obtained by replacing the bar elements, which represent the welding joint, with three-dimensional continuum elements with the material properties of the weld seam, Fig. 3-C. In this case a selective reduced integration rule and the Flanagan-Belytschko viscous hourglass type have been chosen for the solid elements. In order to establish constraints which couple the displacement of the shell element nodes to the solid elements, additional transition shells have been implemented to connect both element types. These transition shells have no contact with the forming tools and their total thickness is equal to the respective sheet thickness [9]. This modeling technique has been chosen since the special purpose software PamStamp does not provide a shell to solid coupling option which is only available in some general purpose FE-codes. It has to be verified if
this modeling technique can be used to obtain accurate solutions at the shell-solid intersections.
FIGURE 3. Modeling techniques for laser welded patchwork blanks [9].
Spot-Welded Patchwork Blanks
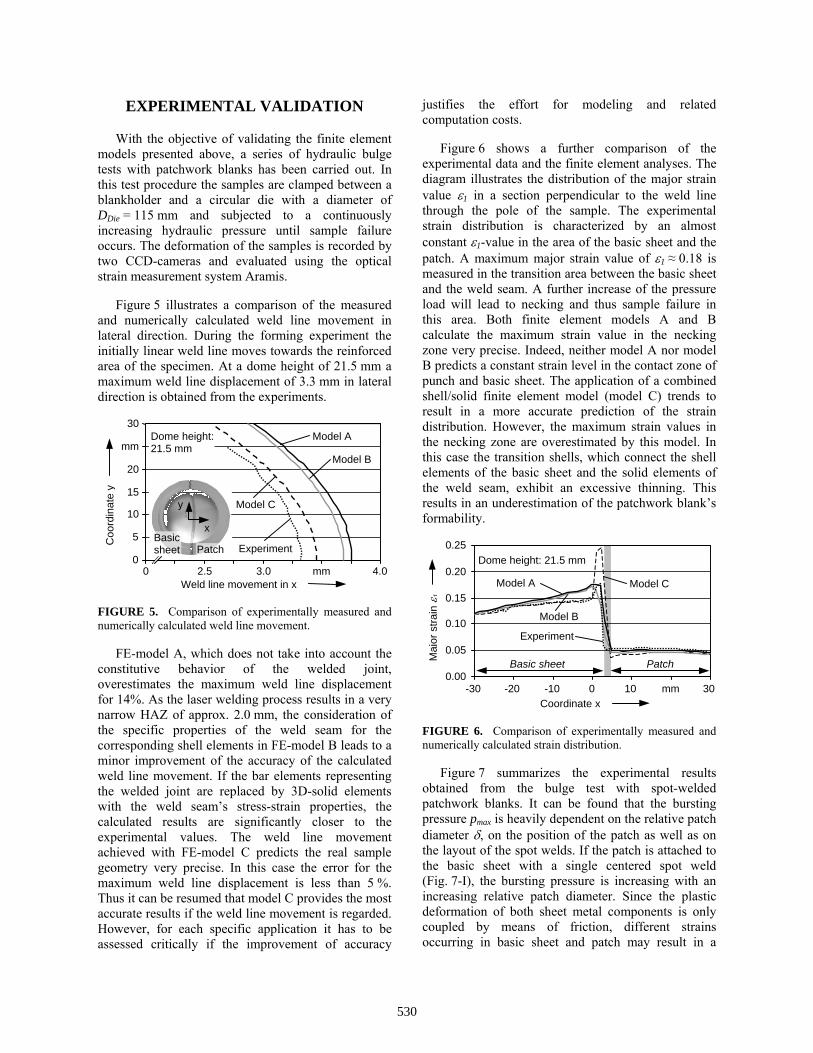
In order to represent the welding joint of resistance spot-welded patchwork blanks, the spot weld option available in PamStamp 2G has been used. The spot weld object is made up of one or more free nodes which are placed between the individual sheets to be connected. PamStamp 2G uses a contact formulation for the internal representation of the welded joint. In order to influence the contact stiffness, user-defined stiffness factors are available.
FIGURE 4. Finite element model for spot-welded patchwork blanks.
Figure 4 shows a schematic illustration of the finite element model of a spot weld. The major advantage of this modeling technique is that the location of the spot weld object may be chosen independently from the finite element mesh of the blank objects. In order to achieve a limitation of the stress concentration up to eight extra spot welds arranged circularly around the spot weld object are generated automatically.
Patch (shell elements)
A)
Basic sheet (shell elements)
Weld seam (bar elements)
B)Weld metal (shell elements with weld seam properties)
Patch (shell elements)
Nugget diameter
Basic sheet (shell elements)
Spot weld object (free node)
Multiple spot welds
Shell elements
Solid elements Transition shells
C)
529
EXPERIMENTAL VALIDATION
With the objective of validating the finite element models presented above, a series of hydraulic bulge tests with patchwork blanks has been carried out. In this test procedure the samples are clamped between a blankholder and a circular die with a diameter of DDie = 115 mm and subjected to a continuously increasing hydraulic pressure until sample failure occurs. The deformation of the samples is recorded by two CCD-cameras and evaluated using the optical strain measurement system Aramis.
Figure 5 illustrates a comparison of the measured and numerically calculated weld line movement in lateral direction. During the forming experiment the initially linear weld line moves towards the reinforced area of the specimen. At a dome height of 21.5 mm a maximum weld line displacement of 3.3 mm in lateral direction is obtained from the experiments.
FIGURE 5. Comparison of experimentally measured and numerically calculated weld line movement.
FE-model A, which does not take into account the constitutive behavior of the welded joint, overestimates the maximum weld line displacement for 14%. As the laser welding process results in a very narrow HAZ of approx. 2.0 mm, the consideration of the specific properties of the weld seam for the corresponding shell elements in FE-model B leads to a minor improvement of the accuracy of the calculated weld line movement. If the bar elements representing the welded joint are replaced by 3D-solid elements with the weld seam’s stress-strain properties, the calculated results are significantly closer to the experimental values. The weld line movement achieved with FE-model C predicts the real sample geometry very precise. In this case the error for the maximum weld line displacement is less than 5 %. Thus it can be resumed that model C provides the most accurate results if the weld line movement is regarded. However, for each specific application it has to be assessed critically if the improvement of accuracy
justifies the effort for modeling and related computation costs.
Figure 6 shows a further comparison of the experimental data and the finite element analyses. The diagram illustrates the distribution of the major strain value ε1 in a section perpendicular to the weld line through the pole of the sample. The experimental strain distribution is characterized by an almost constant ε1-value in the area of the basic sheet and the patch. A maximum major strain value of ε1 ≈ 0.18 is measured in the transition area between the basic sheet and the weld seam. A further increase of the pressure load will lead to necking and thus sample failure in this area. Both finite element models A and B calculate the maximum strain value in the necking zone very precise. Indeed, neither model A nor model B predicts a constant strain level in the contact zone of punch and basic sheet. The application of a combined shell/solid finite element model (model C) trends to result in a more accurate prediction of the strain distribution. However, the maximum strain values in the necking zone are overestimated by this model. In this case the transition shells, which connect the shell elements of the basic sheet and the solid elements of the weld seam, exhibit an excessive thinning. This results in an underestimation of the patchwork blank’s formability.
FIGURE 6. Comparison of experimentally measured and numerically calculated strain distribution.
Figure 7 summarizes the experimental results obtained from the bulge test with spot-welded patchwork blanks. It can be found that the bursting pressure pmax is heavily dependent on the relative patch diameter δ, on the position of the patch as well as on the layout of the spot welds. If the patch is attached to the basic sheet with a single centered spot weld (Fig. 7-I), the bursting pressure is increasing with an increasing relative patch diameter. Since the plastic deformation of both sheet metal components is only coupled by means of friction, different strains occurring in basic sheet and patch may result in a
Experiment
Model A
Model B
Weld line movement in x
0
5
1
1
2
3
0Dome h21.5 mm
eight: mm
0
Coo
rdin
ate
y 5y Model C
0
0
x Basic sheet 0.25Patch
2.5 3.0 mm 4.0
Experiment
Model A
Model B
Coordinate x
Dome height: 21.5 mm
Model C0.20
0.15
Maj
or s
train
ε1
0.10
0.05Basic sheet Patch
0.000 10 -30 -20 -10 mm 30
530

relative movement between the two components. Therefore, a larger patch diameter results in lower radial tensile stresses within the basic sheet and thus a higher value of pmax. On the other hand, in case of the weld layout II and III, the bursting pressure is decreasing with an increasing δ - value since the welding spots establish an almost rigid connection between the basic sheet and the patch. In this case the reinforced area of the patchwork blanks takes hardly part in the forming operation. Thus, larger patches result in a decrease of the maximum achievable pressure. Furthermore it can be seen from Fig. 7, that a higher bursting pressure occurs if the reinforcing patch is positioned on the same side of the basic sheet as the applied pressure (bottom).
FIGURE 7. Bursting pressure pmax for spot-welded patchwork blanks.
The results of the finite element analyses of the bulge test show a good correspondence with the experimental data. Figure 8 exemplifies the major strain distribution in the center region of a patchwork blank with five spot welds (weld layout III, see Fig. 7) at a pressure of 65 bar. The maximum strain values in the basic sheet occur in radial direction outside the weld nuggets. It can be found from both experimental trials and FEA that sample failure due to necking occurs in this area. Thus it can be summarized that the spot weld option available in PamStamp 2G provides an appropriate method for the modeling of spot-welded sheet metal components.
FIGURE 8. Major strain distribution in the basic sheet of a spot-welded patchwork blank – Comparison of experiment (left) and FEA (right) at p = 65 bar.
ACKNOWLEDGMENTS
The authors would like to thank the German Research Foundation DFG for their financial support of this work within the Priority Programme 1098 “Sheet Metal Forming by Using Working Media Based Manufacturing Processes”.
REFERENCES
1. Saunders, F.I., and Wagoner, R.H., “Forming of Tailor-Welded Blanks”, Metallurgical and Materials Transactions 27A, 2605-2616 (1996).
2. Vergote, V., and Mohrbacher, H., “Tailored pre-products made of steel for automotive applications”, Stahl und Eisen 121 (2001) 7, 39-44.
80
3. Mertens, A., Tailored Blanks – Stahlprodukte für den Fahrzeug-Leichtbau, Landsberg am Lech: Verlag Moderne Industrie, 2003.
4. Magain, P., Dawance, J., Delfanne, S., Chamont, B., and Fournet, A., “The Patchwork Technique For Proper Material Placement on Panels: Industrial Application on The New Peugeot 206”, SAE Paper No. 982402, 1998.
5. Pinard, F., Cretteur, L., and Sener, J.-Y., “State of the art regarding design, modelling and Processing of spot-welded patched blanks for the automotive industry” in Proceedings of the IDDRG-Conference, Sindelfingen, Germany, 24. - 26.05.2004, pp. 174-181.
6. DIN EN ISO 14577-1: Metallic materials – Instrumented indentation test for hardness and materials parameters (Part 1: Test method). Beuth, Berlin, 2003.
7. Lamprecht, K., and Merklein, M., “Characterisation of Mechanical Properties of Laser Welded Tailored and Patchwork Blanks” in Proceedings of the 4th International Conference on Laser Assisted Net Shape Engineering, edited by M. Geiger et al., Bamberg: Meisenbach, 2004, pp. 349-358.
8. Lamprecht, K., and Geiger, M., “Experimental and Numerical Investigation of the Formability of Laser Welded Patchwork Blanks” in Proceedings of the 11th International Conference on Sheet Metal, edited by M. Geiger et al., Zuerich: Trans Tech Publications, 2005, pp. 689-696.
9. Lamprecht, K., and Geiger, M., “Advanced Numerical Modelling of Patchwork Blank Forming Processes”, in Proceedings of the 8th International Conference on Technology of Plasticity (ICTP 2005), submitted.
10. Hecht, J., and Merklein, M., “Charakterisierung des Umformverhaltens von Magnesiumblech bei erhöhter Temperatur” in XXIV. Colloquium on Metal Forming, edited by B. Buchmayr, Leoben: Lehrstuhl für Umformtechnik, 2005, pp. 83-92.
11. Novotny, S., Celeghini, M., and Geiger, M., “Measurement of material properties of aluminium sheet alloys at elevated temperatures” in Proceedings of the 8th International Conference of Sheet Metal, edited by B. Shirvani et al., Birmingham: Faculty of Engineering and Computer Technology, 2000, pp. 363-370.
I.
II.
III.
Burs
ting
pres
sure
pm
ax
Rel. patch diameter δ = DPatch / DDie
0
50
60
bar
0.0 0.4 0.5 0.6 0.7
I. Patch position: bottom
II. III.
Patch position: topn = 3
0.03
0.23
0.08
0.13
0.18
Major strain
xy
Experiment FEA
PatchoutlineSpot welds
531