Embed Size (px)
Citation preview

Module 4 – (L12 - L18): “Watershed Modeling”Standard modeling approaches and classifications, system concept Standard modeling approaches and classifications, system concept for watershed modeling, overall description of different hydrologic processes, modeling of rainfall, runoff process, subsurface flows and groundwater flowg
14 Hydrologic Processes111
14

L14L14– Hydrologic ProcessesL14L14 Hydrologic Processes
Topics Covered Topics Covered Hydrologic cycle, Processes, Hydrologic cycle, Processes,
Precipitation, Interception, Infiltration, Precipitation, Interception, Infiltration, Evaporation Transpiration Evaporation Transpiration Evaporation, Transpiration, Evaporation, Transpiration, Evapotranspiration, Runoff Evapotranspiration, Runoff
Keywords:Keywords: Hydrologic cycle, Precipitation, Hydrologic cycle, Precipitation,
infiltration, Evapoinfiltration, Evapo--transpiration, Runofftranspiration, Runoff22
t at o , apot at o , apo t a sp at o , u ot a sp at o , u o
Prof. T I Eldho, Department of Civil Engineering, IIT Bombay
Hydrologic Processes
Hydrologic information – for planning and management of watersheds.and management of watersheds.
Hydrologically watershed conceptualized – Precipitation -> Runoff: Evaporation Transpiration Runoff: Evaporation, Transpiration, Interception, Infiltration etc.
Watershed: Overland flow, Channel flow & subsurface flow components.
Hydrologic cycle – processes & pathways in circulation of water from 6.00
9.00
12.00
15.00
rge(
m3 /s
ec)
0.0
5.0
10.0
ll in
tern
sity
mm
/hr)
pathways in circulation of water from land & water bodies to atmosphere & back again – Land use effects
0.00
3.00
6 00
0 200 400 600
Time(min)
Dis
cha
15.0
20.0
Rai
nfa (m
RainfallObservedSimulated
33Prof. T I Eldho, Department of Civil Engineering, IIT Bombay

Hydrologic Cycle & ProcessesHydrologic Cycle & Processesy g yy g yHydrologic processes
ll
PrecipitationOverland
Evaporation Photo, A.K. Singh, 2002
Land Hydrology
Groundwater
Infiltration
RiverGroundwater
Flow towards Ocean
Hydrosphere & hydrological cycle Hydrosphere & hydrological cycle ––Hydrological processesHydrological processes - balance between water of the earth & moisture in atmosphere
44Prof. T I Eldho, Department of Civil Engineering, IIT Bombay
water of the earth & moisture in atmosphere

Evaporation
Condensation
PrecipitationPrecipitation
EvaporationRainfall
Surface water Groundwater
Precipitation in several forms: Rain (water droplets > Precipitation in several forms: Rain (water droplets > 0.5mm dia.); Drizzle (<0.5mm dia), Snow (in ice 0.5mm dia.); Drizzle (<0.5mm dia), Snow (in ice
pp
form), Sleet, Hail stone, Dew. form), Sleet, Hail stone, Dew. Precipitation Precipitation –– Main source of water: Rain & snow. Main source of water: Rain & snow. Precipitation condition: Precipitation condition: Humid air cooled to dew-point - Precipitation condition: Precipitation condition: Humid air cooled to dew point
> Nuclei -> Droplets to raindrops;->Size of raindrops.. Four main mechanisms for cooling the air to its dew Four main mechanisms for cooling the air to its dew
d b l d l d ld b l d l d lpoint: adiabatic cooling, conductive cooling, radiational point: adiabatic cooling, conductive cooling, radiational cooling, and evaporative coolingcooling, and evaporative cooling
Approx. 505,000 cubic km of water falls as precipitation each pp , p pyear; 398,000 cubic km- over the oceans & 107,000 cubic km over land.
Globally averaged annual precipitation is 990 mm, but over
55
y g p p ,land it is only 715 mm
Prof. T I Eldho, Department of Civil Engineering, IIT Bombay

Precipitation & Measurement
Occurs when air masses laden with water vapor arecooled; Storm Precipitation 3 Types: Frontal storm,C ti t & hi tConvective storm & orographic storm.
Rainfall: Measurement & analysis – very important Rainfall data: Amount intensity & duration Rainfall data: Amount, intensity & duration Rainfall in mm & intensity in mm/hour.
Frontal storm
Convective storm
Warm aircold Warm moist air raisescold Warm moist air raises
Orographic storm
66Prof. T I Eldho, Department of Civil Engineering, IIT BombayMountainMoist air Dry air

Rainfall & MeasurementR i f ll d ti l d th f t ll t d Rainfall: measured as vertical depth of water collected on a level surface.
Measurement by Rain gauges: Non-recording type: collects rainfall over a known period
of time – intensity can not be correctly found; IMD –Standard Gauge: Collector with gun metal rim, funnel, base & polyethene bottle; Collector area– 100cm2/ 200cm2; Polyethene bottle – 2, 4 & 10 lit.; measurement by graduated measuring cylinder.
Recording type: give rainfall intensity – mechanical system – record on graph paper; Curve of cumulative rainfall with time: Mass curve; Slope of curve – rainfall intensity.– Types: Float; Weighing & Tipping bucket: Clock
driven rotating drum, pen fitted graph paper.
77
g p g p p p
Prof. T I Eldho, Department of Civil Engineering, IIT BombayRaj Vir Singh (2000), http://www.fao.org
Rainfall Intensity, Duration & Frequency Rainfall Intensity: Rate at which rainfall occurs – mm/hr Duration: in hours/ days
Return period (recurrence interval) period within Return period (recurrence interval) – period within which depth of rainfall for a given duration will be equaled or exceeded once on the averageT R t i d i (N+1) / N t t l T = Return period in years = (N+1) /m; N – total number of hydrologic events; m – rank of events arranged in descending order of magnitudeP b bilit f f t i % P 100/T Probability of occurrence of an event in %: P = 100/T
Intensity of a storm - predicted for any return period & storm duration, from charts based on historic data.
1 in 10 year storm describes a rainfall event which is rare & is only likely to occur once every 10 years, so it has a 10 percent likelihood any given year
88
p y g y
Prof. T I Eldho, Department of Civil Engineering, IIT Bombay
Average depth of rainfall over an area Large differences in rainfall – within short distances Average depth of rainfall to be found: Arithmetic average: for evenly distributed stations
(uniform density): Pa = ∑ Pi /N Thiessen method: area-weighted averaging – used
when rain gauges are nonuniformly distributed:Area-weighted average : (every gauge representsbest the area immediately around the gauge)
h kConstructing Thiessen Network:1. Plot stations on a map2. Connect adjacent stations by straight lines3. Bisect each connecting line perpendicularly4. Perpendicular lines define a polygon around each
station
995. P at a station is applied to the polygon closest to it

Average depth of rainfall over an area Average depth of rainfall in a watershed: P = (A1 P1 + A2 P2 + ….+An Pn) /A
– A – area of watershed;P1, P2, ….Pn – rainfall depth in the polygon having areas A1, A2, …An within the watershedwithin the watershed.
Isohyetal method: record depth of rainfall at locations of different rain gauges & plot isohyets (lines of equal
i f ll) rainfall) Plot a contour map of P based on gage readings at
stations Compute area between each successive contour lines
Pa = PaiAi/ Ai
1010Prof. T I Eldho, Department of Civil Engineering, IIT Bombay

Interception Interception: part of precipitation collects on the plant Interception: part of precipitation collects on the plant
canopy; ultimately evaporates – abstraction from precipitation – quantified. A t f i t ti d d St h t Amount of interception depends: Storm character; vegetation, growth stage, season & wind velocity.
Importance of interception- purpose of hydrologic model -Significant in annual or long term model
Potential storm interception calculation: Li = S+K E t• Li= volume intercepted S = interception storageLi= volume intercepted, S = interception storage• K = ratio of surface area of intercepting leaves to horizontal
projections of the area; E = the amount of water evaporated per hour during the precipitation period, t = time (hr)per hour during the precipitation period, t time (hr)
Assumption: rainfall is sufficient to satisfy S For accounting rainfall (P): Li=S(1-e-P/S)+K E t
1111Prof. T I Eldho, Department of Civil Engineering, IIT Bombay

Surface Retention / Detention
Depression storage / surface retention: water retained on the ground surface in micro-depressions on the ground surface in micro depressions – this water will either evaporate or infiltrate into the soil – Nature of depressions as well as their size is largely a
function of the original land form and local land use function of the original land form and local land use practices and erosion pattern.
Surface detention: Water temporarily detained on the f surface –
– necessary requirement for surface runoff to occur –part of surface runoff
– Controlling factors: surface micro-relief, vegetation, surface slope, topography, rainfall excess.
1212Prof. T I Eldho, Department of Civil Engineering, IIT BombaySurface detention

InfiltrationInfiltration: process by which water on the ground
surface enters the soil. Infiltration capacity of soil determines – amount & Infiltration capacity of soil determines – amount &
time distribution of rainfall excess for runoff from a storm.
f f f ff b f Important for estimation of surface runoff, subsurface flow & storage of water within watershed.
Controlling factors: Soil type (size of particles, degree Controlling factors: Soil type (size of particles, degree of aggregation between particles, arrangement of particles); vegetative cover; surface crusting; season of the year; antecedent moisture; rainfall hyetograph; of the year; antecedent moisture; rainfall hyetograph; subsurface moisture conditions etc.
Soil zone
1313Prof. T I Eldho, Department of Civil Engineering, IIT BombayGroundwater
Capillary fringe
Water tableRecharge

Infiltration Estimationt at o st at o
Infiltration measured – Infiltrometers & rainfall
(Ghanshyam Das, 2000)
runoff plots. Entry of water into soil surface measured on a
small plot of soilsmall plot of soil. Infiltration rate: Volume per unit of time per unit
of area or depth per unit time. p p Number of methods to estimate infiltration. Important methods: Horton equation; Green-
Ampt eqn.; Philips eqn.; Darcy’s eqn.; SCS eqn.; Holtan eqn.; Kostiakov eqn. etc.
1414Prof. T I Eldho, Department of Civil Engineering, IIT Bombayhttp://www.turf-tec.com/

To help protect your privacy, PowerPoint prevented this external picture from being automatically downloaded. To download and display this picture, click Options in the Message Bar, and then click Enable external content.
Infiltration Estimation Horton Eqn.: infiltration starts at a constant rate f0 & is
decreasing exponentially with time t: ft = fc + (f0 − fc)e − kt
Where f - infiltration rate at time t; f - initial infiltration Where ft infiltration rate at time t; fc initial infiltration rate or maximum infiltration rate; f0 - constant or equilibrium infiltration rate after the soil has been saturated or minimum infiltration rate; k decay saturated or minimum infiltration rate; k - decay constant specific to the soil.
Philip Infiltration Model: 1 / 21 f s t K
where si is infiltration sorptivity (cm×hr-0.5), K is hydraulic conductivity which is considered equal to
2 if s t K
hydraulic conductivity which is considered equal to
the Ks and t is time.
1515Prof. T I Eldho, Department of Civil Engineering, IIT Bombay

Infiltration Estimation
Holton’s empirical infiltration equation
– f is in inches per hour, GI is a crop growth index that ranges from 0.1 to 1.0, A - macropores associated with plant roots, fc - steady state infiltration rate, Sa – available storage in the steady state infiltration rate, Sa available storage in the surface layers.
Infiltration Index: for determination of loss of rainwater due to abstraction Method assumes rainwater due to abstraction. Method assumes constant value of infiltration capacity (for the full duration of storm)Ф i d A b t ti f i f ll Ф - index: Average abstraction of rainfall
w-index: Considers initial abstractions; very difficult to determine correct values of initial abstraction
1616
Evaporation
Condensation
EvaporationEvaporation
Rainfall
Surface water Groundwater
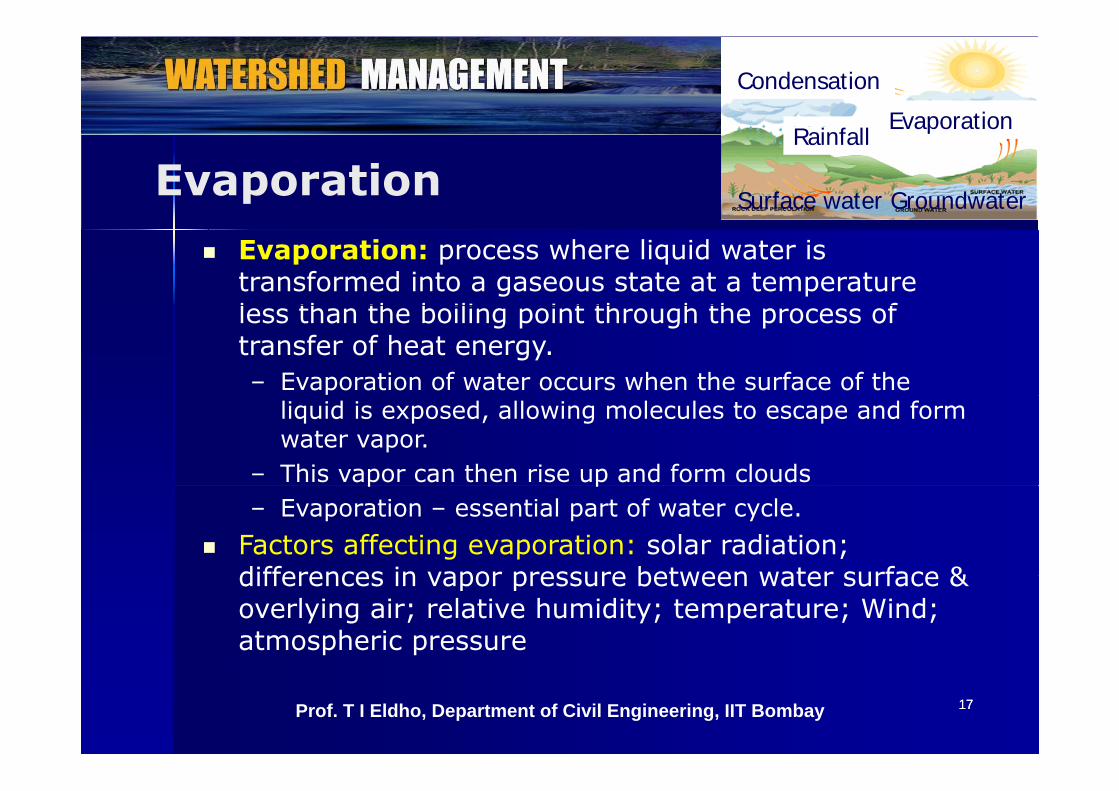
Evaporation: process where liquid water is transformed into a gaseous state at a temperature l th th b ili i t th h th f less than the boiling point through the process of transfer of heat energy. – Evaporation of water occurs when the surface of the
liquid is exposed, allowing molecules to escape and form water vapor.
– This vapor can then rise up and form clouds p p– Evaporation – essential part of water cycle.
Factors affecting evaporation: solar radiation; differences in vapor pressure between water surface & differences in vapor pressure between water surface & overlying air; relative humidity; temperature; Wind; atmospheric pressure
1717Prof. T I Eldho, Department of Civil Engineering, IIT Bombay

Measurement of EvaporationE f i f l b di Exact measurement of evaporation - for large bodies of water difficult
From open water surfaces – evaporation measured o ope a e su aces e apo a o easu edby: Atmometers, evaporimeters or open pans
Evaporation pans: finding reservoir evaporation using water filled containers observe how much water is water filled containers -observe how much water is lost over time
Different types of pans US class A pan ISI standard pan
C l d k P fill d ith t Colorado sunken pan Russian GGI pan Pan Coefficient: (Ratio of lake to pan evaporation)
Pan filled with waterwww.meted.ucar.edu
1818
Pan Coefficient: (Ratio of lake to pan evaporation)
Prof. T I Eldho, Department of Civil Engineering, IIT Bombay

Evaporation Estimation Water Budget Method: from ponded water – lakes/
reservoirs: Water budget method – accounting all inflows and outflows.inflows and outflows.
Energy Budget Method: based on application of law of conservation of energy – evaporation takes energy.
f ( d ) h d Mass Transfer (Aerodynamic) methods - based on turbulent transfer of water vapor from an evaporating surface to the atmosphere
Combination- mass transfer & energy budget Method Empirical Formulas: using available meteorological
data: eg USGS & USBR Formula: E = 4 57T + 43 3data: eg. USGS & USBR Formula: E = 4.57T + 43.3 E - cm/yr; T - mean annual temperature in °C. Use of Evaporation Pans
1919Prof. T I Eldho, Department of Civil Engineering, IIT Bombay

Evaporation Control Storing water in covered reservoirs Making increased use of underground storage Controlling aquatic growths Building storage reservoirs with minimal surface areas Conveying in closed conduits rather than open Conveying in closed conduits rather than open
channels Applying a thin chemical (monocular) filmEg: Application of Cetyl alcohol is the effective and
feasible method Reduces evaporation (20-50%) by preventing the Reduces evaporation (20-50%) by preventing the
water molecules to escape No water quality effect: Colorless, odorless and
2020
nontoxicProf. T I Eldho, Department of Civil Engineering, IIT Bombay

Transpiration Transpiration: vaporization of liquid water contained in Transpiration: vaporization of liquid water contained in
plant tissues & vapor removal to the atmosphere. Crops predominately lose their water through
t t Th ll i th l t l f stomata. These are small openings on the plant leaf through which gases and water vapor pass
Nearly all water taken up is lost by transpiration and y p y ponly a tiny fraction is used within the plant.
Transpiration depends on the energy supply, vapor pressure gradient and wind soil water content and the pressure gradient and wind, soil water content and the ability of the soil to conduct water to the roots, crop characteristics, environmental aspects and cultivation practices practices.
95% of daily transpiration occurs during daylighthours
2121Prof. T I Eldho, Department of Civil Engineering, IIT Bombaywww.fao.org

Transpiration & EvapotranspirationS il i t li b t th li it f ilti i t d Soil moisture lies between the limits of wilting point andfield capacity- No effect on transpiration
Phytometer – device for measuring transpiration Evapotranspiration (ET): Evaporation and transpiration
occur simultaneously and there is no easy way ofdistinguishing between the two processes.
Potential evapotranspiration (PET): Rate at which water, ifavailable, would be removed from wet soil & plant surface,expressed as the latent heat transfer per unit area or itsequivalent depth of water per unit areaequivalent depth of water per unit area.
PET - measure of ability of atmosphere to remove water fromthe surface through processes of E & T assuming no control onwater supplywater supply.
Actual evapotranspiration (AET) -quantity of water actuallyremoved from a surface due to the processes of E & T
2222Prof. T I Eldho, Department of Civil Engineering, IIT Bombaywww.rosemariegarden.blogspot.com
Water intake through root

Estimation of Evapotranspiration
Crop water need = potential evapotranspiration -actual evapotranspiration
Crop Coefficient = AET/ PET Theoretical Methods: Blaney Criddle, Penmann –
Monteith methodMonteith method Empirical Methods: Thronthwaite Field Methods: Lysimetres (device in which a volume
of soil, with or without crop is located in a container to isolate it hydrologically from surrounding), Field plots, Soil moisture depletion studiesp
Analytical Methods - Energy or Water budget method
2323Prof. T I Eldho, Department of Civil Engineering, IIT Bombay

Estimation of Evapotranspiration Blaney - Criddle Method: Assumption: Consumptive use of water by crops is related to
thl t & d li ht h P id h ti tmean monthly temp. & daylight hours; Provide rough estimate For extreme climatic conditions -method is inaccurate Windy, dry, sunny areas -ETo is underestimated (up to 60 %)o
Calm, humid, clouded areas- ETo is overestimated (up to 40%)Blaney-Criddle formula: ETo = p (0.46 T mean +8) ET = Reference crop evapotranspiration (mm/day) as an ETo = Reference crop evapotranspiration (mm/day) as an
average for a period of 1 month Tmean = mean daily temperature (°C)
d il t f l d ti h p = mean daily percentage of annual daytime hours
2424Prof. T I Eldho, Department of Civil Engineering, IIT Bombay

Surface Runoff Surface Runoff: part of precipitation which during &
Photo, A.K. Singh, 2002
Surface Runoff: part of precipitation which during & immediately after a storm event, appears as flowing water in the drainage network of a watershed.
Result from direct movement of water over the surface of watershed, precipitation in excess of abstraction demand or emergence of soil water into waterways.g y
Surface runoff occurs – when the rate of precipitation exceeds the rate of infiltration. C t lli F t i) Cli ti f t ii) Ph i hi Controlling Factors: i) Climatic factors; ii) Physiographic– Climatic factors: Precipitation (intensity, duration, areal
distribution & storm pattern), evaporation & evapotranspiration.– Physiographic factors: watershed characteristics (size, shape,
land use, infiltration rate, slope etc.), channel characteristics (size, cross section, slope & roughness of channel bed) &
2525
drainage pattern & density.Runoff Prof. T I Eldho, Department of Civil Engineering, IIT Bombay

Surface Runoff Overland & Channel Flow: If rainfall exceeds soil
infiltration capacity, water fills surface depression then p y pWater spills over down slope as overland flow & eventually to the stream – channel flow
Surface runoff - generated either by rainfall or by the g y ymelting of snow, or glaciers
Measurement of Runoff Pass through outlet of watershed Pass through outlet of watershed Flume measurement – H flume Automatic water stage recorder
Rainfall
Channel phase flow
2626
Infiltration Overland
flow

Surface Runoff Mechanism Infiltration excess overland flow (Hortonian / Unsaturated
overland flow): occurs when rate of rainfall on a surface exceeds rate at which water can infiltrate the ground & exceeds rate at which water can infiltrate the ground, & any depression storage has already been filled.
Saturation excess overland flow: When soil is saturated & depression storage filled, & rain continues to fall, rainfall will immediately produce surface runoff.
Antecedent soil moisture: Soil retains a degree of moisture Antecedent soil moisture: Soil retains a degree of moisture after a rainfall - residual water moisture affects the soil's infiltration capacitySubsurface return flow (through flow): after water Subsurface return flow (through flow): after water infiltrates the soil on an up-slope portion of a hill- water may flow laterally through the soil, & exfiltrate (flow out of
2727
the soil) closer to a channel. Runoff Prof. T I Eldho, Department of Civil Engineering, IIT Bombay

Steps to Hydrologic Modeling
1. Delineate watershed2 Obtain hydrologic and geographic data2. Obtain hydrologic and geographic data3. Select modeling approach4. Calibrate/Verify model5. Use model for assessment/prediction/design Use of Models: Assessment: What happens if land use/land cover is
changed? Prediction: Flood forecasting Prediction: Flood forecasting Design: How much flow will occur in a 10 year storm?
2828Prof. T I Eldho, Department of Civil Engineering, IIT Bombay
Example Problem
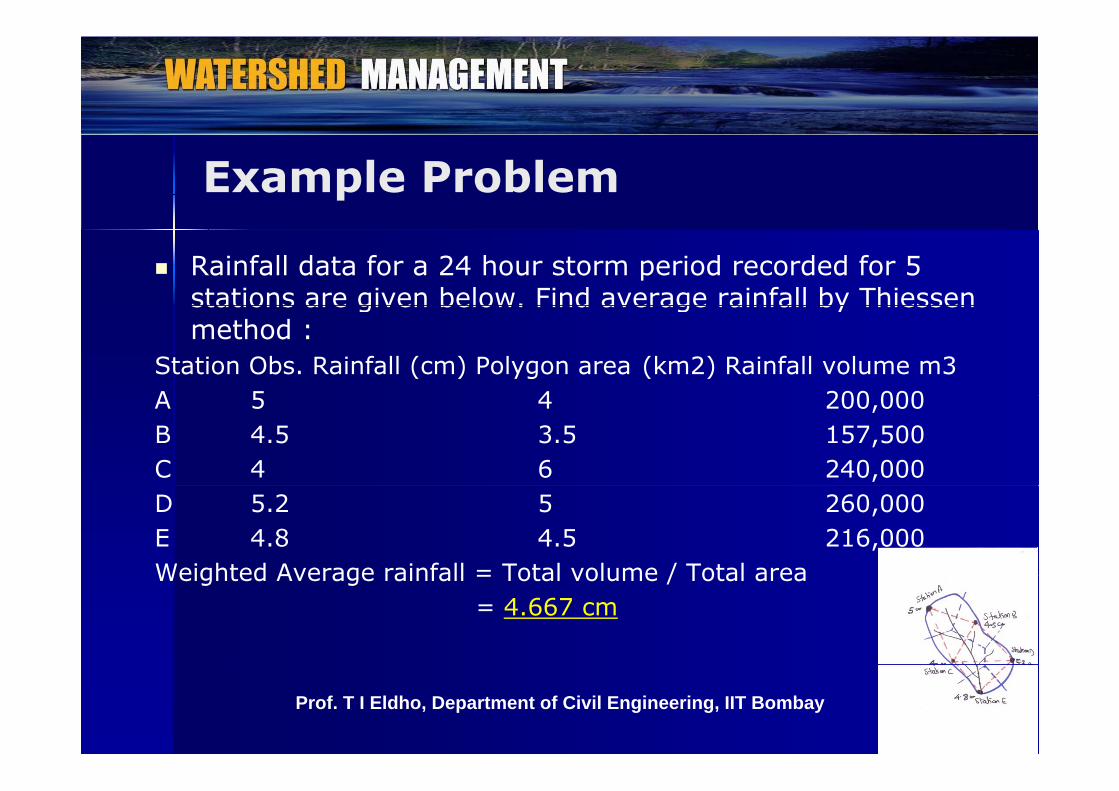
Rainfall data for a 24 hour storm period recorded for 5 stations are given below. Find average rainfall by Thiessen stations are given below. Find average rainfall by Thiessen method :
Station Obs. Rainfall (cm) Polygon area (km2) Rainfall volume m3A 5 4 200 000A 5 4 200,000B 4.5 3.5 157,500C 4 6 240,000D 5.2 5 260,000E 4.8 4.5 216,000Weighted Average rainfall = Total volume / Total areaWeighted Average rainfall = Total volume / Total area
= 4.667 cm
2929Prof. T I Eldho, Department of Civil Engineering, IIT Bombay
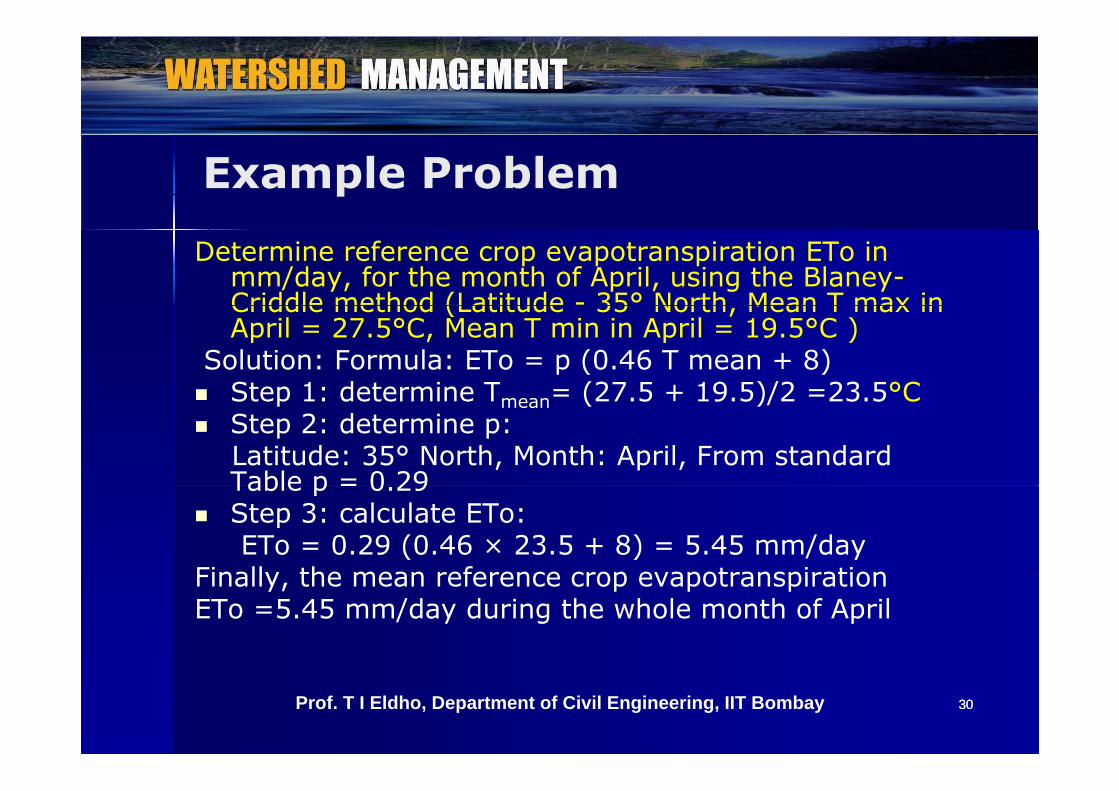
Example ProblemDetermine reference crop evapotranspiration ETo in
mm/day, for the month of April, using the Blaney-Criddle method (Latitude - 35° North Mean T max in Criddle method (Latitude 35 North, Mean T max in April = 27.5°C, Mean T min in April = 19.5°C )
Solution: Formula: ETo = p (0.46 T mean + 8) Step 1: determine T = (27 5 + 19 5)/2 =23 5°C Step 1: determine Tmean= (27.5 + 19.5)/2 =23.5 C Step 2: determine p:
Latitude: 35° North, Month: April, From standard Table p = 0 29Table p = 0.29
Step 3: calculate ETo: ETo = 0.29 (0.46 × 23.5 + 8) = 5.45 mm/day
Finally the mean reference crop evapotranspiration Finally, the mean reference crop evapotranspiration ETo =5.45 mm/day during the whole month of April
3030Prof. T I Eldho, Department of Civil Engineering, IIT Bombay

ReferencesReferences• Raj Vir Singh (2000), Watershed Planning and
Management, Yash Publishing House• J V S Murthy (1991) Watershed Management New Age • J.V.S Murthy (1991), Watershed Management, New Age
international Publications Ghanshyam Das (2000), Hydrology and soil conservation
ll f dengineering, Prentice Hall of India• http://en.wikipedia.org/wiki/Infiltration_(hydrology) http://www fao org/docrep/s2022e/s2022e07 htm http://www.fao.org/docrep/s2022e/s2022e07.htm Viessman and Lewis (2007), Introduction to Hydrology,
Pearson Education.
3131Prof. T I Eldho, Department of Civil Engineering, IIT Bombay

Tutorials - Question!.?. What are the different types of abstraction
losses associated with rainfall?. For the development of watershed management plans, what are the important abstraction losses to be considered?losses to be considered?.
For typical watersheds in: a) tropic, b) semiFor typical watersheds in: a) tropic, b) semi--arid and c) arid regions identify the arid and c) arid regions identify the arid, and c) arid regions, identify the arid, and c) arid regions, identify the significance of each losses.significance of each losses.
Illustrate various methodologies used to Illustrate various methodologies used to Illustrate various methodologies used to Illustrate various methodologies used to quantify them.quantify them.
3232
Prof. T I Eldho, Department of Civil Engineering, IIT Bombay

Self Evaluation - Questions!.Q Illustrate various hydrological processes within the
context of hydrological cycle.context of hydrological cycle. Describe different types of rain gauges. Compare the Thiessen & Isohyetal methods for
f ll b h bcomputing average rainfall & bring out the basic differences & advantages.
Discuss different methods of evapo-transpiration Discuss different methods of evapo transpiration estimation.
P f T I Eldh D t t f Ci il E i i IIT B b3333
Prof. T I Eldho, Department of Civil Engineering, IIT Bombay

Assignment- Questions?.g Q Describe important precipitation mechanisms. Discuss the importance of rainfall intensity duration & Discuss the importance of rainfall intensity, duration &
frequency in runoff generation. Describe various methods of estimation of infiltration. Illustrate surface runoff and mechanisms of
generation of surface runoff.
3434Prof. T I Eldho, Department of Civil Engineering, IIT Bombay
Unsolved Problem!.Unsolved Problem!.
For your watershed area, obtain the rainfall For your watershed area, obtain the rainfall data for the nearby rain gauge stations for data for the nearby rain gauge stations for f t U i i th d ) f t U i i th d ) few storms. Using various methods: a) few storms. Using various methods: a) arithmetic mean; b) Thiessen mean arithmetic mean; b) Thiessen mean method; c) Isohyetal method compute the method; c) Isohyetal method compute the method; c) Isohyetal method, compute the method; c) Isohyetal method, compute the average rainfall by all methods & compare. average rainfall by all methods & compare.
Draw the isohyets for the area consisting of the rain Draw the isohyets for the area consisting of the rain gauge network.gauge network.
Construct the Thiessen polygon.Construct the Thiessen polygon.Compute the average rainfallCompute the average rainfall Compute the average rainfall.Compute the average rainfall.
3535Prof. T I Eldho, Department of Civil Engineering, IIT Bombay

Dr. T. I. EldhoDr. T. I. EldhoProfessor,Professor,Department of Civil Engineering, Department of Civil Engineering, p g gp g gIndian Institute of Technology Bombay,Indian Institute of Technology Bombay,Mumbai, India, 400 076.Mumbai, India, 400 076.Email:Email: [email protected]@iitb.ac.in
3636
Email: Email: [email protected]@iitb.ac.inPhone: (022) Phone: (022) –– 25767339; Fax: 2576730225767339; Fax: 25767302http://www.http://www.civil.iitb.ac.incivil.iitb.ac.in