Embed Size (px)
Citation preview
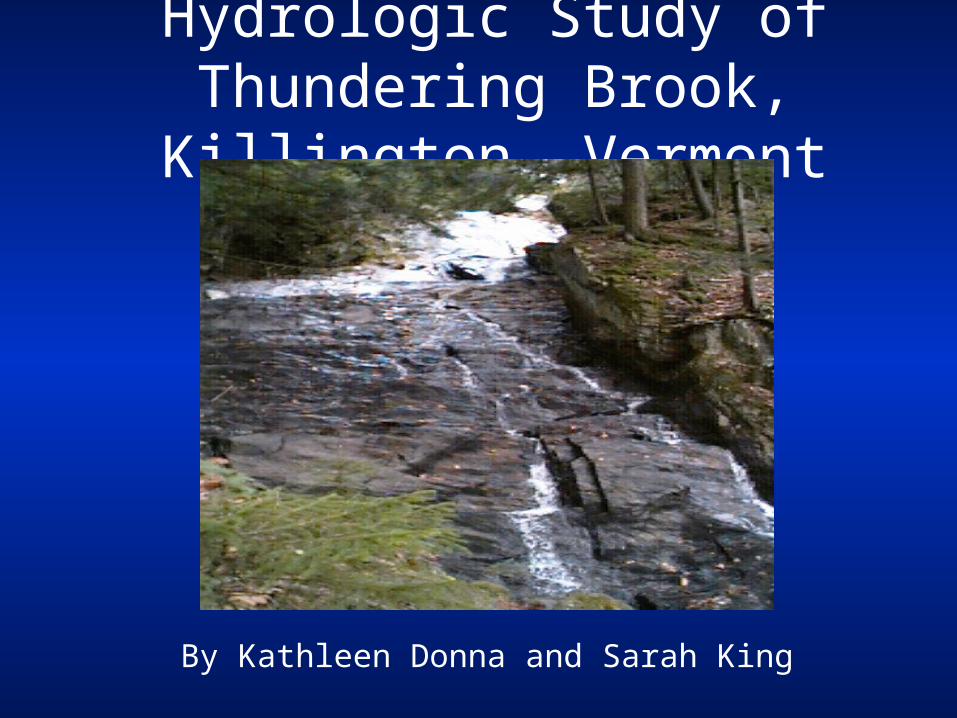
Hydrologic Study of Thundering Brook, Killington, Vermont
By Kathleen Donna and Sarah King

Outline
• Introduction
• Location Map
• Data Reduction
• Discussion
• Conclusion
• References
Introduction• The purpose of this study is to determine the height of the 200 year flood at the Thundering Brook and Ottaquechee River Drainage basin
• Section of Appalacian Trail must be moved
• Flow records of Vermont Streams, graphed and analyzed, probability analysis
• Manning Equation used to determine the depth of the flood water
• Depth of flood water used to determine height of boardwalk
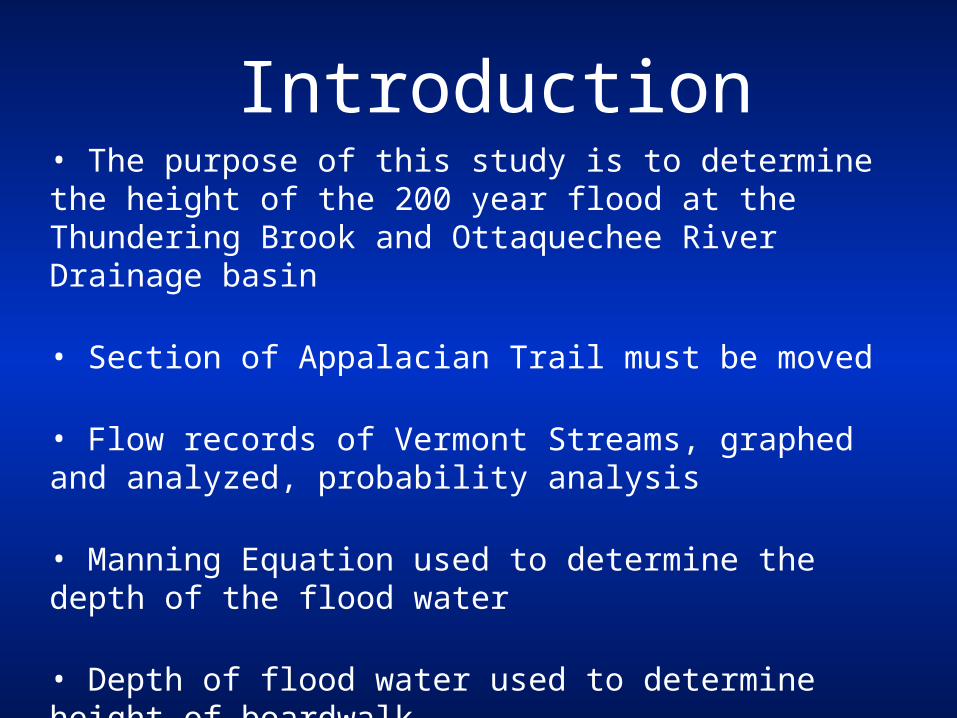
Location Map
Vermont
Killington, Vermont
N
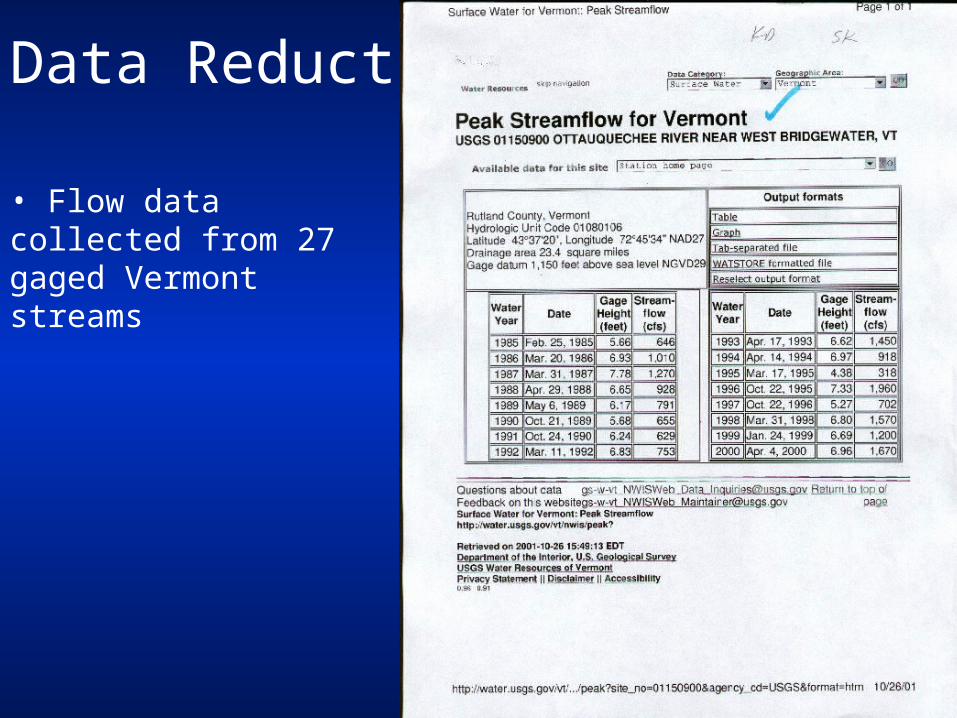
Data Reduction
• Flow data collected from 27 gaged Vermont streams
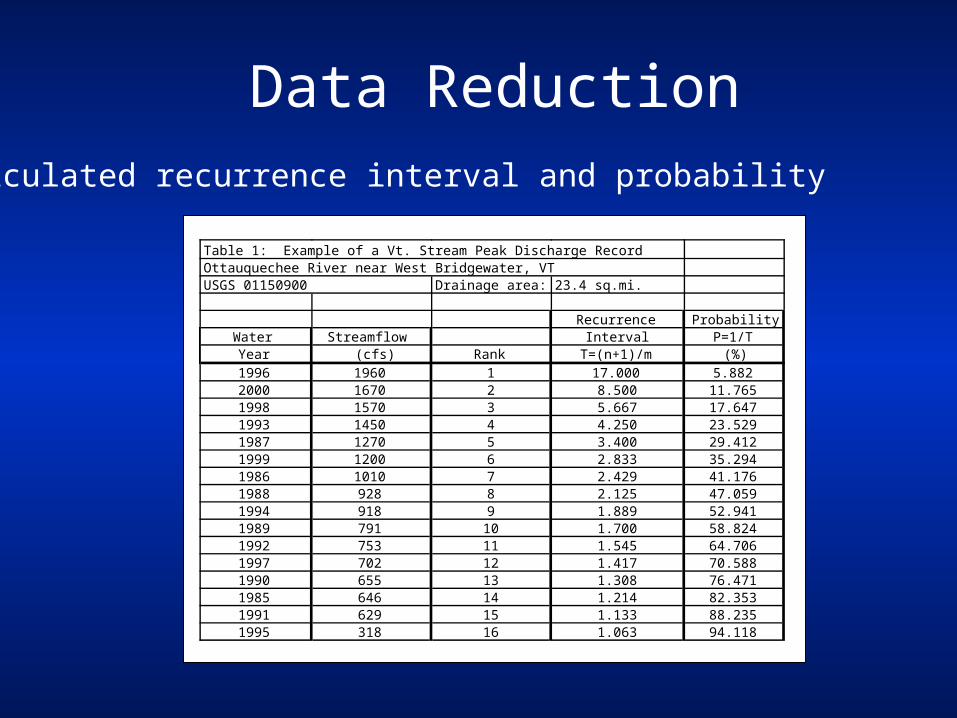
Data Reduction• Calculated recurrence interval and probability
Table 1: Example of a Vt. Stream Peak Discharge RecordOttauquechee River near West Bridgewater, VT USGS 01150900 Drainage area: 23.4 sq.mi.
Recurrence ProbabilityWater Streamflow Interval P=1/TYear (cfs) Rank T=(n+1)/m (%)1996 1960 1 17.000 5.8822000 1670 2 8.500 11.7651998 1570 3 5.667 17.6471993 1450 4 4.250 23.5291987 1270 5 3.400 29.4121999 1200 6 2.833 35.2941986 1010 7 2.429 41.1761988 928 8 2.125 47.0591994 918 9 1.889 52.9411989 791 10 1.700 58.8241992 753 11 1.545 64.7061997 702 12 1.417 70.5881990 655 13 1.308 76.4711985 646 14 1.214 82.3531991 629 15 1.133 88.2351995 318 16 1.063 94.118
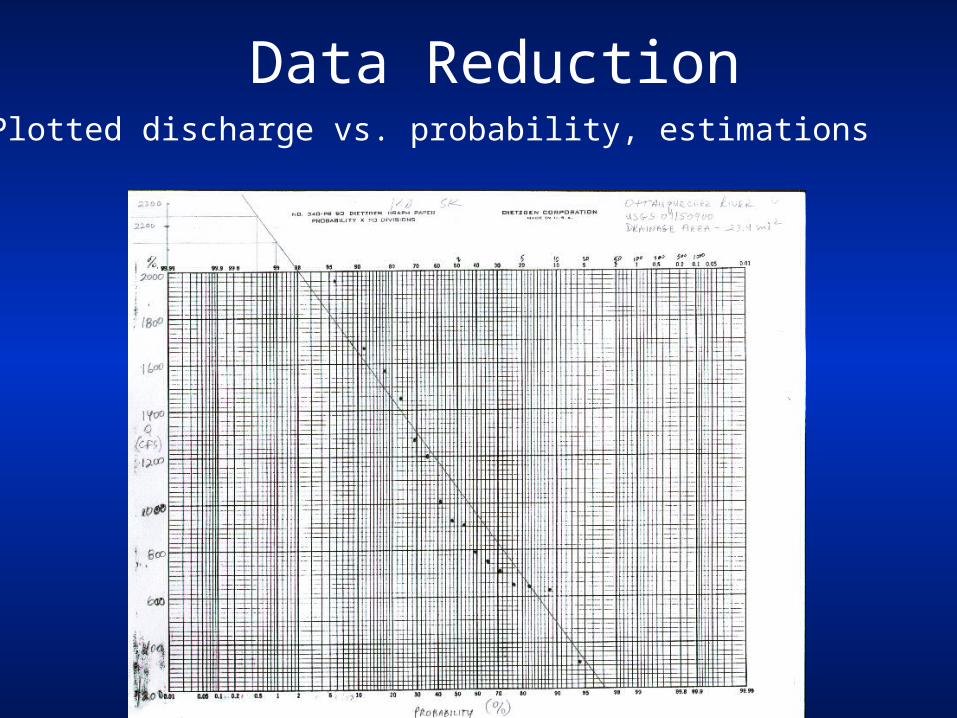
Data Reduction• Plotted discharge vs. probability, estimations

Data Reduction• Plotted discharge/area relation graphs, estimations
100 yr. Recurrence Interval
100
1000
10000
100000
1000000
1.00 10.00 100.00 1000.00 10000.00
Drainage Area (mi^2)Figure 10: Peak Discharge vs Drainage Basin Area for 100 yr. Recurrence
Interval
Q (cfs)
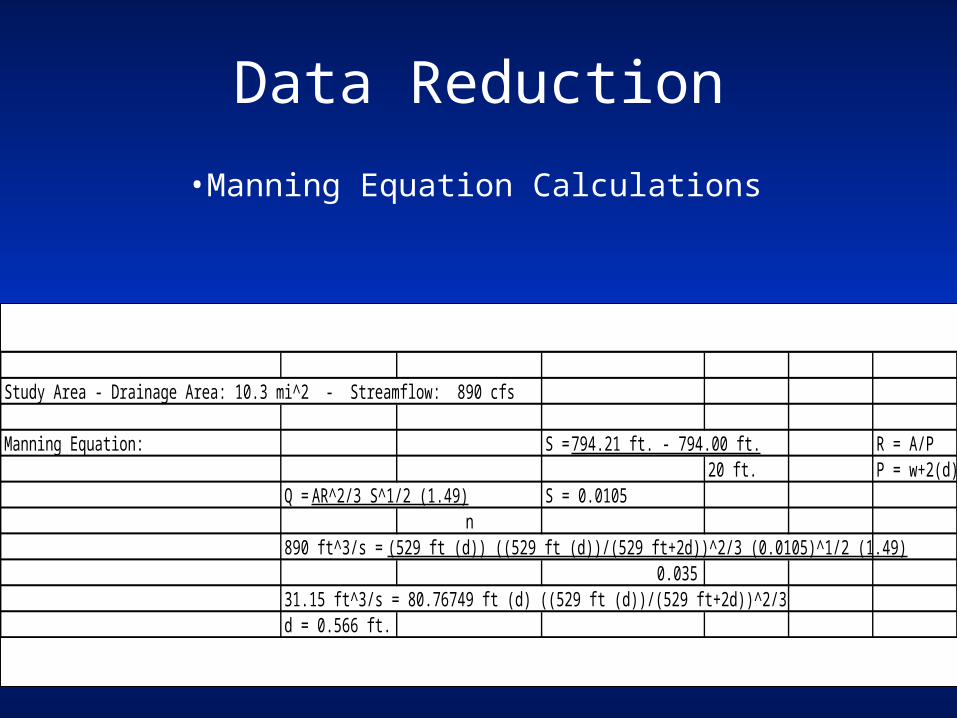
Data Reduction
•Manning Equation Calculations
Study Area - Drainage Area: 10.3 mi^2 - Streamflow: 890 cfs
Manning Equation: S = 794.21 ft. - 794.00 ft. R = A/P20 ft. P = w+2(d)
Q = AR^2/3 S^1/2 (1.49) S = 0.0105 n890 ft^3/s = (529 ft (d)) ((529 ft (d))/(529 ft+2d))^2/3 (0.0105)^1/2 (1.49)
0.03531.15 ft^3/s = 80.76749 ft (d) ((529 ft (d))/(529 ft+2d))^2/3d = 0.566 ft.
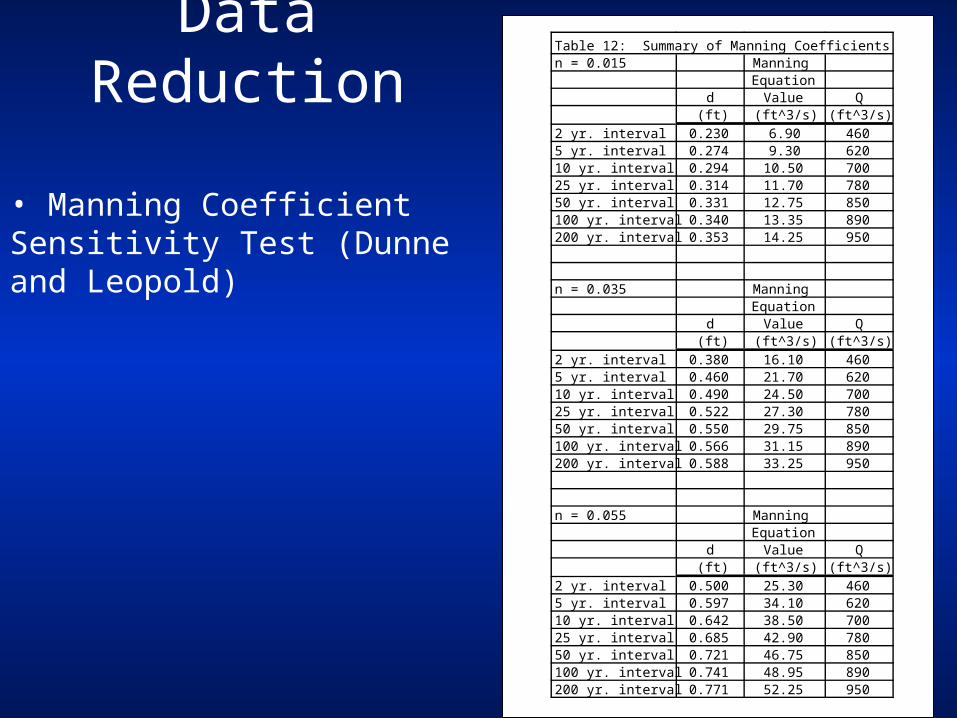
Data Reduction
• Manning Coefficient Sensitivity Test (Dunne and Leopold)
Table 12: Summary of Manning Coefficientsn = 0.015 Manning
Equationd Value Q
(ft) (ft^3/s) (ft^3/s)2 yr. interval 0.230 6.90 4605 yr. interval 0.274 9.30 62010 yr. interval 0.294 10.50 70025 yr. interval 0.314 11.70 78050 yr. interval 0.331 12.75 850100 yr. interval 0.340 13.35 890200 yr. interval 0.353 14.25 950
n = 0.035 ManningEquation
d Value Q(ft) (ft^3/s) (ft^3/s)
2 yr. interval 0.380 16.10 4605 yr. interval 0.460 21.70 62010 yr. interval 0.490 24.50 70025 yr. interval 0.522 27.30 78050 yr. interval 0.550 29.75 850100 yr. interval 0.566 31.15 890200 yr. interval 0.588 33.25 950
n = 0.055 ManningEquation
d Value Q(ft) (ft^3/s) (ft^3/s)
2 yr. interval 0.500 25.30 4605 yr. interval 0.597 34.10 62010 yr. interval 0.642 38.50 70025 yr. interval 0.685 42.90 78050 yr. interval 0.721 46.75 850100 yr. interval 0.741 48.95 890200 yr. interval 0.771 52.25 950
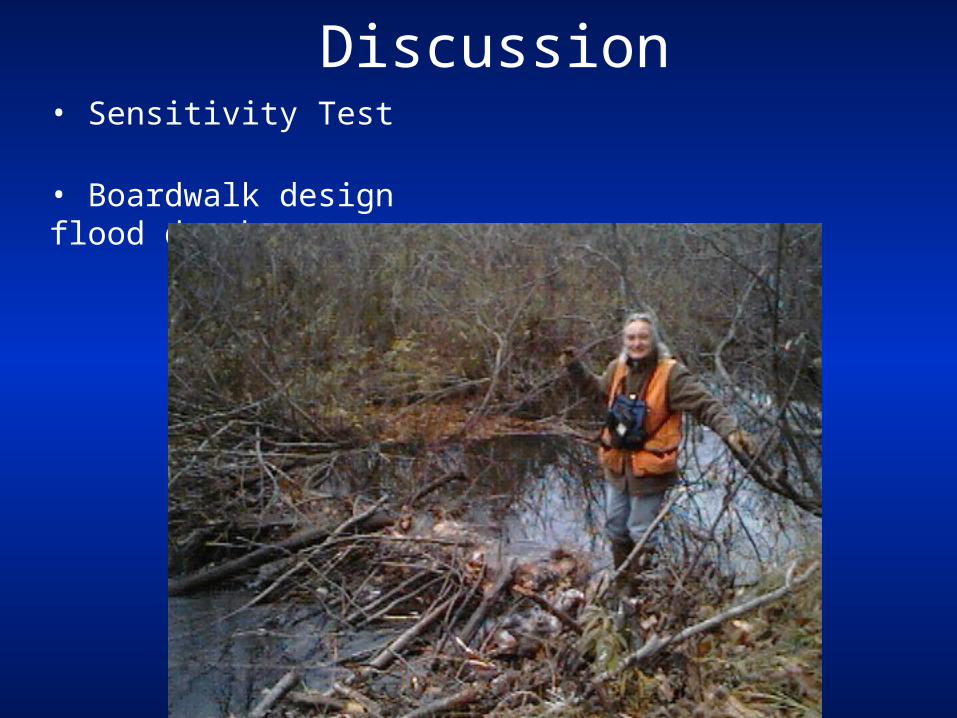
Discussion• Sensitivity Test
• Boardwalk design flood depth
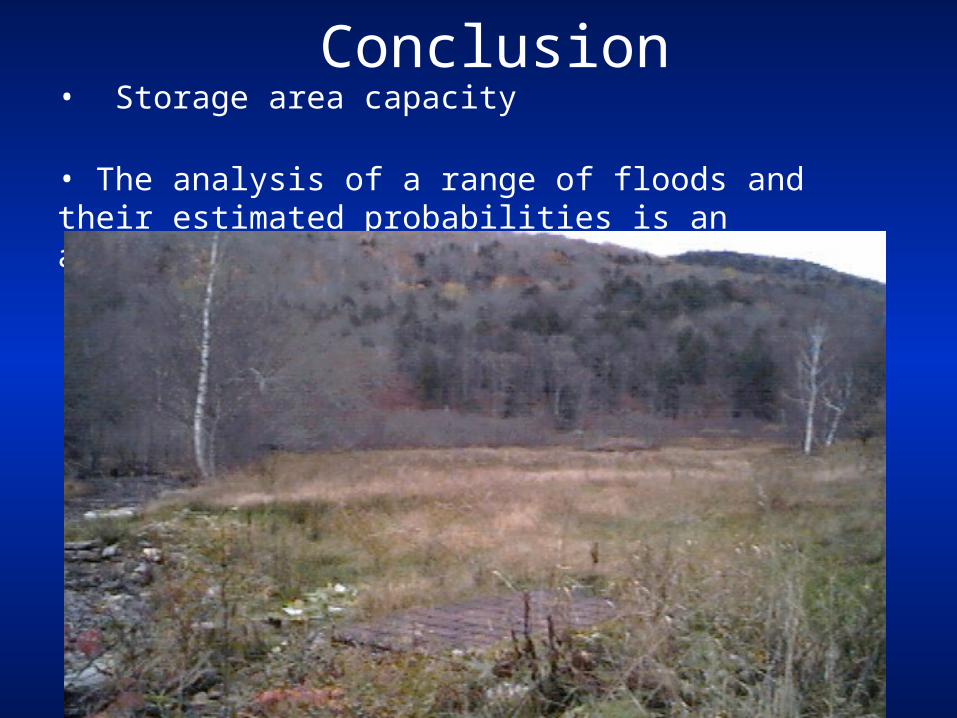
Conclusion• Storage area capacity
• The analysis of a range of floods and their estimated probabilities is an acceptable flood-prediction method (NRC)
References
• USGS (2002) http://water.usgs.gov/vt/nwis/peak?…
• National Research Council (1988) Estimating Probabilities of Extreme Floods, National Academy Press, Washington, DC
• Dunne, Thomas and Leopold, Luna B. (1998) Water in Environmental Planning, W. H. Freeman and Company, New York.