Embed Size (px)
Citation preview
Hyflux Ltd1H FY2014 Results Review1H FY2014 Results Review
7 August 2014
Slide 1
FORWARD-LOOKING STATEMENT
This presentation has been prepared by Hyflux Ltd for the information of the attendees of this presentation.
The presentation may contain forward-looking statements which are based on current expectations, projections and
assumptions about future events. Although Hyflux believes that these expectations, projections and assumptions are
reasonable, these forward-looking statements are subject to risks, uncertainties and assumptions about Hyflux and its
business operations that could cause actual results to differ materially from those expressed or implied by these forward-
looking statements. Such risks include industry and economic conditions; currency fluctuations between the Singapore
dollar and other currencies; governmental, statutory, tax, public policy and regulatory changes; and the continued availability
of financing in the amounts and the terms necessary to support future business.
Investors are cautioned not to place undue reliance on these forward-looking statements which are based on current views
Disclaimer
Investors are cautioned not to place undue reliance on these forward-looking statements which are based on current views
of Hyflux’s management on future events.
Any forward-looking statement in this presentation is accurate only as of the date it is issued. Hyflux has no obligation to
publicly update or revise any forward-looking statement, whether as a result of new information, future events or otherwise,
except as required by law.
The presentation is not and does not constitute or form part of any offer, invitation or recommendation to subscribe for orpurchase any security and neither this presentation nor anything contained in it shall form the basis of, or be relied upon inconnection with, any contract, commitment or investment decision.
No representation or warranty express or implied is made as to, and no reliance should be placed on, the fairness, accuracy,completeness or correctness of the information or opinions contained herein. None of Hyflux Ltd or any of its affiliates,advisors or representatives shall have any liability whatsoever (in negligence or otherwise) for any loss howsoever arisingfrom any use of this document or its contents or otherwise arising in connection with this presentation.
Slide 2
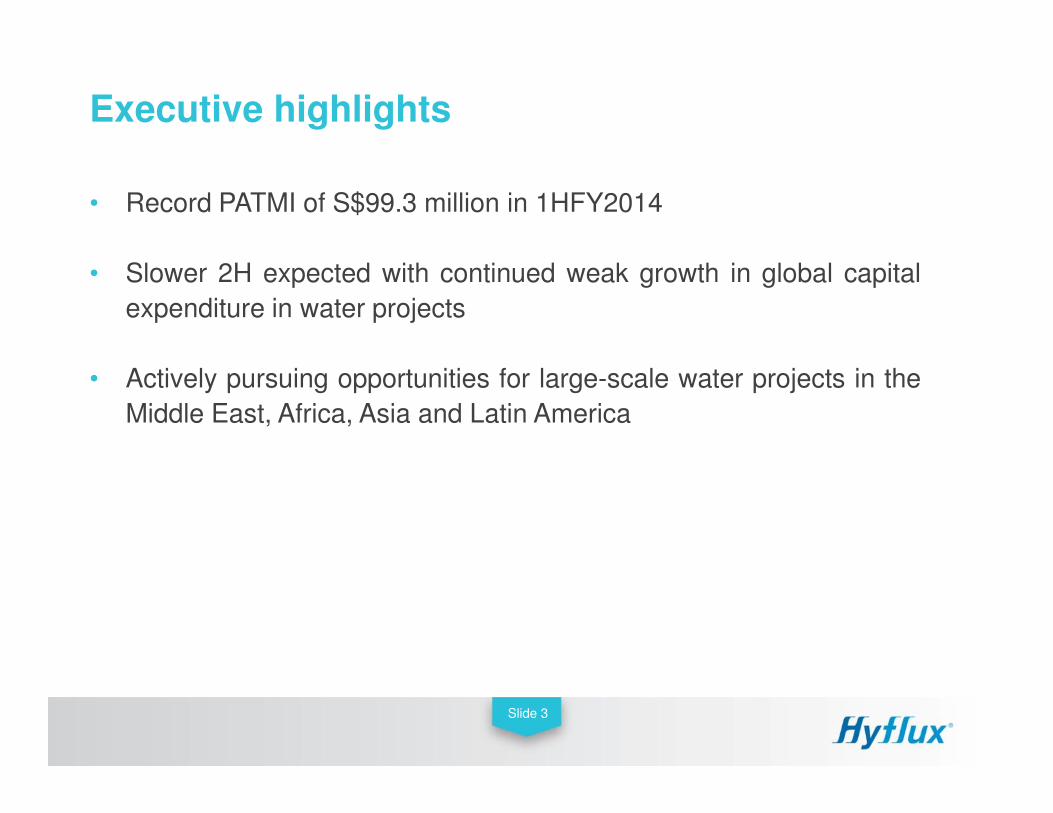
• Record PATMI of S$99.3 million in 1HFY2014
• Slower 2H expected with continued weak growth in global capital
expenditure in water projects
• Actively pursuing opportunities for large-scale water projects in the
Middle East, Africa, Asia and Latin America
Executive highlights
Middle East, Africa, Asia and Latin America
Slide 3
Revenue & profit
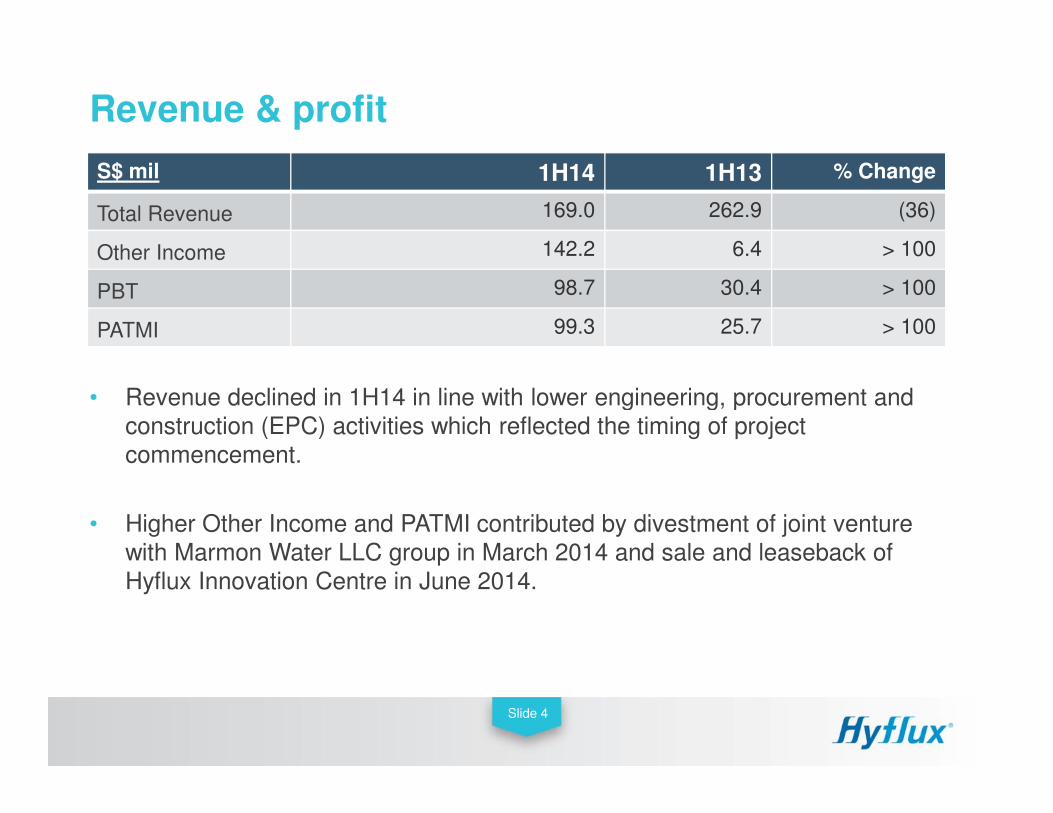
S$ mil 1H14 1H13 % Change
Total Revenue 169.0 262.9 (36)
Other Income 142.2 6.4 > 100
PBT 98.7 30.4 > 100
PATMI 99.3 25.7 > 100
• Revenue declined in 1H14 in line with lower engineering, procurement and
Slide 4
• Revenue declined in 1H14 in line with lower engineering, procurement and construction (EPC) activities which reflected the timing of project commencement.
• Higher Other Income and PATMI contributed by divestment of joint venture with Marmon Water LLC group in March 2014 and sale and leaseback of Hyflux Innovation Centre in June 2014.

Asia ex-China and municipal sector continued to be key contributors
S$ mil S$ mil
228.8 (87%)150
200
250
300
Asia ex-China17.9 (11%)
18.2 (7%)
4.0 (2%)
3.4 (1%)
150
200
250
300
Others
Revenue by Region Revenue by Sector
Slide 5
7.5 (5%) 11.0 (4%)22.2 (13%) 23.2 (9%)
139.3 (82%)
228.8 (87%)
0
50
100
150
1H14 1H13
China
MENA
147.1 (87%)
241.4 (92%)
17.9 (11%)
0
50
100
150
1H14 1H13
Industrial
Municipal
Expenses
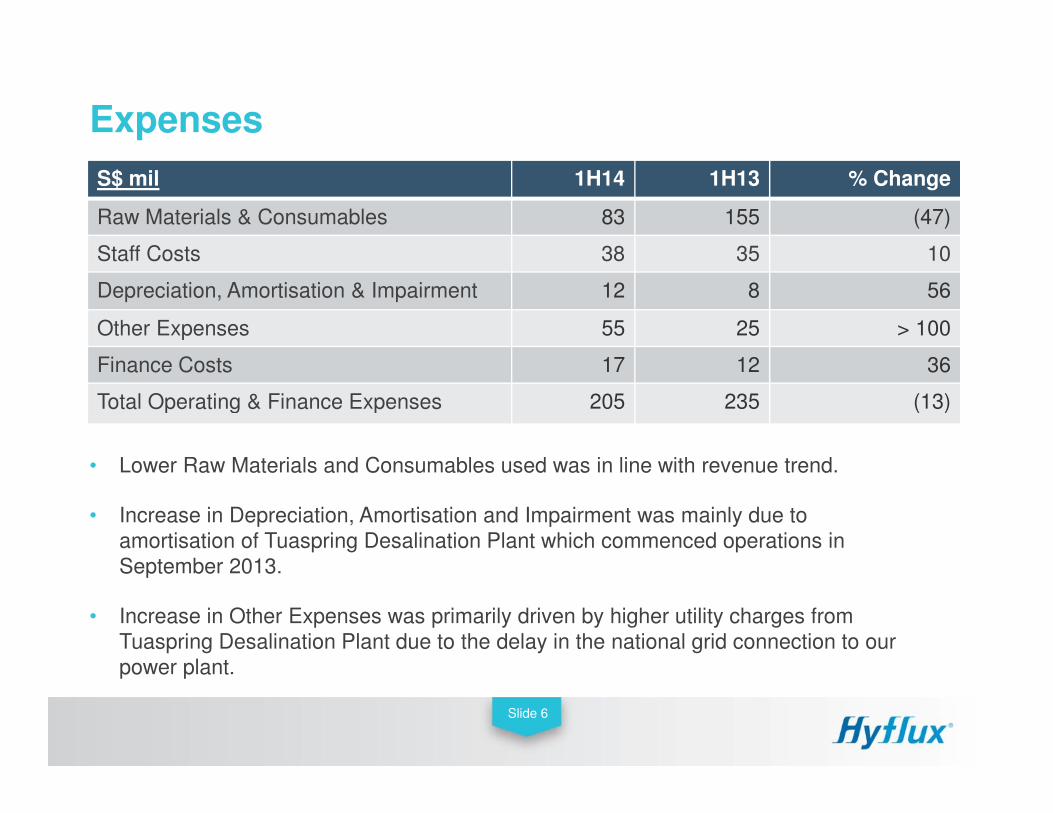
S$ mil 1H14 1H13 % Change
Raw Materials & Consumables 83 155 (47)
Staff Costs 38 35 10
Depreciation, Amortisation & Impairment 12 8 56
Other Expenses 55 25 > 100
Finance Costs 17 12 36
Total Operating & Finance Expenses 205 235 (13)
Slide 6
Total Operating & Finance Expenses 205 235 (13)
• Lower Raw Materials and Consumables used was in line with revenue trend.
• Increase in Depreciation, Amortisation and Impairment was mainly due to amortisation of Tuaspring Desalination Plant which commenced operations in September 2013.
• Increase in Other Expenses was primarily driven by higher utility charges from Tuaspring Desalination Plant due to the delay in the national grid connection to our power plant.
Balance sheet
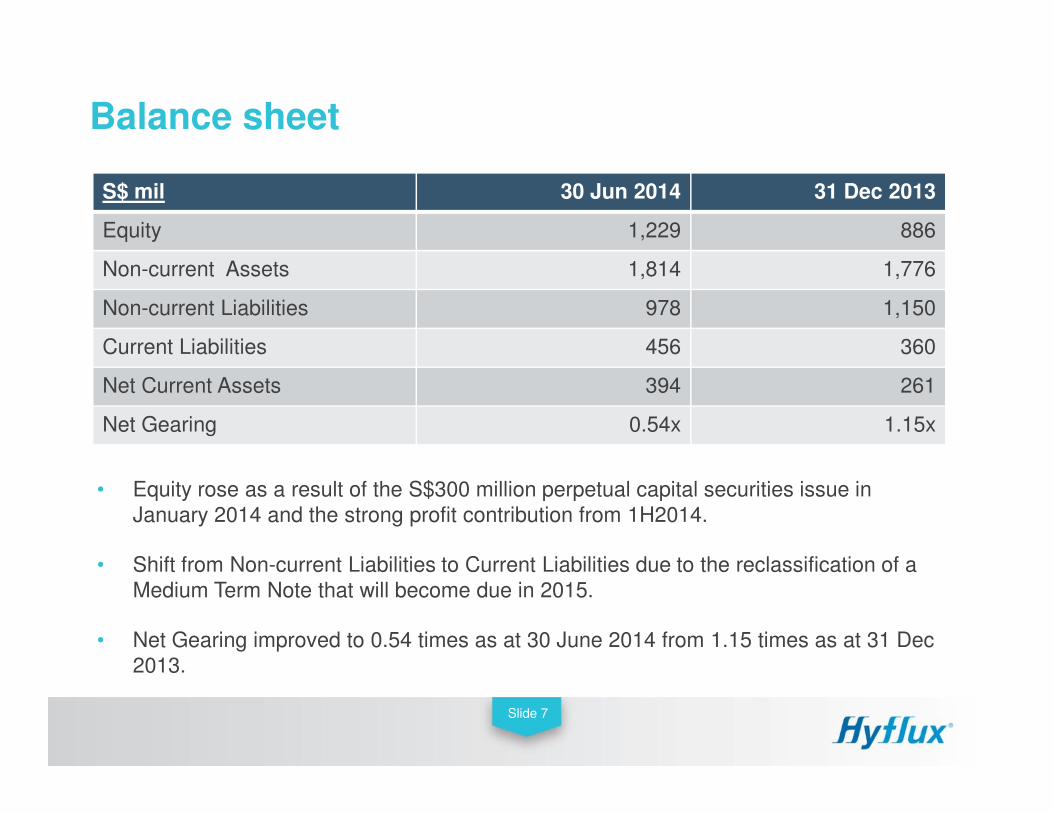
S$ mil 30 Jun 2014 31 Dec 2013
Equity 1,229 886
Non-current Assets 1,814 1,776
Non-current Liabilities 978 1,150
Current Liabilities 456 360
Net Current Assets 394 261
Slide 7
Net Gearing 0.54x 1.15x
• Equity rose as a result of the S$300 million perpetual capital securities issue in January 2014 and the strong profit contribution from 1H2014.
• Shift from Non-current Liabilities to Current Liabilities due to the reclassification of a Medium Term Note that will become due in 2015.
• Net Gearing improved to 0.54 times as at 30 June 2014 from 1.15 times as at 31 Dec 2013.
Cash flow
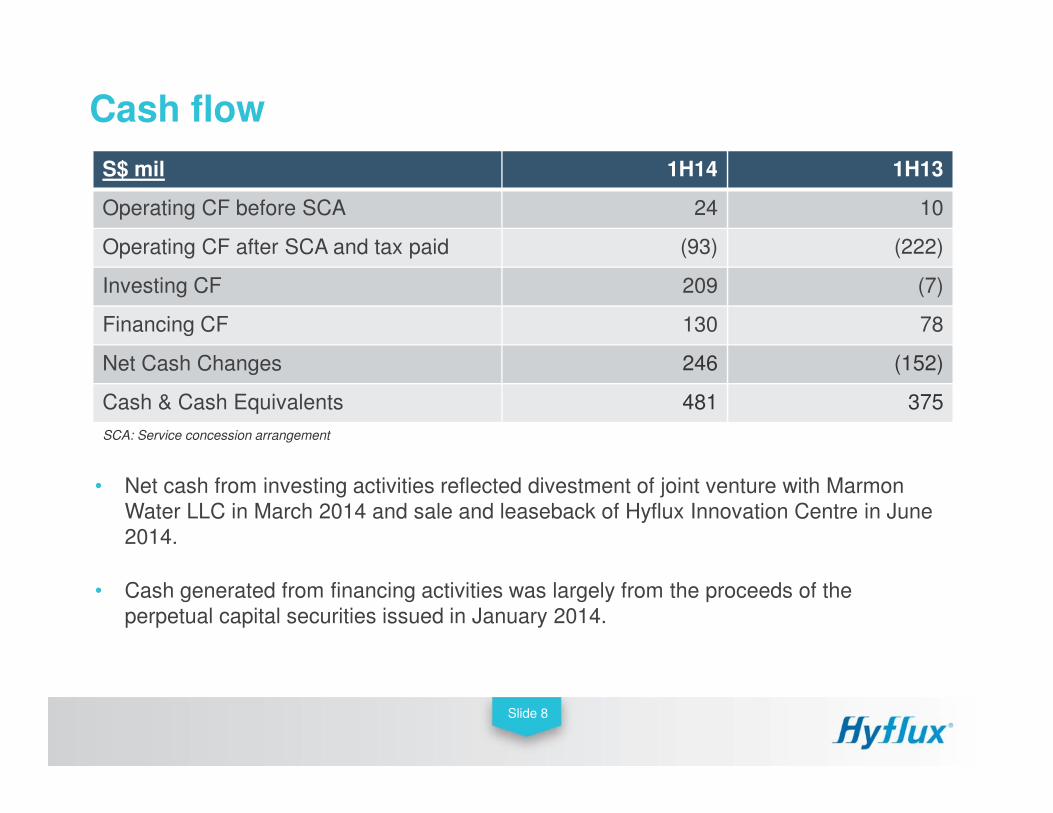
S$ mil 1H14 1H13
Operating CF before SCA 24 10
Operating CF after SCA and tax paid (93) (222)
Investing CF 209 (7)
Financing CF 130 78
Net Cash Changes 246 (152)
Cash & Cash Equivalents 481 375
Slide 8
Cash & Cash Equivalents 481 375
SCA: Service concession arrangement
• Net cash from investing activities reflected divestment of joint venture with Marmon Water LLC in March 2014 and sale and leaseback of Hyflux Innovation Centre in June 2014.
• Cash generated from financing activities was largely from the proceeds of the perpetual capital securities issued in January 2014.
748
553
931
1,025732 682
1,500
2,000
2,500
3,000
EPC
O&M
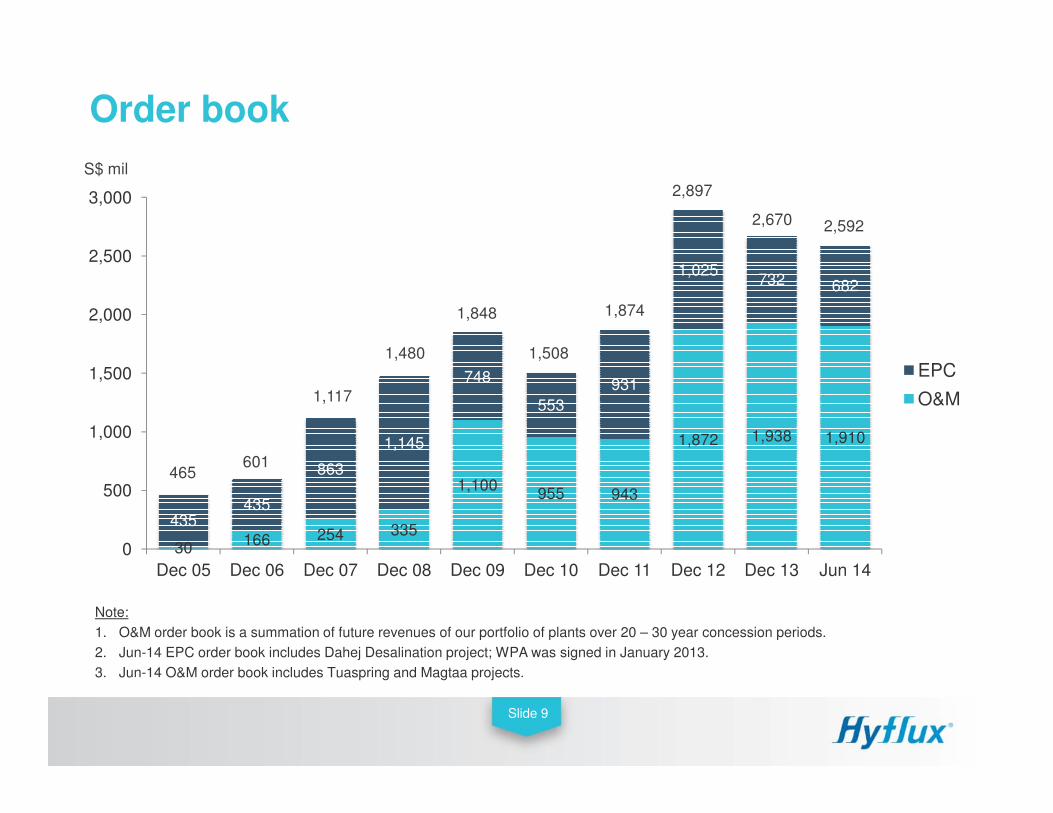
Order book
S$ mil
2,897
2,670 2,592
1,874
1,508
1,848
1,480
1,117
30166 254 335
1,100955 943
1,872 1,938 1,910
435435
863
1,145
553
0
500
1,000
Dec 05 Dec 06 Dec 07 Dec 08 Dec 09 Dec 10 Dec 11 Dec 12 Dec 13 Jun 14
O&M
Slide 9
Note:
1. O&M order book is a summation of future revenues of our portfolio of plants over 20 – 30 year concession periods.
2. Jun-14 EPC order book includes Dahej Desalination project; WPA was signed in January 2013.
3. Jun-14 O&M order book includes Tuaspring and Magtaa projects.
601465
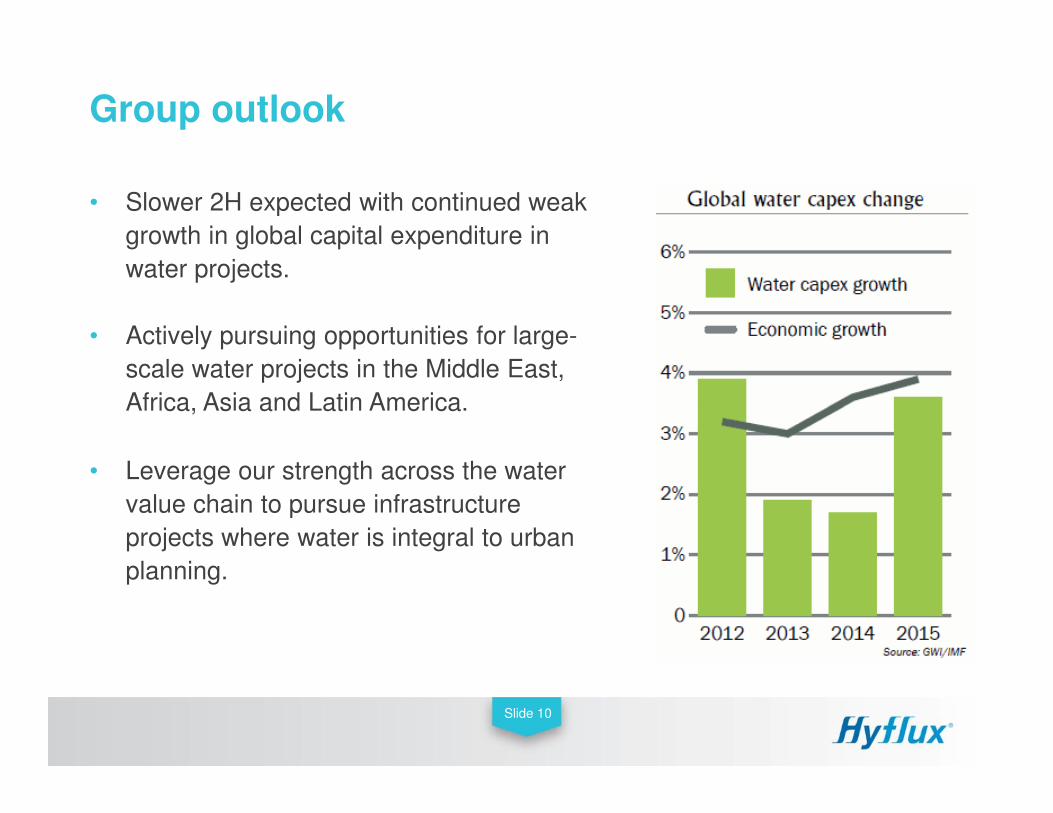
• Slower 2H expected with continued weak
growth in global capital expenditure in
water projects.
• Actively pursuing opportunities for large-
scale water projects in the Middle East,
Africa, Asia and Latin America.
Group outlook
Africa, Asia and Latin America.
• Leverage our strength across the water
value chain to pursue infrastructure
projects where water is integral to urban
planning.
Slide 10
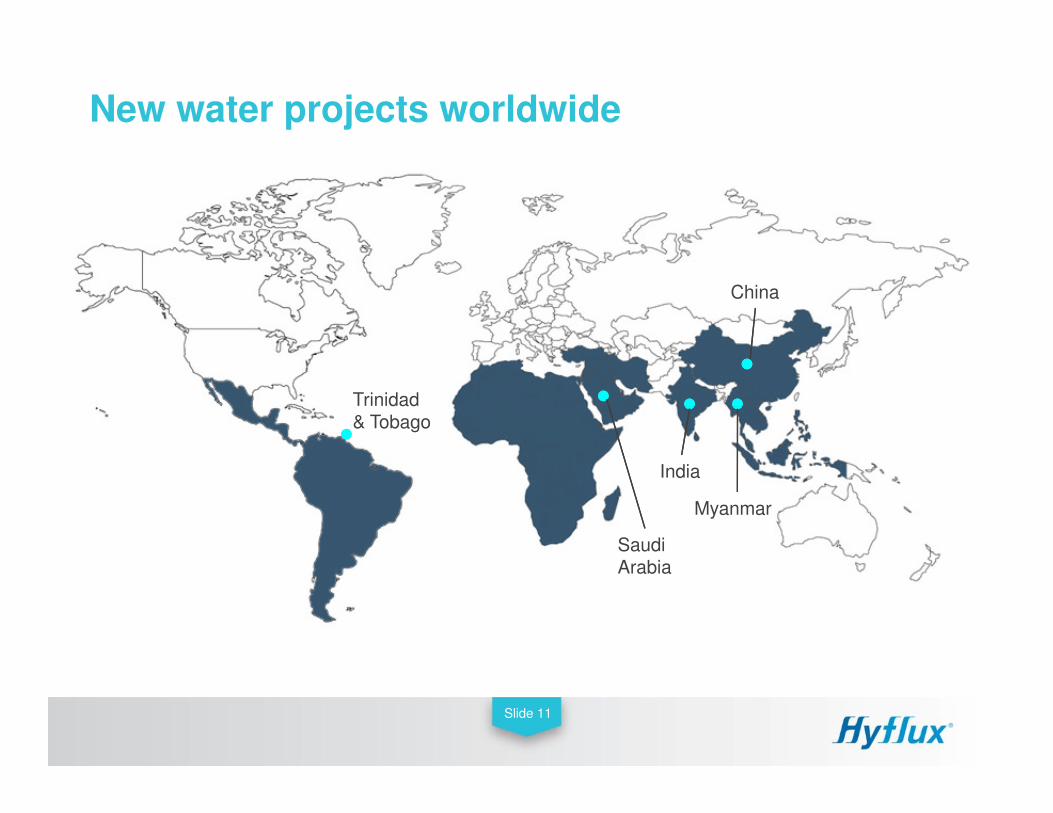
New water projects worldwide
China
Trinidad
Slide 11
Saudi Arabia
Myanmar
India
Trinidad& Tobago
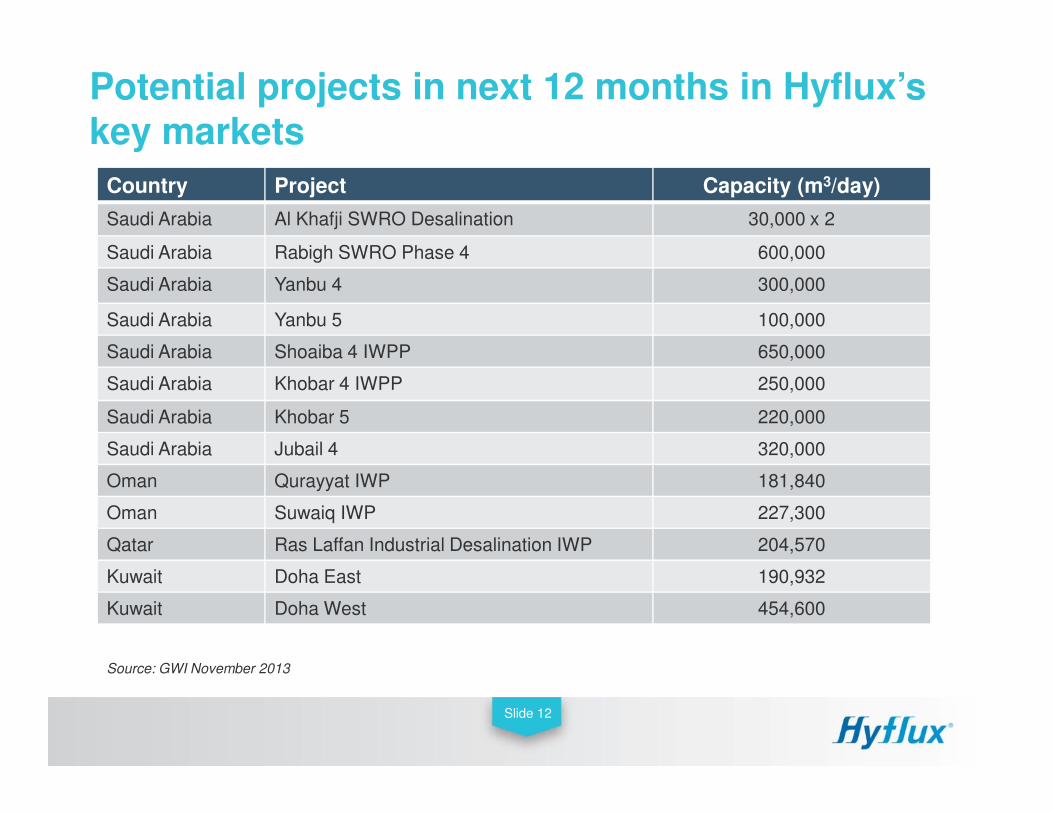
Potential projects in next 12 months in Hyflux’skey markets
Country Project Capacity (m3/day)
Saudi Arabia Al Khafji SWRO Desalination 30,000 x 2
Saudi Arabia Rabigh SWRO Phase 4 600,000
Saudi Arabia Yanbu 4 300,000
Saudi Arabia Yanbu 5 100,000
Saudi Arabia Shoaiba 4 IWPP 650,000
Saudi Arabia Khobar 4 IWPP 250,000
Saudi Arabia Khobar 5 220,000
Slide 12
Saudi Arabia Khobar 5 220,000
Saudi Arabia Jubail 4 320,000
Oman Qurayyat IWP 181,840
Oman Suwaiq IWP 227,300
Qatar Ras Laffan Industrial Desalination IWP 204,570
Kuwait Doha East 190,932
Kuwait Doha West 454,600
Source: GWI November 2013
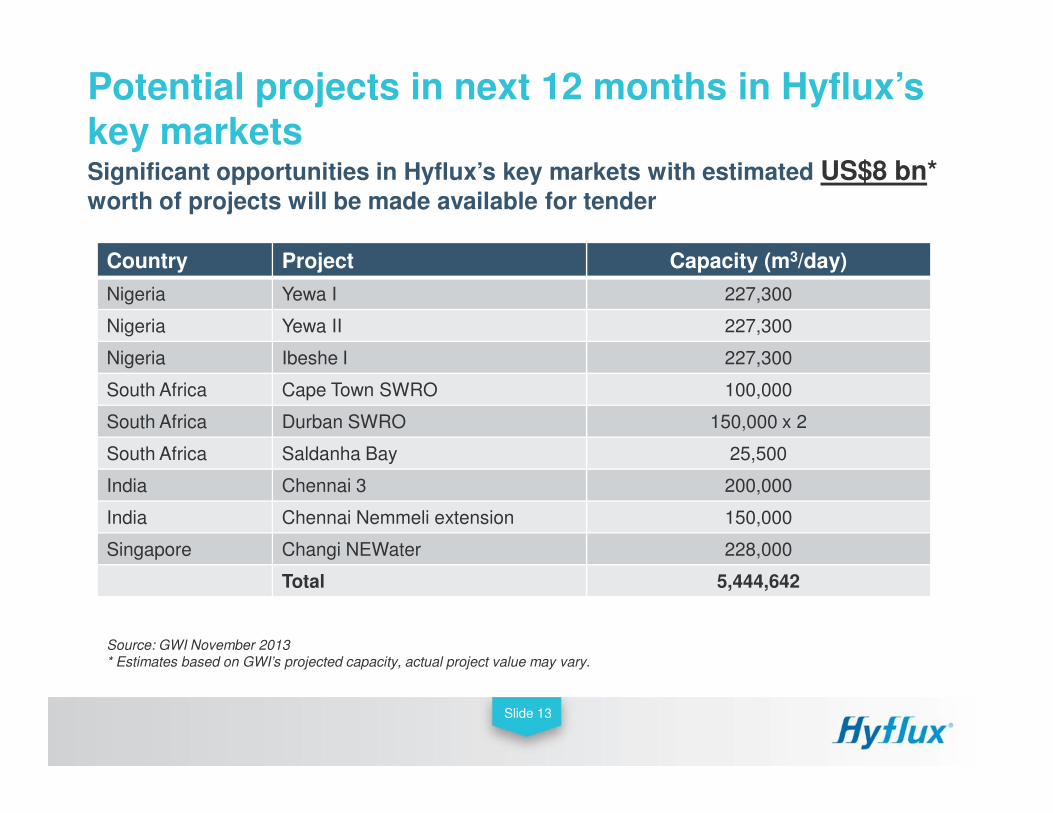
Potential projects in next 12 months in Hyflux’skey markets
Country Project Capacity (m3/day)
Nigeria Yewa I 227,300
Nigeria Yewa II 227,300
Nigeria Ibeshe I 227,300
South Africa Cape Town SWRO 100,000
Significant opportunities in Hyflux’s key markets with estimated US$8 bn* worth of projects will be made available for tender
Slide 13
South Africa Durban SWRO 150,000 x 2
South Africa Saldanha Bay 25,500
India Chennai 3 200,000
India Chennai Nemmeli extension 150,000
Singapore Changi NEWater 228,000
Total 5,444,642
Source: GWI November 2013* Estimates based on GWI’s projected capacity, actual project value may vary.
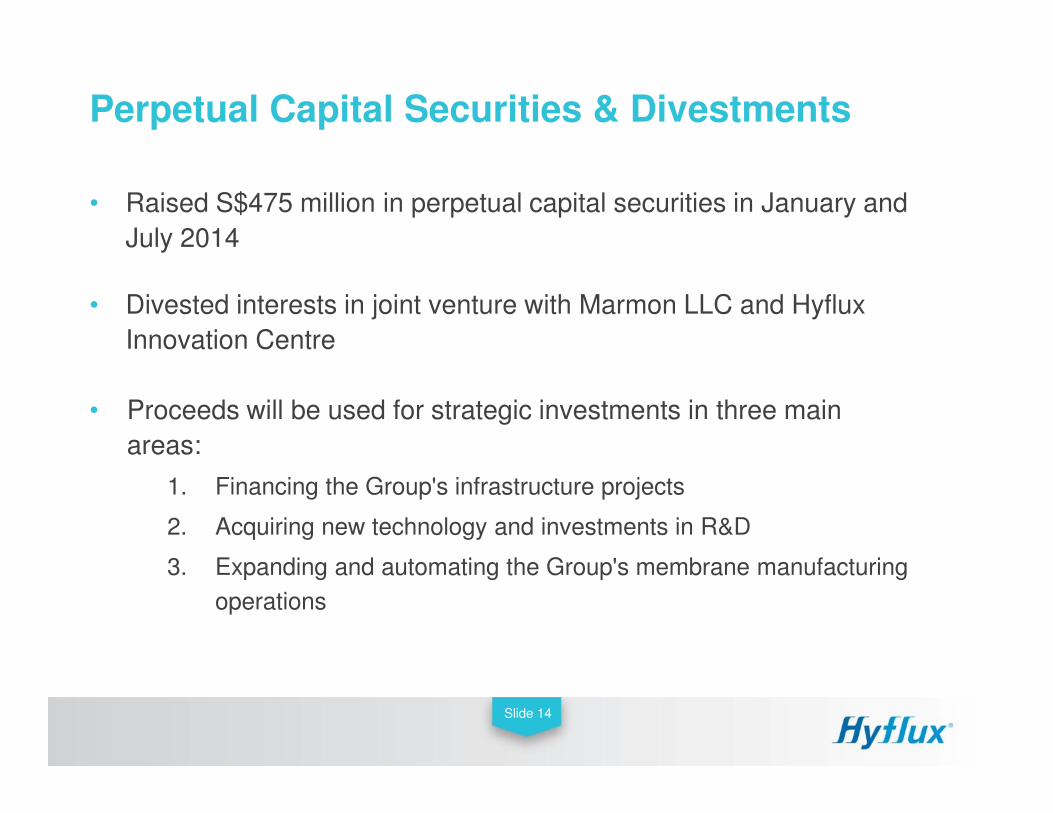
• Raised S$475 million in perpetual capital securities in January and
July 2014
• Divested interests in joint venture with Marmon LLC and Hyflux
Innovation Centre
• Proceeds will be used for strategic investments in three main
Perpetual Capital Securities & Divestments
• Proceeds will be used for strategic investments in three main
areas:
1. Financing the Group's infrastructure projects
2. Acquiring new technology and investments in R&D
3. Expanding and automating the Group's membrane manufacturing
operations
Slide 14
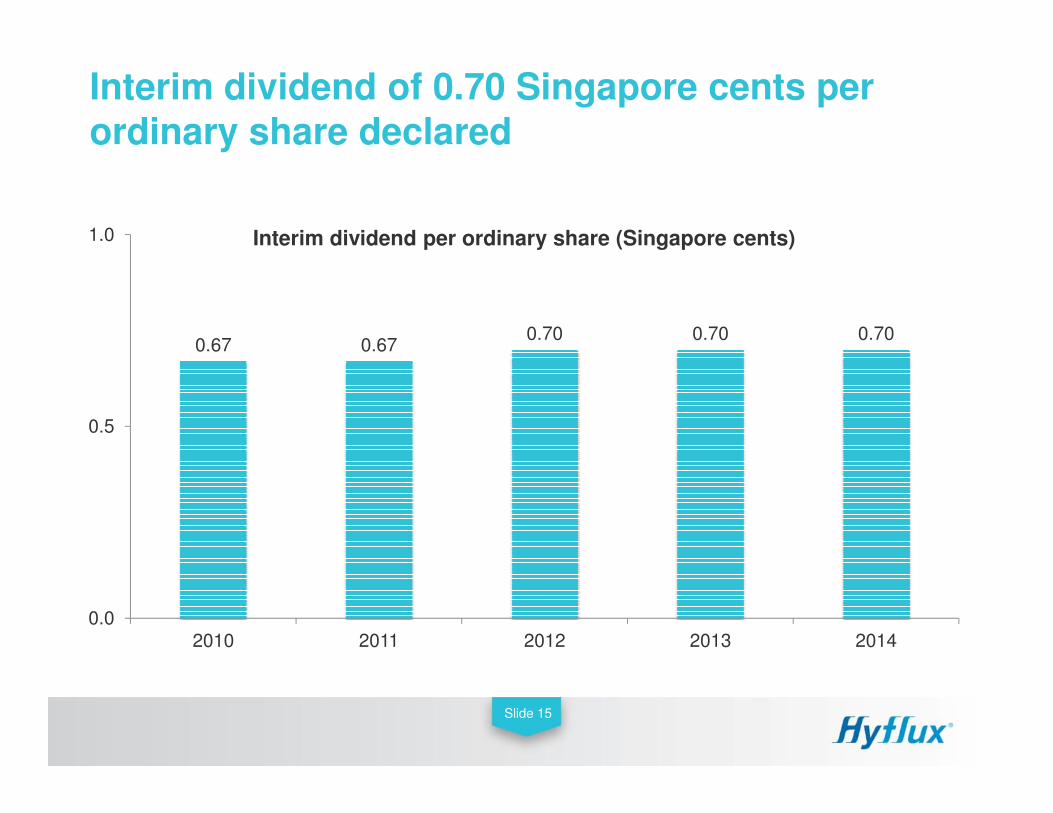
0.67 0.670.70 0.70 0.70
1.0 Interim dividend per ordinary share (Singapore cents)
Interim dividend of 0.70 Singapore cents per ordinary share declared
0.0
0.5
2010 2011 2012 2013 2014
Slide 15
Slide 16
16
WATER SOLUTIONS
THAT IMPACT LIVES


![1H of FY2014 (Apr. to Sep.) Earnings Presentation …Earnings Presentation (Overview) 2 Overview of 1H FY2014 Results [1] (Billion yen) 199 223 27 0 50 100 150 200 250 2013年度 上期](https://img.pdfslide.net/doc/110x75/5fa03eda5a294b078b3bb9fa/1h-of-fy2014-apr-to-sep-earnings-presentation-earnings-presentation-overview.jpg)