Embed Size (px)
Citation preview

Hypothesis Testing with z
Using the Normal Distributionin a Hypothesis Test
Example 1
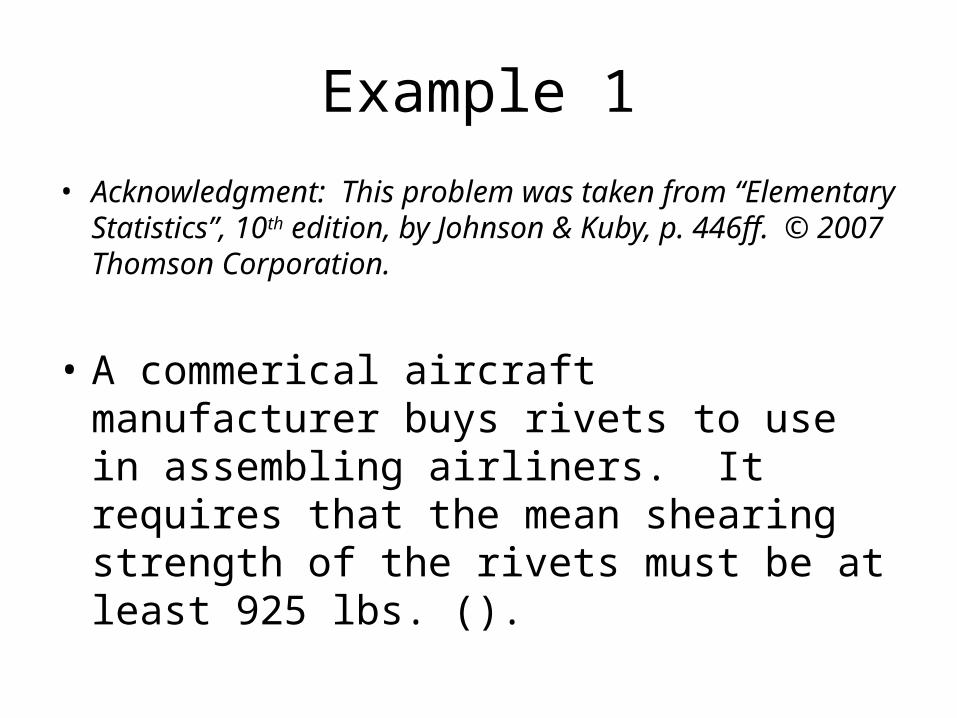
• Acknowledgment: This problem was taken from “Elementary Statistics”, 10th edition, by Johnson & Kuby, p. 446ff. © 2007 Thomson Corporation.
• A commerical aircraft manufacturer buys rivets to use in assembling airliners. It requires that the mean shearing strength of the rivets must be at least 925 lbs. ().
Example 1, continued
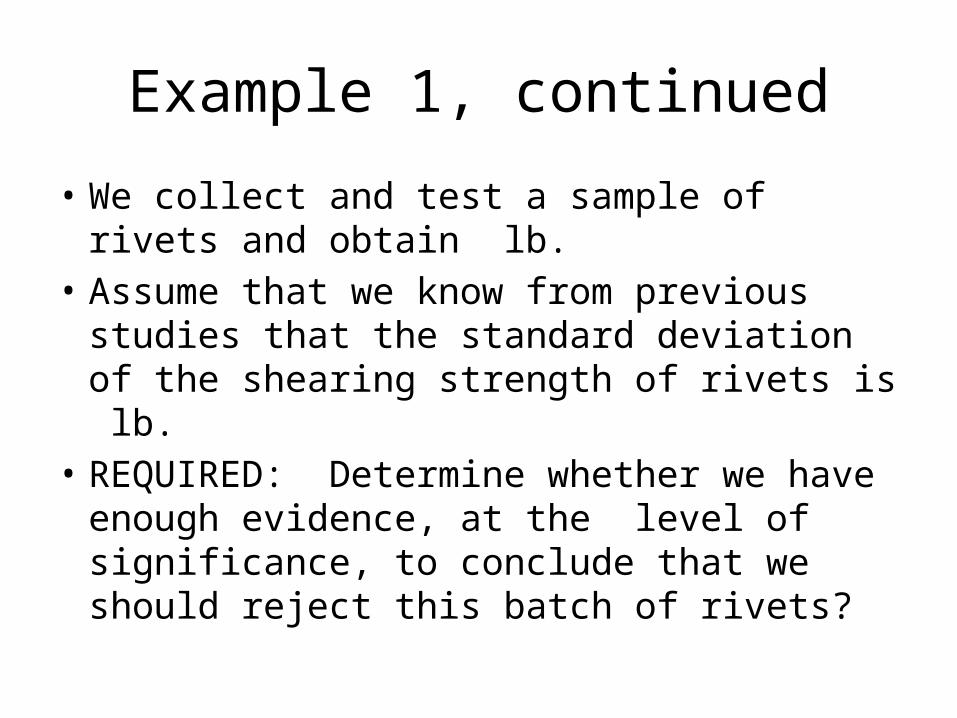
• We collect and test a sample of rivets and obtain lb.
• Assume that we know from previous studies that the standard deviation of the shearing strength of rivets is lb.
• REQUIRED: Determine whether we have enough evidence, at the level of significance, to conclude that we should reject this batch of rivets?

Example 1 initial direction
• We will use the Standard Normal Distribution and the z values to do this test.
• Justification for that:– We know the population’s standard deviation– And we have a “large” sample size: .– If we had a “small” sample size, this method
would also require that we know the rivet strength population is normally distributed.
Step 1. State the hypotheses
• The null hypothesis says that the rivets are ok:
• The alternative hypothesis is a claim that the rivets are too weak:
Step 2. Determine the Critical Value
• Left tail, Right tail, Two tail? Look at the direction of the null hypothesis. We have a LEFT-TAIL hypothesis test.
• Refer back to the . In this problem,
Step 2. Determine the Critical Value
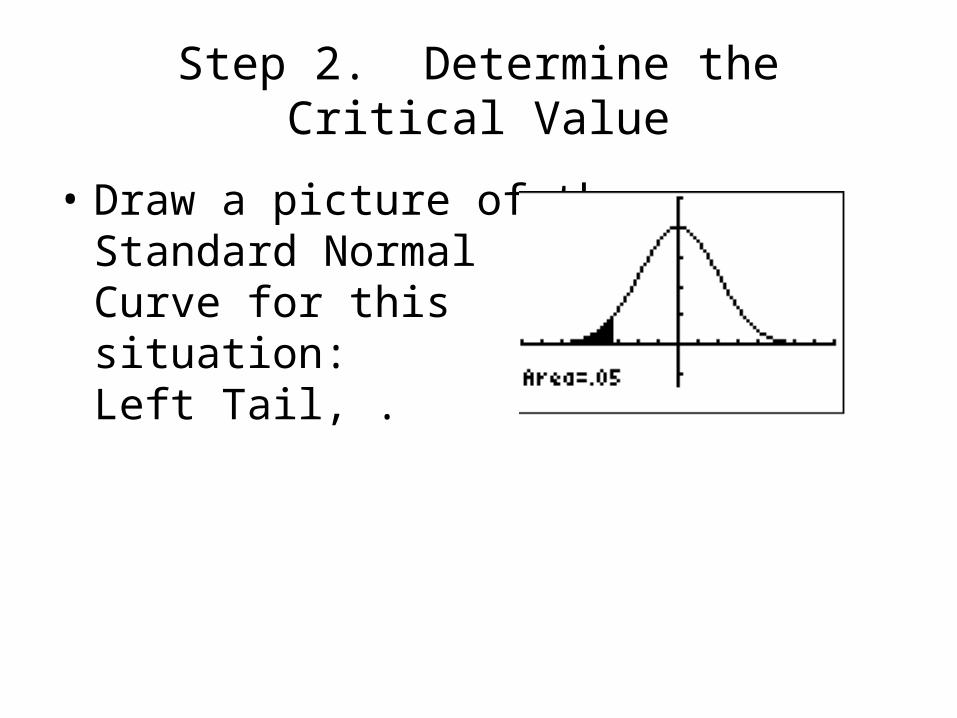
• Draw a picture of theStandard Normal Curve for this situation: Left Tail, .
Step 2. Determine the Critical Value
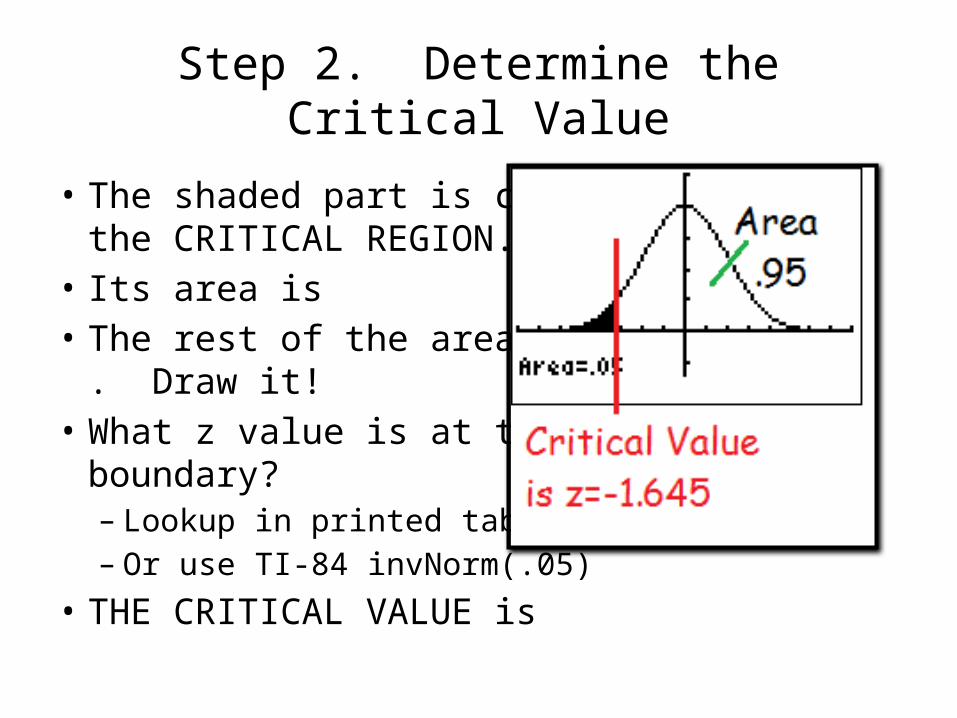
• The shaded part is called the CRITICAL REGION.
• Its area is • The rest of the area is
. Draw it!• What z value is at the
boundary? – Lookup in printed tables.– Or use TI-84 invNorm(.05)
• THE CRITICAL VALUE is

Step 3. Compute the Test Statistic
Formula In this example,
The Test Statistic is

Step 4. Make a Decision
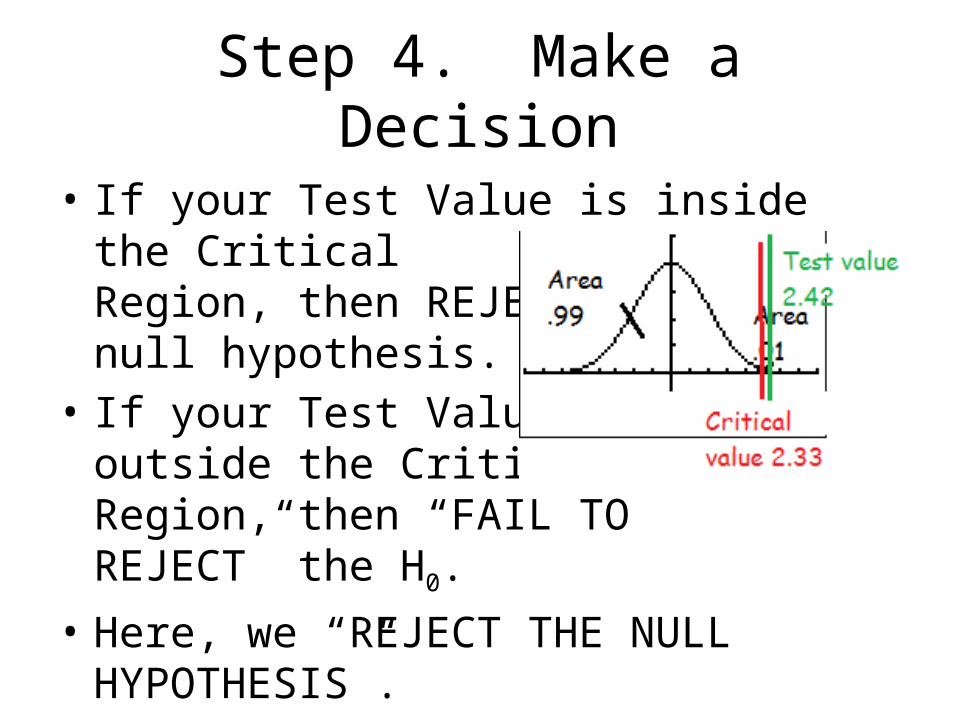
• If your Test Value is insidethe Critical Region,then REJECT the null hypothesis.
• If your Test Value is outside the CriticalRegion, then “FAIL TO REJECT” the H0.
• Here, we “FAIL TO REJECT”.
A remark about our decision
• The rivets we tested in our sample had a lower shearing strength than advertised.
• But not SIGNIFICANTLY lower at the level of significance.
• So it might just be the natural ups and downs of sampling. Lower, but not significantly so.
• We don’t have enough evidence to say “this is a bad lot”.
Step 5. Plain English conclusion
• The conclusion has to be suitable for a general audience.
• They don’t want to hear any Statistics lingo.
• Say something that a journalism school major could read in a news report.
Here’s what we can say:
“There is NOT enough evidence to conclude that
these rivets are SIGNIFICANTLY weaker
than the required strength.”
Example 2
• Acknowledgment: This problem was adapted from “Elementary Statistics”, 10th edition, by Johnson & Kuby, p. 446ff. © 2007 Thomson Corporation.
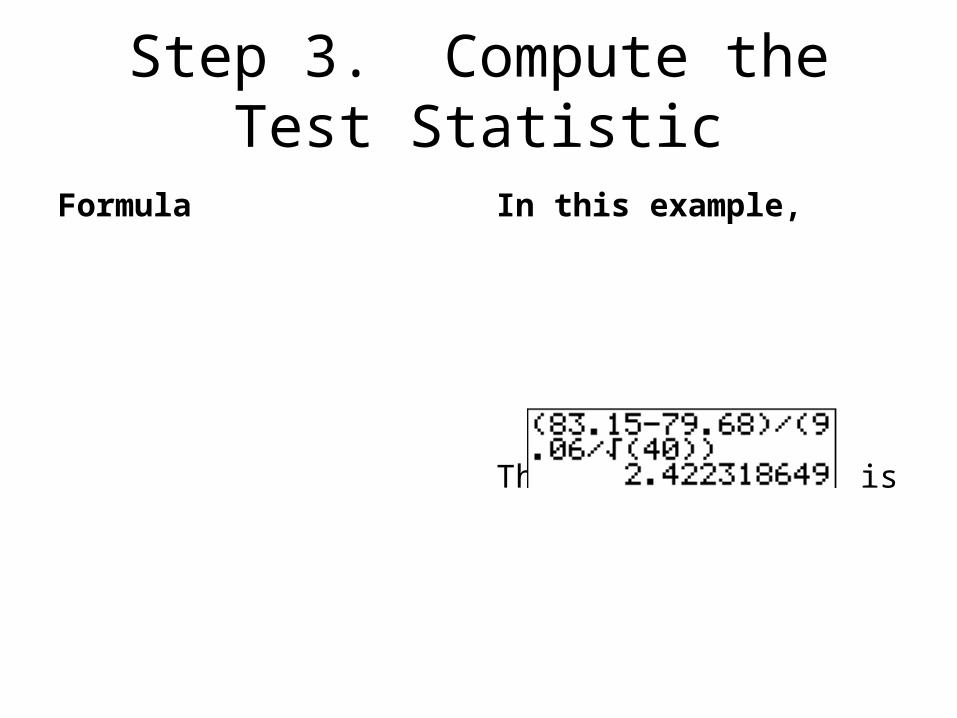
• Suppose the statewide paramedic exam has an average score of 79.68 with a standard deviation of 9.06. If 40 Darton State students took the exam and their mean score was 83.15, can we claim at the level of significance that our students score higher than the rest of the state?
Example 2 remarks
• We scored higher, that’s for sure. 83.15 vs. 79.68 statewide.
• But we have to be careful before issuing a press release or using these results as a recruiting tool
• We want the Central Limit Theorem to tell us that these results are too good to be mere coincidence.
Example 2 initial direction
• We will use the Standard Normal Distribution and the z values to do this test.
• Justification for that:– We know the population’s standard deviation– And we have a “large” sample size: .– If we had a “small” sample size, this method
would also require that we know the rivet strength population is normally distributed.
Step 1. State the hypotheses
• The null hypothesis says that our EMT students are not significantly better when compared to the rest of the state:
• The alternative hypothesis is a claim that our students performed extraordinarily well:
Step 2. Determine the Critical Value
• Left tail, Right tail, Two tail? Look at the direction of the null hypothesis. We have a RIGHT-TAIL hypothesis test.
• Because our Alternative Hypothesis is making a claim of a mean that’s bigger than the mean stated in the Null Hypothesis.
• Refer back to the . In this problem, 1

Step 2. Determine the Critical Value
• Draw a picture of theStandard Normal Curve for this situation: Right Tail, .
• The shaded part is called the CRITICAL REGION.• Its area is • The rest of the area is. Draw it!
Step 2. Determine the Critical Value
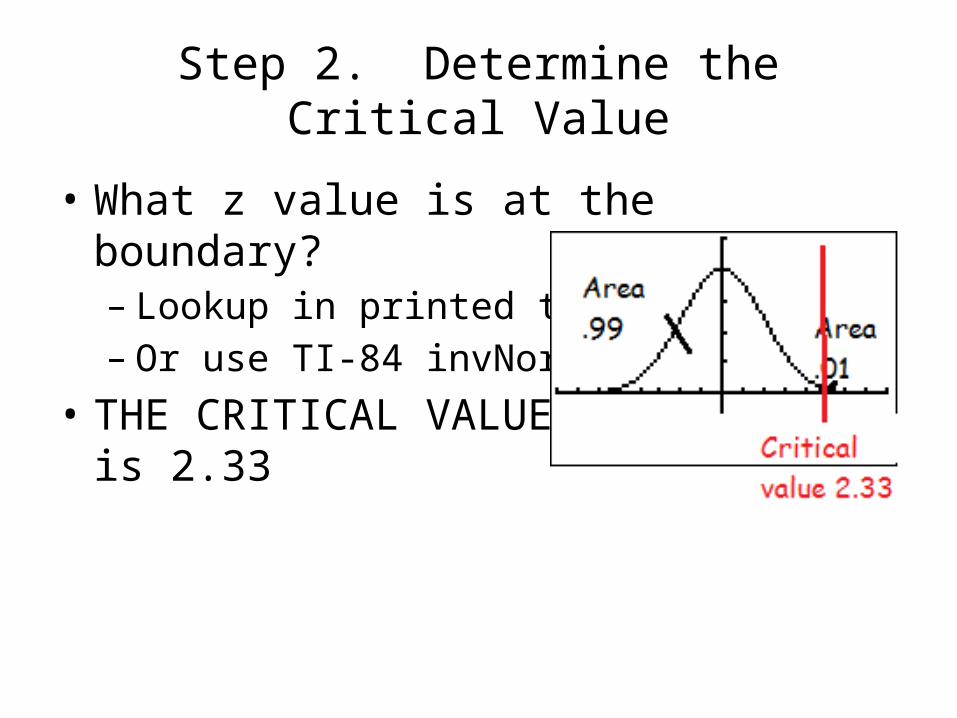
• What z value is at the boundary? – Lookup in printed tables.– Or use TI-84 invNorm(.99)
• THE CRITICAL VALUE is 2.33
Step 3. Compute the Test Statistic
Formula In this example,
The Test Statistic is
Step 4. Make a Decision
• If your Test Value is inside the CriticalRegion, then REJECT the null hypothesis.
• If your Test Value is outside the CriticalRegion, then “FAIL TO REJECT” the H0.
• Here, we “REJECT THE NULL HYPOTHESIS”.

Remarks about our decision
• If our students had scored 80 or 81 or so, it would have been higher, but not significantly higher.
• The Central Limit Theorem would have explained it as just variations in sampling.
• But we have something really big here, something improbable according to the C.L.T.
• Less than 1% chance this result was just luck.
Step 5. Plain English conclusion
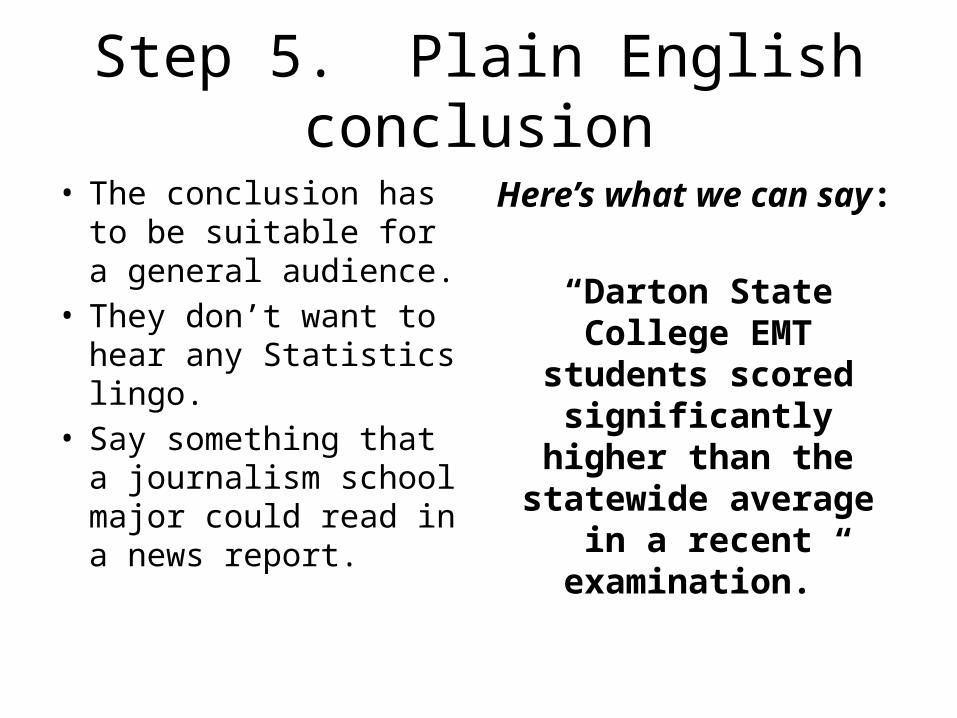
• The conclusion has to be suitable for a general audience.
• They don’t want to hear any Statistics lingo.
• Say something that a journalism school major could read in a news report.
Here’s what we can say:
“Darton State College EMT students scored
significantly higher than the statewide average in a recent examination.”
Example 3
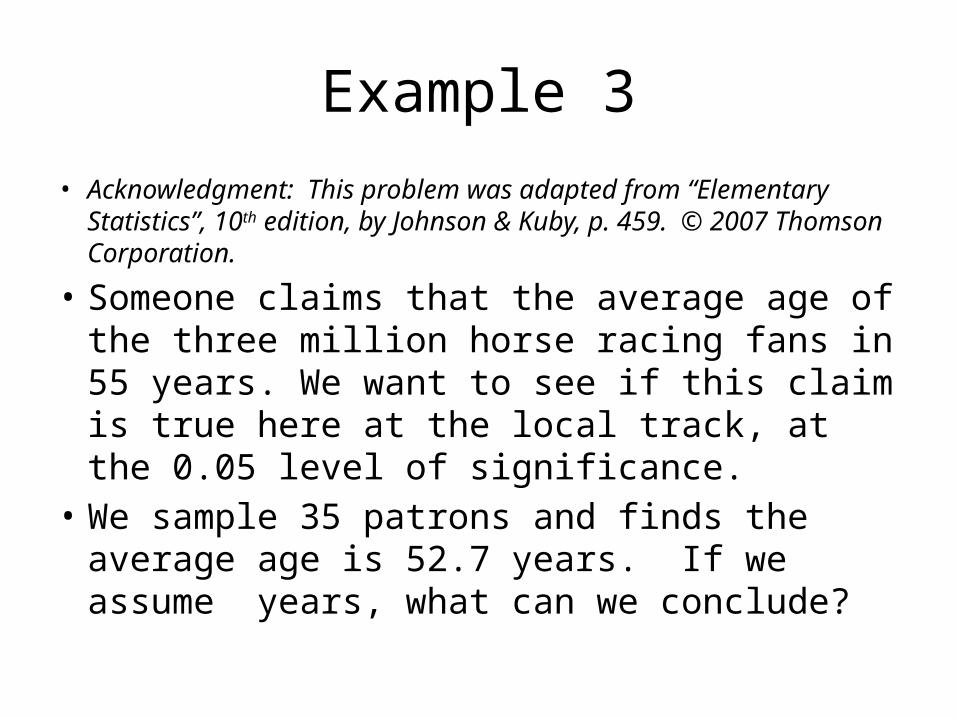
• Acknowledgment: This problem was adapted from “Elementary Statistics”, 10th edition, by Johnson & Kuby, p. 459. © 2007 Thomson Corporation.
• Someone claims that the average age of the three million horse racing fans in 55 years. We want to see if this claim is true here at the local track, at the 0.05 level of significance.
• We sample 35 patrons and finds the average age is 52.7 years. If we assume years, what can we conclude?

Example 3 initial direction
• We will use the Standard Normal Distribution and the z values to do this test.
• Justification for that:– We know the population’s standard deviation– And we have a “large” sample size: .– If we had a “small” sample size, this method
would also require that we know the rivet strength population is normally distributed.

Step 1. State the hypotheses
• The null hypothesis says that the mean age is 55 years old:
• The alternative hypothesis is a claim that the mean age is not 55 years old, it’s different:
Step 2. Determine the Critical Value
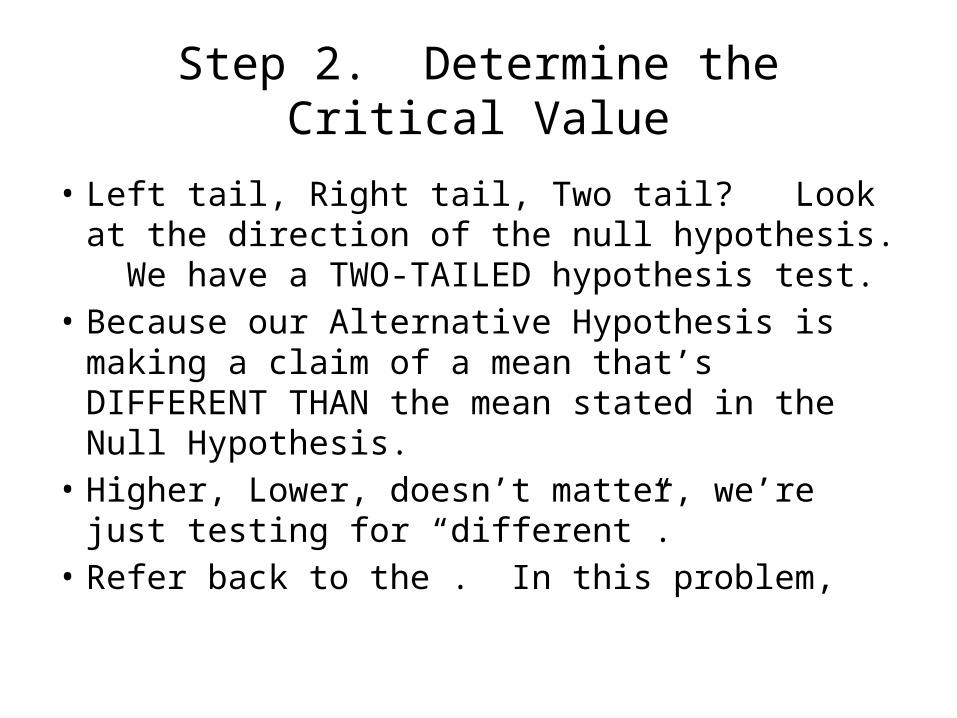
• Left tail, Right tail, Two tail? Look at the direction of the null hypothesis. We have a TWO-TAILED hypothesis test.
• Because our Alternative Hypothesis is making a claim of a mean that’s DIFFERENT THAN the mean stated in the Null Hypothesis.
• Higher, Lower, doesn’t matter, we’re just testing for “different”.
• Refer back to the . In this problem,
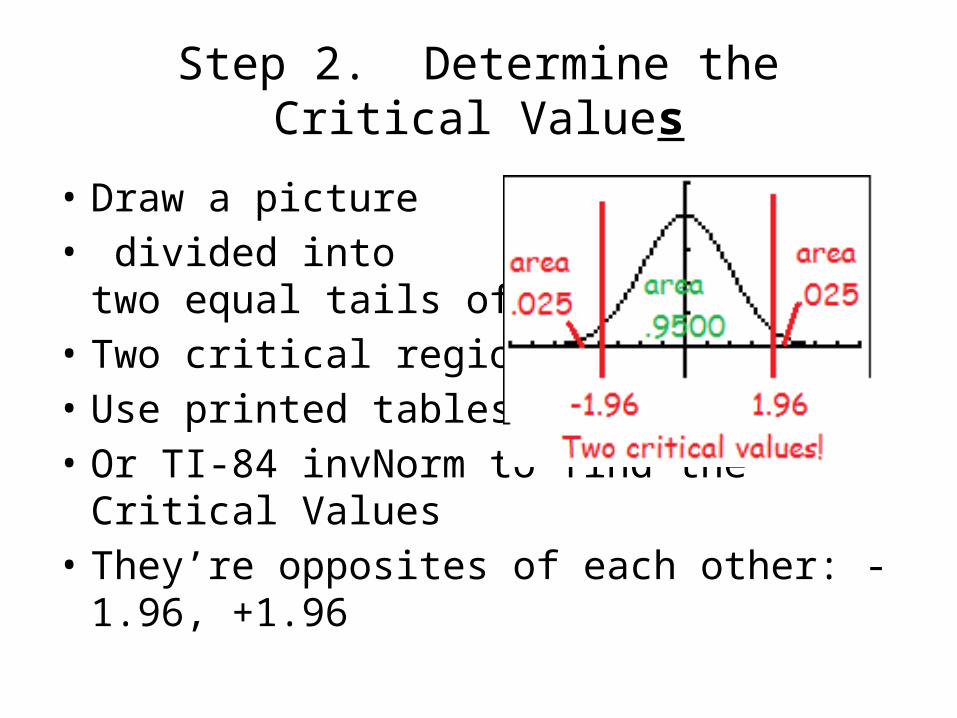
Step 2. Determine the Critical Values
• Draw a picture • divided into
two equal tails of .• Two critical regions.• Use printed tables• Or TI-84 invNorm to find the Critical Values• They’re opposites of each other: -1.96, +1.96
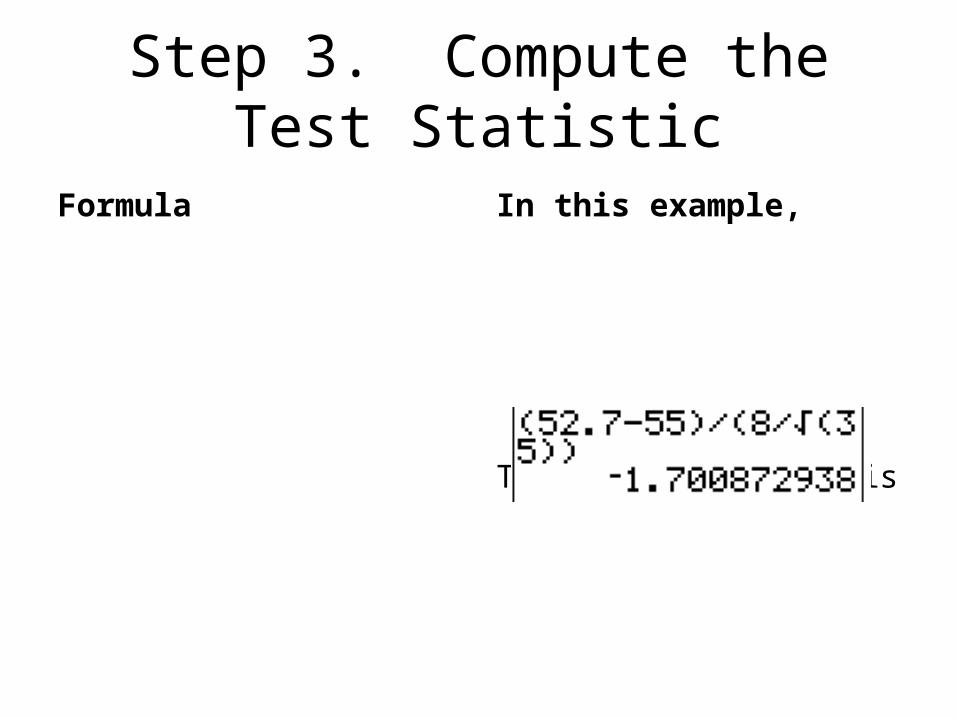
Step 3. Compute the Test Statistic
Formula In this example,
The Test Statistic is
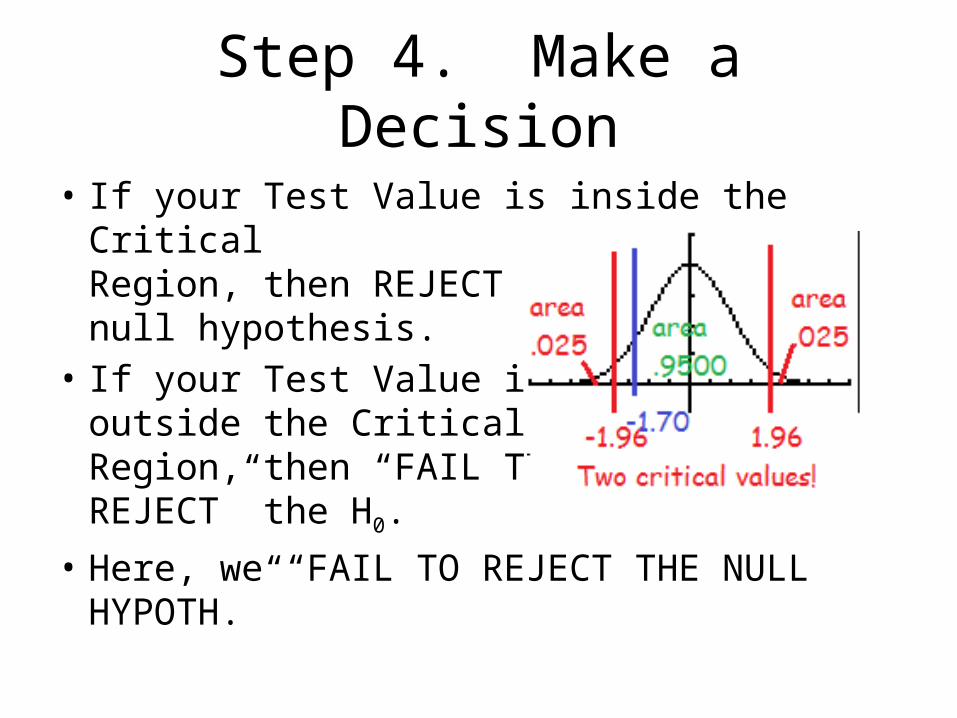
Step 4. Make a Decision
• If your Test Value is inside the CriticalRegion, then REJECT the null hypothesis.
• If your Test Value is outside the CriticalRegion, then “FAIL TO REJECT” the H0.
• Here, we “FAIL TO REJECT THE NULL HYPOTH.”

Remarks about our decision
• The racing fans at our track were certainly younger than the supposed average age of 55.
• But it wasn’t strong enough evidence.• So we let the null hypothesis stand.• We did NOT “prove” the null hypothesis.• We merely collected evidence that mildly
disagreed with the null hypothesis.
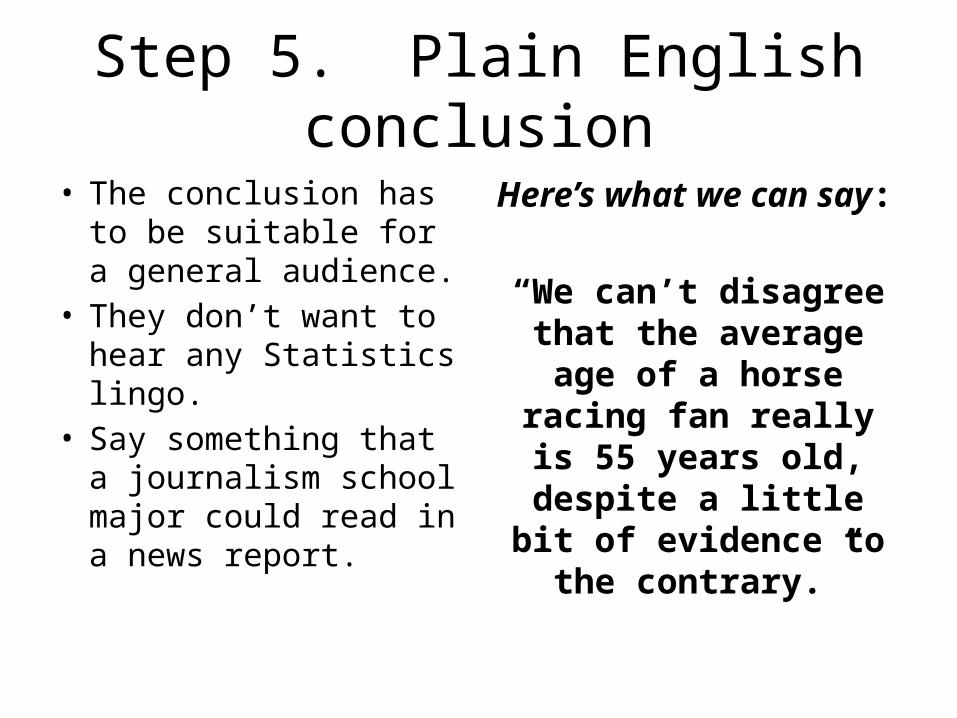
Step 5. Plain English conclusion
• The conclusion has to be suitable for a general audience.
• They don’t want to hear any Statistics lingo.
• Say something that a journalism school major could read in a news report.
Here’s what we can say:
“We can’t disagree that the average age of a
horse racing fan really is 55 years old, despite a little bit of evidence to
the contrary.”