Embed Size (px)
Citation preview

I
'>'
SMITHSONIAN MISCELLANEOUS COLLECTIONSVOLUME 99, NUMBER 6
THE TIME COURSE OF PHOTOSYNTHESIS
AND FLUORESCENCE OBSERVED
SIMULTANEOUSLY
BY
E. D. McALISTER
AND
JACK MYERS
Division of Radiation and OrganismsSmithsonian Institution
(PUBLICATION 3591)
CITY OF WASHINGTON
PUBLISHED BY THE SMITHSONIAN INSTITUTION
AUGUST 28, 1940
·V·S•D.haw'alIOWUlIVa:
slmd:)?~O\llm\l~Q~Oif?9~
THE TIME COURSE OF PHOTOSYNTHESISAND FLUORESCENCE OBSERVED
SIMULTANEOUSLY
By E. D. McALISTER AND JACK MYERS 1
Division of Radiation and Organisms, Smithsonian Institution
The bulk of our knowledge of chlorophyll photosynthesis has comefrom observations on carbon dioxide assimilation and oxygen production during the process in a living plant. Recently, fluorescencestudies have also contributed to the development of theories for the
kinetics of photosynthesis (d. Franck and Herzfeld, 1937, Kautskyand Hormuth, 1937, Ornstein et a1., 1938). Unfortunately, there islittle agreement between the experimental data of these variousgroups of workers, which have been obtained under different conditions and on various plant materials. Their contributions havebeen of great value in suggesting that changes in intensity offluorescence are related to changes in the rate of photosynthesisduring the induction period, and consequently that there must be arelationship between the two phenomena: However, the lack ofother than inferential information on the exact state of photosynthesiscorresponding to a particular state of fluorescence leaves the relationship on insecure ground. These workers have not been unaware ofthis but have lacked facilities for following changes in carbon dioxideassimilation or oxygen production with a rapidity at all comparableto that of their fluorescence observations.
1 National Research Fellow.
2 The concept of a relationship between intensity of fluorescence and rate ofphotosynthesis does not require that fluorescence enter into the process ofphotosynthesis in any way. The chlorophyll in the plant, after absorbingradiation, can dispose of this energy in various ways. It is either used inphotosynthesis or some other photochemical process, is lost as heat, or isemitted. as fluorescence radiation of longer wave length (red). The distributionof energy among these three outlets must change during the induction period,as shown by all the fluorescence and photosynthesis induction curves reportedin the literature. In other words, it is believed possible that changes influorescence can tell us something about the photochemical processes; but it isnot held that fluorescence enters in any way into the process of photosynthesis.The amount of energy appearing as fluorescence is very small compared tothat used in photosynthesis. According to the measurements of Vermeulen et aL(1937), only 0.1 to 0.2 percent of the energy absorbed by Chlorella is re-emittedas fluorescence.
SMITHSONIAN MISCELLANEOUS COLLECTIONS, VOL. 99, No.6
2 SMITHSONIAN MISCELLANEOUS COLLECTIONS VOL. 99
The rapid spectrographic method of carbon dioxide measurementdeveloped in this laboratory fulfills this need. It is the purpose ofthis preliminary report to present simultaneous records of inductionin fluorescence and photosynthesis obtained on two different types 0fplants and over a wide range of experimental conditions. To thewriters' knowledge this is the first time that these two phenomenahave been observed simultaneously during the induction period. Suchan attack gives promise of clarifying the interpretation of bothphenomena. As will be seen below, it has been possible to distinguishtwo different processes involved in the induction period. In one ofthese intensity of fluorescence and rate of carbon dioxide uptake arerelated inversely; in the other a direct relationship exists.
The only observations on fluorescence and photosynthesis duringthe steady state appearing in the literature are those of Wassink et al.(1938, 1939), using Chlorella. The present work also includesfurther measurements during the steady state in wheat.
The authors take pleasure in acknowledging their indebtedness toDr. C. G. Abbot and to Dr. E. S. Johnston for their interest in, andsupport of, this work.
EXPERIMENTAL PROCEDURE
Two types of plant material have been used. Wheat (variety,Marquis) 3 was grown for 4 to 8 days on cloth netting over runningtap water and with 300 to 400 foot-candle illumination from an unfiltered tungsten lamp. Measurements were made on eight or nineyoung plants in a cylindrical, water-jacketed chamber of about 100 cc.volume similar to that previously described by McAlister (1937).
Chlorella pyrenoidosa 4 was grown in 250-cc. Erlenmeyers held in amechanical shaker in a water bath thermo stated at 230 c., and witheither air or air containing 4 percent carbon dioxide bubbled through.Light intensity of 300 to 400 foot-candles was provided by a tungstenlamp placed beneath the glass bottom of the bath and filtered through2 cm. of water. This intensity corresponds to about 3 X 10⁴ ergs!cm.2!sec. of visible radiation. Knop's nutrient solution was usedwith the addition of 0.1 cc. per liter of "solution A" of Hoaglandand Arnon (1938), as recommended by Emerson and Lewis (1939).The addition of the microelements of "solution A" (boron,
• Seed kindly supplied by H. H. McKinney, of the U. S. Department ofAgriculture.
• From a culture originally obtained through the courtesy of Dr. RobertEmerson.
No.6 PHOTOSYNTHESIS-McALISTER AND MYERS 3
t:
manganese, zinc, copper, molybdenum) gave a noticeably more rapidgrowth than occurred in their absence. Cultures containing about0.3 cc. of cells per 100 cc. were harvested by centrifuging, and thecells resuspended in fresh nutrient of the same composition for theexperimental work. Forty cc. of an algal suspension containing 0.2to 0-4 cc. of packed cells was placed in a glass chamber measuring0.6 X 10 X 20 cm. This density of cells absorbed about 50 percent ofthe incident beam. An air stream of up to 50 cc.jsec. was forcedthrough the suspension, entering at the bottom through fine holes ina glass tube. This arrangement broke up the air stream into finebubbles, providing a maximum area of contact between liquid andgas. Constant temperature of 240 C. was maintained by immersionin a small water bath.
Instead of the closed system and recirculation method previouslyused (McAlister, 1937, 1939), a constant flow of gas was passedthrough the plant chambers without recirculation. A spectrographicanalysis of the effluent gas from the plant chamber then gives a directmeasure of the rate of carbon dioxide uptake or production by theplants. The constant-flow method has an additional advantage in thatthe plants are kept under a constant environment. Before reachingthe plant chamber the gas flow was divided into two portions, "A"and "B." Part "A" continued into the plant chamber at a constantrate of flow of up to 100 cc./sec. as measured by a Venturi gauge.By means of a two-way stopcock part "B" could be either discardedor passed into the optical absorption cell of the spectrograph, asdesired. By means of another stopcock the effluent gas from theplant chamber could be either passed into the absorption cell ordiscarded. This arrangement permitted an easy comparison of theeffluent and influent air of the plant chamber. A water-cooled condenser, through which the air passed before entering the absorptioncell, removed enough water vapor from the air to prevent condensation on the windows of the cell. Condensation on the optical partsof this cell was further avoided by maintaining it 30 or 40 C. abovethe temperature of the air stream.
The spectrographic apparatus previously used has been modifiedin several respects in order to adapt it to the present work. Theo.ptical path of the absorption cell has been shortened to about 20 cm.to permit analysis of higher concentrations of carbon dioxide. Itsvolume is about 70 cc. Because of the small changes in carbon dioxideto be measured, it has been necessary to amplify the indications ofthe galvanometer used for reading the thermocouple current. Awell-defined and uniformly intense rectangle of light is reflected by

fl
~~l
4 SMITHSONIAN MISCELLANEOUS COLLECTIONS VOL. 99
;.?;
~~~i~~tl"J
~
~
I~
the mirror of the primary galvanometer so that it moves acrossan opaque straight-edge partly covering a Weston photronic cell.Current from the photronic cell actuates a secondary galvanometer.The amplification thus obtained can be varied from I to 500 timesby changing the intensity of the rectangle of light falling on thephotocell. An amplification of 50 X was usually sufficient. Theamplification factor was measured and found to be constant wellwithin the other experimental errors involved, particularly thatinvolved in the zero drift.
Continuous recording has been substituted for the alternate 30second readings previously taken. A light spot from the secondarygalvanometer makes a continuous record on a sheet of photographicpaper held on a drum which is rotated at constant speed by a synchronous motor. This procedure does not permit alternate "zero"readings to be taken and hence makes it impossible to eliminate theslow "zero drifts" which are apparent on many of our records.
Illumination was provided by two I,ooo-watt projection bulbs. Auniformly intense spot of light was focused on the plant chamberwith spherical reflectors (I 5-inch diameter, 9-inch focal length).This light was filtered through 13 cm. of water and 6 cm. of asolution of copper nitrate of such concentration that the plantsreceived no light of wave length longer than 6400 A. Incident intensities were varied by use of a series of screens and were measuredby means of a vacuum thermocouple and microammeter. No voltageregulator was available; the variation in incident intensity caused byfluctuations in line voltage never exceeded 5 percent during theshort periods of illumination used. The "high intensity" commonlyused was about 60x 104 ergs/cm.'/sec. "Low intensity" was a fifthof this unless stated otherwise.
Fluorescence intensity was measured by a circular, barrier-typephotocell ("E1ectrocell") of 44 mm. effective diameter connected toa Moll galvanometer of I.2-second period.' The photocell disk wascovered by two filters, a Corning H. R. red (3.6 mm.) and a b1uepurple Corex A (4.2 mm.). These filters allowed only light ofwave length longer than 6500 A to reach the photocell. The red filteritself was found to fluoresce strongly when illuminated. This featurewas reduced to an unobjectionable minimum by placing the purplefilter in front of the red so as to absorb most of the radiation causingthe fluorescence.
In studies on wheat the photocell was placed at one side of theplant chamber facing the plants and just out of the incident beam;
No.6 PHOTOSYNTHESIS-McALISTER AND MYERS 5
;;:
in the Chlorella experiments it was placed immediately behind therectangular chamber.
With the photocell placed so that it received directly the full intensity of the light incident on the plants, the galvanometer deflectionwas less than 2 percent of that produced by the steady-statefluorescence of plant material. This galvanometer also records onthe same photographic paper on the rotating drum. Perfect timealignment of the "fluorescence" and "carbon dioxide" galvanometerindications is provided by a narrow slit parallel to the axis of thedrum, through which both spots must pass.
RESULTS
A number of induction curves, selected from the several hundredwhich have been obtained, are presented on the following pages. Thecurves have been so selected as to include representative data illustratil~g the induction behavior under a wide range of experimental conditions. Figures I to I I are photographic reproductions of theoriginal galvanometer tracings. In each pair the upper curve is therecording of the fluorescence intensity; the lower, the recording ofthe rate of carbon dioxide uptake. In some cases the tracings havebeen darkened -with India ink to insure their reproduction. Smallhorizontal arrows have frequently been added to mark the firstappearance of the fluorescence tracing on the original record.
The procedure used in obtaining these induction curves was asfollows: The recording drum was started about a minute beforethe beginning of illumination and continued for a minute or so afterthe plant was darkened. The period of illumination was usually 4minutes. Vertical lines have been drawn on the records to indicatethe times of transition from dark to light and from light to dark.Dotted lines have been added to show the probable course of the"dark" reading (respiration rate and "zero" of fluorescence), interpolated through the light period. One-minute intervals are indicatedby vertical dashes above the fluorescence zero line.
In a number of cases, and particularly with suspensions of algae,it has been desirable to observe the time over which an instantaneous
plant response is spread by our instruments. This has been accomplished by entirely stopping the gas flow for a short time (ISseconds) during a dark period, allowing the respired carbon dioxideto accumulate. The resumption of gas flow washes the accumulatedcarbon dioxide through the system and produces a wedge-shaped dipin the carbon dioxide curve (see curves 2, 5, and 8 of fig. 8). The

6 SMITHSONIAN MISCELLANEOUS COLLECTIONS VOL. 99
width of this wedge approximates the time response of the instruments to an instantaneous change in rate of the same magnitude.For wheat at a flow rate of IOOcc.jsec. this time is about 6 seconds,and for Chlorella at 50 cc.jsec. it is IS seconds. The proportionatelylonger time in the algal suspension is apparently due to the liquid-gasdiffusion lag. Thus in the recording of the rate of carbon dioxideuptake there appears both a "smearing out" of the plant response(as discussed above) and a lateral shift due to the time of transitof gas from the plant chamber to the absorption ceIl. The lag influorescence recording is merely the I,2-second period of thegalvanometer.
In order to obtain a comparison of respiration and photosynthesis,the influent gas stream has been occasionally by-passed directly intothe absorption cell, usually for 30- or 45-second periods (as describedabove, p. 3). This is seen in the curves as a short horizontalshelf which gives a somewhat discontinuous appearance to the curvesbut establishes the level of respiration.
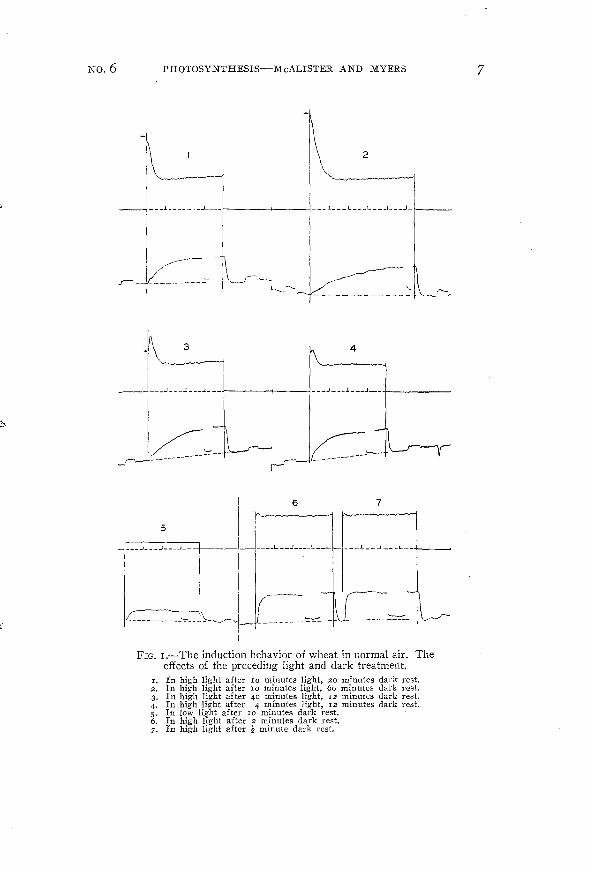
Figure I illustrates the behavior of wheat in normal air. At highintensities (40 to 60x I04 ergsjcm:jsec.) and after a long darkrest the fluorescence intensity rises rapidly to a maximum and thenfalls off more slowly toward a final steady value. During this timethe rate of carbon dioxide uptake has risen to a steady value. Comparison of curves I and 2 indicates that both photosynthesis andfluorescence are influenced. by the length of the preceding darkrests. Furthermore, when the dark rest is not sufficiently long, thepreceding light treatment is also of importance, as shown by curves3 and 4· Under low light (4 to IOX I04 ergsjcm:jsec.) (curve 5)or short dark rests (curves 6 and 7) both photosynthesis andfluorescence approach a rectilinear course in their attainment ofthe final steady state.
Figure 2 demonstrateg the effects of low oxygen and low carbondioxide pressures. Behavior of wheat in "tank" nitrogen 5 is shown incurve I, The fluorescence curve has the same general features as thefluorescence curve in air, except that the maximum is reached moreslowly and the decay is more gradual. The rate of respiration in tanknitrogen is about one-half that in air (see curves I and 2 of figures
5 A good grade of "water-pumped" compressed nitrogen. While no oxygenanalyses on this are available, it is reasonably certain that the oxygen contentwas less than ! percent. Complete removal of oxygen was impossible at thehigh rate of flow used. This is referred to throughout the paper as tanknitrogen, low oxygen, or ! percent oxygen.
No.6 PHOTOSYNTHESIS-McALISTER AND MYERS 7
2-L-L" _ _ _ .1 .1_ .. _J _ ___ ~ L L I ~_
r-rc=-~-+ \---/- --...~ "- "-,
3
.~
4
___ J J J __ ___ J .1 .1 _
Lr--y-~-
~----~--------1
6 7
5
J ..J ...•. L __ J L _ ___ J.. __ ..J L I
~--- ---- -- ....• - ----- '-------------------
FIG. I.-The induction behavior of wheat in normal air. Theeffects of the preceding light and dark treatment.
r. In high light after 10 minutes light, 20 minutes dark rest.2. In high light after IO minutes light, 60 minutes dark rest.3. In high light after 40 minutes light, 12 minutes dark rest.4. In high light after 4 minutes light, 12 minutes dark rest.5. In low light after 10 minutes dark rest.6. In high light after 2 minutes dark rest.7. In high light after ~. minute dark rest.

8 SMITHSONIAN MISCELLANEOUS COLLECTIONS VOL. 99
I , 2i~-----
I
I :
~1 J -1 L -- !--~-~ L __ L I _
I I
-~Jc=J~",~~
-V~~- r'~~"-I ----j -I~u_LuL ' I '
i __ ~u __ I'I I~_u.l I L __ ~i
i
I
~
-~-=-~ -5
-----------~-~--~
6
-CJ,~t..L.L'.L.'_~ .. ,J
~-=--~~=~-FIG. 2.-The induction behavior of wheat in low oxygen pressure.
The effects of varying carbon dioxide concentrations. All curvestaken in high light, after IO minutes in high light and normal air,IO minutes dark rest with specified carbon dioxide concentration incommercial nitrogen.
1. 0.006 percent carbon dioxide in nitrogen.2. In normal air.3. 0.004 percent carbon dioxide in nitrogen.4. 0.0015 percent carbon dioxide in nitrogen.5. 0.0006 percent carbon dioxide in nitrogen.6. Zero carbon dioxide in nitrogen.

No.6 PHOTOSYNTHESIS-McALISTER AND MYERS 9
3 or 6). The apparently higher respiration rate in the nitrogen thanin air (curve 2) is due to the increased sensitivity of our instrumentsat the lower carbon dioxide concentration of the tank nitrogen (about0.006 percent). In examination of all the curves it must be remembered that the sensitivity of the spectrographic method is higherat lower concentrations of carbon dioxide. If the carbon dioxideconcentration is still further reduced by shunting a measured portionof the gas through soda-lime, the series of curves 3, 4, 5, and 6 isobtained for different carbon dioxide levels. It is apparent that carbondioxide has a (direct or indirect) quenching effect on the fluorescence.The "dark pick-up" exhibited by these and other curves for lowcarbon dioxide concentrations will be discussed below.
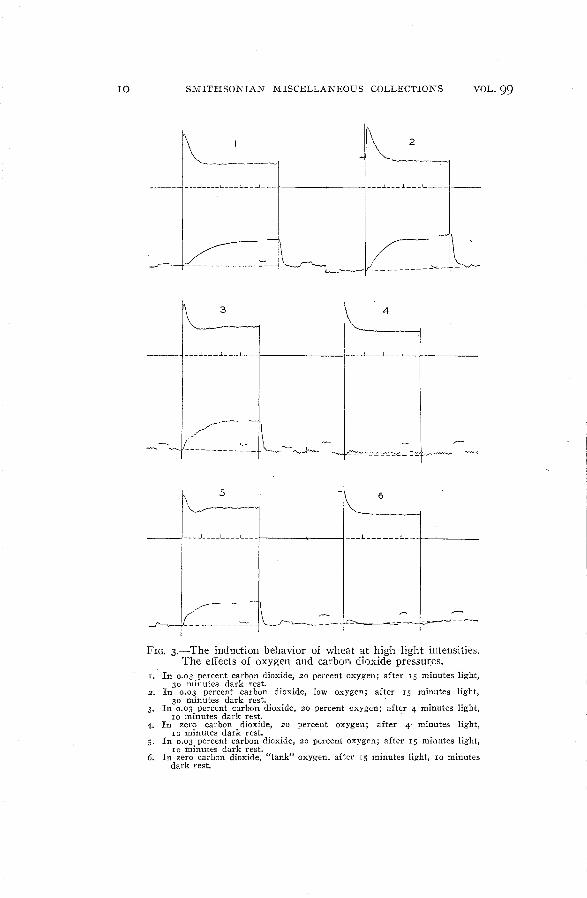
The effect of decreased oxygen pressure is seen in comparingcurves I and 2 of figure 3. In 20 percent oxygen the induction incarbon dioxide uptake is longer, although the fall in fluorescence ismuch more rapid than in low oxygen. In normal air, apparently owing to changes within the plant (curves 3 and 5), the fluorescencedecay is even more rapid and actually produces a minimum in thefluorescence curve. \Vhen all carbon dioxide is removed from airor from tank oxygen, curves such as 4 and 6 are obtained. The rateof carbon dioxide production is at first decreased but later buildsup again to approximately the rate of dark respiration. In no caseis there a fluorescence minimum in the absence of carbon dioxide.
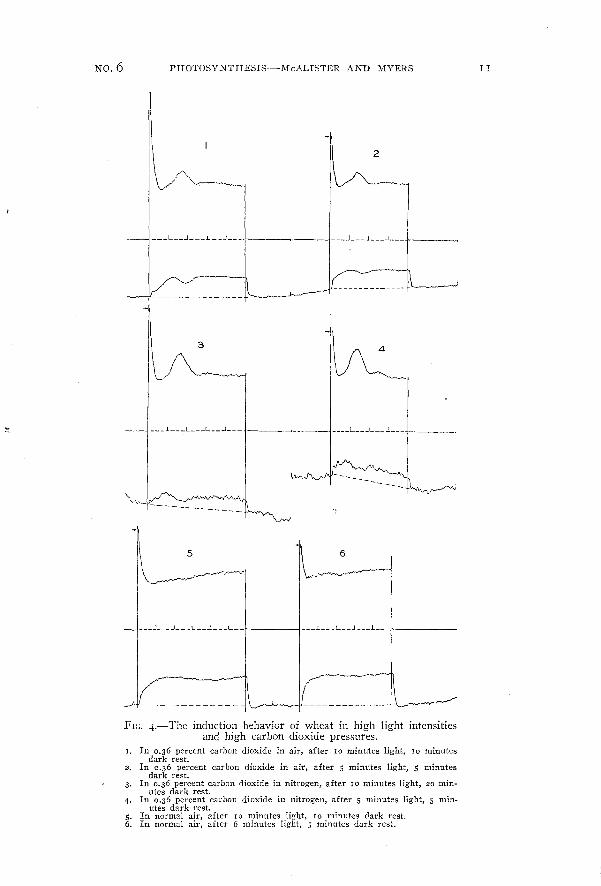
Figure 4 shows the peculiar effects of high carbon dioxide on theinduction in fluorescence and carbon dioxide uptake in wheat. Asseen in curves I and 2 the fluorescence falls rapidly to a minimum,followed by a rise to a second maximum and then a decrease to thelevel of the steady value. Simultaneously the rate of carbon dioxideuptake goes through a series of convolutions which seein to becorrelated with the fluorescence changes. This behavior occurs alsounder low oxygen pressures as shown by curves 3 and 4. The carbondioxide records here are very irregular, owing to incomplete premixing of the carbon dioxide added to the tank nitrogen.
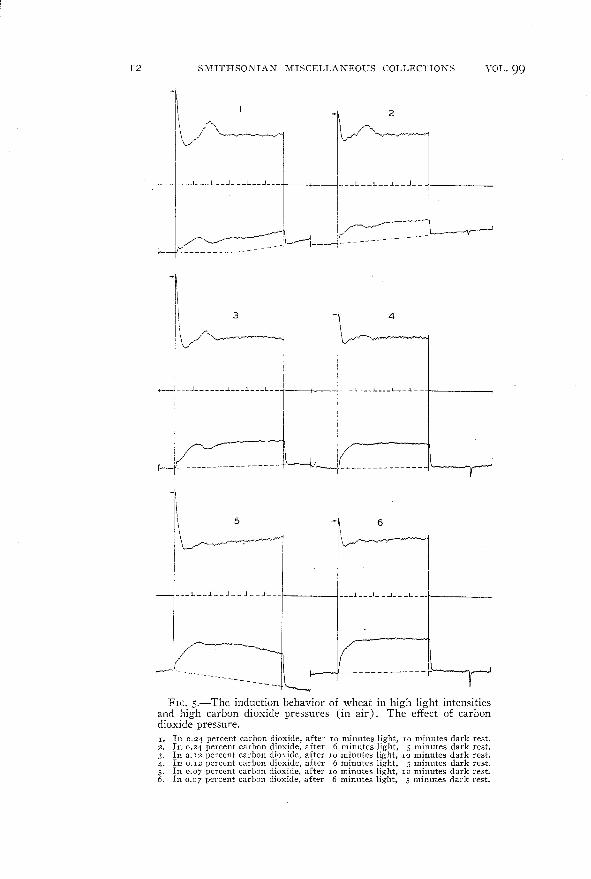
The curves of figure 5 and curves 5 and 6 of figure 4 show thetransition in behavior from air to higher carbon dioxide concentrations.
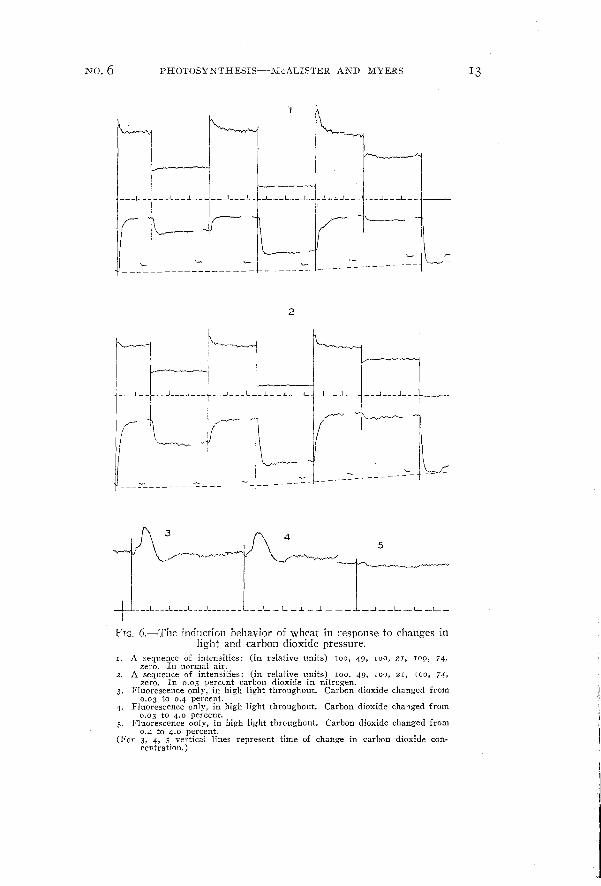
Figure 6 illustrates the induction behavior accompanying changesin light intensity or in carbon dioxide concentration. A sequence oflight intensities (without intervening dark periods) is shown in curveI for 0.03 percent carbon dioxide in air, and in curve 2 for 0.03percent carbon dioxide in nitrogen. The induction effects seem to besomewhat more pronounced in air than under low oxygen pressure.
10 SMITHSONIAN MISCELLANEOUS COLLECTIONS VOL. 99
t=~-~I -~~~~J-
m~L~~c~L3
.I---~___ ..l L
~-1~~,. 5
~.
____ 1 1 L _
----"---
4
___ .J l L _
- - ~--:...:.:..:.::..-~::..~.:::.::. - :.:;::.
6
___ L I L_
~~=- ---~-
FIG. 3.-The induction behavior of wheat at high light intensities.The effects of oxygen and carbon dioxide pressures.
T. In 0.03 percent carbqn dioxide, 20 percent oxygen; after IS minutes light,30 minutes dark rest.
2. In 0.03 percent carbon dioxide, low oxygen; after IS minutes light,30 minutes dark rest.
3. In 0.03 percent carhon dioxide, 20 percent oxygen; after 4 minutes light,10 minutes dark rest.
1-. In zero carbon dioxide, 20 percent oxygen; after 4" minutes light,10 minutes dark rest.
5. In 0.03 percent carbon dioxide, 20 percent oxygen; after 15 minutes light,10 minutes dark rest.
6. In zero carbon dioxide, "tank" oxygen, after IS minutes light, 10 minutesdark rest.
No.6 PHOTOSYNTHESIS-McALISTER AND MYERS
2
II
~
"-
'-'\,.',,,,)
/"""'~
- "'--------
___ L L __L , -'
3
~-
___ 1 L L __-' ~- ~ _
___ J j -l -'
----L---L-_J. l_·__ ----,
5
~~"""""-,/"""._""_-,,,,,r/"'''''''''-'l''
___ J J L __ ..l L
I~N-r--,,~~'
L L__J L
_'''"t'----- _ ~
FIG. 4.-The induction behavior of wheat in high light intensitiesand high carbon dioxide pressures.
I. In 0.36 percent carbon dioxide in air, after 10 minutes light, 10 minutesdark rest.
2. In 0.36 percent carbon dioxide in air, after 5 minutes light, 5 minutesdark rest.
3. In 0.36 percent carbon dioxide in nitrogen, after 10 minutes light, 20 min·utes dark rest.
4. In 0.36 percent carbon dioxide in nitrogen, after 5 minutes light, 5 min~utes dark rest.
5. In normal air, after 10 minutes light, 10 minutes dark rest.6. In normal air, after 6 minutes light, 5 minutes dark rest.
12 SMITHSONIAN MISCELLANEOUS COLLECTIONS
-L r I -l/~~v:-,~~I •. -\_-V'-"~-'~1
I r-1 .J. __ L-1 L __J I---L--L_-___L __L_L __ I
I i~ _~-fdU
-~
1\ 3 -l 4
II 'I' I
iV'-------/"~--1 I ~~r--..~r_r~~I I,
i k_LLcoucucui 1-'-'-'-'I
'--1----------------
VOL. 99
-!n
!I
i\
I~-~.-~~-~-~i .i
--j '__o __ , __ , __ , _
i( 1\-----1--- ..
-~I.1 '- __ L __ L _
FIG. s.-The induction behavior of wheat in high light intensitiesand high carbon dioxide pressures (in air). The effect of carbondioxide pressure.I. In 0.24 percent carhon dioxide, after 10 minutes light, 10 minutes dark rest.2. In 0.24 percent carbon dioxide, after 6 minutes light, 5 minutes dark rest.3. In 0.12 percent carbon dioxide, after 10 minutes light, 10 minutes dark rest.4. In 0.12 percent carbon dioxide, after 6 minutes light, 5 minutes dark rest.5. In 0.07 percent carbon dioxide, after 10 minutes light, 10 minutes dark rest.6. In 0.07 percent carbon dioxide, after 6 minutes light, 5 minutes dark rest.
NO.6 PHOTOSYNTHESIS-McALISTER AND MYERS
"~'"
___ !__ ..J L __ .1__ ...J 1-__ L _L_f L f __ I_.L _.:...-1 l. __ J L __
I3
y----
3
2
~~ ,i.~~ I~'~! I l~
~ i
-r---I--_J-n ~__--'_- _L~ u. -__
!(~L··! [
...;.) :i !
I .
~. ~ I! ~ :_ ~---~-~--------~~------I-- -----
t 5.-..- .....'...••••.•.~/~.-"'..,""'" -~r'·,·••.,--.rv,,-..-,/
-- .~.-.,-.•-,../'''''~----'''
__L_L L__L '__ L _" _0 __ LLn L_L_
FIG. 6.- The induction behavior of wheat in response to changes inlight and carbon dioxide pressure.
1. A sequence of intensities: (in relative units) 100, 49, 100, 21, 109, 74,zero. In normal air.
2. A sequence of intensities: (in relative units) 100, 49, 100, 21, 100, 74,zero. In 0.03 percent carbon dioxide in nitrogen.
3. Fluorescence only, in high light throughout. Carbon dioxide changed from0.03 to 0.4 percent.
4. Fluorescence only. in high light throughout. Carbon dioxide changed from0.03 to 4.0 percent.
5. Fluorescence only, in high light throughout. Carbon dioxide changed from0.4 to 4.0 percent.
(For 3, 4, 5 vertical lines represent time of change in carbon dioxide concentration.)

14 SMITHSONIAN MISCELLANEOUS COLLECTIONS VOL. 99
Curves 3, 4, and 5 show the course of intensity of fluorescence following sudden changes in carbon dioxide concentration.
Unfortunately, bur apparatus does not permit us to follow changesin the rate of carbon dioxide uptake accompanying such changes incarbon dioxide pressure, or to measure the final rate of photosynthesisin 4 percent carbon dioxide. However, we have been able to establishfrom steady-state measurements that at the high light intensity used(about 60 X 104 ergsjcm:/sec.) this wheat was under a carbon dioxidelimitation at 0.03 percent carbon dioxide and not far from a lightlimitation at 0.4 percent carbon dioxide. The increase in the steadyrate of photosynthesis from 0.03 to 004 percent carbon dioxide isabout threefold; in comparison the change from 004 to 4 percent musthave been small. It is highly probable here that the "burst" offluorescence is associated with an increase in rate of photosynthesis.It is to be noted that the reverse case (not illustrated) of changingfrom 004 to 0.03 percent, and from 4 to 0.03 percent gave rise tochanges in fluorescence so small as to be negligible compared to thoseof curves 3 and 4 of figure 6.
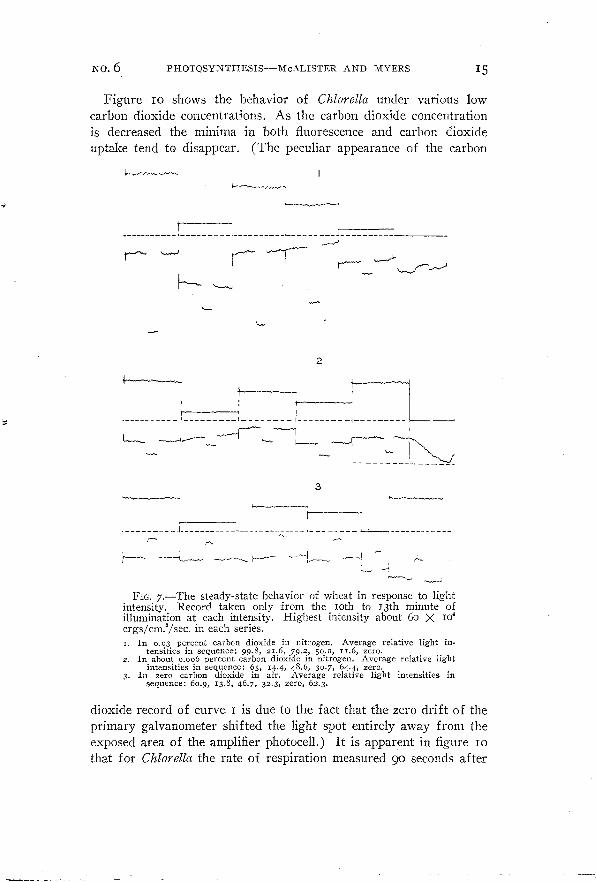
A number of experiments have been made on the steady-statebehavior of photosynthesis and fluorescence in wheat. The techniqueused is illustrated in figure 7. The plants were exposed to a givenlight intensity for 10 minutes. The recording drum was then startedand a record taken for the succeeding 3-minute period. A readingon the influent air was made during each interval. This procedurewas repeated for each light intensity studied. Thermocouple readingsof the incident light intensity were taken every IS seconds duringthe recording in order to average out the effects of varying linevoltage.
The induction behavior of Chlorella is illustrated in figures 8, 9,and 10. The behavior of cells cultured in 4 percent carbon dioxideresembles that of wheat, as shown by curves I and 2 of figure 8.
Cells grown in air behave very differently. As shown in curves 3 to8, the rate of carbon dioxide uptake follows a course similar to that
found by Aufdemgarten (I939a) for Stichococcus. In comparisonto the final value the early fluorescence maximum is not nearly as
high as in wheat and is followed by a rapid decline to a pronouncedminimum. A correlation between the minima in fluorescence in
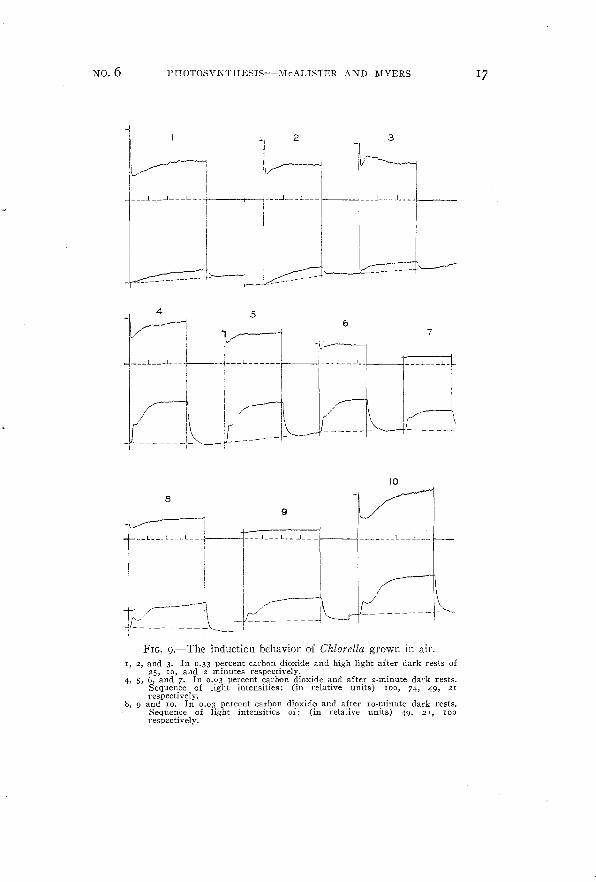
tensity and in rate of carbon dioxide uptake is evident from thesecurves. A similar course is followed at higher carbon dioxide concentrations, as shown in curves I, 2, and 3 of figure 9. The effect oflight intensity is demonstrated in curves 4 to 10 of figure 9.
No.6 PHOTOSYNTHESIS-McALISTER AND MYERS IS
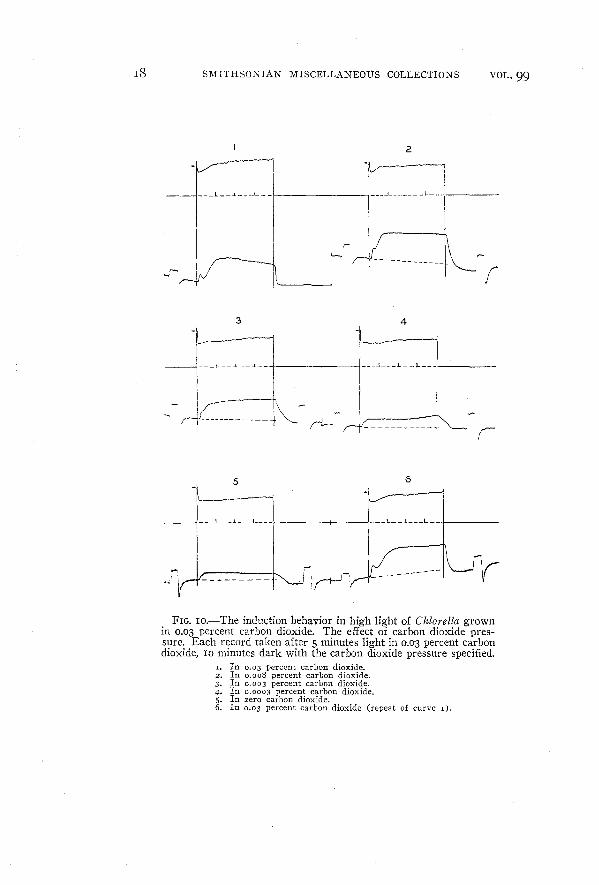
Figure IO shows the behavior of Chlarella under various lowcarbon dioxide concentrations. As the carbon dioxide concentrationis decreased the minima in both fluorescence and carbon dioxide
uptake tend to disappear. (The peculiar appearance of the carbon
~'"...•....?,rr'''''~~ _
i--..-· .....,_.,.-..v---.""'"
.. . . .__ - - - - 1- _
r-'"'""""-"
I---I~I
"'---'
'-
---'
i"""~
2
~~~
t~-~ ; _~I_~
=~-=:~==r=~~-=~~~3
t
. .I.- u . u_u_. . ~- _".
r---- -----j.~~ ~ r------
.~.----
~..jI~
~~ ...,
~..........,
FIG. 7.-The steady-state behavior of wheat in response to lightintensity. Record taken only from the lOth to I3th minute ofillumination at each intensity. Highest intensity about 60 X ro4ergs/cm."/sec. in each series.1. In 0.03 percent carbon dioxide in nitrogen. Average relative light in
tensities in sequence: 99.8, 21.6, 79.2, 50.0, I r.6, zero.2. In about 0.006 percent carbon dioxide in nitrogen. Average relative light
intensities in sequence: 65, 14.4, 48.6, 30.7, 64.4, zero.3. In zero carbon dioxide in air. Average relativ.e light intensities in
sequence: 60.9, 13.8, 46.7, 32.3, zero, 62.3·
dioxide record of curve I is due to the fact that the zero drift of theprimary galvanometer shifted the light spot entirely away from theexposed area of the amplifier photocell.) It is apparent in figure IO
that for Chiorella the rate of respiration measured 90 seconds after

16 SMITHSONIAN MISCELLANEOUS COLLECTIONS VOL. 99
I
~
I -l___ L L __ J ___ L l _
-IlL 2I~
__ L__J L __ 1 _
-I 3~ /,"~ ....---,.,1\ /' !,-/ '
i I-.J L __ ...l __ ...L.
4
.-'",...,...,....---.
J 1. ,-1
5~lI
I
1\-,---------- -+-
~
!
i 6 Lli ~ - 7,~_~1 ~JU'_c
II1\
- I-T
8
.J I__
FIG. S.-The induction behavior in high light of Chlarella culturedunder two different conditions. The effect of the preceding darkrest.I and 2. ChIarella grown in 4.0 percent carbon dioxide, studied in 0.24 percent
carbon dioxide.I. after 1_0 minufes light, 20 minutes. dark rest;2. after 6 minutes light, 10 minutes dark rest.
3, 4, and 5. Chlorella grown in and studied in 0.03 percent carbon dioxide.3. after 3 minutes light, 40 minutes dark rest;4. after 4 minutes light, 10 minutes dark rest;5. after 3 minutes light, 2 minutes dark rest.
6, 7, and 8. The same suspension of Chiarella as 3, 4, and 5 (above), leftovernight in 0.33 percent carbon dioxide and low light (ro X 104ergs/cm.2jsec.). Studied in 0.03 percent carbon dioxide, high light.
6. after 30 minutes light, 60 minutes dark rest;7. after 4 minutes light, 10 minutes dark rest;8. after 3 minutes light, 3 minutes dark rest.
No.6 PHOTOSYNTHESIS-McALISTER AND MYERS 17
I~~
I
_--1 L __
3-III'
!\
I~~--~ii
I'~I .1
______ I__ hf
I
I
I i
~~
-,I
2-,I
,I . _
V __,_~
I
~d~-7
___ l L_
65
-iv--! _r I 1 L_-'--
___ L-' : ; ~L--L-~
I: !I ,
ii,
/Ii i.···, I _/ '·U' ---! ; -. -. '-J_ ,--
_I 4\V-~
'---
/0
l/~89
-~
f I.~
..- CmLL rim .---,-L -,----++- -C C--,---.
1 "~ i ~----1 I
~/ ,\ I,J .1 l~ n_If I c-jJ n ,'----11--[--~------t ~ J
FIG. g.-The induction behavior of Chiarella grown in air.I, 2, and 3. In 0.33 percent carbon dioxide and high light after dark rests of
25, 10, and 2 minutes respectively.4, 5, 6, and 7. In 0.03 percent carbon dioxide and after 2-minute dark rests.
Sequence of light intensities: (in relative units) 100, 74, 49, 21respectively.
8, 9 and 10. In 0.03 percent carbon dioxide and after Io-minute dark rests.Sequence of light intensities of: (in l-elative units) 49, 21, 100respectively.
18 SMITHSOl\IAN MISCELLANEOUS COLLECTIONS
2
~
VOL. 99
___ L__ ..J. __ ~ _
r•......
i
i \
_....J .J L _
r
_1~3-------l---L..--.l. __ ..L
1---1Jcn----+~-
5
___ L__ J.. L _
r~
4
J L __ L I
6
___ L__ J. L
r
: i....• \
r- ''''i
:~ I{FIG. 1O.-The induction behavior in high light of Chiarella grown
in 0.03 percent carbon dioxide. The effect of carbon dioxide pressure. Each record taken after 5 minutes light in 0.03 percent carbondioxide, 10 minutes dark with the carbon dioxide pressure specified.
1. In 0.03 percent carbon dioxide.2. In 0.008 percent carbon dioxide.3. In 0.003 percent carbon dioxide.4. In 0.0003 percent carbon dioxide.5. In zero carbon dioxide.6. In 0.03 percent carbon dioxide (repeat of curve I).

No.6 PHOTOSYNTHESIS-McALISTER AND MYERS 19
the period in high light is greater than the rate measured beforeIllumination-as has been previously pointed out in the literature(d. Emerson and Lewis, 1939).
In order to determine accurately the course of fluorescence intensity in the first seconds of iIIumination a few experiments havebeen made with a very fast galvanometer" Three of these are shownin figure 11. The recording drum was speeded up to give these
--"----------~I
2
----------------,3
L.W/0 see'S
1.5
Io
FIG. II.-The fluorescence behavior of wheat and Chlorella in airduring the first 10 seconds of illumination.
1. Chlorella in high light.2. Chiarella in low light.3. Wheat in high light.
records, which are reproduced nearly full size. For curve 1 thephotocell was placed immediately in back of a suspension of Chlarellailluminated with full intensity (6ox 104 ergsjcm:jsec.). Theseconditions were duplicated in curve 2 except that the light intensitywas cut in half. (The galvanometer sensitivity decreased betweenthese two records owing to a drop in the battery current actuatingthe field electromagnet, so that the curves cannot be compared
• Kipp and Zonen "torsion string" galvanometer with electromagnet, I/IOO
second period. Loaned by the Department of Terrestrial Magnetism, CarnegieInstitution of Washington, courtesy of Dr. M. A. Tuve.
~~-_c".,'ia' '-,~ "'-'-'=="=4,,;; ~~,,= 'D~-c""~"",;;,,·,&~·,,,-.~~~ -

20 SMITHSONIAN MISCELLANEOUS COLLECTIONS VOL. 99
directly as to ordinate height.) Curve 3 was obtained with a layerof attached wheat leaves, one leaf thick, placed in front of thephotocell. Further experiments along this line are now in progress.
DISCUSSION
The induction curves for carbon dioxide assimilation of Sticha
coccus bacillaris obtained by Aufdemgarten (I939a, I939b) 7 havebeen essentially duplicated by our curves for Chlarella (figs. 8, 9, IO).His observations on the effects of different nutrient media on the
initial maximum in the induction curves are being further investigatedin this laboratory. The curves for carbon dioxide assimilation bywheat are consistent with those reported in previous papers(McAlister, I937, I939). Changes in technique (constant-flowmethod, increased sensitivity, and continuous recording) have madeit possible to observe two effects not apparent before: I, a rapidini tial uptake of carbon dioxide (fig. 3, curves I and 2), and 2, asecondary depression in the rate of carbon dioxide uptake underhigh concentrations of carbon dioxide (figs. 4 and 5).
Our fluorescence curves for wheat are in almost complete agreement with those obtained by Franck and Wood (I936) on variousexcised leaves (d. fig. I, curves I and 2, etc.). Their observationof a rapid initial rise followed by a slower increase to the maximumis duplicated by our experiments using a very fast galvanometer(fig. II).
Comparison of our fluorescence curves with those of other workersis more difficult owing to the different conditions employed. Kautskyand Marx (I937) obtained for various excised leaves a smoothlyrising fluorescence curve approaching a maximum in 34 ,§econds.Their data could be fitted to a straight line by plotting the logarithmof the "fluorescence quenching" against time. In later work fromthe same laboratory Kautsky and Hormuth (I937) reportedfluorescence curves followed during the first 50 seconds of illumination. Although these show a quick rise followed by a slower decay,the magnitudes of the changes involved are much smaller than thoseobtained by Franck and Wood and by us. These differences can beaccounted for, at least in part, by the fact that Kautsky used as theexciting source ultraviolet radiation of probably rather low intensity.
7 It is interesting to note here that the minimum in photosynthesis in intermittent light of about I-minute intervals reported by McAlister (1937) for wheathas been confirmed by Aufdemgarten (I939a) for both H ormidiltm andStichococclts.

No.6 PHOTOSYNTHESIS-McALISTER AND MYERS 21
In our studies over a wide range of intensities it is apparent thatat low light the proportionate changes in fluorescence intensity aresmall.
The fluorescence curves obtained by Wassink and Katz (1939) forChlorella vulgaris are also not directly comparable with ours becauseof the very low light intensities employed. Their highest light (1.9 X
ro4 ergs/cm.'/sec.) was only about 1/25 of the intensity used inmost of our experiments (as in figs. 8, 9, and 10). Their fluorescencecurves show a rapid initial rise, followed by a slower rise to amaximum reached in 2 or 3 seconds; a decrease to a minimum atabout 5 seconds; a rise to a second maximum at about 20 seconds;and a gradual decay continuing for several minutes. As in the caseof Kautsky and Hormuth, the variations observed were proportionately small. Our equipment does not permit us to work effectivelyat light intensities as low as theirs. However, several of our curvesobtained at lower intensities (ca. ro' ergs/cm.'/sec.) show somesimilarity. Curve 5 of figure I is very similar to their curves exceptfor the absence of their first maximum; curve 9 of figure 9 is alsosimilar to their curves except for their final decay. Most of the workof Wassink and Katz ,vas devoted to a study of the various phasesof the fluorescence curve as functions of temperature, light intensity,and oxygen pressure on cells in which photosynthesis was totallyinhibited by cyanide. Such a treatment completely prevents the finaldecay in fluorescence as clearly shown by their figure 4 (p. 153).Similar experiments have not yet been tried in this laboratory.
Our exploratory data make it clear that a wide range of inductionphenomena is exhibited by Chlorella and by wheat under variousconditions of the plants and their environment. More intensive andquantitative studies now being undertaken are necessary to makeclear the complex interplay between the various external and internalfactors and their effects on the induction behavior. This discussionwill therefore be chiefly phenomenological, considering the relationships of the various observed effects rather than the mechanism bywhich they are brought about.
INTERPRETATION OF INDUCTION CURVES
The induction curves must first be examined in order to separateinstrumental effects from the true plant behavior. The fluorescencecurves obtained with the fast galvanometer (period 1/roO second)may be considered very close to the true course of the fluorescenceintensity, since the time lag in recording is here very small (fig. II).

22 SMITHSONIAN MISCELLANEOUS COLLECTIONS VOL. 99
The galvanometer used in the rest of the experiments (figs. I to ro)had a period of I.2 seconds, and this sligi1t lag must therefore beconsidered in interpreting the fluorescence curves. The recording ofthe rate of carbon dioxide assimilation is not nearly so rapid. Timeis required for the gas stream to pass from the plant chamber to theabsorption cell, for the thermocouple response, and for the responseof the primary and secondary galvanometers. Fortunately these timelags are not entirely additive. However, there is in addition anintegration or "smearing out" of the response. For instance thevolume of air in the absorption cell at any instant represents a finitetime period of the plant's activity. The galvanometer system may bethought of as responding in overlapping units of time of about 4seconds each. During the quick initial "gulp" of carbon dioxide(curves I and 2 of fig. 3) the peak change in carbon dioxide passesthrough the absorption cell in much less than 4 seconds. The initialmovement of the galvanometer is therefore at least partially a ballisticresponse with a correspondingly reduced sensitivity and shortenedtime of indication during this important part of the curve.
A number of the curves shown above have been redrawn in order
to eliminate as far as possible the instrumental lag in the recordingof the rate of carbon dioxide assimilation. This has been done bymaking tracings of the original curves and moving the carbon dioxidecurve to the left a distance equivalent to the time of transit betweenthe plant chamber and the absorption cell. The curves are also corrected for the decreased sensitivity at higher carbon dioxide concentration which is characteristic of the spectrographic method. Inaddition a broken line (.-.-.-) has been added to show the probablecourse of carbon dioxide assimilation in the plant which would givethe recorded curve. This is appreciably different from the recordedcurve only during the rapid changes of the first ro seconds of illumination. The fluorescence curves have not been altered since theyare reasonably accurate except for the first 2 or 3 seconds.
Perhaps the simplest type of induction behavior is that exhibitedby wheat at low light intensity (fig. I, curve 5) or following a veryshort dark rest (fig. I, curves 6 and 7). These curves approximatelinear behavior, i.e., induction effects are here approaching a minimum. It was under light intensities even lower than those in curve5 of figure I that the fluorescence curves of Wassink and Katz andof Kautsky and Hormuth were obtained. It is possible that withgreater resolution in our recording apparatus similar effects might beobserved here. In any case these effects must be small compared tothose obtained at higher intensities.
No.6 PHOTOSYNTHESIS-McALISTER AND MYERS 23
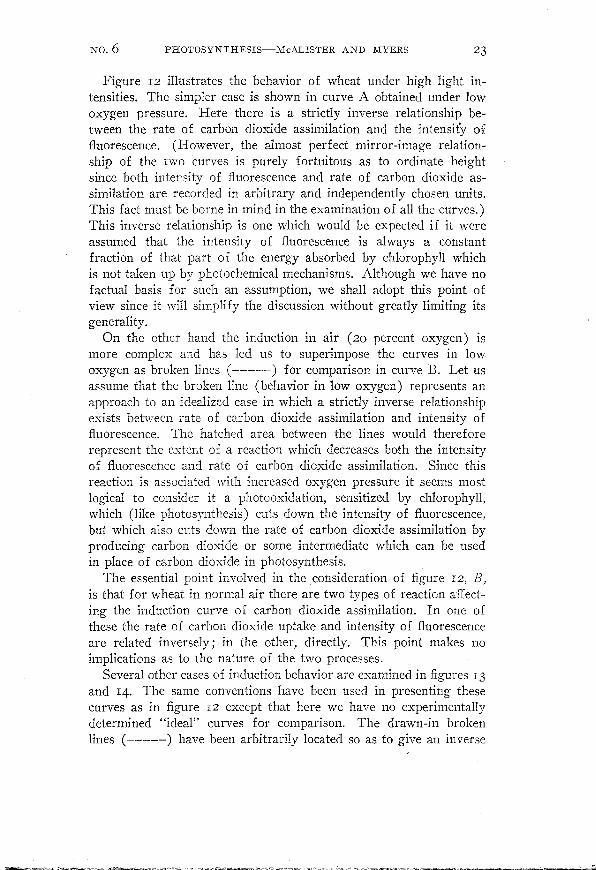
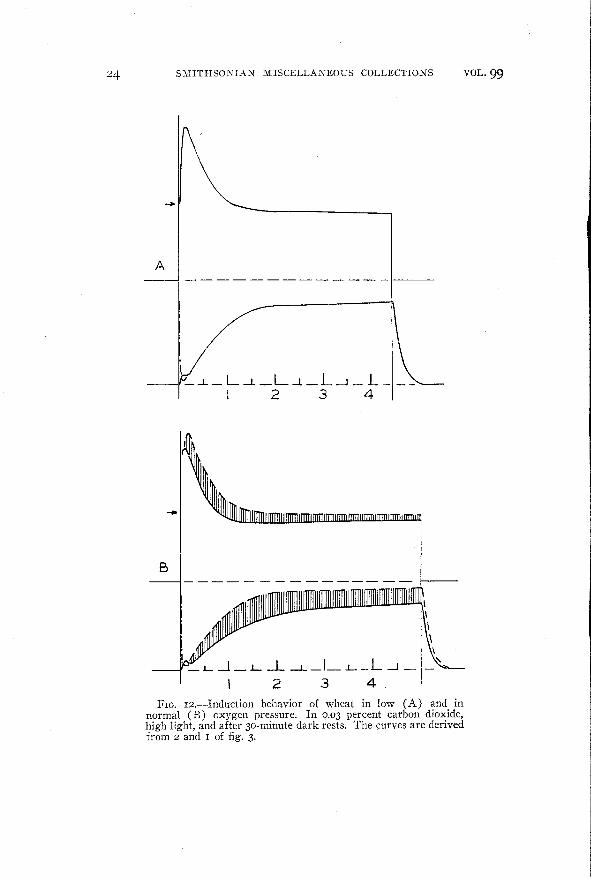
Figure I2 illustrates the behavior of wheat under high light intensities. The simpler case is shown in curve A obtained under lowoxygen pressure. Here there is a strictly inverse relationship between the rate of carbon dioxide assimilation and the intensity offluorescence. (However, the almost perfect mirror-image relationship of the two curves is purely fortuitous as to ordinate heightsince both intensity of fluorescence and rate of carbon dioxide assimilation are recorded in arbitrary and independently chosen units.This fact must be borne in mind in the examination of all the curves.)This inverse relationship is one which would be expected if it wereassumed that the intensity of fluorescence is always a constantfraction of that part of the energy absorbed by chlorophyll whichis not taken up by photochemical mechanisms. Although we have nofactual basis for such an assumption, we shall adopt this point ofview since it will simplify the discussion without greatly limiting itsgenerality.
On the other hand the induction in air (20 percent oxygen) ismore complex and has led us to superimpose the curves in lowoxygen as broken lines (-----) for comparison in curve B. Let usassume that the broken line (behavior in low oxygen) represents anapproach to an idealized case in which a strictly inverse relationshipexists between rate of carbon dioxide assimilation and intensity offluorescence. The hatched area between the lines would therefore
represent the extent of a reaction which decreases both the intensityof fluorescence and rate of carbon dioxide assimilation. Since thisreaction is associated with increased oxygen pressure it seems mostlogical to consider it a photooxidation, sensitized by chlorophyll,which (like photosynthesis) cuts down the intensity of fluorescence,but which also cuts down the rate of carbon dioxide assimilation byproducing carbon dioxide or some intermediate which can be usedin place of carbon dioxide in photosynthesis.
The essential point involved in the consideration of figure I2, B)
is that for wheat in normal air there are two types of reaction affecting the induction curve of carbon dioxide assimilation. In one ofthese the rate of carbon dioxide uptake and intensity of fluorescenceare related inversely; in the other, directly. This point makes noimplications as to the nature of the two processes.
Several other cases of induction behavior are examined in figures 13and 14. The same conventions have been used in presenting thesecurves as in figure 12 except that here we have no experimentallydetermined "ideal" curves for comparison. The drawn-in brokenlines (-----) have been arbitrarily located so as to give an inverse
._~.- ..: ~ - ~~~ ~- ~~-
24 SMITHSONIAN MISCELLANEOUS COLLECTIONS VOL. 99
A
h-- L.1_ ...L _ L -L _ L-L _ --..J _ L _I 2 3 4
B
I!
!..-1JY L-_L-.1_L-L-L_I_L_ .....J_
I 234FIG. IZ.-Induction behavior of wheat in low (A) and in
normal (B) oxygen pressure. In 0.03 percent carbon dioxide,high light, and after 30-minute dark rests. The curves are derivedfrom Z and I of fig. 3.
No.6 PHOTOSYNTHESIS-McALISTER AND MYERS 25
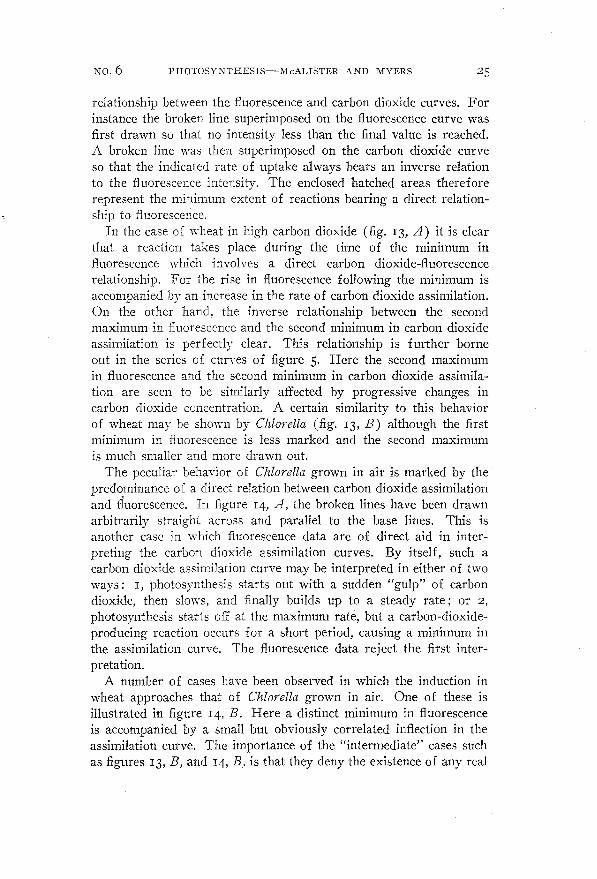
relationship between the fluorescence and carbon dioxide curves. Forinstance the broken line superimposed on the fluorescence curve wasfirst drawn so that no intensity less than the final value is reached.A broken line was then superimposed on the carbon dioxide curveso that the indicated rate of uptake always bears an inverse relationto the fluorescence intensity. The enclosed hatched areas thereforerepresent the minimum extent of reactions bearing a direct relationship to fluorescence.
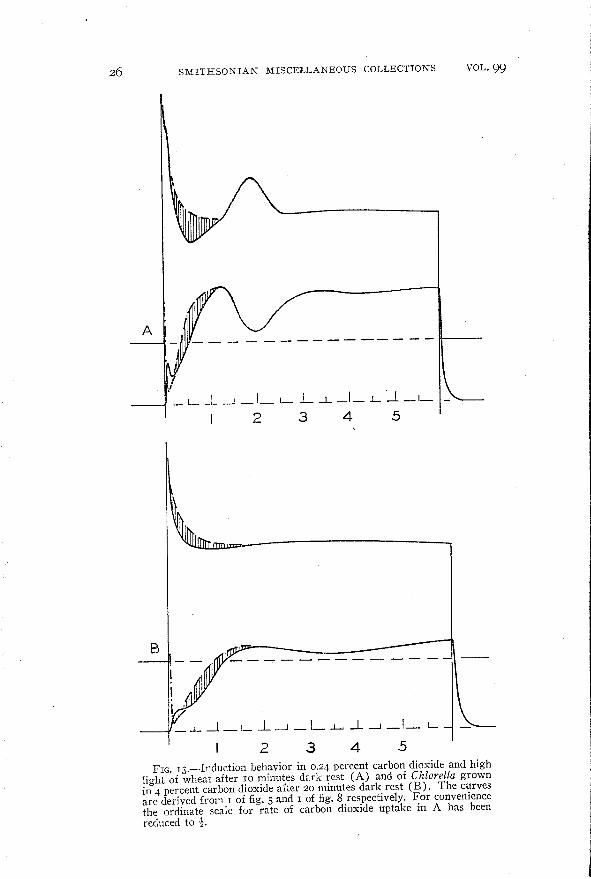
In the case of ",heat in high carbon dioxide (fig. 13, A) it is clearthat a reaction takes place during the time of the minimum influorescence which involves a direct carbon dioxide-fluorescence
relationship. For the rise in fluorescence following the minimum isaccompanied by an increase in the rate of carbon dioxide assimilation.On the other hand, the inverse relationship between the secondmaximum in fluorescence and the second minimum in carbon dioxide
assimilation is perfectly clear. This relationship is further borneout in the series of curves of figure 5. Here the second maximumin fluorescence and the second minimum in carbon dioxide assimila
tion are seen to be similarly affected by progressive changes incarbon dioxide concentration. A certain similarity to this behaviorof wheat may be shuwn by ChIarella (fig. 13, B) although the firstminimum in fluorescence is less marked and the second maximumis much smaller and more drawn out.
The peculiar behavior of ChIarella grown in air is marked by thepredominance of a direct relation between carbon dioxide assimilationand fluorescence. In figure 14, A, the broken lines have been drawnarbitrarily straight across and parallel to the base lines. This isanother case in which fluorescence data are of direct aid in inter
preting the carbon dioxide assimilation curves. By itself, such acarbon dioxide assimilation curve may be interpreted in either of twoways: I, photosynthesis starts out with a sudden "gulp" of carbondioxide, then slows, and finally builds up to a steady rate; or 2,
photosynthesis starts off at the maximum rate, but a carbon-dioxideproducing reaction occurs for a short period, causing a minimum inthe assimilation curve. The fluorescence data reject the first interpretation.
A number of cases have been observed in which the induction in
wheat approaches that of ChIarella grown in air. One of these isillustrated in figure 14, B. Here a distinct minimum in fluorescenceis accompanied by a small but obviously correlated inflection in theassimilation curve. The importance of the "intermediate" cases suchas figures 13, B, and 14, B, is that they deny the existence of any real
26
A
SMITHSONIAN MISCELLANEOUS COLLECTIONS
.I__L _L -l _1_ '- L -L _1_ L J_1_._
I 2 3 4 5
VOL. 99
B ------------II1
«_...I- -1_1_ ...L......J_1_ -L- -L -l _1_ L
2 3 4 5FIG. I3.-Induction behavior in 0.24 percent carbon dioxide and high
light of wheat after 10 minutes dark rest (A) and of Chiarella grownin 4 percent carbon dioxide after 20 minutes dark rest (B). The curvesare derived from I of fig. 5 and I of fig. 8 respectively. For conveniencethe ordinate scale for rate of carbon dioxide uptake in A has beenreduced to ~.
No.6 PHOTOSYNTHESIS-McALISTER AND MYERS 27
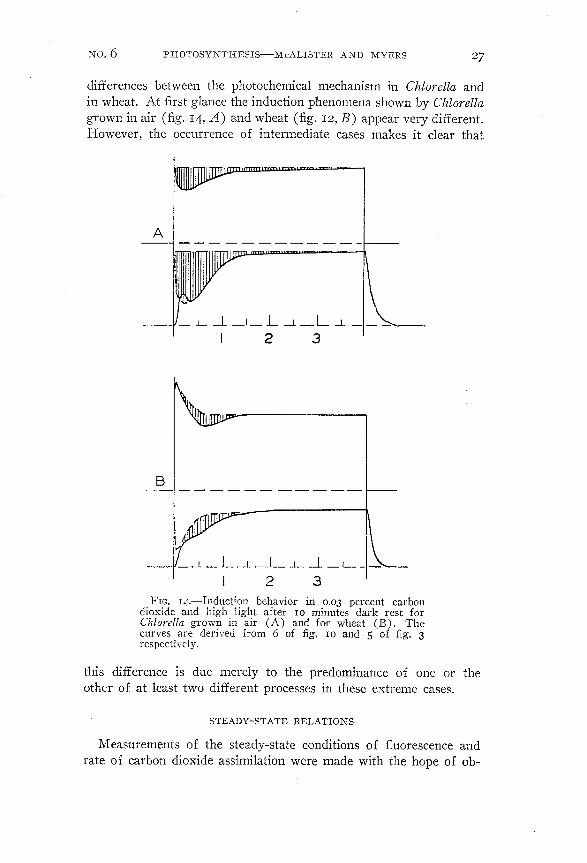
differences between the photochemical mechanism in Chlorella andin wheat. At first glance the induction phenomena shown by Chlorellagrown in air (fig. 14, A) and wheat (fig. 12, B) appear very different.However, the occurrence of intermediate cases makes it clear that
A
ITmII
~"I
_ .L -1_1_ L --1 _ L -L123
B
_..--1_L.......l_I_.L ~ _1__ ._j 2 3
FIG. J4.-Induction behavior in 0.03 percent carbondioxide and high light after IO minutes dark rest forChlarella grown in air (A) and for wheat (B). Thecurves are derived from 6 of fig. IO and 5 of fig. 3respectively.
this difference is due merely to the predominance of one or theother of at least two different processes in these extreme cases.
STEADY-STATE RELATIONS
Measurements of the steady-state conditions of fluorescence andrate of carbon dioxide assimilation were made with the hope of ob-
~ _.~-","-':;"'- ~ .._--_ .•••. ~ =-0.-"',,",_. _ -''''''.E2=~_,:''~~~._.»- ~ . " . ~._.:...,.~~-~_. __ ~------:_

28 SMITHSONIAN MISCELLANEOUS COLLECTIONS VOL. 99
taining additional data which might be of help in the interpretationof the relationship between fluorescence and photosynthesis shown byinduction studies. Similar studies have been made by vVassink et al.(I938), who have measured the intensity of fluorescence and rate ofoxygen production under steady-state conditions. They report nochange in the state of fluorescence (i.e., intensity of fluorescenceproportional to incident intensity) in passing from a light-limitingcondition of photosynthesis to light-saturation. Nor was fluorescenceintensity influenced by any of a number of conditions which markedlyaffected the rate of photosynthesis (temperature, partial inhibition
by cyanide, oxygen pressure). However, when photosynthesis waspartially inhibited by urethane, the intensity of fluorescence wasclearly raised. In a later paper vVassink and Katz (I939) showed anincrease in intensity of fluorescence due to complete inhibition ofphotosynthesis by cyanide. Their highest incident intensity was lessthan 2 X ro4 ergs/cm.2/sec. Complete saturation was apparentlyreached at this intensity in the number 9 carbonate-bicarbonate bufferof Warburg (I920).
In the present experiments on wheat S we find a marked ch'angein fluorescence in passing from light-limiting to carbon-dioxidelimiting conditions. This is seen in both figures IS and I6. Figure IS
shows the rate of carbon dioxide assimilation and intensity offluorescence for wheat at 230 C. and 0.03 percent carbon dioxide inboth air and tank nitrogen as a function of incident intensity. Forthe two cases in air (duplicate experiments) the intensity offluorescence is seen to rise above the initial straight line concurrentlywith a marked departure from light-limiting conditions.
Figure I6 exhibits a similar behavior in a comparison of intensityof fluorescence under 4 percent and 0.03 percent carbon dioxide.Here, presumably, the wheat was entirely under light-limiting conditions at 4 percent carbon dioxide, but at 0.03 percent carbondioxide a carbon dioxide limitation begins at relatively low incidentintensity (d. fig. IS) and the fluorescence intensity rises above theinitial line.
Warburg (I920) -has shown that ChlO'rella in high light and highcarbon dioxide produces oxygen at a considerably greater rate in 2
percent than in 20 percent oxygen. A similar behavior as to carbondioxide assimilation in wheat is shown by figure IS. Here under
carbon-dioxide-limiting conditions the rate is 30 percent higher in
8 Similar quantitative experiments on algae have not been feasible with ourpresent equipment. Such work is anticipated.
NO.6 PHOTOSYNTHESIS-McALISTER AND MYERS 29
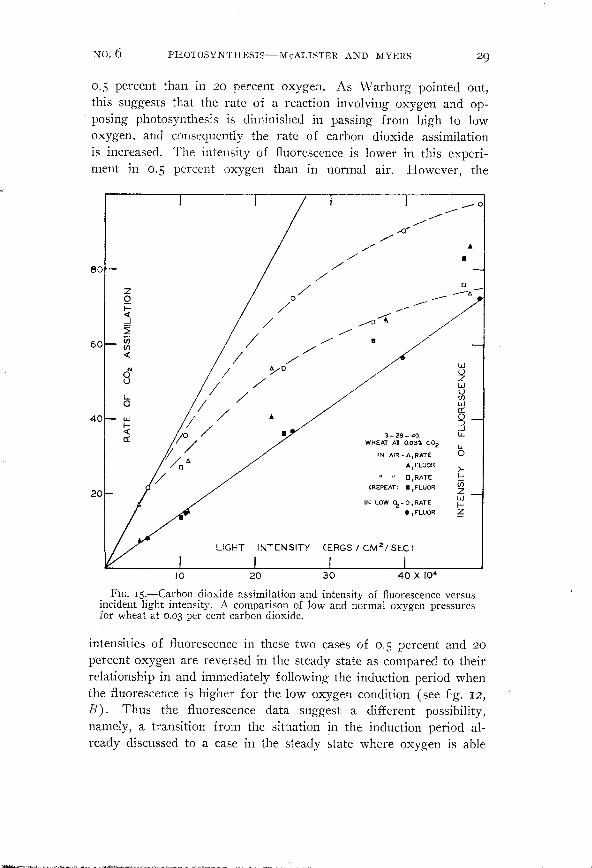
0.5 percent than in 20 percent oxygen. As Warburg pointed out,this suggests that the rate of a reaction involving oxygen and opposing photosynthesis is diminished in passing from high to lowoxygen, and consequently the rate of carbon dioxide assimilationis increased. The intensity of fluorescence is lower in this experiment in 0.5 percent oxygen than in normal air. However, the
..•
wuzwUIf)wa:o3~LLo>I-UiZwIZ
40 X 104
•
U II D,RATE
(REPEAT) I ,FLUOR.
3-26-40.WHEAT AT 0.031. c.02
IN AIR - A,RATE
A ,FLUOR.
IN LOW ~-O,RATE• ,FLUOR.
30
..
20
LIGHT INTENSITY (ERGS / CM2/ SEC)
10
_____ 0-/4
////
0// 0/ --~-----
/ __ 0---(/ //// ~o/ // // /
Ijo /1/ /
f /o~'/
zQ~--.I
~UiU)<{
~oWI«a:
ou
40
20
80
60
FIG. Is.-Carbon dioxide assimilation and intensity of fluorescence versusincident light intensity. A comparison of low and normal oxygen pressuresfor wheat at 0.03 per cent carbon dioxide.
intensities of fluorescence in these two cases of 0.5 percent and 20percent oxygen are reversed in the steady state as compared to theirrelationship in and immediately following the induction period whenthe fluorescence is higher for the low oxygen condition (see fig. 12,B) . Thus the fluorescence data suggest a different possibility,namely, a transition from the situation in the induction period already discussed to a case in the steady state where oxygen is able
-iii---""""''''__ h'''QC='''~~-' • -'~-"""""'~""""'-~"'=,£&.-,,"~""""-.. ---~ - ~ ~,.,..". -~~-_.

3° SMITHSONIAN MISCELLANEOUS COLLECTIONS VOL. 99
to inhibit photosynthesis. Reducing the oxygen pressure then allowsa greater rate of photosynthesis and the fluorescence is consequentlyreduced. Further experiments, wherein the transition from theinduction phase to the steady state is followed more closely are
0'100
o
DATA OF 5-7-40ON WHEAT
+,4% CO20,0.03" "
80
Iw
()Zw()(f)601- w a:0:)...JlL.
lL.
040~ >- I-
(f)ZwI-zI
-20
o
o
LIGHT INTENSITY (ERGS/CM;!/SECl
I ,
20 40 60 X 104
FIG. 16.-Intensity of fluorescence versus incident light intensity for wheatat 4 percent and at 0.03 percent carbon dioxide.
anticipated and should distinguish between these two opposingexplanations.
It is interesting to note that this oxygen effect of relatively largeproportions occurs under natural growing conditions and hence may
No.6 PHOTOSYNTHESIS-J\IcALISTER AND MYERS 31
r)..,.
~~l
'"'
be of importance in studies involving vegetative growth. As yet ithas been observed only in wheat, but other plants should be examinedto determine the generality of the phenomenon. Because of itsmagnitude and intimate relationship with photosynthesis it shouldnot be considered as an effect of light on the normal (dark)respiration." Curve 3 of figure 7 indicates, as was previously reported by McAlister (1939), that respiration of wheat in light (inthe absence of photosynthesis) is observed to ,be of the samemagnitude as in darkness.
In comparing our data on wheat with those of Wassink et al.(1938) on Chlorella, it must be borne in mind that their incidentintensities were nearly two orders of magnitude smaller than ours.Although our equipment does not permit accurate work at such lowintensities, in this region we likewise find no marked departure froma linear relationship between intensity of fluorescence and incidentlight intensity. The only marked departure that we do find appearsto be due to a carbon dioxide limitation, whereas with the number 9buffer and the low intensities used, VV'assink et al. were not farfrom light-limiting conditions in most of their experiments. In noneof their experiments did they attain a carbon dioxide limitation.Consequently our data are not at great variance with theirs.
The young wheat used in our experiments requires very highintensity to reach light-saturation. In experiments, as yet incomplete,we have used incident intensities as high as I40X 104 ergs/cm:/sec.,which are twice as high as those of figure 16 and three times theintensity in visible solar radiation. At this highest intensity we havefound that carbon dioxide assimilation in 04 percent carbon dioxideis still increasing though not at the light-limited rate. In the experiments of Hoover et al. (1933) incident intensities up to about70 X 104 ergs/ cm:/ sec. were used. It is important to point out herethat their Mazda radiation was filtered only by a 2.5-mm. layer ofsaturated copper sulphate solution. Consequently the incident intensities effective in producing photosynthesis in their experimentswere from 20 to 30 percent of the values reported. However, theirexperiments clearly indicate that a very high value for lightsaturation is to be expected for young wheat.
THE "DARK PICK-UP" OF CARBON DIOXIDE
A dark pick-up of carbon dioxide is apparent in all the assimilationcurves obtained with the continuous-flow method. That it is greaterthan the instrumental lag is seen when it is compared to this lag,
9 See also Gaffron (1940).

32 SMITHSONIAN MISCELLANEOUS COLLECTIONS VOL. 99
as for example in figure I, curve 4, figure 5, curves 4 and 6, andfigure 8, curves 2, 5, and 8. The sharp dip at the end of these curves(in darkness) represents the sweeping out of the system of a 15seconds' accumulation of respired carbon dioxide upon resumptionof the air flow. This gives a measure of the total instrumental lagin the case of wheat and of the instrumental plus liquid-to-gasdiffusion time in the case of Chiarella (fig. 8).
A greatly increased time for the dark pick-up is evident whenthe plants have been in low carbon dioxide concentration during thelight period. This is seen in curves I, 3, 4, and 5 of figure 2, curves3, 4, and 5 of figure 10, and particularly in curve 2 of figure 7. Inthis latter case, where the concentration of oxygen was also low,the dark pick-up has a half time of more than I minute.
Much more work remains to be done on this dark pick-up, particularly ,vhen the present type of experiment is put on a morequantitative basis. The present work with the continuous-flow methodhas not shown a dark pick-up lasting for IS or 20 seconds followinga high rate of photosynthesis as was previously reported (l\1cAlister,1939). This discrepancy is being investigated and will be reportedon in the near future.
GENERAL DISCUSSION
It has been the purpose of this paper to examine a wide range ofinduction phenomena rather than to study anyone of them indetail. The apparent relationships between these various effects havebeen pointed out. A correlation between the fluorescence intensityand rate of carbon dioxide uptake has been clearly shown in a numberof cases, although this has involved sometimes a direct, and at othertimes an inverse, relationship.
Induction phenomena have been observed whenever a sudden increase in the rate of photosynthesis was brought about. Particularlysignificant are the fluorescence curves accompanying sudden changesin carbon dioxide concentration. These show clearly that fluorescenceis somehow affected by the rate of photosynthesis. On the other handit must be pointed out that changes in intensity of fluorescence haveoccasionally been observed without accompanying deviations in therate of carbon dioxide uptake. (ei, curve 4 of fig. 2, and curve 3of fig. 9, and others not shown).
Our data make it clear that the induction of photosynthesis is nota single or simple process. It is conceivable that during this periodthree types of reactions are proceeding toward the steady-state condition: I, photosynthesis, involving the reduction of carbon dioxide;
No.6 PHOTOSYNTHESIS-McALISTER AND MYERS 33
'"
2, photooxidation, an oxidation of certain more stable intermediatesor products of photosynthesis, sensitized by chlorophyll; and 3, oxidation, a direct burning of unstable intermediates of photosynthesis.Of these the first two are dependent, the third independent, ofenergy transfer from activated chlorophyll.
The simple viewpoint which we have taken of the transfer ofenergy from activated chlorophyll is that such energy may be: I,
contributed to a photochemical process; 2, re-emitted as fluorescence;or 3, lost as heat. It is thus possible that the intensity of fluorescencemay be influenced by either photosynthesis or photooxidation orby both processes simultaneously. Our data show that some suchrelationship does exist, but the details of the relation are obscuredby our lack of knowledge of the mechanism of the quenchingof fluorescence.
Another line of evidence comes from the dependence of the induction effects on the length of the previous dark rest. This wellestablished phenomenon may be accounted for by either of two alternate hypotheses: I, Some material, formed by respiration, graduallyaccumulates (up to a maximum level) in the dark. In its subsequentphotooxidation in light, transient intermediates are formed whichsomehow aid in the emission of fluorescence. 2, Some intermediateor product of photosynthesis, formed in light, inhibits fluorescenceand increases the rate of photosynthesis. In the dark the concentration of this substance progressively decreases.
Either of these two hypotheses can be made to account for the induction in both carbon dioxide uptake and fluorescence of wheat in0.03 percent carbon dioxide (fig. 12). However, the implications ofthe two hypotheses are very different. The first 10 postulates thatphotosynthesis starts out immediately at about the level of the steadyrate. The induction in carbon dioxide uptake is due to the carbondioxide (or carbon-dioxide-sparing substance) produced by theinitial photooxidation. This also means that there is a direct relationship between rate of carbon dioxide production and intensity offluorescence, i.e., an inverse relationship between rate of carbondioxide uptake and intensity of fluorescence.
The second hypothesis, on the other hand (as suggested above,p. 23), supposes that the rates of both photosynthesis and photooxidation bear an inverse relationship to the intensity of fluorescence.There is an initial "gulp" of carbon dioxide and momentary quenching of fluorescence which corresponds to the amount of "intermediate"
10 Suggested to us by Dr. James Franck.

34 SMITHSONIAN MISCELLANEOUS COLLECTIONS VOL. 99
adsorbed in the neighborhood of the chlorophyll and not destroyedin the dark. Thereafter the concentration of this intermediate first
decreases until its rate of formation equals its rate of utilization, thenit slowly increases to the steady-state value. Correspondingly, thefluorescence rises abruptly to a maximum and then slowly decays,while the rate of carbon dioxide assimilation falls sharply to a minimumand then rises gradually to the equilibrium rate.
N either of these hypotheses will account for all the data obtained.The first is certainly inconsistent with the burst of fluorescencecaused by a suddenly increased carbon dioxide concentration (curves3 and 4 of fig. 6) and makes difficult any interpretation of theseveral observed cases in which carbon dioxide and fluorescence are
directly related (figs. 13 and 14). The second does not explainthe inverse relation between the second carbon dioxide minimum and
the second fluorescence maximum found in wheat at high carbondioxide concentration (fig. 13, A). However, because it seemedmore consistent with the other data, we have taken this viewpointas a basis for discussion.
From this second viewpoint the induction shown by wheat in0.03 percent carbon dioxide in nitrogen is chiefly the building upof the rate of photosynthesis accompanied by a decay in fluorescence.l1In air a photooxidation occurs as a secondary process, prolongingthe induction in carbon dioxide uptake.
In Chlorella either one or the other of these two processes may bemade to predominate. This alga quickly adapts itself to environmental conditions. Cells grown in 4 percent carbon dioxide show,when first studied, an induction generally similar to that of wheat(as fig. 13, B). After a few hours of light in 0.03 percent carbondioxide the fluorescence curve develops a noticeable minimum duringthe induction period. After 24 hours in 0.03 percent carbon dioxidethe induction behavior has changed completely to that shown bycells which have never been in high carbon dioxide (as fig. 14, A).During this time the secondary photooxidation progressively attainsa more important role in the induction behavior until all other effectsseem to be obscured."
11 This decay may also be brought about in zero carbon dioxide if oxygen ispresent (curves 4 and 6 of fig. 3). This may be interpreted as due to theopposing effects of photosynthesis and photooxidation, for which the carbondioxide uptake curve is the net result.
12 This experience may be related to Aufdemgarten's observation (I939b) thatthe minimum in the induction curve of carbon dioxide uptake is dependent on
the composition of the nutrient media used.
No.6 PHOTOSYNTHES1S~McAL1STER AND MYERS
SUMMARY
35
Simultaneous measurements of intensity of fluorescence and rateof carbon dioxide assimilation during and following the inductionperiod in wheat and in ChIarella are reported. While these observations are to be regarded as exploratory and preliminary, they permitthe following conclusions:
1. Any sudden change in conditions of illumination or of carbondioxide concentration that produces a large increase in the rate ofphotosynthesis also gives rise to a "burst" in the intensity offluorescence. ·When this change is from darkness to high light, theburst of fluorescence produced can be resolved into three parts, aswas previously shown by Franck and Wood. The intensity offluorescence rises instantly (less than 0.01 second) to a height aboutequal to the final equilibrium value, then more slowly (in about 1second) rises two or three times higher to a maximum which isfollowed by a decay (lasting about 1 minute) to the equilibriumvalue. The simultaneously observed rate of carbon dioxide assimilation follows a curve that is inversely related to the changes influorescence. When the recorded curve is corrected for instrumentaleffects it is apparent that the rate of carbon dioxide uptake startsat a value at least as high as the equilibrium rate, then quickly dropsto a low minimum (but not negative) value, followed by a riseasymptotically approaching the final rate. At low oxygen pressures(less than i percent) the curves of fluorescence and rate of carbondioxide uptake are almost exact mirror images of each other (as totime).
2. The changes in rate of carbon dioxide assimilation observed inthe induction period of wheat under normal air conditions (20percent oxygen and 0.03 percent carbon dioxide) are caused by twoprocesses, of which one exhibits an inverse relation to intensity offluorescence and the other is directly related. The dependence of thissecond type on oxygen pressure and the observation of a greater rateof carbon dioxide uptake under low oxygen pressures suggests thatthis second type of reaction is a photooxidation.
3. In ChIarella the induction behavior is greatly influenced by theprevious conditions of culture. Cells grown in high carbon dioxideshow a behavior quite comparable to that of wheat. In the inductionshown by cells acclimated to low carbon dioxide, the photooxidationtype of reaction predominates to such an extent that pronouncedminima are produced in both the fluorescence and carbon dioxideuptake curves.

36 SMITHSONIAN MISCELLANEOUS COLLECTIONS VOL. 99
4. Under carbon dioxide concentrations greater than that of normalair the induction phenomenon in wheat is complicated by a secondmaximum in fluorescence occurring after about I-minute illumination.At the same time a minimum in rate of carbon dioxide uptake is observed which clearly bears an inverse relationship to this secondmaximum of fluorescence.
5. Curves relating intensity of fluorescence and rate of carbondioxide uptake to incident intensity have been obtained from measurements made under steady-state conditions following the induction period. These show a marked change in fluorescence in passingfrom light-limiting to carbon-dioxide-limiting conditions. The intensity of fluorescence rises above the initial straight line concurrentlywith a marked departure from light-limiting conditions.
The rate of carbon dioxide assimilation in wheat in high light and0.03 percent carbon dioxide is 30 to 50 percent higher in 0.5 percentthan in 20 percent oxygen. This suggests that for young wheat areaction of large proportions opposing photosynthesis is alwaysdepressing the rate of carbon dioxide assimilation under naturalgrowing conditions.
LITERATURE CITED
AUFDEMGARTEN,H.I939a. Zur Kenntnis der sogenannten lnduktionsvorgange bei der Kohlen
saureassimilation. Planta, vol. 29, pp. 643-678.1939b. Weitere Untersuchungen mit dem Gaswechselscheiber liber die
Kohlensaureassimilation. Planta, vol. 30, pp. 343-352.EMERSON,R, and LEWIS, C. M.
1939. Factors influencing the efficiency of photosynthesis. Amer. J ourn.Bot., vol. 26, pp. 808-822.
FRANCK, J., and HERZFELD,K. F.1937. An attempted theory of photosynthesis. J ourn. Chern. Phys., vol. S.
pp. 237-2S1.FRANCK,J., and WOOD,R W.
1936. Fluorescence of chlorophyll in its relation to photochemical processesin plants and organic solutions. J ourn. Chern. Phys., vol. 4,pp. SSI-S60.
GAFFRON,H.1940. Studies on the induction period of photosynthesis and light respiration
in green algae. Amer. Journ. Bot., vol. 27, pp. 204-216.HOAGLAND,D. R, and ARNON, D. 1.
1938. The water-culture method for growing plants without soil. Univ.California Agr. Exp. Stat. Circ. 347, pp. 1-39. Also in Ann. Rep.Smithsonian lnst. for 1938, pp. 461-488.
HOOVER,W. H., JOHNSTON,E. S., and BRACKETT,F. S.1933. Carbon dioxide assimilation in a higher plant. Smithsonian Misc:
ColI., vol. 87, No. 16, pp. 16-17.
No.6 PHOTOSYNTHESIS-McALISTER AND MYERS 37
~.
KAUTSKY, H., and HORMUTH,R.1937. Die Abhandigkeit des Verlaufs der Fluoreszenzkurven griiner
Blatter vom Sauerstoffdruck. Biochem. Zeitschr., vol. 291, pp. 285311.
KAUTSKY, H., and MARX, A.1937. Photographische Registrierung und Auswertung der Fluoreszenzin
tensitat griiner Blatter. Biochem. Zeitschr., vol. 290, pp. 248-260.McALISTER, E. D.
1937. Time course of photosynthesis for a higher plant. Smithsonian Misc.CoIL, vol. 95, No. 24, pp. 1-17.
1939. The chlorophyll-carbon dioxide ratio during photosynthesis. Journ.Gen. Physiol., vol. 22, pp. 613-636.
ORNSTEIN,L. S., VVASSINK,E. C, REMAN, G. H., and VERMEULEN,D.1938. Theoretical considerations concerning the relation between chloro
phyll fluorescence and photosynthesis in green plant cells. Enzymol.,vol. 5, pp. lIo-u8.
VERMEULEN,D., WASSINK, E. C, and REMAN, G. H.1937. On the fluorescence of photosynthesizing cells. Enzymol., vol. 4,
pp. 254-268.WARBURG,O.
1920. Uber die Geschwindigkeit der photochemischen Kohlensaurezersetzung in lebenden Zellen. II. Biochem. Zeitschr., vol. !O3, p. 188.
WASSINK, E. C, and KATZ, E.1939. The initial changes of chlorophyll-fluorescence in Chiorella. En
zymol., vol. 5, pp. 145-172.WASSINK, E. C, VERMEULEN,D., REMAN, G. H., and KATZ, E.
1938. On the relation between fluorescence and assimilation in photosynthesizing cells. Enzymol., vol. 5, pp. Ioo-r09.