Embed Size (px)
Citation preview

IDENTIFICATION OF THE BEST PRACTICES FOR
DESIGN, CONSTRUCTION, AND REPAIR OF
BRIDGE APPROACHES
Sponsored bythe Iowa Department of Transportationand the Iowa Highway Research Board
Final Report January 2005
Iowa DOT Project TR-481CTRE Project 02-118

The opinions, findings, and conclusions expressed in this publication are those of the authors andnot necessarily those of the Iowa Department of Transportation.
CTRE’s mission is to develop and implement innovative methods, materials, and technologiesfor improving transportation efficiency, safety, and reliability while improving the learningenvironment of students, faculty, and staff in transportation-related fields.
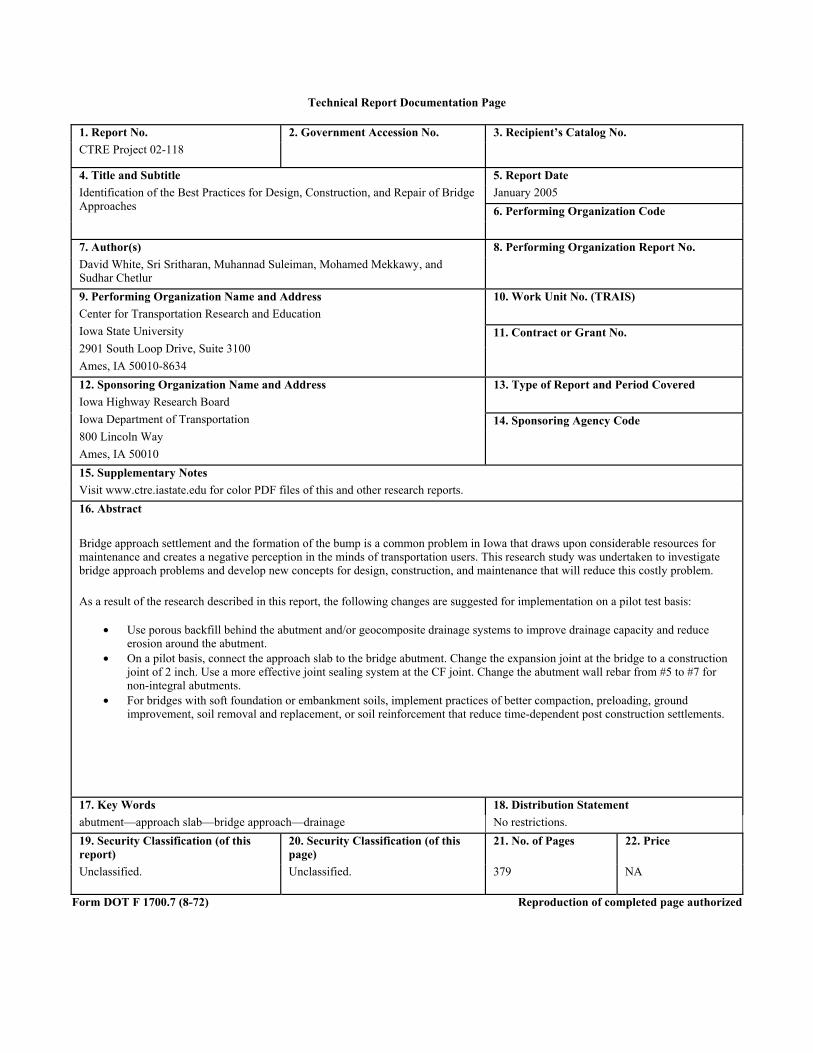
Technical Report Documentation Page
1. Report No. 2. Government Accession No. 3. Recipient’s Catalog No. CTRE Project 02-118
4. Title and Subtitle 5. Report Date January 2005 6. Performing Organization Code
Identification of the Best Practices for Design, Construction, and Repair of Bridge Approaches
7. Author(s) 8. Performing Organization Report No. David White, Sri Sritharan, Muhannad Suleiman, Mohamed Mekkawy, and Sudhar Chetlur
9. Performing Organization Name and Address 10. Work Unit No. (TRAIS) 11. Contract or Grant No.
Center for Transportation Research and Education Iowa State University 2901 South Loop Drive, Suite 3100 Ames, IA 50010-8634
12. Sponsoring Organization Name and Address 13. Type of Report and Period Covered 14. Sponsoring Agency Code
Iowa Highway Research Board Iowa Department of Transportation 800 Lincoln Way Ames, IA 50010
15. Supplementary Notes Visit www.ctre.iastate.edu for color PDF files of this and other research reports. 16. Abstract Bridge approach settlement and the formation of the bump is a common problem in Iowa that draws upon considerable resources for maintenance and creates a negative perception in the minds of transportation users. This research study was undertaken to investigate bridge approach problems and develop new concepts for design, construction, and maintenance that will reduce this costly problem. As a result of the research described in this report, the following changes are suggested for implementation on a pilot test basis:
• Use porous backfill behind the abutment and/or geocomposite drainage systems to improve drainage capacity and reduce erosion around the abutment.
• On a pilot basis, connect the approach slab to the bridge abutment. Change the expansion joint at the bridge to a construction joint of 2 inch. Use a more effective joint sealing system at the CF joint. Change the abutment wall rebar from #5 to #7 for non-integral abutments.
• For bridges with soft foundation or embankment soils, implement practices of better compaction, preloading, ground improvement, soil removal and replacement, or soil reinforcement that reduce time-dependent post construction settlements.
17. Key Words 18. Distribution Statement abutment—approach slab—bridge approach—drainage No restrictions. 19. Security Classification (of this report)
20. Security Classification (of this page)
21. No. of Pages 22. Price
Unclassified. Unclassified. 379 NA
Form DOT F 1700.7 (8-72) Reproduction of completed page authorized


IDENTIFICATION OF THE BEST PRACTICES FOR DESIGN, CONSTRUCTION, AND REPAIR OF
BRIDGE APPROACHES
Iowa DOT Project TR-481 CTRE Project 02-118
Principal Investigator David J. White
Assistant Professor, Iowa State University
Co-Principal Investigator Sri Sritharan
Assistant Professor, Iowa State University
Research Associate Muhannad Suleiman
Lecturer, Iowa State University
Research Assistants Mohamed Mekkawy and Sudhar Chetlur
Graduate Research Assistants, Iowa State University
Preparation of this report was financed in part through funds provided by the Iowa Department of Transportation
through its research management agreement with the Center for Transportation Research and Education.
Center for Transportation Research and Education
Iowa State University 2901 South Loop Drive, Suite 3100
Ames, IA 50010-8632 Phone: 515-294-8103 Fax: 515-294-0467
www.ctre.iastate.edu
Final Report • January 2005

v
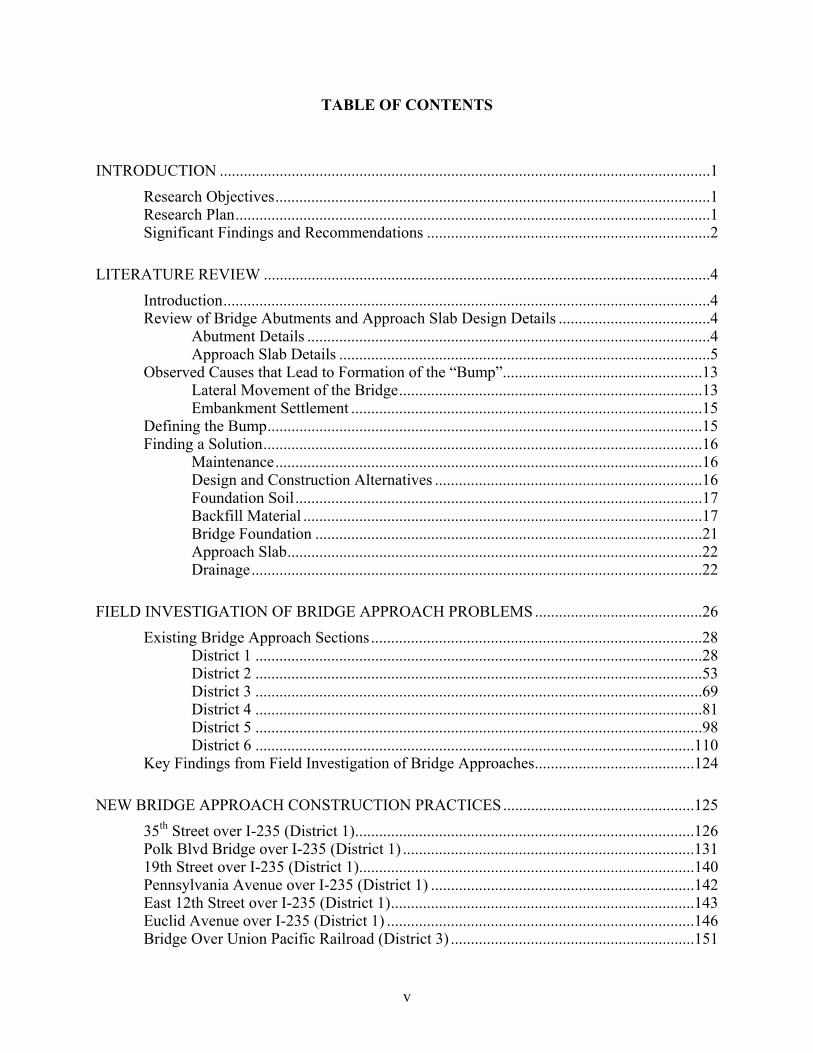
TABLE OF CONTENTS
INTRODUCTION ...........................................................................................................................1 Research Objectives.............................................................................................................1 Research Plan.......................................................................................................................1 Significant Findings and Recommendations .......................................................................2
LITERATURE REVIEW ................................................................................................................4 Introduction..........................................................................................................................4 Review of Bridge Abutments and Approach Slab Design Details ......................................4
Abutment Details .....................................................................................................4 Approach Slab Details .............................................................................................5
Observed Causes that Lead to Formation of the “Bump”..................................................13 Lateral Movement of the Bridge............................................................................13 Embankment Settlement ........................................................................................15
Defining the Bump.............................................................................................................15 Finding a Solution..............................................................................................................16
Maintenance...........................................................................................................16 Design and Construction Alternatives ...................................................................16 Foundation Soil......................................................................................................17 Backfill Material ....................................................................................................17 Bridge Foundation .................................................................................................21 Approach Slab........................................................................................................22 Drainage.................................................................................................................22
FIELD INVESTIGATION OF BRIDGE APPROACH PROBLEMS ..........................................26 Existing Bridge Approach Sections...................................................................................28
District 1 ................................................................................................................28 District 2 ................................................................................................................53 District 3 ................................................................................................................69 District 4 ................................................................................................................81 District 5 ................................................................................................................98 District 6 ..............................................................................................................110
Key Findings from Field Investigation of Bridge Approaches........................................124
NEW BRIDGE APPROACH CONSTRUCTION PRACTICES................................................125 35th Street over I-235 (District 1).....................................................................................126 Polk Blvd Bridge over I-235 (District 1) .........................................................................131 19th Street over I-235 (District 1)....................................................................................140 Pennsylvania Avenue over I-235 (District 1) ..................................................................142 East 12th Street over I-235 (District 1)............................................................................143 Euclid Avenue over I-235 (District 1) .............................................................................146 Bridge Over Union Pacific Railroad (District 3) .............................................................151

vi
Bridge No. 57.6R030 (District 6) ....................................................................................153 Key Findings from New Bridge Construction .................................................................155
MAINTENANCE AND REHABILITATION PRACTICES......................................................156 Bridge at US 218 crossing Railroad (District 5)..............................................................156 US 65 Maintenance Projects............................................................................................158
Bridge no. 7773.0R065 (US 65 over IA 5)..........................................................158 Bridge no. 7774.0L065 (US 65 over Avon Road) ...............................................163 Bridge no. 76.8065 (US 65 over Des Moines River)...........................................164 Bridge no. 7777.0R065 (US 65 over Vandalia Road/Railroad) ..........................172 Bridge no. 7778.1065 (US 65 over SE 6th Ave.) .................................................182 Bridge no. 7779.0065 (US 65 over Rising Sun Dr.)............................................187 Bridge no. 7779.4065 (US 65 over IA 163) ........................................................193 Bridge no. 80.8R065 (US 65 over NE 27th St.) ...................................................198 Bridge no. 7781.2065 (US 65 over 4 mile Creek/ Railroad) ...............................199 Bridge no. 7782.8L065 (US 65 over NE 46th Ave.) ............................................205 Bridge no. 7783.1065 (US 6/Hubbell).................................................................208 Bridge no. 1783.6018...........................................................................................213
Key Findings from Maintenance Practices ......................................................................217
CHARACTERIZATION OF BRIDGE APPROACH SETTLEMENT ......................................218 IRI results for U.S 65 Bridges .........................................................................................218 Bridge Approach Index....................................................................................................220 Rating Criteria..................................................................................................................221 Key Findings from Characterizing Bridge Approach Settlement....................................225
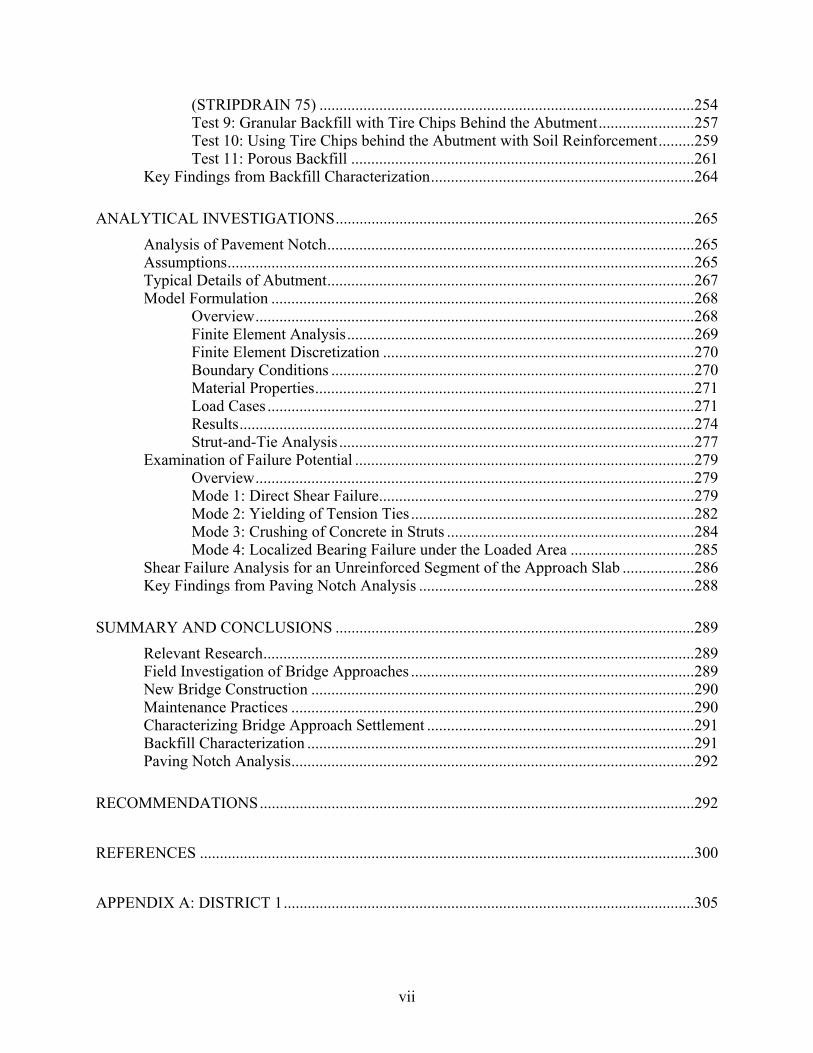
CHARACTERISTICS OF BACKFILL MATERIALS...............................................................226 Comparing Backfill Grain Size Distributions to Average Opening of Drainage Pipe ....226 Collapse Index Test .........................................................................................................227
Experiment Test Setup.........................................................................................227 Test Results..........................................................................................................228
Potential for Soil Erosion.................................................................................................228 Water Management Bridge Approach Model..................................................................232
Objectives ............................................................................................................232 Description of Model ...........................................................................................233 Backfill Materials ................................................................................................235 Test 1: Current Iowa DOT Drainage Detail (3.0% Moisture Content) ...............238 Test 2: Current Iowa DOT Drainage Detail with Saturated Granular Backfill ...240 Test 3: Current Field Practice 1 ...........................................................................242 Test 4: Current Field Practice 2 ...........................................................................244 Test 5: Wrapping the Porous Fill with Geotextile ...............................................246 Test 6: Geotextile around Porous fill and Backfill Reinforcement .....................249 Test 7: Granular Backfill with vertical Geocomposite Drainage System and Backfill Reinforcement (Tenax Ultra-Vera™ Geotextile) ..................................251 Test 8: Vertical Geocomposite Drainage System with Backfill Reinforcement
vii
(STRIPDRAIN 75) ..............................................................................................254 Test 9: Granular Backfill with Tire Chips Behind the Abutment........................257 Test 10: Using Tire Chips behind the Abutment with Soil Reinforcement.........259 Test 11: Porous Backfill ......................................................................................261
Key Findings from Backfill Characterization..................................................................264
ANALYTICAL INVESTIGATIONS..........................................................................................265 Analysis of Pavement Notch............................................................................................265 Assumptions.....................................................................................................................265 Typical Details of Abutment............................................................................................267 Model Formulation ..........................................................................................................268
Overview..............................................................................................................268 Finite Element Analysis.......................................................................................269 Finite Element Discretization ..............................................................................270 Boundary Conditions ...........................................................................................270 Material Properties...............................................................................................271 Load Cases ...........................................................................................................271 Results..................................................................................................................274 Strut-and-Tie Analysis .........................................................................................277
Examination of Failure Potential .....................................................................................279 Overview..............................................................................................................279 Mode 1: Direct Shear Failure...............................................................................279 Mode 2: Yielding of Tension Ties .......................................................................282 Mode 3: Crushing of Concrete in Struts ..............................................................284 Mode 4: Localized Bearing Failure under the Loaded Area ...............................285
Shear Failure Analysis for an Unreinforced Segment of the Approach Slab ..................286 Key Findings from Paving Notch Analysis .....................................................................288
SUMMARY AND CONCLUSIONS ..........................................................................................289 Relevant Research............................................................................................................289 Field Investigation of Bridge Approaches .......................................................................289 New Bridge Construction ................................................................................................290 Maintenance Practices .....................................................................................................290 Characterizing Bridge Approach Settlement ...................................................................291 Backfill Characterization .................................................................................................291 Paving Notch Analysis.....................................................................................................292
RECOMMENDATIONS.............................................................................................................292
REFERENCES ............................................................................................................................300
APPENDIX A: DISTRICT 1.......................................................................................................305
viii
APPENDIX B: DISTRICT 4 .......................................................................................................312
APPENDIX C: BRIDGES UNDER CONSTRUCTION ............................................................321
APPENDIX D: CHARACTERIZATION OF BRIDGE APPROACH SETTLEMENT ............335
APPENDIX E: WATER MANAGEMENT BRIDGE APPROACH SIMULATION MODEL.346

ix
LIST OF FIGURES
Figure 1. The significance of bridge approach settlement (Virginia DOT 2003)............................4 Figure 2. A simplified cross section of a non-integral abutment bridge (Greimann et al. 1987) ....6 Figure 3. A simplified cross section of an integral abutment (Greimann et al. 1987).....................6 Figure 4. Bridge approach connected to bridge deck (Missouri DOT 2003) ..................................9 Figure 5. Bridge approach connected to abutment (Ohio DOT 2003) ............................................9 Figure 6. Bridge approach resting on paving notch (Iowa DOT 2004).........................................10 Figure 7. Problems leading to the existence of the bump (Briaud et al. 1997)..............................13 Figure 8. Movement of bridge structure with temperature (Arsoy et al. 1999).............................15 Figure 9. Two design alternatives to alleviate the differential settlement problem at the bridge
approach using geosynthetic reinforced backfill and geofoam (Horvath 2000)................21 Figure 10. Recommended wingwall detail (Briaud et al. 1997) ....................................................23 Figure 11. Porous fill surrounding subdrain (Iowa DOT) .............................................................23 Figure 12. Granular backfill wrapped with geotextile filter material (Wisconsin DOT 2003) .....24 Figure 13. Geocomposite vertical drain wrapped with filter fabric (Missouri DOT 2003) ..........24 Figure 14. Iowa map with the location of inspected bridges at all Iowa districts .........................26 Figure 15. Schematic diagram of Iowa DOT bridge approach section .........................................27 Figure 16. Schematic diagram summarizing frequent problems observed at several bridge sites 27 Figure 17. Soil erosion of the embankment under the bridge (South end of North bound) ..........30 Figure 18. Deterioration of concrete with visible steel of the girders (South end NBL) ..............30 Figure 19. Differential settlement of 2.5 inches at the end of the abutment wingwall (South end
SBL)...................................................................................................................................31 Figure 20. Elevation of bridge approaches relative to bridge slab ................................................31 Figure 21. Location of test borehole..............................................................................................32 Figure 22. Results of SPT and classification of the embankment soil ..........................................32 Figure 23. Erosion of soil under abutment (North end of NBL) ...................................................33 Figure 24. Settlement of bridge approach slab at the guardrail (South end of NBL)....................33 Figure 25. Erosion between abutment and embankment (North end of SBL)...............................34 Figure 26. Erosion of the soil under the bridge (North end of SBL).............................................34 Figure 27. Erosion of the soil under the bridge (South end of SBL).............................................35 Figure 28. Settlement of embankment under the bridge................................................................36 Figure 29. Differential settlement at the approach slab (North end of NBL)................................36 Figure 30. Cracks and concrete spalling at the expansion joints ...................................................37 Figure 31. Poorly filled expansion joint with recycled tires used as a joint filler (North end
SBL)...................................................................................................................................37 Figure 32. Aggregate used as slope protection at the embankment under the bridge ...................38 Figure 33. Void developed under the approach slab (South end of North bound bridge).............38 Figure 34. Typical expansion joint detail for non-integral abutment bridges ...............................39 Figure 35. Soil erosion of the embankment under the bridge........................................................39 Figure 36. Soil erosion of the embankment under the bridge........................................................40 Figure 37. Weep holes filled with backfill material ......................................................................40 Figure 38. Expansion joint covered after placing the approach slab overlay (EBL).....................41 Figure 39. Deteriorated sealer at the expansion joint ....................................................................41 Figure 40. Profile of bridge approaches relative to bridge deck....................................................42 Figure 41. Change in expansion joint width with respect to thermal variation.............................43 Figure 42. Non-compacted granular backfill behind the bridge abutment ....................................43
x
Figure 43. A view of the bridge showing recently placed asphalt overlay at the bridge approach (East end) ...........................................................................................................................44
Figure 44. Cracking of the asphalt overlay (East end) ..................................................................44 Figure 45. Poorly filled expansion joint (East end) .......................................................................45 Figure 46. Aggregate used as a slope protection at the embankment under the bridge.................45 Figure 47. Poorly sealed expansion joint (East end) .....................................................................46 Figure 48. Transverse cracks of asphalt overlay (East end) ..........................................................46 Figure 49. 4.5 in. void developed under the approach slab (West end).........................................47 Figure 50. Soil erosion at the abutment side (West end) ...............................................................47 Figure 51. Differential settlement of 1.5 in. at the bridge approach (East end of WBL) ..............48 Figure 52. Settlement of the embankment under the bridge and a gap between the abutment and
the embankment (East end WBL)......................................................................................48 Figure 53. Top view of the bridge with the location of removed approach slab for inspection....49 Figure 54. Section of the approach slab cut and ready to be removed ..........................................49 Figure 55. Removing a segment of the bridge approach ...............................................................50 Figure 56. Eight-inch void observed under the approach slab ......................................................50 Figure 57. Layer of fine sand covering the paving notch ..............................................................51 Figure 58. Non-uniform approach slab thickness with 1.5 in. increase over the backfill compared
with the thickness over the paving notch...........................................................................51 Figure 59. Contaminated expansion joint ......................................................................................52 Figure 60. Differential settlement of 3 in. at the south-west corner ..............................................53 Figure 61. Concrete deterioration at the EF joint (West end)........................................................55 Figure 62. Concrete bridge with deep slab and no girders ............................................................55 Figure 63. Erosion of the embankment soil under the bridge........................................................56 Figure 64. Cracked asphalt patch covering the expansion joint ....................................................56 Figure 65. Ponding water at the abutment under the bridge..........................................................57 Figure 66. Profile of Geopier elements supporting bridge approach (Reproduced from Pitt et al.
2003) ..................................................................................................................................58 Figure 67. Settlement of the approach slab supported on Geopier elements (North end of NB
bridge) ................................................................................................................................58 Figure 68. Settlement of the approach slab supported on Geopier elements (South end of NB
bridge) ................................................................................................................................59 Figure 69. Settlement of bridge approach supported on the embankment soil (North end of SB
bridge) ................................................................................................................................59 Figure 70. Settlement of bridge approach supported on embankment soil (South end of SB
bridge) ................................................................................................................................60 Figure 71. Expansion joint with recycled tire filler and a width of 5.5 in. (top view) ..................61 Figure 72. Differential settlement of 1 inch at the bridge approach ..............................................61 Figure 73. Profiles of the approach slab relative to bridge deck (EBL) ........................................62 Figure 74. Profiles of the approach slab relative to bridge deck (WBL).......................................62 Figure 75. Asphalt overlay covering the expansion joint at the bridge approach .........................63 Figure 76. Failure of slope protection due to loss of support (south end NBL) ............................64 Figure 77. Fractured concrete slope protection .............................................................................64 Figure 78. Settlement of the embankment under the bridge and a gap between the embankment
and the abutment ................................................................................................................65 Figure 79. Breakage of bridge deck concrete ................................................................................65 Figure 80. Profile of the approach slab relative to the bridge deck...............................................66 Figure 81. Surface drainage inlet at the bridge approach ..............................................................66

xi
Figure 82. Profile of the bridge approach relative to bridge slab ..................................................67 Figure 83. Cracks in the bridge deck concrete...............................................................................68 Figure 84. Cracking of asphalt overlay (East end) ........................................................................68 Figure 85. Recently replaced bridge approach slab (SBL)............................................................70 Figure 86. Significant damage of the asphalt overlay on the approach slab (NBL)......................71 Figure 87. Wavy approach slab (NBL)..........................................................................................71 Figure 88. Asphalt patch placed over cracked bridge slab (NBL).................................................72 Figure 89. Differential settlement between bridge slab and bridge approach ...............................72 Figure 90. Grout observed on the concrete slope protection overlay indicating that void extended
under the abutment.............................................................................................................73 Figure 91. Differential settlement between the bridge deck and the approach slab ......................73 Figure 92. Uneven settlement of concrete slope protection...........................................................74 Figure 93. Settlement of the embankment slope protection of 6.5 inches.....................................74 Figure 94. Drainage intake before and after debris removal .........................................................75 Figure 95. Erosion caused by runoff water at the approach slab shoulder ....................................75 Figure 96. Severe erosion under the bridge ...................................................................................76 Figure 97. Aggregate slope protection of the embankment under the bridge................................76 Figure 98. Soil erosion of the embankment under the bridge........................................................77 Figure 99. Top view of the strip seal cut short (North bound) ......................................................77 Figure 100. Finger type joint .........................................................................................................78 Figure 101. Aggregate used as embankment slope protection ......................................................79 Figure 102. Pressure relief joints cut at the approach slab ............................................................79 Figure 103. Soil erosion of the embankment under the bridge......................................................80 Figure 104. Drainage design at the end of the bridge in South Dakota.........................................80 Figure 105. Exposed H-pile caused by soil erosion under the abutment.......................................81 Figure 106. Pressure relief joint made by cutting the approach slab.............................................83 Figure 107. Grout pumped under the slope protection cover to fill the void caused by erosion...83 Figure 108. End drain plugged with soil........................................................................................84 Figure 109. Faulting of bridge approach panels ............................................................................84 Figure 110. Drainage outlet could not be located..........................................................................85 Figure 111. Cracking of concrete slope protection........................................................................85 Figure 112. Cracking and settlement of recently replaced approach slab .....................................86 Figure 113. Dry end drain with no indication of water flowing out..............................................86 Figure 114. Loess soil used for the embankment ..........................................................................87 Figure 115. New asphalt-resurfaced approach ..............................................................................87 Figure 116. Sealed concrete slope protection cover ......................................................................88 Figure 117. Cracked girder at the center pier ................................................................................88 Figure 118. Failure at the shoulder of the approach slab (WBL) ..................................................89 Figure 119. Various cracking at the bridge approach (EBL).........................................................89 Figure 120. Surface drain of the bridge deck allowing water to fall on the embankment.............90 Figure 121. Failure of concrete slope protection ...........................................................................90 Figure 122. Exposed H-pile (side view) ........................................................................................90 Figure 123. Concrete cover settlement of 10.5 in..........................................................................91 Figure 124. Ponding water and debris observed at the bottom of the embankment......................91 Figure 125. Asphalt patch placed at the approach slab..................................................................92 Figure 126. Expansion joint 2 inches wide and in good condition................................................92 Figure 127. Settlement of bridge approach....................................................................................93 Figure 128. Concrete spalling at the expansion joint ....................................................................93

xii
Figure 129. Faulting of approach slab panels ................................................................................94 Figure 130. Bridge approach panel removed for replacement.......................................................94 Figure 131. Damage of the approach slab section .........................................................................95 Figure 132. Approach pavement broken before replacement........................................................95 Figure 133. Replacing the bridge approach slab section ...............................................................96 Figure 134. Expansion joint poorly sealed and filled with fines (West end of EBL)....................96 Figure 135. Faulting of bridge approach concrete panels (West end of EBL) ..............................97 Figure 136. Replaced bridge approach slab...................................................................................97 Figure 137. Settlement of approach slab .......................................................................................99 Figure 138. Settlement of approach slab relative to wingwall ......................................................99 Figure 139. Deteriorated expansion joint filler..............................................................................99 Figure 140. Void developed under the approach slab .................................................................100 Figure 141. Differential settlement at the bridge approach (East end)........................................100 Figure 142. Missing and deteriorated filler material at the expansion joint (East end)...............101 Figure 143. Void developed under the approach slab (East end) ................................................101 Figure 144. Erosion around the abutment (East end) ..................................................................102 Figure 145. Differential settlement at recently replaced bridge approach...................................102 Figure 146. Lateral movement of the abutment (Top view)........................................................103 Figure 147. Bridge embankment prior to placing the new overlay .............................................103 Figure 148. Side view of the strip seal which was cut short (South end of SBL) .......................104 Figure 149. Perforated drain tile filled with soil (South end of SBL) .........................................104 Figure 150. Erosion of the embankment under the bridge (North end of NBL) .........................105 Figure 151. Deteriorated flexible foam which was used as joint filler (North end of NBL).......105 Figure 152. Grouting under the approach slab (South end of NBL) ...........................................106 Figure 153. Poor performing resurfaced bridge approach (West end of WBL) ..........................106 Figure 154. Transverse cracking of asphalt overlay (West end of WBL) ...................................107 Figure 155. Erosion of the embankment soil (West end of WBL) ..............................................107 Figure 156. Subdrain outlet blocked with soil (West end of WBL) ............................................108 Figure 157. Missing filler material exposing the pavement notch (East end of WBL)...............108 Figure 158. Erosion between the embankment under the bridge and the abutment, and the rocks
used to control erosion (East end of WBL) .....................................................................109 Figure 159. Differential settlement at the bridge approach (South bound) .................................111 Figure 160. Wet loess soil observed at the embankment under the bridge .................................111 Figure 161. Approach slab asphalt overlay .................................................................................112 Figure 162. Grout seeping from under the concrete cover ..........................................................113 Figure 163. Grout seeping from the bottom of the embankment.................................................113 Figure 164. Drilling at the approach slab shoulder indicating 2 in. deep void............................114 Figure 165. Differential settlement at approach slab...................................................................114 Figure 166. Faulting of approach slab concrete panels ...............................................................115 Figure 167. Flexible foam used as joint filler ..............................................................................115 Figure 168. Void created by erosion and settlement after grouting.............................................116 Figure 169. Cracking of the concrete slope protection overlay...................................................116 Figure 170. Gap between abutment and embankment.................................................................117 Figure 171. Concrete spalling and cracking at the expansion joint .............................................117 Figure 172. Soil erosion of the embankment under the bridge....................................................118 Figure 173. Water ponding at the embankment (Top view)........................................................118 Figure 174. Rocks and pillows used for embankment stabilization ............................................119 Figure 175. Severe damage of concrete slope protection due to erosion ....................................119
xiii
Figure 176. Transverse and map cracking at the approach slab ..................................................120 Figure 177. Deterioration of asphalt overlay at bridge approach ................................................120 Figure 178. Uneven concrete slope protection ............................................................................121 Figure 179. Soil erosion around the abutment .............................................................................121 Figure 180. Erosion under the concrete slope protection (Side view).........................................122 Figure 181. Void created under bridge approach exposing H-piles (Side view).........................122 Figure 182. Void developed under the approach slab .................................................................123 Figure 183. Girders under construction (NBL) ...........................................................................126 Figure 184. Granular Backfill used behind the abutment ............................................................127 Figure 185. Porous fill placed around the drainage pipe .............................................................127 Figure 186. Subdrain outlet at the bottom of the embankment ...................................................128 Figure 187. Subdrain along the side of the abutment ..................................................................128 Figure 188. Air Permeability Test performed at porous backfill.................................................129 Figure 189. Gradation of granular backfill material used at the north end; classified as SP.......129 Figure 190. Gradation of porous backfill material used at the south end; classified as GP ........130 Figure 191. Dry density–moisture content relationship of granular backfill used at the North end.
Vibrating table tests (ASTM D4253-00). ........................................................................130 Figure 192. Construction of the new northbound bridge.............................................................132 Figure 193. Installation of the sheet piles (NBL) ........................................................................132 Figure 194. Concrete spalling at the abutment (SBL) .................................................................133 Figure 195. Installation of H-Piles (North end of NBL)..............................................................133 Figure 196. Construction of retaining wall (South end of NBL).................................................134 Figure 197. Sand used as granular backfill material....................................................................134 Figure 198. No porous fill surrounding the subdrain (North end NBL)......................................135 Figure 199. H-piles being driven .................................................................................................135 Figure 200. Construction of the retaining wall (South end of SBL)............................................136 Figure 201. Compaction of retaining wall fill material (South end of SBL)...............................136 Figure 202. DCP and Nuclear gauge tests (South end of NBL) ..................................................137 Figure 203. DCP test results (Location 1 North end of NBL).....................................................137 Figure 204. DCP test results (Location 2 North end of NBL).....................................................138 Figure 205. DCP test results (Location 3 North end of NBL).....................................................138 Figure 206. Gradation of the granular backfill material classified as SP ....................................139 Figure 207. Dry density – moisture relationship for backfill material. Vibrating table tests
(ASTM D4253-00)...........................................................................................................139 Figure 208. Cracks at asphalt approach with visible differential settlement ...............................140 Figure 209. Construction of steel girders and backwall ..............................................................141 Figure 210. Gradation of granular backfill classified as SP ........................................................141 Figure 211. Density – moisture relationship for granular backfill. Vibrating table tests (ASTM
D4253-00). .......................................................................................................................142 Figure 212. Construction of center pier .......................................................................................142 Figure 213. Embankment concrete slope protection ...................................................................143 Figure 214. Subdrain outlet at the bottom of the embankment ...................................................143 Figure 215. Construction of backwall and center pier.................................................................144 Figure 216. Construction of bridge slab (NBL)...........................................................................144 Figure 217. Abutment and paving notch rebar tied with reinforcement from the backwall........145 Figure 218. Gradation of granular backfill classified as SP ........................................................145 Figure 219. Relative density–moisture relationship for granular backfill. Vibrating table tests
(ASTM D4253-00)...........................................................................................................146

xiv
Figure 220. Construction of bridge slab ......................................................................................147 Figure 221. Construction of slope protection at the embankment...............................................147 Figure 222. Construction of the southbound bridge ....................................................................148 Figure 223. End drain outlet filled with soil ................................................................................148 Figure 224. Reinforcement for the bridge backwall ....................................................................149 Figure 225. H-pile embedded in the bridge backwall..................................................................149 Figure 226. Abutment reinforcement and backfill placed at the northbound approach slab.......150 Figure 227. A closer image of the poorly-placed granular backfill (NBL) .................................150 Figure 228. Constructed bridge backwall with visible subdrain surrounded by porous backfill 151 Figure 229. Construction of embankment slope protection.........................................................151 Figure 230. Poorly placed granular backfill ................................................................................152 Figure 231. Granular backfill surrounding the subdrain..............................................................152 Figure 232. Poor construction of bridge paving notch ................................................................153 Figure 233. Gradation of granular backfill classified as SP ........................................................153 Figure 234. Declined paving notch..............................................................................................154 Figure 235. Gradation of granular backfill classified as SP ........................................................154 Figure 236. Grout pumped under existing approach (South end of SBL)...................................156 Figure 237. Construction of new bridge approach (South end of NBL) .....................................157 Figure 238. Abutment reinforcement (North end of NBL)..........................................................157 Figure 239. Void under approach slab (North end of SBL) ........................................................158 Figure 240. Differential settlement of 1 inch between the bridge slab and the bridge approach
(South end of SBL) ..........................................................................................................159 Figure 241. Aggregate placed at the sides of the abutment to control erosion (South end of
SBL).................................................................................................................................159 Figure 242. End drain in a satisfactory condition (South end of SBL) .......................................160 Figure 243. Profiles of the approach slab relative to bridge slab (SBL) .....................................161 Figure 244. Snake camera used to inspect subdrains...................................................................161 Figure 245. Control of snake camera...........................................................................................162 Figure 246. Subdrain prior to insertion of snake camera (North end of NBL)............................162 Figure 247. Snake camera covered with mud (North end of NBL).............................................163 Figure 248. Aggregate slope protection at the bridge embankment (North end of NBL)...........164 Figure 249. Profile of the bridge approach relative to the bridge slab (South end of SBL)........164 Figure 250. Rocks placed at the abutment side to prevent erosion (North end of NBL) ............166 Figure 251. Rocks placed at the embankment under the bridge to prevent further erosion (South
end of NBL) .....................................................................................................................166 Figure 252. Settlement of approach slab (North end NBL).........................................................167 Figure 253. Profiles of the approach slab relative to bridge slab (NBL).....................................167 Figure 254. Elevation of the bridge approach relative to the bridge slab (SBL).........................168 Figure 255. Location of holes drilled on the bridge approach slab .............................................169 Figure 256. Holes drilled on the approach slab ...........................................................................169 Figure 257. Holes drilled for injecting expansive material under the approach..........................170 Figure 258. Dial gauge to measure change in approach slab elevation.......................................170 Figure 259. Injecting high-density polyurethane under the approach slab..................................171 Figure 260. Steady injection until material leaks out of hole ......................................................171 Figure 261. Elevation of approach relative to expansion joint before and after pumping ..........172 Figure 262. Differential settlement at the bridge approach (North end of NBL) ........................173 Figure 263. A 6 in. void developed under the approach slab (North end of NBL) .....................173 Figure 264. A 10 in. void developed under the approach slab (South end of NBL) ...................174

xv
Figure 265. Gap between the approach slab and the wingwall (South end of NBL) ..................174 Figure 266. Deteriorated flexible foam used as joint filler (South end of NBL).........................175 Figure 267. Erosion along the abutment sides (South end of NBL)............................................175 Figure 268. Settlement of the embankment under the bridge (South end of NBL).....................176 Figure 269. Top view showing the 1 in. gap between the abutment and concrete slope cover
(South end of NBL) .........................................................................................................176 Figure 270. Profile of the bridge approach relative to bridge slab (NBL) ..................................177 Figure 271. Replacement of approach slabs at the south bound..................................................178 Figure 272. A 9 in. void developed under the left lane approach slab (North end of SBL)........179 Figure 273. Shearing of paving notch (North end of SBL) .........................................................179 Figure 274. The approach slab resting on 0.5 in. of the paving notch (north end of SBL) .........180 Figure 275. Differential settlement between the bridge slab and the bridge approach (South end
of SBL).............................................................................................................................180 Figure 276. Approach slab resting on 1 inch of the paving notch, and a 10-inch-void developed
under the approach slab (South end of SBL)...................................................................181 Figure 277. Compacted special backfill (South end of SBL) ......................................................181 Figure 278. Results of DCP tests conducted on the old backfill material (North end of SBL)...182 Figure 279. DCP test conducted on the replaced special backfill (South end of SBL) ...............182 Figure 280. Settlement of the embankment under the bridge (North end of NBL).....................183 Figure 281. Differential settlement of the approach slab (North end of SBL) ............................183 Figure 282. A 4-inch-void under the approach slab estimated by measuring the distance the core
dropped (North end of SBL, center line) .........................................................................184 Figure 283. A 3-inch-void under the approach slab estimated by measuring the distance the core
dropped (North end of SBL, edge line) ...........................................................................185 Figure 284. Pavement thickness determined from measuring the length of the core (North end of
SBL, edge line) ................................................................................................................185 Figure 285. Profile of the bridge approach relative to bridge slab (NBL) ..................................186 Figure 286. Profile of the bridge approach relative to bridge slab (SBL) ...................................186 Figure 287. Differential settlement between the bridge slab and the bridge approach (North end
of NBL)............................................................................................................................187 Figure 288. Settlement of the embankment under the bridge (NBL) ..........................................187 Figure 289. A 1.5 inch gap between abutment face and slope protection (South end of NBL) ..188 Figure 290. Rodent nest blocking the subdrain at 5 feet from the outlet.....................................188 Figure 291. Iowa DOT snake camera inserted inside the subdrain .............................................189 Figure 292. Replacement of the right lane approach slab (South end of SBL) ...........................190 Figure 293. Tearing down the old pavement notch (South end of SBL).....................................190 Figure 294. A void developed under the left lane approach slab which was 1.5-feet-deep at the
bridge abutment (South end of SBL) ...............................................................................191 Figure 295. Installing a drainage system under the right lane approach slab..............................191 Figure 296. Results of DCP test conducted on special backfill material before excavation (South
end of SBL)......................................................................................................................192 Figure 297. Results of DCP test conducted on special backfill material after replacement (South
end of SBL)......................................................................................................................192 Figure 298. Differential settlement at the bridge approach (South end of NBL) ........................194 Figure 299. Concrete spalling and cracking of asphalt overlay at the expansion joint (South end
of NBL)............................................................................................................................194 Figure 300. Settlement of the embankment at distance of 3.5 in. (South end of NBL)...............195 Figure 301. A 4 in. differential settlement at the bridge approach (North end of SBL)..............195

xvi
Figure 302. Recycled tires used as joint filler .............................................................................196 Figure 303. A 9.5 in. void under the approach slab estimated by measuring the distance the core
dropped (North end of SBL) ............................................................................................196 Figure 304. Profile of the bridge approach relative to bridge slab (NBL) ..................................197 Figure 305. Profile of the bridge approach relative to bridge slab (SBL) ...................................197 Figure 306. Subdrain outlet, located at the bottom of the embankment, blocked by soil debris.198 Figure 307. Transverse cracks at the bridge approach.................................................................199 Figure 308. Profile of the bridge approach relative to bridge slab (North end of NBL) .............199 Figure 309. Severe cracking at the bridge approach pavement (North end of NBL) ..................200 Figure 310. Damaged end drain (North end of NBL)..................................................................201 Figure 311. Settlement of bridge approach (South end of NBL).................................................201 Figure 312. Differential settlement at the bridge approach (South end of NBL) ........................202 Figure 313. Coring at bridge approach (NBL) ............................................................................203 Figure 314. Measuring the void under the approach slab (North end of SBL) ...........................203 Figure 315. Expanding foam placed in the core hole of the approach slab (NBL) .....................204 Figure 316. Profile of the bridge approach relative to bridge slab (NBL) ..................................204 Figure 317. Profile of the bridge approach relative to bridge slab (SBL) ...................................205 Figure 318. Settlement of bridge approach (North end of SBL) .................................................206 Figure 319. Transverse cracking at the bridge approach (North end of SBL).............................206 Figure 320. Bridge approach settlement (South end of SBL)......................................................207 Figure 321. Bridge embankment in a satisfactory condition .......................................................207 Figure 322. Profile of the bridge approach relative to bridge slab (SBL) ...................................208 Figure 323. Asphalt overlay placed to compensate for the differential settlement (North of end
NBL) ................................................................................................................................209 Figure 324. A 2-inch gap formed between the approach slab and the wingwall due to settlement
of the approach slab (North end of NBL) ........................................................................209 Figure 325. Lateral movement of the abutment away from the bridge embankment caused by
expansion of the bridge structure (North end of NBL)....................................................210 Figure 326. Differential settlement at the bridge approach (South end of NBL) ........................210 Figure 327. Settlement of embankment at distance of 3 inches ..................................................211 Figure 328. Elevation of the bridge approach relative to the bridge slab (NBL) ........................212 Figure 329. Elevation of the bridge approach relative to the bridge slab (SBL).........................212 Figure 330. Differential settlement between the bridge approach and the approach slab (West end
of EBL) ............................................................................................................................213 Figure 331. Deterioration of the expansion joint sealer (West end of EBL) ...............................214 Figure 332. Settlement of the bridge embankment (West end of EBL) ......................................214 Figure 333. Top view showing a gap between the bridge embankment and the bridge abutment
(West end of EBL) ...........................................................................................................215 Figure 334. Differential settlement between the bridge approach and the approach slab (East end
of EBL) ............................................................................................................................215 Figure 335. Poorly sealed expansion joint with concrete spalling (East end of EBL) ................216 Figure 336. Approach slabs elevations before and after injecting the expansive polyurethane
(EBL) ...............................................................................................................................216 Figure 337. IRI graph; Bridge no. 7777.0065 SBL .....................................................................219 Figure 338. Increase of International Roughness Index with time; Bridge no. 7773.0065 NBL219 Figure 339. A frequency plot for slopes calculated from approach slab profiles........................220 Figure 340. Elevation of two approach slabs relative to bridge; Bridge no. 7777.0065 NBL ....221 Figure 341. Rating system of bridge approach performance.......................................................223

xvii
Figure 342. Perforated drainage pipe used around Iowa bridges ................................................226 Figure 343. Assembled apparatus to measure collapse index .....................................................227 Figure 344. Gradation of tested granular backfill materials compared with the gradation of
samples collected at four under-construction bridges......................................................229 Figure 345. Collapse index – moisture content relationship for granular backfill material ........229 Figure 346. Gradation curve for porous backfill .........................................................................230 Figure 347. Range of most erodible soils (Reproduced from Briaud et al. 1997).......................230 Figure 348. Iowa DOT granular backfill gradation requirement compared with the range of most
erodible soils ....................................................................................................................231 Figure 349. Granular backfill obtained from bridge sites compared to the range of most erodible
soils ..................................................................................................................................231 Figure 350. Porous backfill (Pea Gravel) compared to the range of most erodible soils ............232 Figure 351. Schematic for the assembled water Management Bridge Approach Model ............234 Figure 352. Water Management Bridge approach Model ...........................................................234 Figure 353. Dimension of the abutment used in the model .........................................................235 Figure 354. Grain size distribution for granular backfill .............................................................236 Figure 355. Grain size distribution for porous fill .......................................................................236 Figure 356. Grain size distribution for special backfill ...............................................................237 Figure 357. Grain size distribution for tire chips.........................................................................237 Figure 358. Schematic diagram of Test 1 representing Iowa DOT current design .....................238 Figure 359. Geogrid placed between the granular and special backfill.......................................239 Figure 360. Level of bridge approach before the test ..................................................................240 Figure 361. Level of approach after the test ................................................................................240 Figure 362. Placing special backfill over geogrid .......................................................................241 Figure 363. Level of approach slab before the test......................................................................242 Figure 364. Level of approach slab after the test.........................................................................242 Figure 365. Granular backfill placed behind the abutment .........................................................243 Figure 366. Level of bridge approach before the test ..................................................................244 Figure 367. Level of approach slab after the test.........................................................................244 Figure 368. Porous fill placed around the subdrain .....................................................................245 Figure 369. Level of approach slab before the test......................................................................246 Figure 370. Level of approach slab after test...............................................................................246 Figure 371. Geotextile fabric wrapped around porous fill...........................................................247 Figure 372. Level of approach before the test .............................................................................248 Figure 373. Level of approach after the test ................................................................................248 Figure 374. A void 2.5 in. deep and 9 in. long developed under the approach slab....................248 Figure 375. Schematic diagram of Test 6 with mechanically stabilized backfill behind the
abutment and porous fill wrapped with geotextiles around the drainage pipe ................249 Figure 376. Placing backfill reinforcement .................................................................................250 Figure 377. A void that is 1.75 in. deep and 6.5 in. long developed under the approach slab ....251 Figure 378. Level of approach slab after the test.........................................................................251 Figure 379. Attaching the vertical drain to the abutment (Side view).........................................252 Figure 380. Schematic diagram of Test 7 drainage details..........................................................252 Figure 381. Level of approach slab before the test......................................................................253 Figure 382. Level of approach slab after the test.........................................................................254 Figure 383. Void developed under the approach slab .................................................................254 Figure 384. Attaching the geocomposite drain to the abutment ..................................................255 Figure 385. Level of approach slab before the test......................................................................256

xviii
Figure 386. Level of approach slab after the test.........................................................................256 Figure 387. Void developed under the approach slab .................................................................256 Figure 388. Drainage detail for Test 9.........................................................................................257 Figure 389. Schematic diagram of Test 9 using tire chips behind the abutment .........................257 Figure 390. Level of approach slab before the test......................................................................258 Figure 391. Level of approach slab after the test.........................................................................259 Figure 392. Using tire chips with soil reinforcement ..................................................................259 Figure 393. Foam board separating tire chips and granular backfill ...........................................260 Figure 394. Level of approach slab before the test......................................................................261 Figure 395. Level of approach slab after the test.........................................................................261 Figure 396. Drainage detail for Test 11.......................................................................................262 Figure 397. Placing porous fill behind the abutment...................................................................262 Figure 398. Level of approach slab before the test......................................................................263 Figure 399. Level of approach slab after test...............................................................................264 Figure 400. Assumed position of wheel loads on the approach slab...........................................266 Figure 401. Abutment dimensions and reinforcement details used for a typical two-lane non-
integral bridge in Iowa.....................................................................................................268 Figure 402. Four-node rectangular plane element known as PLANE42 in ANSYS...................270 Figure 403. Finite element model of the pavement notch region ................................................270 Figure 404. Static load cases........................................................................................................273 Figure 405. Dispersion of a wheel load through the approach slab.............................................273 Figure 406 Vertical direction strains in the pavement notch region corresponding to Static Load
Case 2...............................................................................................................................275 Figure 407. Principal stresses in the pavement notch region corresponding to Static Load Case
2........................................................................................................................................276 Figure 408. Vector plot showing the direction of the principal compressive and tensile stresses
corresponding to Static Load Case 2 ...............................................................................276 Figure 409. Geometry of the strut-and-tie model developed for the pavement notch region from
the finite element analysis results ....................................................................................277 Figure 410. Strut and tie forces and the corresponding stress ratios obtained from CAST for the
load condition in shown in Figure 408 ............................................................................278 Figure 411. Direct shear failure – Case 1 ....................................................................................280 Figure 412. Direct shear failure – Case 2 ....................................................................................280 Figure 413. Inaccurate placement of reinforcing steel in the paving notch and the approach slab
(Brakke 2003) ..................................................................................................................287 Figure A1. Rocks used to decrease erosion at the embankment..................................................308 Figure A2. Void developed under approach slab ........................................................................308 Figure A3. Differential settlement ...............................................................................................309 Figure A4. Soil erosion at the bridge embankment .....................................................................309 Figure A5. Cracks near the expansion joint.................................................................................310 Figure A6. Void developed under the approach slab...................................................................310 Figure A7. Water flowing down the bridge abutment .................................................................311 Figure A8. Removed section of the approach slab ......................................................................311 Figure B1. Gradation of approach slab base material (West end of West bound) ......................312 Figure B2. Change of CBR with depth; Location (1) West end of west bound ..........................313 Figure B3. Change of CBR with depth; Location (2) West end of west bound ..........................314 Figure B4. Change of CBR with depth; Location (3) West end of west bound ..........................315 Figure B5. Grain size distribution of base material (East end of west bound) ............................316

xix
Figure B6. Change of CBR with depth; Location (1) East end of west bound ...........................317 Figure B7. Change of CBR with depth; Location (2) East end of west bound ...........................318 Figure B8. Change of CBR with depth; Location (3) East end of west bound ...........................319 Figure B9. Grain size distribution of base material (East end of east bound) .............................320 Figure D1. IRI graph; Bridge no. 7773.0065 SBL ......................................................................335 Figure D2. IRI graph; Bridge no. 7774.L065 SBL......................................................................335 Figure D3. IRI graph; Bridge no. 7776.8065 NBL......................................................................336 Figure D4. IRI graph; Bridge no. 7776.8065 SBL ......................................................................336 Figure D5. IRI graph; Bridge no. 7777.0065 NBL......................................................................337 Figure D6. IRI graph; Bridge no. 7777.0065 SBL ......................................................................337 Figure D7. IRI graph; Bridge no. 7777.3065 SBL ......................................................................338 Figure D8. IRI graph; Bridge no. 7778.1065 NBL......................................................................338 Figure D9.IRI graph; Bridge no. 7778.1065 SBL .......................................................................339 Figure D10. IRI graph; Bridge no. 7779.0065 NBL....................................................................339 Figure D11. IRI graph; Bridge no. 7779.0065 SBL ....................................................................340 Figure D12. IRI graph; Bridge no. 7779.4065 NBL....................................................................340 Figure D13. IRI graph; Bridge no. 7779.4065 SBL ....................................................................341 Figure D14. IRI graph; Bridge no. 7780.8 NBL..........................................................................341 Figure D15. IRI graph; Bridge no. 7781.2065 NBL....................................................................342 Figure D16. IRI graph; Bridge no. 7781.2065 SBL ....................................................................342 Figure D17. IRI graph; Bridge no. 7782.8L065 SBL..................................................................343 Figure D18. IRI graph; Bridge no. 7783.1065 NBL....................................................................343 Figure D19. IRI graph; Bridge no. 7783.1065 SBL ....................................................................344 Figure D20. IRI graph; Bridge no. 9193.2R005 NBL .................................................................344

xx
LIST OF TABLES
Table 1. Typical approach slab dimensions used by various DOTs (Hoppe 1991).........................8 Table 2. Connection between approach slab and bridge (Hoppe 1999) ........................................11 Table 3. Approach slab-abutment connection and joint width details...........................................12 Table 4. Iowa DOT backfill gradation...........................................................................................18 Table 5. Backfill gradation of different DOTs ..............................................................................19 Table 6. Compaction requirements for various states....................................................................20 Table 7. Drainage methods used by various states ........................................................................25 Table 8. Summary of observed problems in district 1 ...................................................................29 Table 9. Summary of major problems observed at district 2.........................................................54 Table 10. Summary of major problems observed at district 3.......................................................69 Table 11. Summary of major problems observed at district 4.......................................................82 Table 12. Summary of major problems observed at district 5.......................................................98 Table 13. Summary of major problems observed at district 6.....................................................110 Table 14. Summary of major problems and tests conducted at bridges under construction .......125 Table 15. Properties of backfill material at both ends of the SBL...............................................129 Table 16. Voids measured under the approach slabs...................................................................177 Table 17. Voids measured under approach from core samples ...................................................184 Table 18. Measurements of the void size, paving notch, and pavement thickness at the
Southbound lane ..............................................................................................................196 Table 19. Voids measured under approach..................................................................................202 Table 20. Voids measured under approach slab ..........................................................................207 Table 21. Approach slab rating system developed by LTRC (Das et al. 1999) ..........................218 Table 22. Summary of data used to rate the performance of approach slabs ..............................222 Table 23. Highway U.S 65 approach slabs ratings using the developed rating system...............224 Table 24. Comparing backfill grain sizes to the average pipe opening.......................................226 Table 25. Summary of Test 1 results ...........................................................................................239 Table 26 . Summary of Test 2 results ..........................................................................................241 Table 27. Summary of Test 3 results ...........................................................................................243 Table 28. Summary of Test 4 results ...........................................................................................245 Table 29. Summary of Test 5 results ...........................................................................................247 Table 30. Summary of Test 6 results ...........................................................................................250 Table 31. Summary of Test 7 results ...........................................................................................253 Table 32. Summary of Test 8 results ...........................................................................................255 Table 33. Summary of Test 9 results ...........................................................................................258 Table 34. Summary of Test 10 results .........................................................................................260 Table 35. Summary of Test 11 results .........................................................................................263 Table 36. Forces in struts and ties of the pavement notch region in kips....................................278 Table 37. Comparison of capacities and demands for the direct shear failure mode under the
critical static and dynamic load cases ..............................................................................282 Table 38. Comparisons of the demands capacities of ties ...........................................................283 Table 39. Comparisons of the demands and capacities of struts .................................................285 Table 40. Comparisons of demands versus capacities to examine the bearing failure potential in
the pavement notch ..........................................................................................................286 Table 41. Comparison of shear capacities with demands for an unreinforced concrete segment at
the end of the approach slab ............................................................................................287

xxi
Table A1. Grain size distribution from 3.5 to 5.0 ft. ...................................................................305 Table A2. Grain size distribution from 8.5 to 10 ft. ....................................................................305 Table A3. Grain size distribution from 13.5 to 15 ft. ..................................................................306 Table A4. Grain size distribution from 33.5 to 35 ft. ..................................................................306 Table A5. Grain size distribution from 38.5 to 40 ft. ..................................................................306 Table A6. Grain size distribution from 43.5 to 45 ft. ..................................................................307 Table A7. Variation of moisture content with depth ...................................................................307 Table B1. Grain size distribution for base material (West end of west bound)...........................312 Table B2. DCP results; Location (1) West end of west bound....................................................313 Table B3. DCP results; Location (2) West end of west bound....................................................314 Table B4. DCP results; Location (3) West end of west bound....................................................314 Table B5. Grain size distribution of base material (East end of west bound) .............................315 Table B6. DCP results; Location (1) East end of west bound .....................................................316 Table B7. DCP results; Location (2) East end of west bound .....................................................317 Table B8. DCP results; Location (3) East end of west bound .....................................................318 Table B9. Grain size distribution of base material (East end of east bound) ..............................319 Table C1. Grain size distribution of granular backfill; Bridge on 35th St. over I-235 (North end of
south bound) ....................................................................................................................321 Table C2. Dry density – Moisture content relationship of granular backfill; Bridge on 35th St.
over I-235 (North end of south bound) ............................................................................321 Table C3. Results of Helium Pycnometer test on granular backfill; Bridge on 35th St. over I-235
(North end of south bound)..............................................................................................322 Table C4. Grain size distribution of granular backfill; Bridge on 35th St. over I-235 (South end of
south bound) ....................................................................................................................322 Table C5. Dry unit weight – moisture content relationship for Porous backfill; Bridge on 35th St.
over I-235 (South end of south bound) ............................................................................323 Table C6. Results of Helium Pycnometer Test for Porous backfill; Bridge on 35th St. over I-235
(South end of south bound)..............................................................................................323 Table C7. Field moisture content for both bound; Bridge on 35th St. over I-235........................324 Table C8. Air permeability test results ........................................................................................324 Table C9. Grain size distribution of the granular backfill; Bridge on Polk Blvd. crossing I-235325 Table C10. Dry density – moisture content relationship for granular backfill; Bridge on Polk
Blvd. crossing I-235.........................................................................................................325 Table C 11. Results of Helium Pycnometer Test on granular backfill; Bridge on Polk Blvd.
crossing I-235 ..................................................................................................................326 Table C12. DCP results on granular backfill Location (1); Bridge at Polk Blvd. crossing I-235326 Table C13. DCP results on granular backfill Location (2); Bridge at Polk Blvd. crossing I-235327 Table C14. DCP results on granular backfill Location (3); Bridge on Polk Blvd. crossing I-235327 Table C15. Results of Nuclear gauge test on granular backfill; Bridge on Polk Blvd. crossing I-
235....................................................................................................................................327 Table C16. Grain size distribution for granular backfill; Bridge on 19th St. crossing I-235 .......328 Table C17. Dry density- moisture content relationship for granular backfill; Bridge on 19th St.
crossing I-235 ..................................................................................................................328 Table C18. Results of Helium Pycnometer Test on Granular backfill; Bridge on 19th St. crossing
I-235.................................................................................................................................329 Table C19. Grain size distribution for granular backfill; Bridge on E 12th St.. crossing I-235...329 Table C20. Dry density-moisture content relationship for granular backfill; Bridge on E 12th St.
crossing I-235 ..................................................................................................................330
xxii
Table C21. Results of Helium Pycnometer Test on granular backfill; Bridge on E 12th St. crossing I-235 ..................................................................................................................330
Table C22. Results of field moisture content of granular backfill; Bridge over Union Pacific Road .................................................................................................................................331
Table C23. Results of Permeability test conducted on granular backfill; Bridge over Union Pacific Rd.........................................................................................................................331
Table C24. Grain size distribution for granular backfill; Bridge over Union Pacific Rd............332 Table C 25. Grain size distribution for granular backfill; Bridge no. 57.6R030.........................332 Table C26. Grain size distribution for granular material used in collapse index test..................333 Table C27. Dry density-moisture content relationship for granular material used in collapse
index test ..........................................................................................................................333 Table C28. Grain size distribution for Porous material used in collapse index test ....................334 Table C29. Dry density-moisture content relationship for porous fill used in collapse index test334 Table D1. Summary of bridge approach slopes...........................................................................345 Table E1. CONTECH C-60NW Nonwoven Geotextile specifications .......................................346 Table E2. CONTECH C-80NW Nonwoven Geotextile specifications .......................................347 Table E3. Structural geogrid BX1100 specification....................................................................347 Table E4. Tenax Ultra-Vera™ Geotextile specifications ............................................................348 Table E5. STRIPDRAIN 75 specifications .................................................................................349

xxiii
ACKNOWLEDGMENTS
The Iowa Department of Transportation and the Iowa Highway Research Board sponsored this study under contract TR-481. Numerous people assisted the authors in identifying bridges with approach settlement problems for investigation. The technical steering committee helped refine the research tasks and provided suggestions. The authors would like to thank Iowa DOT personnel and contractors who helped us throughout the project.
Input and review comments were provided from the Technical Steering Committee members: Bruce Brakke, Bob Sperry, Wayne Sunday, Norm McDonald Gary Novey, David Heer, Dean Bierwagen, Mike Kennerly, Mike Laviolette, Bob Stanley, Robert Cramer, and Mike Manatt. These members were very helpful in directing the research tasks for this project. In addition, assistance was provided from Mark Dunn, Bob Younie, Will Stein, Kenneth Dunker, James Berger, Mark Callahan, Dwight Rorholm, Brian Morrissey, Mark Carter, Denny Howe, Wes Musgrove, Mike Pagel and Mary Thompson. Their assistance in coordinating field visits is greatly appreciated. Matt McCants with Contech Construction Products, Inc. provided the geocomposite drainage materials used in the laboratory model testing.
The finding, opinion, recommendations, and conclusions expressed in this report are those of the authors and do not necessarily reflect the views of the sponsor and administrations.


xxv
EXECUTIVE SUMMARY
Bridge approach settlement and the formation of the bump is a common problem in Iowa that draws upon considerable resources for maintenance and creates a negative perception in the minds of transportation users. This research study was undertaken to investigate bridge approach problems identified by Iowa DOT personnel and develop new concepts for design, construction, and maintenance that will reduce this costly problem. The research report includes (1) a detailed literature review with documentation of design, construction and maintenance practices used by several state DOTs; (2) field inspection observations and documentation of existing bridge approach problems and construction problems; (3) characterization of the bridge approach pavement problems using elevation profiles and International Roughness Index (IRI) measurements; (4) characterization of backfill materials used behind bridge abutments with emphasis on compaction and erosion properties; and (5) analytical structural investigations on potential failure of the paving notch region and approach slab. The results of each topic are summarized in greater detail below. Relevant Literature Bridge approach settlement can be caused by a number of factors including: (1) seasonal temperature changes causing horizontal movements of integral abutments; (2) loss of backfill material by erosion; (3) poor construction practices (i.e., poor joint and drainage system construction, poor compaction of backfill materials, etc.); (4) settlement of the foundation soils; and (5) high traffic loads. The two primary causes reported in the literature are lateral movement of the bridge and the embankment foundation settlement. Seasonal ambient temperature cycles between summer and winter and the corresponding thermal movements of the bridge superstructure and abutment in case of integral bridges can displace the soil behind the abutment and lead to void development under the approach slab. With water infiltration into the void, erosion and loss of backfill material occur. To prevent this, researchers and state DOTs recommended various design alternatives as follows:
1. Connect the approach slab to the bridge, reduce the expansion joint widths, and use various alternative joint sealers. An investigation of the practices in 37 states reveals that 30% tie the bridge approach slab to the bridge abutment for integral abutments and about 60% for non-integral abutments. Current Iowa DOT practice is to connect the approach slab to the abutment for non-integral abutment bridges only. Connecting the bridge approach to the abutment almost completely eliminates seasonal joint width changes. Minimizing joint width has the added benefit of reducing a built-in bump and reduces water infiltration through the joint into the approach pavement backfill. Joint widths used in 12 of 37 states vary from about 0.5 inches to 2 inches. The majority of existing integral abutment bridges in Iowa has a nominal 4 inch expansion joint. (Starting in 2004 bridges with integral abutments will have a 2 inch joint). In addition to varying joint widths, other states use alternative joint sealing materials, which are reportedly effective in preventing water infiltration.
2. Use drainable and compressible elastic material behind integral abutments to reduce the effects of abutment lateral movement on the surrounding soil.

xxvi
3. Use geosynthetic reinforced backfill and geotextile wrapped backfill layers to increase backfill load carrying capacity and reduce erosion. This design creates a stiffer backfill response and can reduce the strain incompatibility between the pile supported abutment and surrounding soil. Some states use backfill with layers of geosynthetic reinforcement in combination with shallow foundations to support the bridge abutment.
4. Use an improved drainage system around the abutment to minimize erosion and void development.
Field Inspection Field observations of existing bridge approach problems reveals that the majority of expansion joints are not filled sufficiently to prevent water infiltration (current Iowa DOT practice does not intend for the joint to be sealed). Flexible foam filler is a common joint filler type, but recently, recycled tire chips are increasingly being used. Discussions with field personnel suggest that the recycled tire chips may have a performance advantage over flexible foam. Regardless of the joint filler type, the nominal 4 inch joint width used at integral abutment bridges was almost never observed to be tightly sealed to prevent water infiltration. Monitoring of joints for a period of 15 months in a few integral abutment bridges showed that the maximum change in joint width was less than 1 inch. Inadequate surface and subsurface drainage was observed on about two thirds of the inspected bridges. Drainage problems were identified using the Iowa DOT snake camera inside the drainage pipe and visual inspection where dry subdrains during wet periods, ponding of water and erosion of soil on the inside of the abutment, and/or erosion around the side of the bridge abutment were observed. A variety of water management designs exist for bridges. Some drainage details perform better than others. One observation, in particular, was the overall good performance of a large diameter surface drain and gutter system in the shoulder of an approach slab in District 2. Erosion of the embankment material under the bridge and large voids were observed at about one third of the inspected bridge sites. Moreover, the profiles of bridge approaches on both sides of the bridges indicate foundation soil settlement and/or backfill compression. Field visits for nine newly construction bridges reveals that poorly compacted granular backfill is being used behind abutments. In addition to being poorly compacted the backfill materials are being placed at the bulking water content, leaving the material susceptible to collapse upon saturation. Out of the nine new bridge sites, only two sites had the properly specified porous backfill around the subdrain. It was further discovered that on average 70% of the granular backfill particles are smaller than the perforated openings in the subdrain pipe. Observations of maintenance practices mainly include asphalt overlays and grouting. Both of these maintenance practices are not necessarily long term solutions. On two projects the URETEK method, which uses expansive polyurethane injected under the approach slabs, was used to fill the void and lift the pavement. Results from these projects are documented herein. Iowa DOT personnel have raised some concerns that the injected foam could migrate into the abutment drainage system and needs further investigation.
xxvii
Characterization of Bridge Approach Settlement To quantify the approach slab performance and establish a threshold to initiate maintenance, International Roughness Index (IRI) data and elevation profiles of several bridge approaches on U.S. Highway 65, where Iowa DOT conducted a major maintenance project, were used to develop a maintenance rating criteria. The Bridge Approach Performance Index (BI) is defined graphically as the area between the current bridge approach elevation profile and the original elevation profile normalized by the bridge approach length. The maximum value of IRI around the bridge and the BI are used to develop the final rating criteria. This rating approach suggests that several of the inspected bridges on Highway U.S. 65 from I-80 to US 69 required some form of maintenance on the approaches. Many of these bridge approaches were repaired in 2004. Characterization of Backfill Materials The engineering properties of granular backfill materials used as abutment backfill are described. The Collapse Index (CI) was evaluated by measuring the change in soil volume as a function of placement water content. It was found that materials meeting the Iowa DOT specification for granular backfill experience a CI up to 6% if placed at moisture contents in the bulking range (3% to 7%). In the field, most of the granular backfill materials are being placed at the bulking water content. In addition to the collapse potential, it was found that granular backfill materials meeting the current Iowa DOT specification are highly erodible. The gradation range includes 20% to 100% passing the No. 8 sieve. According to the literature, part of this gradation range is considered highly erodible. It is recommended that porous backfill or an alternative gradation be used that limits the percent passing the No. 8 sieve to less that 60%. The drainage characteristics of various backfill materials were further evaluated using a scaled abutment model. Eleven different models using granular and porous backfill materials with geocomposite drains, tire chips, and geotextile reinforcement were tested. The maximum achieved steady state flow, differential settlement, and void size developed were documented (measurements and DVD video) for each model. The most poorly performing model (producing minimum flow, maximum void, and maximum differential settlement) was the model used to simulate current practices observed in the field whereby granular backfill materials are poorly compacted at the bulking water content without using porous backfill around the drainage pipe. Using porous backfill behind the abutment helps to minimize settlement and void formation, and increases the flow capacity from 32 cm3/sec to 92 cm3/sec. Adding a geocomposite vertical drain to the current Iowa DOT design increases the flow capacity to 222 cm3/sec while using recycled tire chips reduces settlement, prevents void formation, and increases the flow capacity up to 552 cm3/sec. Based on the results of the model experiments, recommendations are made to improve water management designs for bridge approaches. Paving Notch Analytical Investigation The Iowa DOT has documented failure of abutment paving notches which resulted in settlement of the approach slab below the deck elevation. Consequently, the failure potential of the pavement notch region of an existing (pre-2004) typical two-lane bridge in Iowa was conducted.

xxviii
Using results obtained from a linear finite element analysis, a strut-and-tie model was formulated to better understand the force flow through the pavement notch to the abutment wall. Using the demands estimated from the strut and tie forces under the worst possible static and dynamic load cases, it was found that the steel reinforcement details used for pavement notch by the Iowa DOT are sufficient. However, the analysis revealed that the vertical reinforcement in the abutment wall may be inadequate and should be increased in non-integral abutment bridges. No changes are suggested for the reinforcement details in the abutment wall of integral bridges. As a result of poor construction practices that may lead to improper placement of steel reinforcement, the failure potential of unreinforced concrete segments in a pavement notch and the bridge end region of an approach slab were also examined. These analyses indicated that the failure of unreinforced concrete segments would be likely to occur when dynamic effects are included. It is emphasized that in spite of the findings from these analyses, poor workmanship and/or poor quality of concrete may lead to the failure of the pavement notch and the approach slab at reduced loads. Hence, good inspection and quality control procedures should be followed during the construction of bridge abutments, pavement notches and approach slabs. Recommendations As a result of the research described in this report, the following changes are suggested for implementation on a pilot test basis: 1. Use a combination of porous backfill and geocomposite drainage systems behind the
abutment to improve drainage capacity and reduce erosion around the abutment. Implement use of a surface drainage detail similar to that used at bridge no. 5596.2S156 in District 2 for new construction or retrofits. Several alternative design details are provided for these recommendations and can be implemented on new construction or rehabilitation of existing bridges.
2. To reduce erosion of granular backfill materials, adjust the limits for material passing the No. 8 sieve to less than 60%; and to reduce collapse susceptibility of granular backfill materials, set moisture control limits to between 8% and 12%.
3. For bridges with soft foundation or embankment soils, implement practices of improved embankment compaction with moisture control, foundation preloading, ground improvement, soil removal and replacement, or soil reinforcement that reduce time-dependent post construction settlements and possibly lateral squeeze.
4. Connect the approach slab to the abutment or the deck of the bridge, and eliminate the expansion joint at the bridge end of the approach slab. Support the far end of the approach slab on a sleeper beam with a construction joint of 2 inches and provide an improved joint sealing system at the CF joint. A rubber V-shaped gland joint sealing system is recommended on a pilot test basis. Replace the #5 vertical reinforcing bars in the abutment wall with #7 reinforcing bars in future non-integral bridges.
Full-scale implementation of these recommendations may require collaboration between Iowa DOT personnel and a basic policy change, not only in design, but also in planning, construction and administration.

xxix
Future Research Further research would be desirable to observe the performance of new and retrofitted bridges where the recommended changes are implemented. This could be accomplished by monitoring full-scale pilot projects where a few of the proposed designs and construction practices could be implemented. This will enable the Iowa DOT and the researchers to evaluate the performance of the new suggested changes under field conditions.

1
INTRODUCTION
The Iowa DOT has identified bridge approach settlement and the formation of the bump as a significant problem that draws upon considerable resources for repair and maintenance at all jurisdiction levels in Iowa. The term “bridge approach” used in this report is meant to identify the area from the abutment to a significant distance (about 100 feet) away from the bridge structure. According to NCHRP Synthesis 234 (Briaud et al. 1997), bridge approach settlement is a problem that affects about 25% of the bridges nationwide at an annual maintenance cost of at least $100 million. The problematic bump not only contributes to added expense and repair time, but also added risk to maintenance workers, reduction in transportation agency’s public image, distraction to drivers, reduced steering control, damage to vehicles, and, in the winter, damage to bridge decks from snowplows—all undesirable effects. Many repair options and alternative design techniques exist, but each has its own drawbacks, such as cost, effectiveness, inconvenience to the public, etc. In Iowa, the most common maintenance procedures are asphalt overlay and void filling with grout, which is an ongoing maintenance expense as it addresses the symptom but does not correct the problem.
In order to recommend improved design, construction, and maintenance operations, it is important to understand the processes that lead to the formation of the bump at Iowa bridges. In this effort, an extensive field investigation was undertaken to document and characterize bridge approach problems. Iowa DOT personnel identified bridges with approach problems for investigation. Field visits were also made to existing and other new under construction bridges. The observed problems and construction practices that need to be corrected are identified, and alternative design and construction practices are recommended.
Research Objectives
The main objectives of this study were to do the following:
• Identify state-of-the-art practices for design, construction, and maintenance of bridge approaches to reduce the bridge approach settlement problem. Develop recommendations specific to Iowa site conditions.
• Document several bridge approach sites where poor performance has been observed in order to better understand conditions that lead to the formation of the bump in Iowa.
• Develop practical threshold limits at the interface between the bridge and the approach slab to be used for determination of when corrective maintenance/repair is required.
• Recommend design, construction, and maintenance alternatives, including geosynthetic reinforcement, expansion joint design, QA inspection techniques, etc., specific to Iowa conditions.
Research Plan
This research project included a literature review, field inspection of existing and under construction bridges, laboratory investigations of the backfill material properties, development of

2
bridge approach maintenance initiation criteria, and recommended design alternatives for newly constructed bridges and repair of poorly performing approaches. A literature review of previous research, including analysis of the causes of bridge approach settlement and referencing the current state-of-the-art practice for bridge approach design, construction, and maintenance/repair operations, was completed. Furthermore, a survey was completed summarizing the drainage details, backfill gradation requirements, compaction requirements, and approach slab-abutment connection details used in neighboring states. Field investigations were performed at bridges with poor performance and at new under construction bridges in all six districts of Iowa. Continued monitoring of a project case history (see TR-443) where the bridge approach embankment was reinforced with Geopier foundations is documented. Furthermore, monitoring of various maintenance practices was performed and documented. For some bridge sites, in situ testing and laboratory investigations were conducted to isolate and test soil backfill materials that were believed to be contributing to the bridge approach settlement problems. Using the bridge approach elevation profiles and International Roughness Index (IRI) data, threshold limits to characterize the bridge approach conditions were developed. Lastly, design alternatives for newly constructed bridges and repair of existing approaches (i.e., new joint details, structurally connecting the approach slab to the bridge abutment, using other backfill materials and drainage details, etc.) are recommended. Significant Findings and Recommendations
Some of the significant findings and recommendations are as follows:
• Void development under the bridge approach is observed within one year of bridge construction, indicating insufficient moisture control/compaction and poor backfill material.
• Water management around the bridge is a major problem at most of the inspected bridges. Several abutment subdrains were observed to be either blocked with soil, dry, indicating no water flow, or collapsed.
• Grouting under the approach slab does not necessarily prevent further settlement or loss of backfill material due to erosion.
• Using a large diameter surface drain and gutter system in the shoulder of an approach slab in District 2 showed overall good water management design.
• Measuring elevation profiles for several problematic bridge approaches identified by Iowa DOT personnel illustrates that most of the bridge approach slopes are higher than 1/200, which according to Wahls (1990) is a benchmark for initiating maintenance. Many of these approaches were repaired.
• Out of 11 bridge sites (including 32 bridge approaches) where the approach slab elevation profiles were measured on both sides of the bridges, 6 bridges showed evidence

3
of settlement of the foundation soil and/or embankment fill. Further, differential settlement of about 2 to 6 inches at the end of the abutment wingwall is common.
• Most expansion joints of inspected bridges are not completed filled allowing water to flow into the underlying fill materials. The current Iowa DOT design approach is not to seal these joints.
• Granular backfill behind abutments is undercompacted at most new or under-maintenance bridge sites. Porous backfill was not used around the subdrain at most inspected new bridges. On average, 70% of the granular backfill and 1% of the porous backfill materials are smaller than the subdrain perforated openings.
• At two bridge sites it was shown that the URETEK method successfully lifted the approach slab. Further monitoring is required to verify long-term performance of this maintenance approach.
• According to the developed bridge approach rating system (based on elevation profile and IRI values), several approaches on U.S. Highway 65 near Des Moines were rated poor. Many of these approaches were repaired in 2004.
• Granular backfill placed at the bulking moisture content (3% to 7%) undergoes up to 6% collapse (settlement) when saturated. Granular backfill placed at moisture content greater than about 8% experiences no collapse. Porous backfill does not experience collapse within the tested moisture content ranging of 0 to 12%.
• Scaled model tests show that a geocomposite vertical drainage system (STRIPDRAIN 75) significantly increases drainage capacity (383 cm3/sec compared to 32 cm3/sec without) and reduces the void development. Tire chips in lieu of granular backfill yielded the highest drainage capacity of 552 cm3/sec and also reduced the void size.
• Using the demands estimated from the strut and tie forces under the worst possible static and dynamic load cases, it was found that the steel reinforcement details used for pavement notch by the Iowa DOT are sufficient. However, the analysis revealed that the vertical reinforcement in the abutment wall is inadequate in non-integral abutment bridges where the #5 reinforcing bars should be replaced with #7 reinforcing bars.
• The failure potential of unreinforced concrete segments in pavement notch and approach slab indicated that the failure of these segments will occur when the dynamic effects of the loads are included.
• Based on the findings of this research, the research team recommends, on a pilot test basis, to connect the approach slab to the bridge abutment and implement new drainage details. Details of these recommendations are provided herein.

4
LITERATURE REVIEW
Introduction
Bridge approach settlement and formation of the “bump” at the end of the bridge is a problem that has gained national attention (Ardani 1987; Arsoy et al. 1999; Briaud et al. 1997). According to a survey of 61 different transportation agencies (Laguros et al.1990), bridge approach settlement problems were considered significant in almost 70% of the agencies. A more recent survey by Hoppe (1999) reported that 44% of the state DOTs consider bridge approach settlement a significant problem (Figure 1). Iowa is listed as having a “moderate” problem (Hoppe 1999). However, interviews with several Iowa DOT personnel believe that the bridge approach settlement problem in Iowa is more extensive. To understand the major causes of bridge approach settlement problems, and to provide detailed background information describing previous research conducted on this topic, this literature review is organized into a discussions of (1) review of bridge abutment and approach slab design details, (2) observed causes that lead to formation of the bump, (3) defining the bump, and (4) finding a solution.
Yes
ModerateNo
No Response
Yes
ModerateNo
No Response
Yes
ModerateNo
No Response
Figure 1. The significance of bridge approach settlement (Virginia DOT 2003)
Review of Bridge Abutments and Approach Slab Design Details
Abutment Details
Bridges are typically classified as integral (movable) or non-integral (conventional or stub) abutment bridges with the main difference between the two types being the connection detail between the bridge superstructure and the abutment (see Figures 2 and 3). For non-integral abutment bridges, the superstructure is typically supported on bearing connections that allow for longitudinal movements of the superstructure without transferring lateral loads to the abutment. Battered piles are typically installed to resist lateral soil loads on the abutment backwall. To accommodate for relative movement between the bridge superstructure and the abutment, expansion joints and bearing (slip) connections at each end of the superstructure are typically

5
installed. Increased traffic loads and frequent application of de-icing salts during winter can result in accelerated deterioration of expansion joints and bearing connections, which can lead to costly maintenance problems (Horvath 2000). To eliminate the use of bearing plates and to reduce potential maintenance problems, a concept was developed to “integrally” or rigidly connect the bridge superstructure to the abutment (Horvath 2000). The use of integral abutments has increased since 1960’s. Integral abutments are usually supported on deep vertical pile foundations. Since constructing the first integral abutment bridge in Iowa in 1962 (Kunin and Alampalli 2000), the use of integral abutments has increased significantly. According to a survey reported in NCHRP Synthesis 234 (Briaud 1997), Iowa has almost 4000 integral abutment bridges. Greimann et al. (1987) and Hoppe and Gomez (1996) reported the following advantages of the integral abutment bridges:
• Simple and reduced construction and maintenance costs due to the elimination of bearings
• Fewer piles are required for foundation support • Improved seismic performance
Although, both integral and non-integral bridges are vulnerable to differential settlement, a disadvantage of integral abutment bridges is that they are more affected by the daily temperature changes, which subject the abutment backfill to cyclic lateral loading (Arsoy et al. 1999). Arsoy et al. (1999) reported two problems associated with cyclic lateral loading:
• Development of a void near the abutment face • Differential settlement between the bridge superstructure and approach embankment
Schaefer and Koch (1992) also reported that the lateral movement of integral bridge abutments due to the seasonal expansion and contraction of the bridge superstructure introduce a void near the abutment causing settlement of the approach slab. This cyclic movement also introduces high applied stresses on the pile foundations which may reduce pile axial load capacity (Greimann et al. 1986). Greimann et al. (1983) reported that the vertical load carrying capacity for H piles in very stiff clays is reduced by approximately 50% for 2 in. lateral displacement and approximately 20% for 1 in. lateral displacement. Approach Slab Details
The approach slab is designed to be supported on the bridge abutment at one end and on the embankment fill or a sleeper slab (or beam) at the other end. The purpose of the approach slab is to minimize effects of differential settlement between the bridge abutment and the embankment fill and to provide a smooth transition between the pavement and the bridge. The performance of the approach slabs depends on many factors, including (1) the approach slab dimensions, (2) the steel reinforcement, (3) the use of a sleeper beam, and (4) the type of connection between the approach slab and the bridge.

6
Wingwall
Reinforced Concrete Approach SlabBridge Deck
GirderStub Abutment
Battered Piling
Expansion Joint
Figure 2. A simplified cross section of a non-integral abutment bridge (Greimann et al. 1987)
Figure 3. A simplified cross section of an integral abutment (Greimann et al. 1987)
Wingwall
Reinforced Concrete Approach SlabBridge Deck
Girder IntegralAbutment
Flexible Piling
Expansion Joint

7
Hoppe (1999) reported the details of approach slabs used by 39 DOTs (Table 1). Lengths varied from 10 to 40 feet and thickness varies 8 to 17 inches. In general, there are two different approach slab-bridge connection details that are used by most DOTs. The first is to connect the approach slab reinforcement to the bridge deck by extending the deck longitudinal reinforcement (Figure 4) or to connect the approach slab to the abutment (Figure 5). The second is to have the approach slab resting on top of the bridge abutment (Figure 6). Hoppe (1999) reported that 71% of the state DOTs that use integral abutments use a mechanical connection between the approach slab and the bridge (Table 2). Moreover, Table 3 summarizes the approach slab-abutment connection and joint width details of twelve state DOTs. According to Wolde-Tinsae et al. (1989), the joint between the bridge deck and the approach slab should transfer traffic loads, prevent surface water from entering, and allow expansion as necessary to prevent abutment damage. Connecting the approach slab with the bridge deck or abutment helps in transferring traffic load and preventing significant changes of the expansion joint width at the bridge end, which keeps the expansion joint sealed and reduces disturbance to the joint material. NCHRP synthesis 319 (Purvis 2003) provides a detailed discussion of joint types, review of current practices, design guidelines, and methods to improve the joint seal service life.
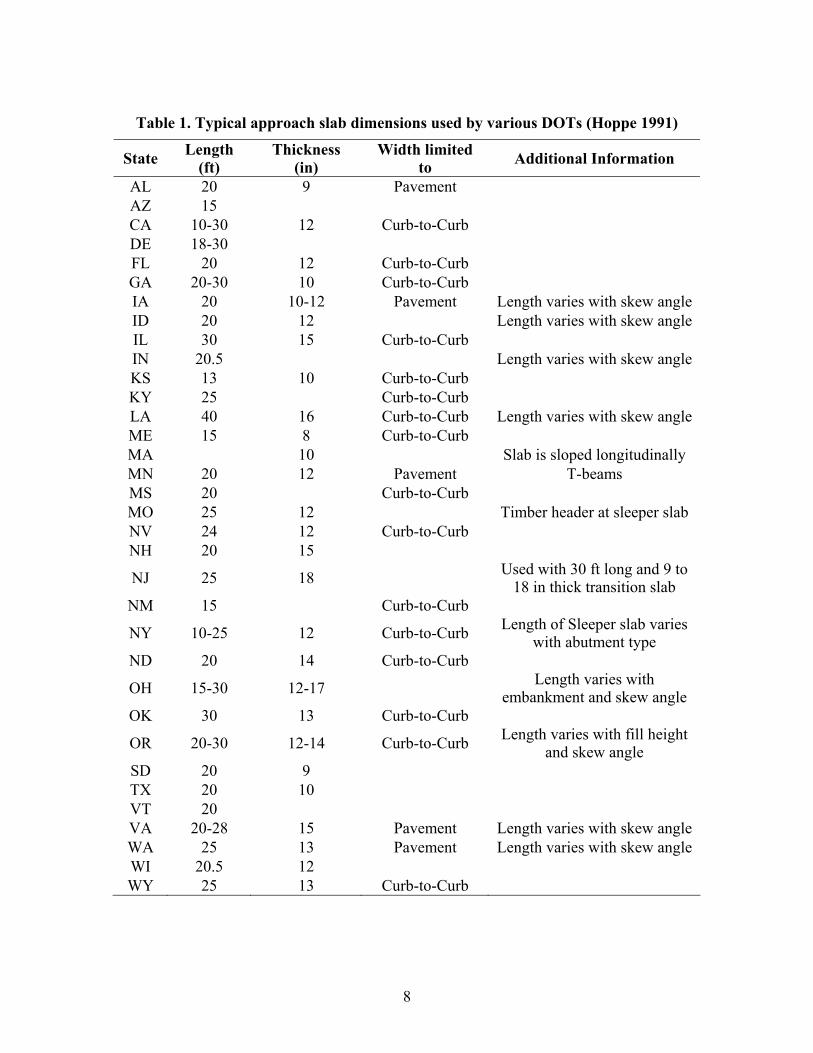
8
Table 1. Typical approach slab dimensions used by various DOTs (Hoppe 1991)
State Length (ft)
Thickness (in)
Width limited to Additional Information
AL 20 9 Pavement AZ 15 CA 10-30 12 Curb-to-Curb DE 18-30 FL 20 12 Curb-to-Curb GA 20-30 10 Curb-to-Curb IA 20 10-12 Pavement Length varies with skew angle ID 20 12 Length varies with skew angle IL 30 15 Curb-to-Curb IN 20.5 Length varies with skew angle KS 13 10 Curb-to-Curb KY 25 Curb-to-Curb LA 40 16 Curb-to-Curb Length varies with skew angle ME 15 8 Curb-to-Curb MA 10 Slab is sloped longitudinally MN 20 12 Pavement T-beams MS 20 Curb-to-Curb MO 25 12 Timber header at sleeper slab NV 24 12 Curb-to-Curb NH 20 15
NJ 25 18 Used with 30 ft long and 9 to 18 in thick transition slab
NM 15 Curb-to-Curb
NY 10-25 12 Curb-to-Curb Length of Sleeper slab varies with abutment type
ND 20 14 Curb-to-Curb
OH 15-30 12-17 Length varies with embankment and skew angle
OK 30 13 Curb-to-Curb
OR 20-30 12-14 Curb-to-Curb Length varies with fill height and skew angle
SD 20 9 TX 20 10 VT 20 VA 20-28 15 Pavement Length varies with skew angle WA 25 13 Pavement Length varies with skew angle WI 20.5 12 WY 25 13 Curb-to-Curb
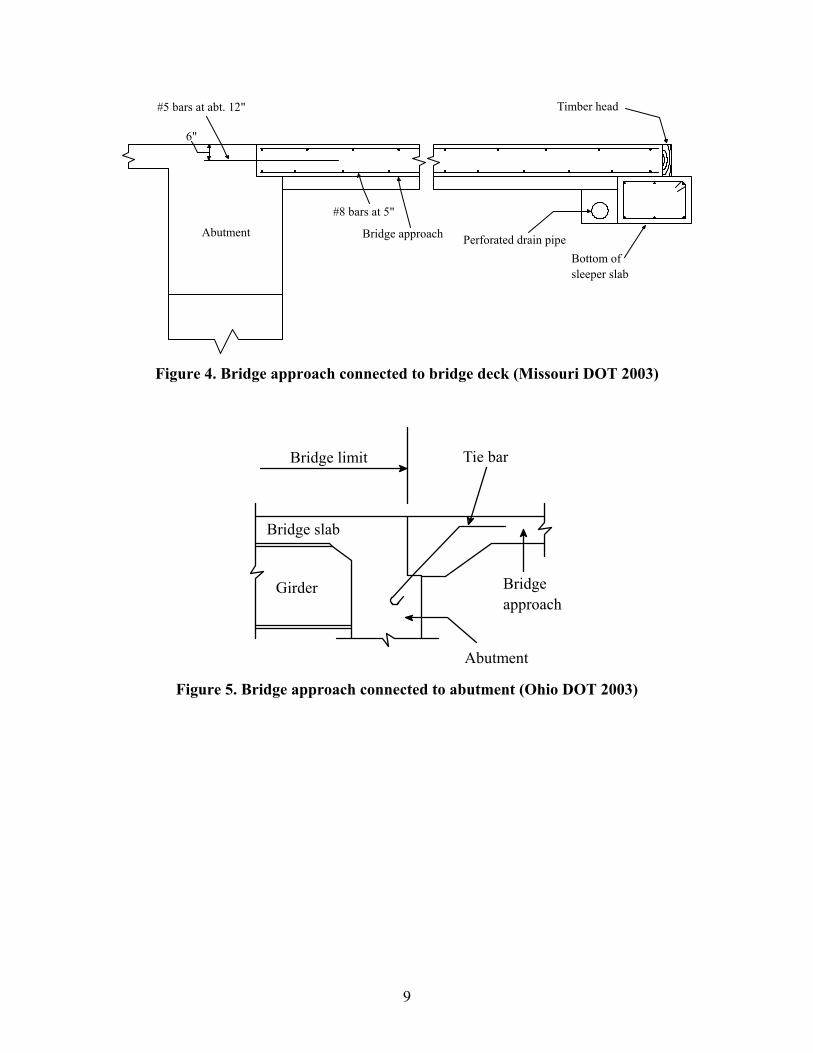
9
#5 bars at abt. 12"
6"
#8 bars at 5"
Perforated drain pipe
Timber head
Bottom of sleeper slab
Abutment Bridge approach
Figure 4. Bridge approach connected to bridge deck (Missouri DOT 2003)
Girder
Abutment
Bridge slab
Bridgeapproach
Bridge limit Tie bar
Figure 5. Bridge approach connected to abutment (Ohio DOT 2003)
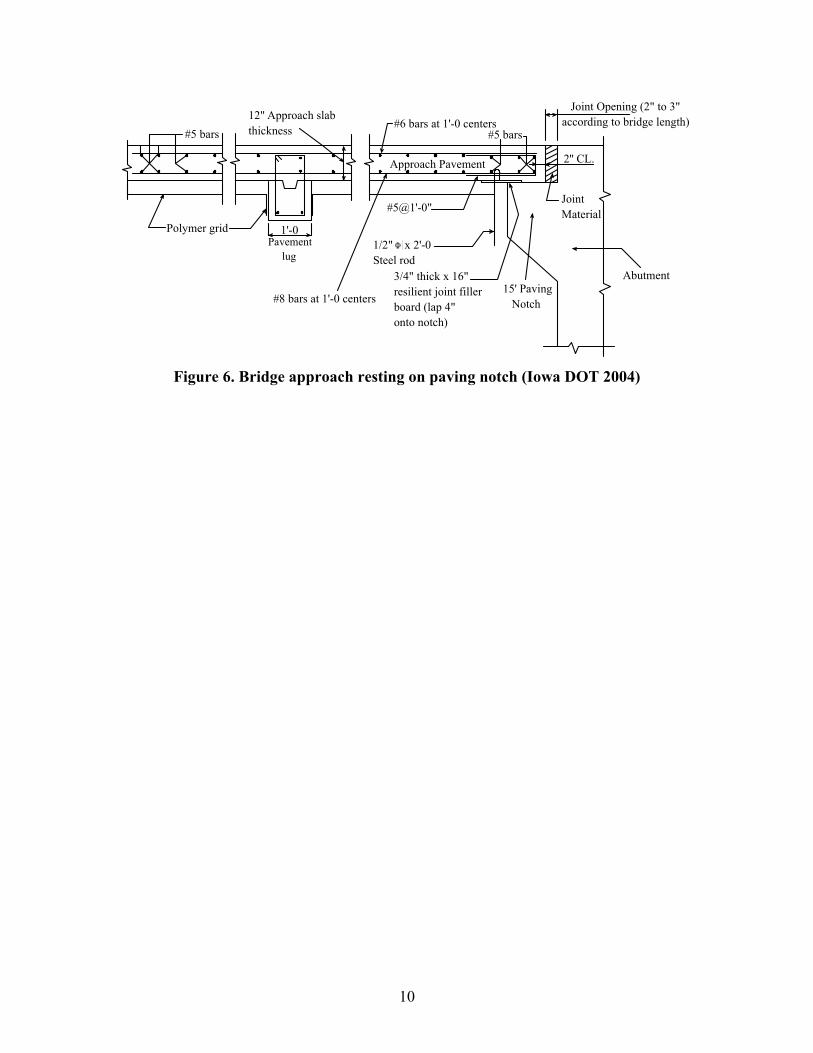
10
15' Paving Notch
JointMaterial
Joint Opening (2" to 3"according to bridge length)
2'' CL.
3/4" thick x 16"resilient joint filler board (lap 4" onto notch)
1/2" x 2'-0Steel rod
#5 bars
Approach Pavement
#6 bars at 1'-0 centers
#8 bars at 1'-0 centers
1'-0Pavement lug
Polymer grid
#5 bars
Abutment
12" Approach slabthickness
#5@1'-0"
Figure 6. Bridge approach resting on paving notch (Iowa DOT 2004)
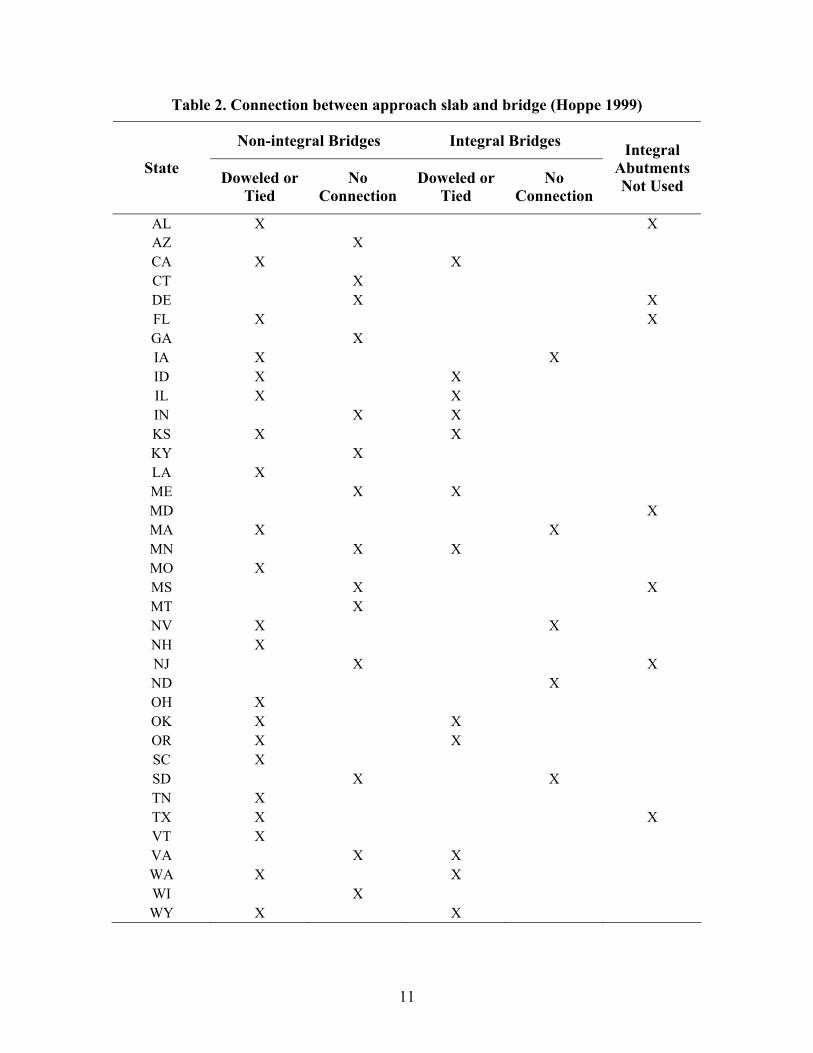
11
Table 2. Connection between approach slab and bridge (Hoppe 1999)
Non-integral Bridges Integral Bridges
State Doweled or Tied
No Connection
Doweled or Tied
No Connection
Integral Abutments Not Used
AL X X AZ X CA X X CT X DE X X FL X X GA X IA X X ID X X IL X X IN X X KS X X KY X LA X ME X X MD X MA X X MN X X MO X MS X X MT X NV X X NH X NJ X X ND X OH X OK X X OR X X SC X SD X X TN X TX X X VT X VA X X WA X X WI X WY X X
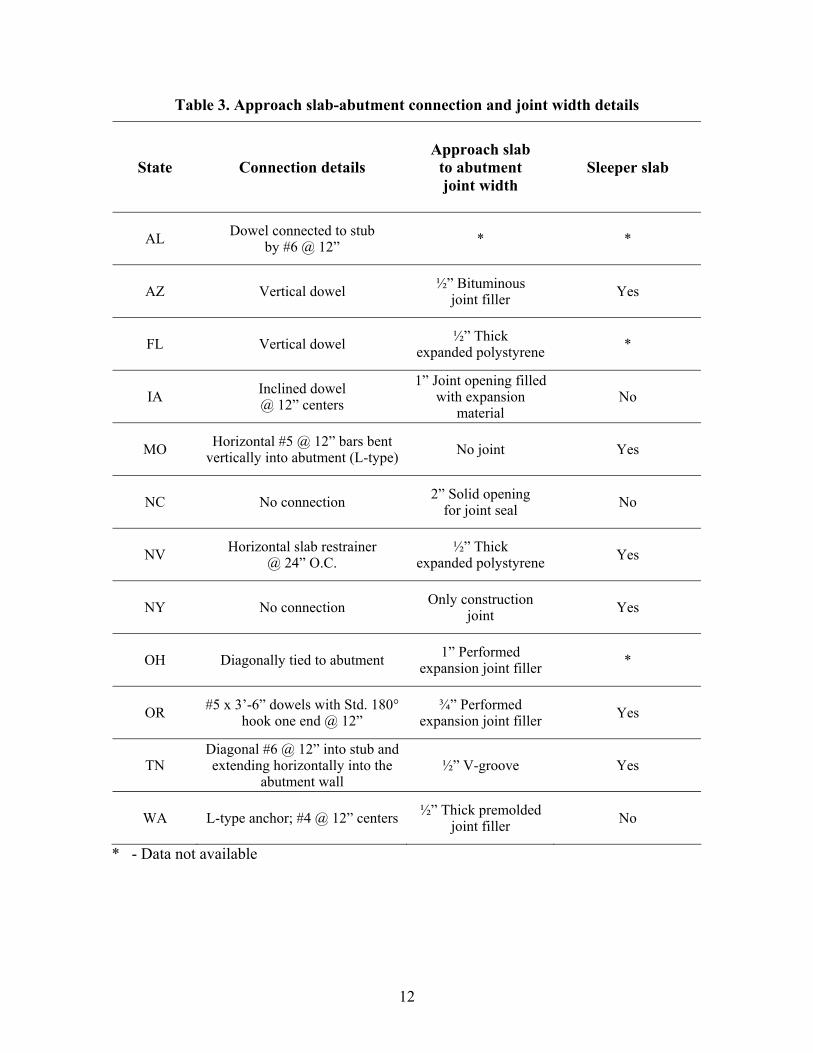
12
Table 3. Approach slab-abutment connection and joint width details
State Connection details Approach slab
to abutment joint width
Sleeper slab
AL Dowel connected to stub by #6 @ 12” * *
AZ Vertical dowel ½” Bituminous joint filler Yes
FL Vertical dowel ½” Thick expanded polystyrene *
IA Inclined dowel @ 12” centers
1” Joint opening filled with expansion
material No
MO Horizontal #5 @ 12” bars bent vertically into abutment (L-type) No joint Yes
NC No connection 2” Solid opening for joint seal No
NV Horizontal slab restrainer @ 24” O.C.
½” Thick expanded polystyrene Yes
NY No connection Only construction joint Yes
OH Diagonally tied to abutment 1” Performed expansion joint filler *
OR #5 x 3’-6” dowels with Std. 180° hook one end @ 12”
¾” Performed expansion joint filler Yes
TN Diagonal #6 @ 12” into stub and extending horizontally into the
abutment wall ½” V-groove Yes
WA L-type anchor; #4 @ 12” centers ½” Thick premolded joint filler No
* - Data not available
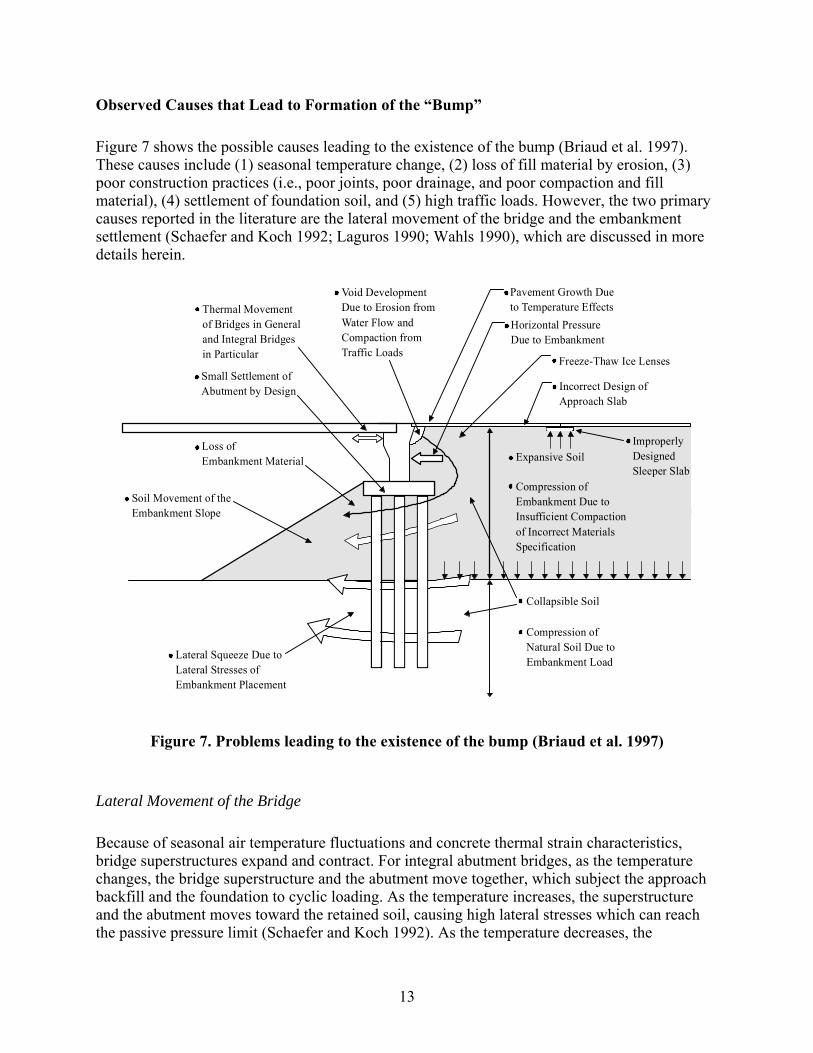
13
Observed Causes that Lead to Formation of the “Bump”
Figure 7 shows the possible causes leading to the existence of the bump (Briaud et al. 1997). These causes include (1) seasonal temperature change, (2) loss of fill material by erosion, (3) poor construction practices (i.e., poor joints, poor drainage, and poor compaction and fill material), (4) settlement of foundation soil, and (5) high traffic loads. However, the two primary causes reported in the literature are the lateral movement of the bridge and the embankment settlement (Schaefer and Koch 1992; Laguros 1990; Wahls 1990), which are discussed in more details herein.
Collapsible Soil
Compression ofNatural Soil Due toEmbankment Load
Expansive Soil
Compression ofEmbankment Due toInsufficient Compactionof Incorrect MaterialsSpecification
ImproperlyDesignedSleeper Slab
Lateral Squeeze Due toLateral Stresses ofEmbankment Placement
Loss ofEmbankment Material
Soil Movement of theEmbankment Slope
Small Settlement ofAbutment by Design
Thermal Movementof Bridges in Generaland Integral Bridgesin Particular
Void DevelopmentDue to Erosion fromWater Flow andCompaction fromTraffic Loads
Incorrect Design ofApproach Slab
Freeze-Thaw Ice Lenses
Pavement Growth Dueto Temperature EffectsHorizontal PressureDue to Embankment
Figure 7. Problems leading to the existence of the bump (Briaud et al. 1997)
Lateral Movement of the Bridge
Because of seasonal air temperature fluctuations and concrete thermal strain characteristics, bridge superstructures expand and contract. For integral abutment bridges, as the temperature changes, the bridge superstructure and the abutment move together, which subject the approach backfill and the foundation to cyclic loading. As the temperature increases, the superstructure and the abutment moves toward the retained soil, causing high lateral stresses which can reach the passive pressure limit (Schaefer and Koch 1992). As the temperature decreases, the
14
superstructure and the abutment move away from the compressed soil, leaving a void. As the weather gets colder, the abutments move further away from the retained soil, which increases the size of the void between the soil and the abutments (Figure 8). The creation of this void may lead to soil erosion that increases the size of the void behind the abutment and below the approach slab. For integral abutments, Arsoy et al. (1999) measured the ambient temperature and bridge length in Virginia where the maximum expansion and contraction of the bridge coincided with the maximum and minimum ambient temperatures. For a bridge of length L subjected to a uniform temperature, the thermal deformation ∆L due to a change in temperature of δT = T – To is
∆L = α(δT)L (1)
where α is the coefficient of linear thermal expansion. For concrete, α is approximately 6.0 x 10⁻⁶ per °F (Chen 1995). Girton et al. (1991) idealized the bridge by dividing it into sections with uniform properties using temperature measurements for two Iowa bridges⎯Hwy 30 Boone River Bridge (concrete girders) and Maple River Bridge (steel girders) located in northwest Iowa. To estimate lateral extension, Equation 2 shows that a bridge can be divided into n segments, with each segment j having a uniform coefficient of expansion aj, a uniform temperature Tj, a uniform modulus Ej, and area Aj. Expansion/Contraction movements are calculated from Equation 2, as follows:
LAE
AETa
jj
nj
j
jjjj
nj
j
∑
∑=
=
=
=
∆=∆
1
1 (2)
Based on the measured temperatures and expansion, the following values were recommended:
• Thermal expansions coefficients of 0.0000045 and 0.000005 in in/oF • Temperature variation of 150 oF to 140 oF for Boone and Maple bridges, respectively
The movement of the bridge abutment due to the seasonal temperature also affects the pile stresses and behavior. Girton et al. (1991) measured the maximum pile stress which was found to be 60% and 75% of the nominal yield stress at Boone River Bridge and Maple River Bridge, respectively. Lawver et al. (2000) reported that the maximum measured pile stresses were slightly above the nominal yield stress of the pile. Greimann et al. (1986) performed a three-dimensional nonlinear finite element analysis to study pile stresses and pile soil structure interaction of integral abutment bridges. They concluded that the thermal expansion of the bridge reduces the vertical load carrying capacity of the piles.

15
CL CLAsphalt layer Asphalt layer
b) Contraction of bridgea) Expansion of bridge
Backfill
Backfill
Void
Approach slab
Approach slab
Figure 8. Movement of bridge structure with temperature (Arsoy et al. 1999)
Embankment Settlement
In addition to the temperature change effects, embankment settlement is a primary factor leading to formation of bump (Wahls 1990; Holts 1982). Embankment settlement can be caused by settlement of foundation soil, poor compaction of fill material, poor drainage, and loss of fill material by erosion. Many state highway agencies have investigated causes of the bump and consider embankment settlement as a primary contributor. In Colorado, Ardani (1987) attributed bridge approach settlement problems to (1) time-dependent consolidation of foundation soil and the approach embankment, (2) poor drainage and soil erosion around the abutment, and (3) poor compaction of embankment fill adjacent to the abutment. Studies in Nebraska (Tadros and Benak 1989) and Kentucky (Hopkins and Scott 1970; Hopkins 1973; Hopkins 1985) concluded that consolidation of the foundation soil is the primary factor leading to formation of the bump. In California, Stewart (1985) reported that the most important factors causing the bridge approach settlement were compression of the embankment fill material and settlement of the foundation material. Defining the Bump
The problem of differential settlement at the bridge approach is typically addressed by implementing a maintenance practice. To initiate maintenance, a threshold differential settlement or slope can be used. Walkinshaw (1978) suggested that vertical differential settlement greater than 2.5 inches results in a poor ride quality. Bozozuk (1978) concluded that tolerable settlements are about 3.9 inches vertically and 2 inches horizontally. Long et al. (1988) and Wahls (1990) suggest the use of a relative gradient (settlement/length) of 1/200 as a criterion to initiate a remedial action. In lieu of settlement or gradients, International Roughness Index (IRI) measurements were used by Das et al. (1999) in Louisiana to identify the riding quality of the bridge approach. IRI values at the bridge approach of 10 or greater classify the riding quality of the approach slab as poor or very poor.
16
Finding a Solution
Differential settlement at the bridge approach has been addressed in the literature using several maintenance, design, and construction practices. Some of these practices are summarized below. Maintenance
When the approach slab settles excessively, the available repair options typically consist of overlaying, grouting, or replacement. Overlaying the approach slab with an asphalt layer compensates for the elevation difference between the approach slab and the bridge; however, it does not stop the void development from erosion or cyclic abutment loadings, which may lead to further settlement. Tadros and Benak (1989) inspected grouting operations of bridge approaches and reported that grouted approaches can badly deteriorate because of pavement cracking between injection holes. Schaefer and Koch (1992) further concluded that grouting the void does not solve the problem of differential settlement. Approach slab replacement, which is an expensive maintenance alternative, is usually used when faulting of the approach slab panels takes place.
Other maintenance technologies include lifting and realigning the approach slab by filling and sealing the void under the approach slab. URETEK, Inc., invented a technology for injecting liquid polyurethane into 5/8 inch drilled holes through the concrete pavement to lift, realign, and fill the void and underseal pavement slabs. As the polyurethane expands, the voids under the settled slabs are filled. As it hardens, the necessary lifting forces can be applied on the slab to lift it to the original position. Polyurethane reaches 90% of its full compressive strength within 15 minutes. The amount of rise can be controlled by regulating the rate of injection. According to URETEK, Inc., a final elevation within ¼ inch of the proposed elevation can be achieved and the polyurethane is unaffected by subsurface temperatures between 0o and 100o F. This method has been used by thirty different state DOTs.
Design and Construction Alternatives
Maintenance costs for fixing bridge approach problems can be significant. Therefore, it is important to identify the causes of the differential settlement and try to minimize or eliminate them during the design and construction processes. Previous studies (i.e., Briaud 1997; Wahls 1990; Wahls 1983; Edgar et al. 1989; Ardani 1987) suggest alternatives for reducing the differential settlement at bridge approaches. These solutions included (1) improvement of the foundation soil if necessary; (2) use of well-graded backfill material; (3) reinforcement of the backfill material using geosynthetics; (4) use of abutments supported on shallow foundations; (5) use of elastic, collapsible inclusion or expandable material behind the abutments; (6) installation of more effective drainage system; (7) use of filter wrap to prevent soil erosion; and (8) constructing approach slabs with an angle from the horizontal (pre-cambering). These proposed material and design solutions can be grouped into categories of (1) foundation soil, (2) backfill material, (3) bridge foundation, (4) approach slab, and (5) drainage which are discussed further below.
17
Foundation Soil
The engineering properties of the foundation soil beneath both the abutment and the embankment fill is one of the most important factors affecting the performance of bridge approaches according to Wahls (1990). A detailed subsurface investigation is an essential task that needs to be conducted at the bridge site. Clays and silts are more likely to exhibit long-term compression and settlement (consolidation) than gravels or sands. When inadequate soft foundation soils are encountered, the soil can be modified using preloading, in situ densification, soil removal and replacement, and soil reinforcement. Alternatively, lightweight embankment fill materials can be used to reduce the load applied to the soft foundation soil. Preloading is one of the most commonly used methods to reduce post-construction settlement. The effectiveness of this technique depends on the time available for consolidation to occur. If the available construction time is less than that required for the foundation soil to consolidate, vertical drains can be used to increase the rate of consolidation. Lin and Wong (1999) studied deep cement mixing technique to improve the strength of soft clay with high moisture content foundation material to reduce the total and differential settlement at a bridge approach in China. The deep cement mixing columns were designed in a pattern of decreasing length away from the bridge abutment to provide a settlement transition. Using deep cement mixing increased the unconfined compression strength by 60 times which resulted in a gradual reduction in settlement toward the bridge. A wide range of additional ground improvement technologies exist for controlling settlement below embankments fills. A complete discussion of these techniques is beyond the scope of this report. Backfill Material
Ideal properties for backfill include easily compacted; no time-dependent properties (e.g. consolidation); resistance to erosion; and elastic. Granular materials are more elastic in behavior than silts and clays which reduce the non-recovered backfill movement when the abutments move away from the retained soil. Backfill materials used in bridge approach construction are usually selected granular materials with some fines. FHWA (2000) recommends the use of a backfill material with less than 15% passing sieve No. 200. Wahls (1990) recommended the use of materials with a plasticity index (PI) less than 15%, percent of fines less than 5%, and density ranging from 95% of AASHTO T 99 to 100% of AASHTO T 180. Wahls (1990) stated that well-graded backfill materials with less than 5% passing sieve No. 200 are easy to compact with small vibratory compactors, which minimizes post construction compression of the backfill and can eliminate frost heave problems. CalTrans specifies a PI less than or equal to 15% and a relative compaction of 95% or more. Hoppe (1999) reported that 59% of the DOTs that responded to a survey use a requirement of limiting the percent of soil particles passing sieve No. 200 between 4% and 20%, with the fill placed and compacted in lifts of 6 to 8 inches. However, 50% of these DOTs had difficulty obtaining the specified degree of compaction in the proximity of the bridge abutment because of compaction equipment space limitations.

18
Tables 4 and 5 summarize backfill gradation requirements according to several state DOTs. Most states specify a range of approximately 0% to 10% passing sieve No. 200, which coincides with Iowa DOT current requirement. For compaction, the Iowa DOT requires that the backfill material shall be deposited in layers not exceeding 8 in. (200 mm) in loose thickness. The first layer shall be compacted to not less than 90% of maximum dry density and each succeeding layer not less than 95% of maximum dry density, which is determined in accordance with Iowa DOT Materials Laboratory Test Method 103. The majority of states require AASHTO T-99 as a compaction method, which is very similar to Laboratory Test Method 103 (Table 6). However, no moisture content restrictions are specified by Iowa DOT. Many state DOTs recommend the use of reinforced embankment behind the bridge abutment. Monley et al. (1993) reported that the Wyoming Highway Department has used multiple layers of geosynthetic reinforcement within compacted granular embankments since 1983. Edgar et al. (1988) reported that none of ninety approach slabs constructed or retrofitted using the geosynthetic reinforced embankment in Wyoming required maintenance or repair after 5 years. However, Wahls (1990) and Horvath (1991) argue that geosynthetic reinforced backfill should be used with a compressible material between the abutment and the backfill to allow for large recoverable cyclic movements. Wahls (1990) stated that this compressible material should provide adequate drainage without soil fines erosion. Horvath (2000) reported design alternatives including geofoam as a compressible material (Figure 9). When using geotextiles as backfill reinforcement, Edgar et al. (1988 and 1989) reported the use of a collapsible material between the abutment and the backfill material. This material is rigid when dry and collapses to create a void when wet, allowing for the mobilization of tension in geotextile reinforcement. Development of the void space reduces lateral forces on the bridge abutment (Edgar 1989; Abu-Hijleh et al. 2000). Many state DOTs have successfully used compressible and collapsible materials behind the abutment. For example North Dakota used a four-inch-wide vertical strip of compressible material, and Illinois DOT used non-compacted porous granular material (Wahls 1990; Kunin and Alampalli 2000). Furthermore, Oregon and Wyoming DOTs used geosynthetic reinforced embankments with a gap at the bridge wall.
Table 4. Iowa DOT backfill gradation
Sieve size (mm) Sieve no. % Passing
76.2 3” 100 2.36 # 8 20-100 0.075 # 200 0-10
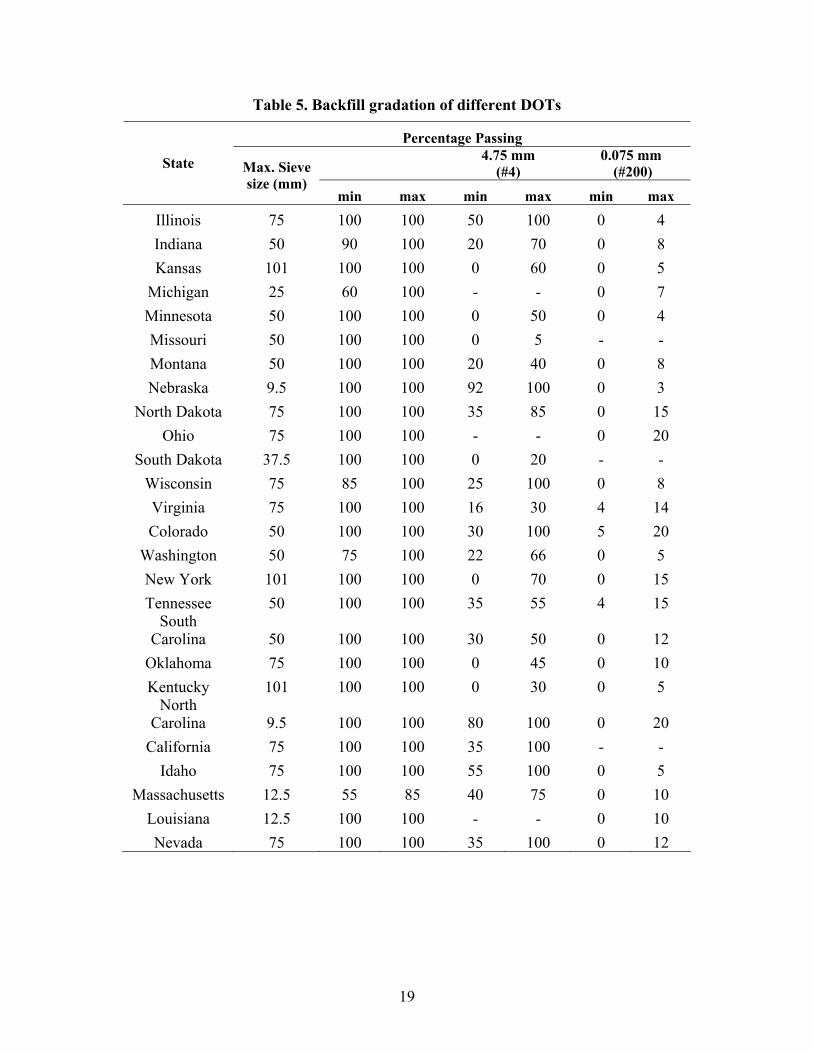
19
Table 5. Backfill gradation of different DOTs
Percentage Passing
4.75 mm
(#4) 0.075 mm
(#200) State Max. Sieve size (mm)
min max min max min max
Illinois 75 100 100 50 100 0 4 Indiana 50 90 100 20 70 0 8 Kansas 101 100 100 0 60 0 5
Michigan 25 60 100 - - 0 7 Minnesota 50 100 100 0 50 0 4 Missouri 50 100 100 0 5 - - Montana 50 100 100 20 40 0 8 Nebraska 9.5 100 100 92 100 0 3
North Dakota 75 100 100 35 85 0 15 Ohio 75 100 100 - - 0 20
South Dakota 37.5 100 100 0 20 - - Wisconsin 75 85 100 25 100 0 8 Virginia 75 100 100 16 30 4 14 Colorado 50 100 100 30 100 5 20
Washington 50 75 100 22 66 0 5 New York 101 100 100 0 70 0 15 Tennessee 50 100 100 35 55 4 15
South Carolina 50 100 100 30 50 0 12
Oklahoma 75 100 100 0 45 0 10 Kentucky 101 100 100 0 30 0 5
North Carolina 9.5 100 100 80 100 0 20
California 75 100 100 35 100 - - Idaho 75 100 100 55 100 0 5
Massachusetts 12.5 55 85 40 75 0 10 Louisiana 12.5 100 100 - - 0 10 Nevada 75 100 100 35 100 0 12

20
Table 6. Compaction requirements for various states
State % of dry density Method
Illinois 95 AASHTO T-99 C
Indiana 95 AASHTO T-99
Kansas 95 AASHTO T-99 C/D
Minnesota 95 AASHTO T-99
Missouri 95 AASHTO T-99 C
Nebraska 100 AASHTO T-99
North Dakota 95 AASHTO T-99
Ohio 100 AASHTO T-99
South Dakota 95 AASHTO T-99
Wisconsin 95 AASHTO T-99 C
Colorado 95 AASHTO T-180
Washington 95 AASHTO T-99
New York 95 Standard Proctor
Tennessee 95 AASHTO T-99 C South
Carolina 95 AASHTO T-99 A/C
North Carolina 95 AASHTO T-99
California 95 Standard Proctor
Idaho 95 AASHTO T-99 A/C
Massachusetts 95 AASHTO T-99 C

21
(a) }geosynthetic tensilereinforcement
compressible inclusion
(b)EPS-block geofoam
θ
Figure 9. Two design alternatives to alleviate the differential settlement problem at the
bridge approach using geosynthetic reinforced backfill and geofoam (Horvath 2000)
Bridge Foundation
Typically, integral abutment bridges are supported on deep pile foundations. As the bridge superstructure expands and contracts with temperature changes, the abutment piles develop stresses at the location where the piles are embedded in the pile cap. Arsoy et al. (2002) investigated the performance of H-piles, pipe piles, and prestressed reinforced concrete piles subjected to cyclic lateral displacements. It was concluded that H-piles loaded on the weak axis are the best piles to support integral abutments. Although deep foundations settle in the vertical direction due to the superstructure weight, they generally do not allow the bridge to settle as much as the approach embankment. This created a differential settlement problem at the end of the bridge. The use of shallow foundations can reduce this strain incompatibility problem by increasing the amount of settlement of the bridge. Shallow foundations are typically 50% to 60% less expensive and require less construction time than deep foundations (DiMillio 1982). Grover (1978) compared the behavior of bridges supported by shallow and pile foundations in Ohio. In the 1960s, it was reported that 80% of the abutments supported by shallow spread footings experienced more than 2.5 inches of settlement and 10% experienced more than 4 inches of settlement. Ohio DOT then changed the bridge

22
design to require deep pile supported bridge abutments. This helped reduce settlement of the bridge abutments but created the differential settlement problem at the bridge approach. In 1961, 31% of the bridges had differential settlement problems, while, after implementing the use of pile foundations, 63% of the bridges experienced a differential settlement problem. In the 1980s, DiMillio (1982) and Wahls (1983) demonstrated that spread footing can be designed and constructed to provide satisfactory performance without significant differential settlement problems and with a significant cost reduction in comparison to deep foundations. Approach Slab
State DOTs use flexible pavement and non-reinforced and reinforced concrete pavement for approach slabs. Dunn et al. (1983) compared the performance of various approach slab pavements in Wisconsin and reported that 76% of the flexible approaches rated poor, 56% of the non-reinforced approaches rated fair, and 93% of the reinforced concrete approaches rated good. Anticipated differential settlement at the bridge approach can be accommodated by pre-cambering the approach slab (Tadros and Benak 1989). Wong and Small (1994) conducted laboratory tests to investigate the effects of constructing approach slabs with an angle from the horizontal on reducing the bump at the end of the bridge. Horizontal slab provided a rapid change in surface deformation where the bump was obvious, while the sloping slabs with angles of 5° to 10° provided a smoother transition. Drainage
Water that is collected on the bridge surface can cause significant damage to the approach. Water that seeps down between the abutment and the bridge approach through joints or cracks or flows around the bridge can erode the backfill if not drained properly. Therefore, an effective method is necessary to drain runoff. According to Briaud et al. (1997), both surface and subsurface drainage need to be considered. Surface runoff should be directed away from the bridge joints, which can be achieved by constructing wingwalls, as shown in Figure 10. A review of several drainage designs implemented by states DOTs was carried out for comparison to practices in Iowa. The review shows that there are three main variations of drainage systems: (1) porous backfill around a perforated drain pipe; (2) wrapping a geotextiles around the porous fill; and (3) using a vertical geocomposite drainage system (Figures 11 to 13). Wrapping the porous fill with geotextiles helps reduce erosion and fines infiltration. Some states combine two or more of these details to increase the drainage efficiency. Table 7 shows that out of 16 states, two use porous fill wrapped with geotextile in combination with vertical geocomposite drainage.

23
Soil
Joint
Wingwall
Pavement
Water draining from pavement can seep through joint and erode the soil
SoilWingwall
Pavement
Water draining from pavement does not reach this joint
GuardrailGuardrail
(a) Not recommended (b) Recommended
Figure 10. Recommended wingwall detail (Briaud et al. 1997)
2'-2
SubgradeElev.
Compactedgranular Backfillbetween wings
Modified subbase tobe placed at timeapproach paving isplaced
Porous backfill
Subdrain
Abutment
Bridge slab
Figure 11. Porous fill surrounding subdrain (Iowa DOT)
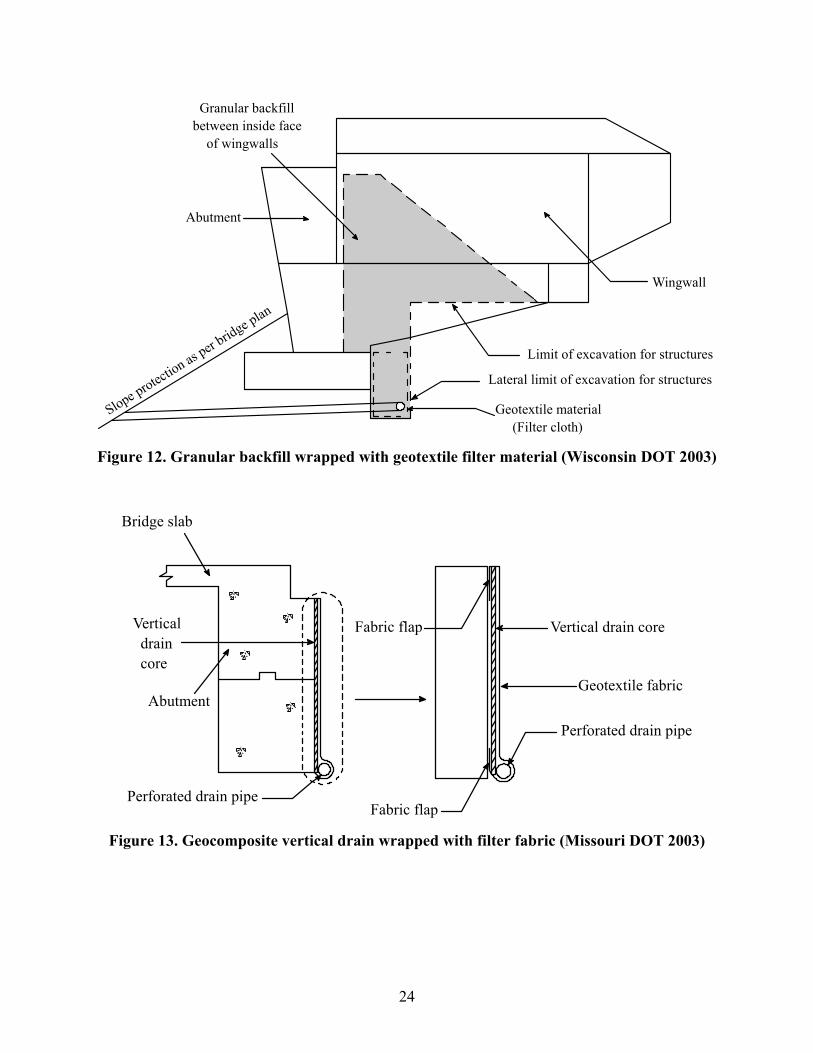
24
Lateral limit of excavation for structures
Granular backfillbetween inside face of wingwalls
Limit of excavation for structures
Geotextile material (Filter cloth)
Wingwall
Abutment
Figure 12. Granular backfill wrapped with geotextile filter material (Wisconsin DOT 2003)
Vertical drain core
Perforated drain pipe
Geotextile fabric
Perforated drain pipe
Fabric flap
Vertical drain coreFabric flap
Bridge slab
Abutment
Figure 13. Geocomposite vertical drain wrapped with filter fabric (Missouri DOT 2003)

25
Table 7. Drainage methods used by various states
State Porous fill Geotextile
Geocomposite drainage system
Iowa x - - California x x x Colorado - x x Indiana x x -
Louisiana x x x Missouri - x x Nebraska - x x
New Jersey x x - New York - - x
North Carolina
x x -
Oklahoma x x - Oregon x x -
Tennessee x x - Texas x x -
Washington x - - Wisconsin x x -
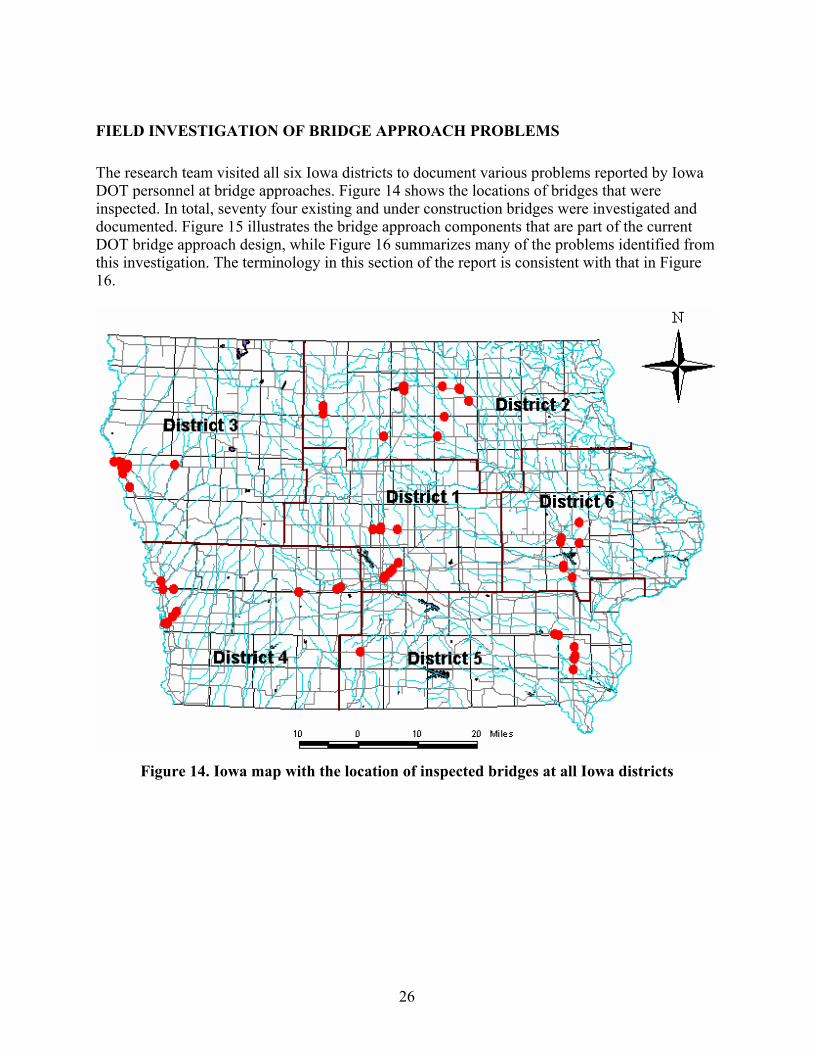
26
FIELD INVESTIGATION OF BRIDGE APPROACH PROBLEMS
The research team visited all six Iowa districts to document various problems reported by Iowa DOT personnel at bridge approaches. Figure 14 shows the locations of bridges that were inspected. In total, seventy four existing and under construction bridges were investigated and documented. Figure 15 illustrates the bridge approach components that are part of the current DOT bridge approach design, while Figure 16 summarizes many of the problems identified from this investigation. The terminology in this section of the report is consistent with that in Figure 16.
Figure 14. Iowa map with the location of inspected bridges at all Iowa districts
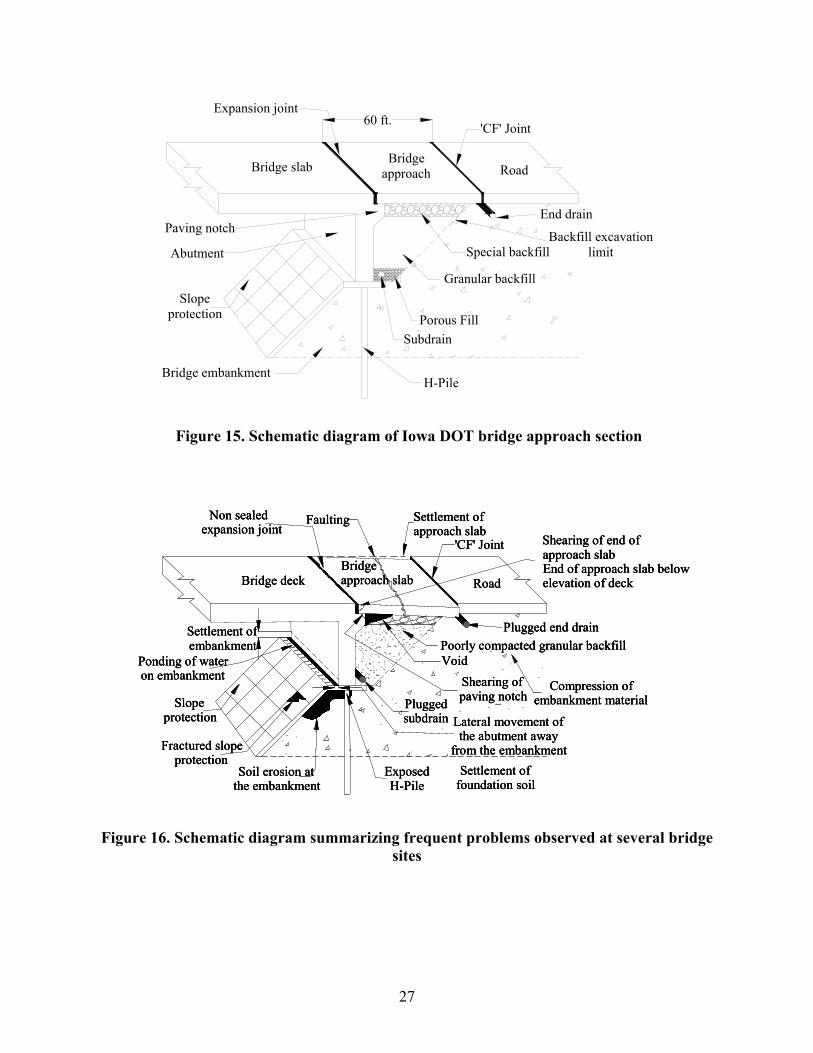
27
60 ft.
Bridge embankment
Special backfillAbutment
Paving notch Backfill excavationlimit
Porous Fill
End drain
Granular backfill
'CF' Joint
Subdrain
Expansion joint
RoadBridge
approach
Slopeprotection
H-Pile
Bridge slab
Figure 15. Schematic diagram of Iowa DOT bridge approach section
Shearing of end of approach slabEnd of approach slab below elevation of deck
Compression ofembankment material
Settlement of foundation soil
Plugged end drain
Settlement ofapproach slab
Settlement ofembankment
Ponding of wateron embankment
Poorly compacted granular backfill
Lateral movement ofthe abutment away
from the embankment
'CF' Joint
Fractured slopeprotection
Soil erosion atthe embankment
Pluggedsubdrain
Shearing ofpaving notch
Void
Non sealedexpansion joint
Road
Faulting
Bridgeapproach slab
Slopeprotection
ExposedH-Pile
Bridge deck
Shearing of end of approach slabEnd of approach slab below elevation of deck
Shearing of end of approach slabEnd of approach slab below elevation of deck
Compression ofembankment material
Settlement of foundation soil
Compression ofembankment material
Settlement of foundation soil
Plugged end drain
Settlement ofapproach slab
Settlement ofembankment
Ponding of wateron embankment
Poorly compacted granular backfill
Lateral movement ofthe abutment away
from the embankment
'CF' Joint
Fractured slopeprotection
Soil erosion atthe embankment
Pluggedsubdrain
Shearing ofpaving notch
Void
Non sealedexpansion joint
Road
Faulting
Bridgeapproach slab
Slopeprotection
ExposedH-Pile
Bridge deck
Figure 16. Schematic diagram summarizing frequent problems observed at several bridge sites

28
Existing Bridge Approach Sections
District 1
Sixteen bridges were inspected in District 1. The most commonly observed problems were erosion of the embankment under the bridge and differential settlement at the bridge approach. Table 8 summarizes the major problems observed in District 1. More detailed observations for all inspected bridges are summarized below. US 65 over South Skunk River (7792.1L/R065)
This bridge was constructed in 1999 with non-integral abutments. At the north end of the north bound approaches, significant settlement was observed. Soil erosion of the embankment under the bridge was also observed (Figure 17). Moreover, concrete spalling was noted at the ends of the bridge deck. At the south end of the northbound lane (NBL), soil erosion of the embankment under the bridge was observed. Aggregate was used for slope cover under the bridge to prevent erosion. Concrete deterioration at end of the girders was also observed (Figure18). The average width of the expansion and the ‘CF’ joints were 2.6 and 3.7 inches, respectively. At the south end of the southbound lane (SBL), a 1 inch gap was measured between the abutment and embankment. The soil of the embankment under the bridge was very wet. The differential settlement of the approach slab at the end of the abutment wingwall was approximately 2.5 in., as shown in Figure 19. The width of the expansion joint was 5.0 and 5.3 inches at the north and south ends, respectively, and the width of the ‘CF’ joint was 4.1 and 4.4 inches at the north and south ends, respectively. The bridge approach profiles for both ends of the northbound lane were obtained in spring 2003 and are shown in Figure 20. The profiles show that the south end approach slab has experienced more settlement compared to the north end. Further, the slope gradients of both the south and north ends are -0.0071 and -0.0051 (i.e., sloping away), which indicates either compression of the embankment fill material or settlement of the embankment foundation soil. To investigate and characterize the embankment soils, Standard Penetration Tests (SPTs) were conducted at the north end of the northbound lane, as indicated in Figure 21. The soil was classified as loose to medium dense sand with a moisture content varying from 12% to 17%. The SPT blow counts provided in Figure 22 range from 5 at the surface to 20 at about 35 ft. According to the drillers, the water table was located at a depth of 25 ft immediately after completing the boring. The height of the embankment was approximately 20 ft.

29
Table 8. Summary of observed problems in district 1
Bridge No. Major Problems US 65 over South Skunk River
(7792.1L/R065) • Differential settlement at end of wingwall • Possible lateral movement of the abutment
US 65 over Railroad (Mile 89) (7788.5L/R065)
• Expansion joints not filled properly • Damage to expansion joints • Soil erosion at all four ends of the bridge • Differential settlement between wingwall and
approach slab US 65 over US 6/Hubbell
(7783.1L065) • Settlement of embankment under the bridge • Approach slab drop at bridge abutment
US 65 near mile 78 (steel girder) (7778.1L/R065) • Dip in approach slab and slab drop off
US 65 over Pleasant Hill Rd (concrete) (7779.4L/R065) • Void under bridge approach slab
US 65 over SE 6th Ave. (steel) (7781.2L065)
• Dip in approach slab • Settlement of embankment under the bridge
US 65 over 4 mile Creek & Railroad) (steel) (7778.1R065) • No major problems observed
Hwy 30 over East Indian Creek (concrete) (8561.5L030) • Soil erosion of embankment under the bridge
Hwy 30 over UP Railroad (steel) (8556.8L030) • Soil erosion of embankment under the bridge
Hwy 30 over South Skunk River (steel) (8550.2L/R030)
• Soil erosion of embankment under the bridge • End drain blocked
Hwy 30 over Duff Ave. (69) (concrete) (8548.4R030 EBL)
• Damage to expansion joints • Dip in approach slab
HW 30 over 136 (8547.3L/R030) (steel) • Differential settlement at end of wingwall
South Dakota Ave. Bridge over Hwy 30 (concrete)
(8544.8O030) • Approach slab drop at EF joint
Dayton Ave. Bridge over Railroad (Ames) (concrete)
(8550.06O030) • Dip in approach slab
72nd Bridge over I-35 (south of Hwy 5) (concrete) (7767.7O035)
• Approach slab drop at bridge abutment • Void under approach slab • Transverse cracks at asphalt overlay
Bridge at 160 over I-35 (concrete) (7702.4S160 SBL)
• Approach slab drop at bridge abutment and dip in approach slab
• Settlement of embankment under the bridge • Lateral movement of the abutment • Expansion joint not filled properly

30
Figure 17. Soil erosion of the embankment under the bridge (South end of North bound)
Figure 18. Deterioration of concrete with visible steel of the girders (South end NBL)
Girder Abutment
Embankmentunder the
bridge

31
Figure 19. Differential settlement of 2.5 inches at the end of the abutment wingwall (South end SBL)
Distance away from the bridge (m)
0 5 10 15 20 25
App
roac
h sl
ab e
leva
tion
rela
tive
to b
ridge
(m)
-0.18
-0.16
-0.14
-0.12
-0.10
-0.08
-0.06
-0.04
-0.02
0.00
Distance away from the bridge (ft)
0 10 20 30 40 50 60 70 80
App
roac
h sl
ab e
leva
tion
rela
tive
to b
ridge
(ft)
-0.5
-0.4
-0.3
-0.2
-0.1
0.0
North endSouth end
joint
Slope = -0.0071
Slope = -0.0051
Figure 20. Elevation of bridge approaches relative to bridge slab
2.5 in.

32
N
Expansion Joint
92'
36.5'
Borehole
Bridge
Bridge approach
Figure 21. Location of test borehole
Blow counts, N
0 2 4 6 8 10 12 14 16 18 20 22
Dep
th (m
)
0
2
4
6
8
10
12
14
16
Dep
th (f
t)
0
10
20
30
40
50
Medium sand
Loose sand
Medium sand
Dense sand
Figure 22. Results of SPT and classification of the embankment soil

33
US 65 over Railroad (Mile 89) (7788.5L/R065)
This bridge has non-integral abutments. Water was observed running through the expansion joints and under the bridge abutment. Soil erosion was severe at both ends of the bridge. Severe soil erosion shown in Figure 23 was observed at the north end of the northbound lane. At the south end of the northbound lane, the approach slab at the guardrail settled about 6 inches from its original elevation, as shown in Figure 24. At both the north and south ends of the southbound lane, severe erosion and settlement of the embankment was noted. The embankments were constructed using sandy soils which are considered highly erodible (Figures 25 to 27).
Figure 23. Erosion of soil under abutment (North end of NBL)
Figure 24. Settlement of bridge approach slab at the guardrail (South end of NBL)
Abutment
Bridge embankment
Approach slab Guardrail
6 in.
Void under the
abutment
Original level of
approach slab
Current level of
approach slab

34
Figure 25. Erosion between abutment and embankment (North end of SBL)
Figure 26. Erosion of the soil under the bridge (North end of SBL)
Abutment
Bridge embankment
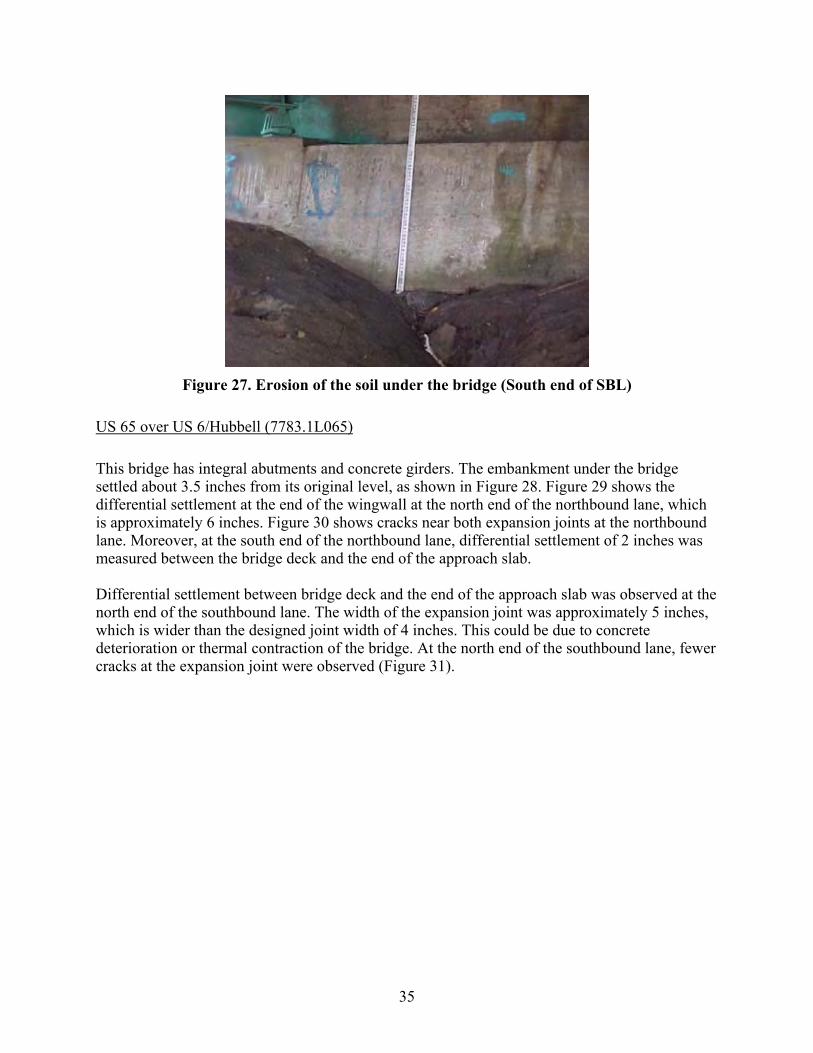
35
Figure 27. Erosion of the soil under the bridge (South end of SBL)
US 65 over US 6/Hubbell (7783.1L065)
This bridge has integral abutments and concrete girders. The embankment under the bridge settled about 3.5 inches from its original level, as shown in Figure 28. Figure 29 shows the differential settlement at the end of the wingwall at the north end of the northbound lane, which is approximately 6 inches. Figure 30 shows cracks near both expansion joints at the northbound lane. Moreover, at the south end of the northbound lane, differential settlement of 2 inches was measured between the bridge deck and the end of the approach slab. Differential settlement between bridge deck and the end of the approach slab was observed at the north end of the southbound lane. The width of the expansion joint was approximately 5 inches, which is wider than the designed joint width of 4 inches. This could be due to concrete deterioration or thermal contraction of the bridge. At the north end of the southbound lane, fewer cracks at the expansion joint were observed (Figure 31).

36
Figure 28. Settlement of embankment under the bridge
Figure 29. Differential settlement at the approach slab (North end of NBL)
Original level of embankment
6 in.
3.5 in.
Slope protection
Abutment
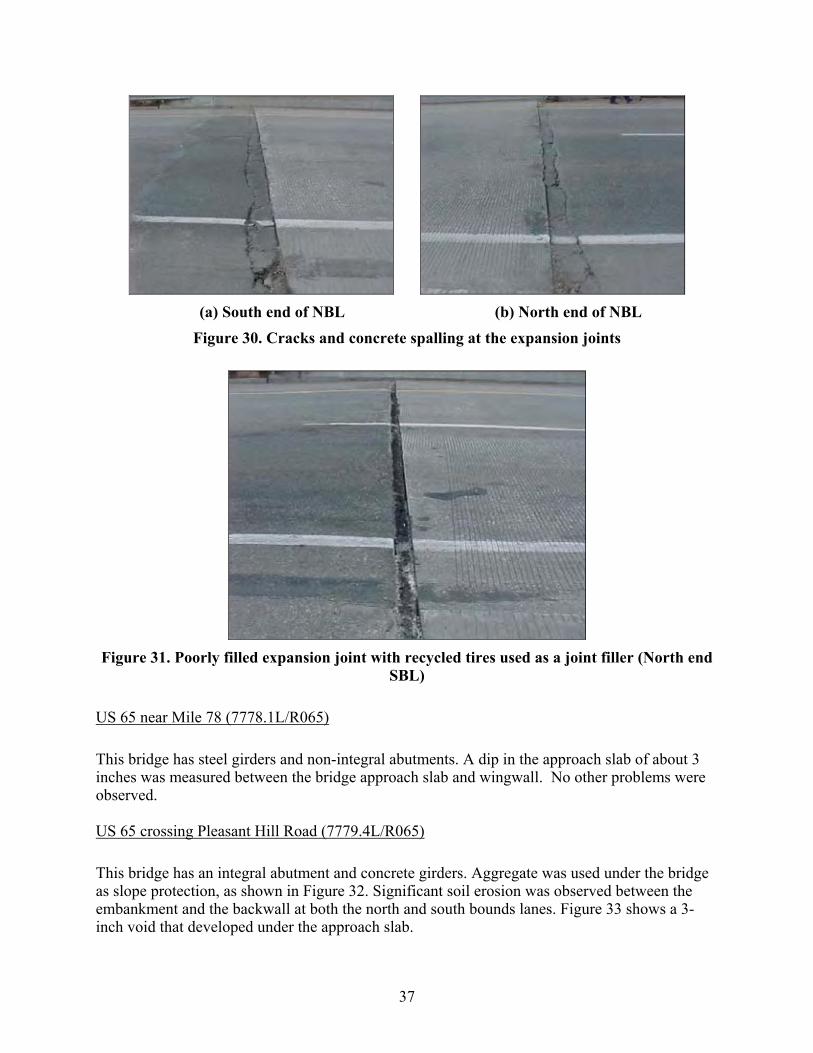
37
(a) South end of NBL (b) North end of NBL
Figure 30. Cracks and concrete spalling at the expansion joints
Figure 31. Poorly filled expansion joint with recycled tires used as a joint filler (North end
SBL)
US 65 near Mile 78 (7778.1L/R065)
This bridge has steel girders and non-integral abutments. A dip in the approach slab of about 3 inches was measured between the bridge approach slab and wingwall. No other problems were observed. US 65 crossing Pleasant Hill Road (7779.4L/R065)
This bridge has an integral abutment and concrete girders. Aggregate was used under the bridge as slope protection, as shown in Figure 32. Significant soil erosion was observed between the embankment and the backwall at both the north and south bounds lanes. Figure 33 shows a 3-inch void that developed under the approach slab.
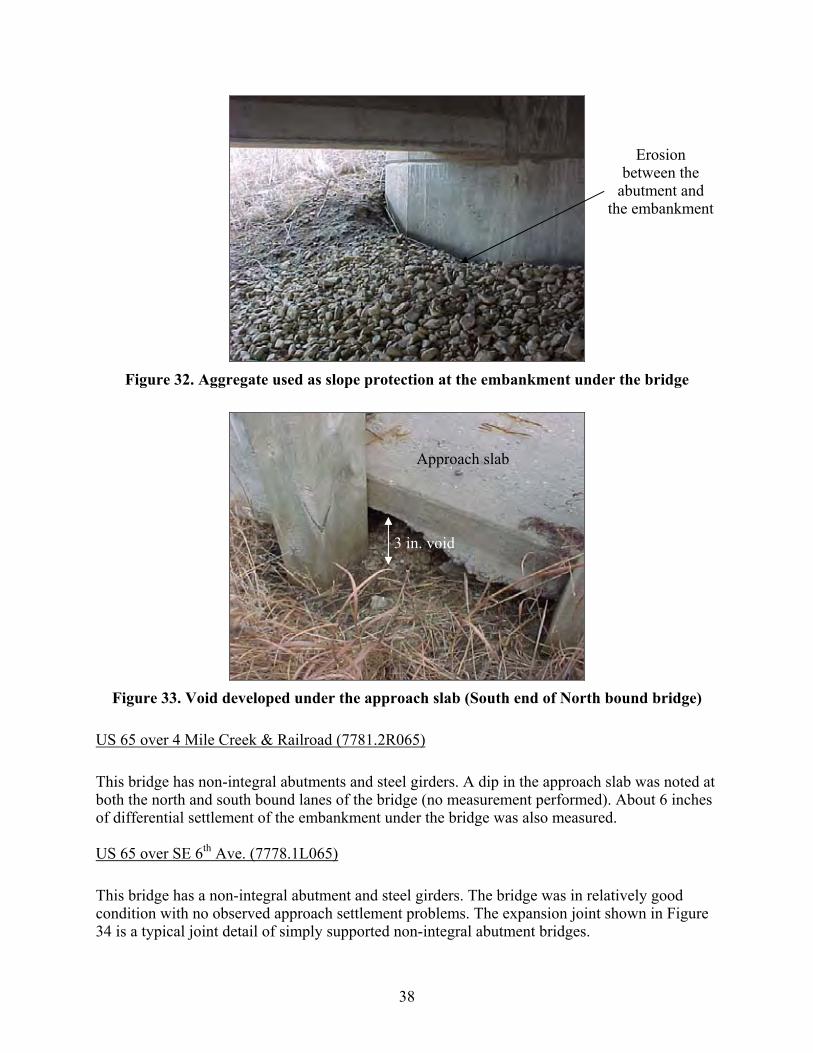
38
Figure 32. Aggregate used as slope protection at the embankment under the bridge
Figure 33. Void developed under the approach slab (South end of North bound bridge)
US 65 over 4 Mile Creek & Railroad (7781.2R065)
This bridge has non-integral abutments and steel girders. A dip in the approach slab was noted at both the north and south bound lanes of the bridge (no measurement performed). About 6 inches of differential settlement of the embankment under the bridge was also measured. US 65 over SE 6th Ave. (7778.1L065)
This bridge has a non-integral abutment and steel girders. The bridge was in relatively good condition with no observed approach settlement problems. The expansion joint shown in Figure 34 is a typical joint detail of simply supported non-integral abutment bridges.
Approach slab
Erosion between the
abutment and the embankment
3 in. void
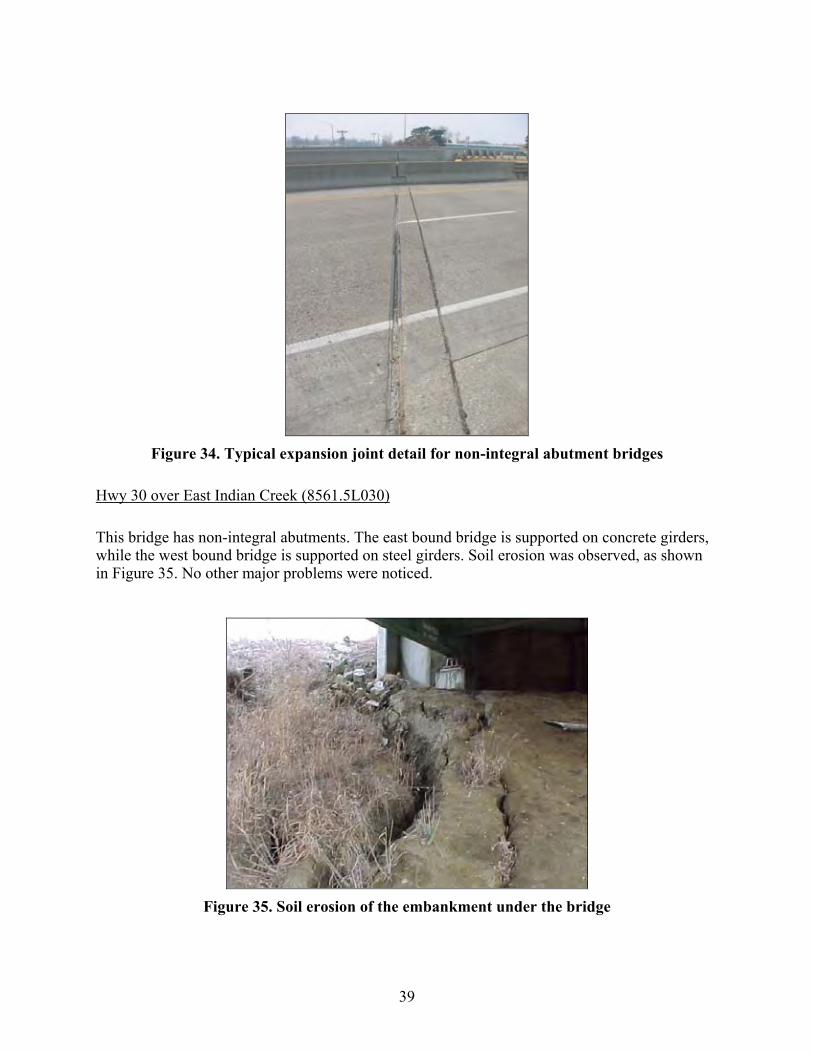
39
Figure 34. Typical expansion joint detail for non-integral abutment bridges
Hwy 30 over East Indian Creek (8561.5L030)
This bridge has non-integral abutments. The east bound bridge is supported on concrete girders, while the west bound bridge is supported on steel girders. Soil erosion was observed, as shown in Figure 35. No other major problems were noticed.
Figure 35. Soil erosion of the embankment under the bridge
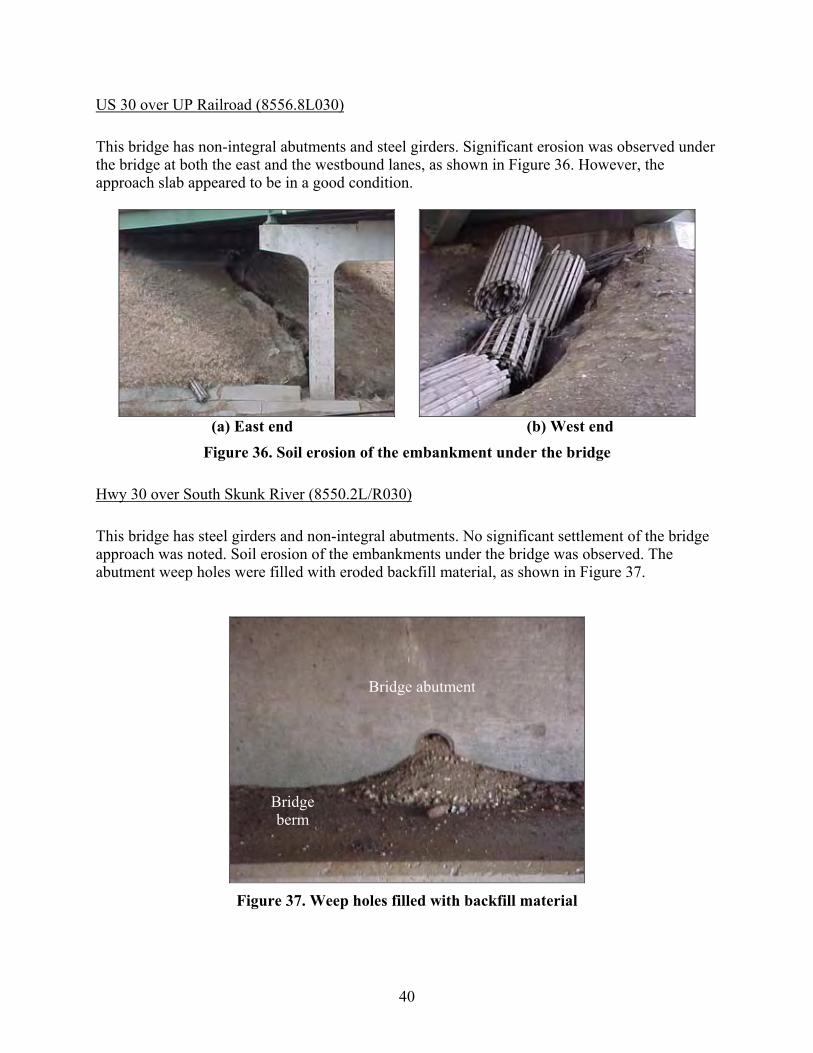
40
US 30 over UP Railroad (8556.8L030)
This bridge has non-integral abutments and steel girders. Significant erosion was observed under the bridge at both the east and the westbound lanes, as shown in Figure 36. However, the approach slab appeared to be in a good condition.
(a) East end (b) West end
Figure 36. Soil erosion of the embankment under the bridge
Hwy 30 over South Skunk River (8550.2L/R030)
This bridge has steel girders and non-integral abutments. No significant settlement of the bridge approach was noted. Soil erosion of the embankments under the bridge was observed. The abutment weep holes were filled with eroded backfill material, as shown in Figure 37.
Figure 37. Weep holes filled with backfill material
Bridge abutment
Bridge berm
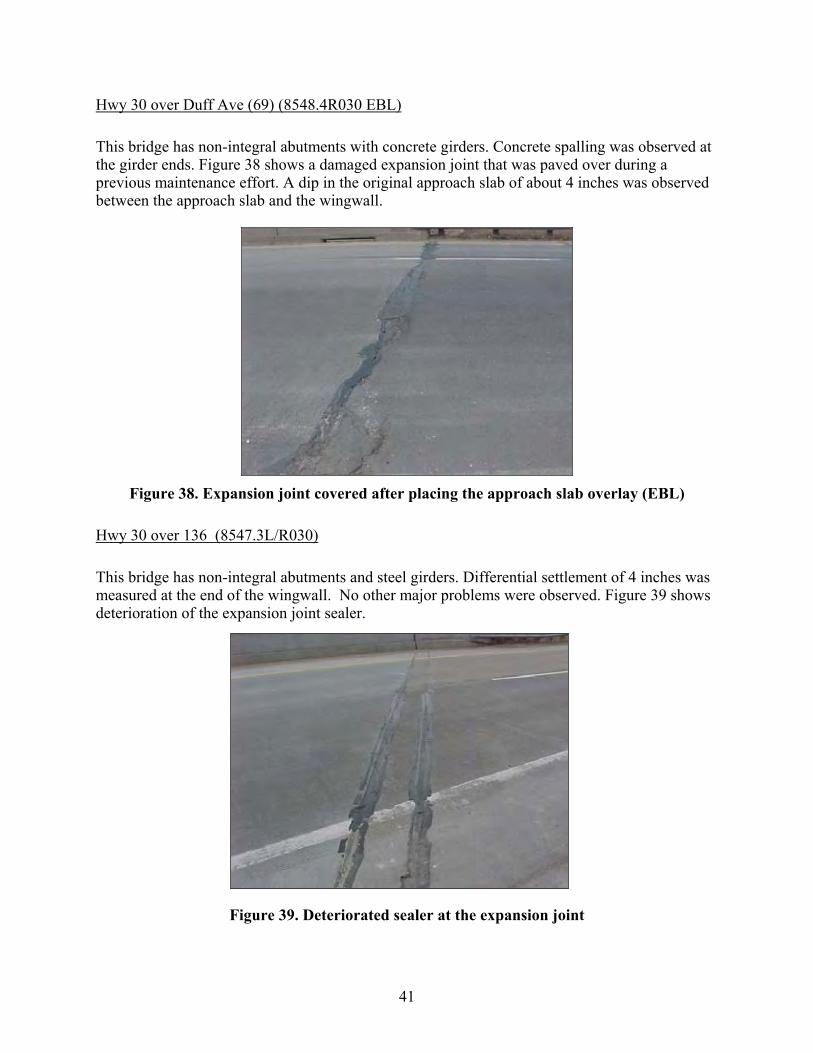
41
Hwy 30 over Duff Ave (69) (8548.4R030 EBL)
This bridge has non-integral abutments with concrete girders. Concrete spalling was observed at the girder ends. Figure 38 shows a damaged expansion joint that was paved over during a previous maintenance effort. A dip in the original approach slab of about 4 inches was observed between the approach slab and the wingwall.
Figure 38. Expansion joint covered after placing the approach slab overlay (EBL)
Hwy 30 over 136 (8547.3L/R030)
This bridge has non-integral abutments and steel girders. Differential settlement of 4 inches was measured at the end of the wingwall. No other major problems were observed. Figure 39 shows deterioration of the expansion joint sealer.
Figure 39. Deteriorated sealer at the expansion joint
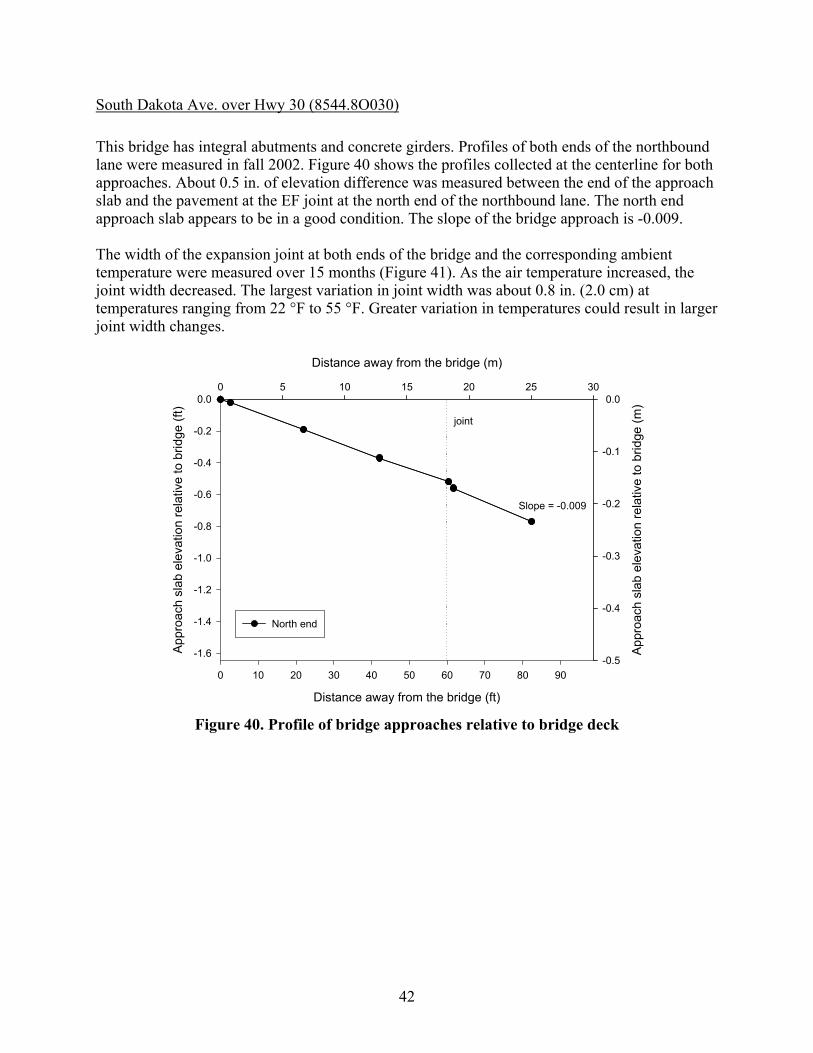
42
South Dakota Ave. over Hwy 30 (8544.8O030)
This bridge has integral abutments and concrete girders. Profiles of both ends of the northbound lane were measured in fall 2002. Figure 40 shows the profiles collected at the centerline for both approaches. About 0.5 in. of elevation difference was measured between the end of the approach slab and the pavement at the EF joint at the north end of the northbound lane. The north end approach slab appears to be in a good condition. The slope of the bridge approach is -0.009. The width of the expansion joint at both ends of the bridge and the corresponding ambient temperature were measured over 15 months (Figure 41). As the air temperature increased, the joint width decreased. The largest variation in joint width was about 0.8 in. (2.0 cm) at temperatures ranging from 22 °F to 55 °F. Greater variation in temperatures could result in larger joint width changes.
Distance away from the bridge (m)
0 5 10 15 20 25 30
App
roac
h sl
ab e
leva
tion
rela
tive
to b
ridge
(m)
-0.5
-0.4
-0.3
-0.2
-0.1
0.0
Distance away from the bridge (ft)
0 10 20 30 40 50 60 70 80 90
App
roac
h sl
ab e
leva
tion
rela
tive
to b
ridge
(ft)
-1.6
-1.4
-1.2
-1.0
-0.8
-0.6
-0.4
-0.2
0.0
North end
joint
Slope = -0.009
Figure 40. Profile of bridge approaches relative to bridge deck
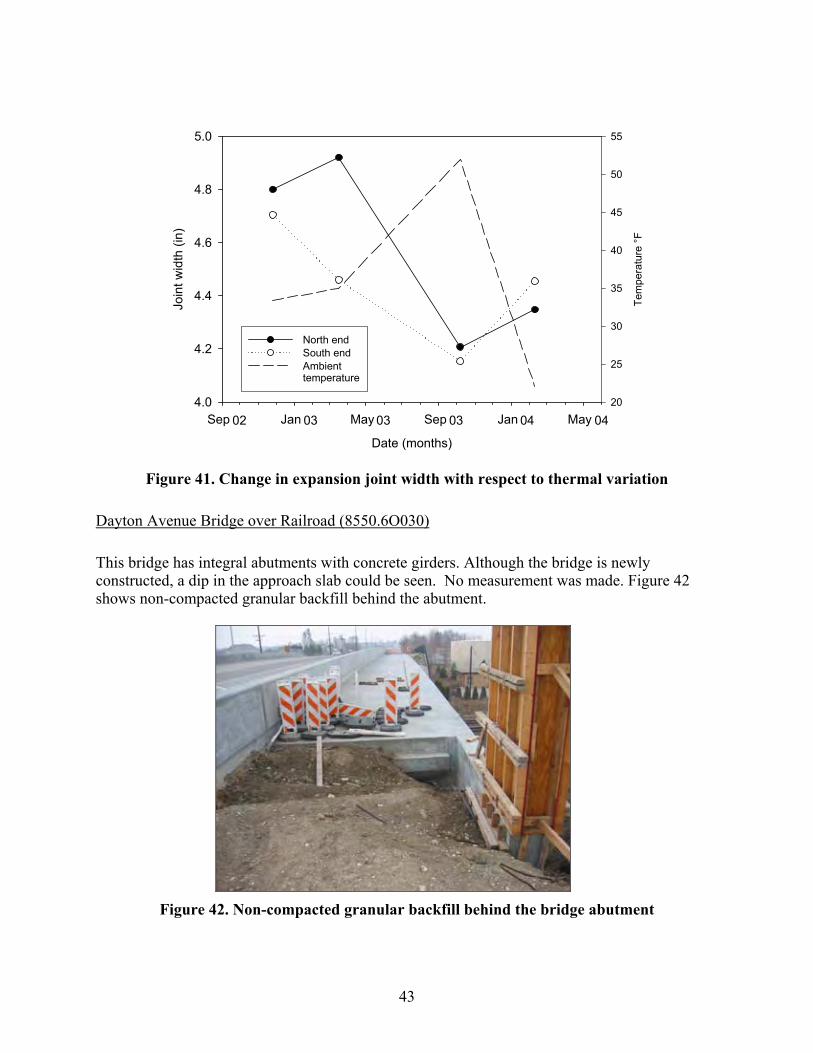
43
Date (months)
Sep Jan May Sep Jan May
Join
t wid
th (i
n)
4.0
4.2
4.4
4.6
4.8
5.0
Tem
pera
ture
°F
20
25
30
35
40
45
50
55
North endSouth endAmbienttemperature
02 03 03 03 04 04
Figure 41. Change in expansion joint width with respect to thermal variation
Dayton Avenue Bridge over Railroad (8550.6O030)
This bridge has integral abutments with concrete girders. Although the bridge is newly constructed, a dip in the approach slab could be seen. No measurement was made. Figure 42 shows non-compacted granular backfill behind the abutment.
Figure 42. Non-compacted granular backfill behind the bridge abutment

44
72nd St. over I-35 (south of Hwy 5) (7767.7O035)
This bridge is a four-span bridge with integral abutments and concrete girders. Asphalt overlays were placed at both ends of the bridge (Figure 43). Figure 44 shows some cracks in the overlay. Differential settlement at the bridge approach of about 3 inches was measured at the approach slab shoulder. Minor erosion of the embankment under the bridge and the abutment sides was noted. Furthermore, the 4 inches expansion joints were poorly filled at the east end (Figure 45). As shown in Figure 46, aggregate was used as slope protection for the embankments under the bridge.
Figure 43. A view of the bridge showing recently placed asphalt overlay at the bridge
approach (East end)
Figure 44. Cracking of the asphalt overlay (East end)
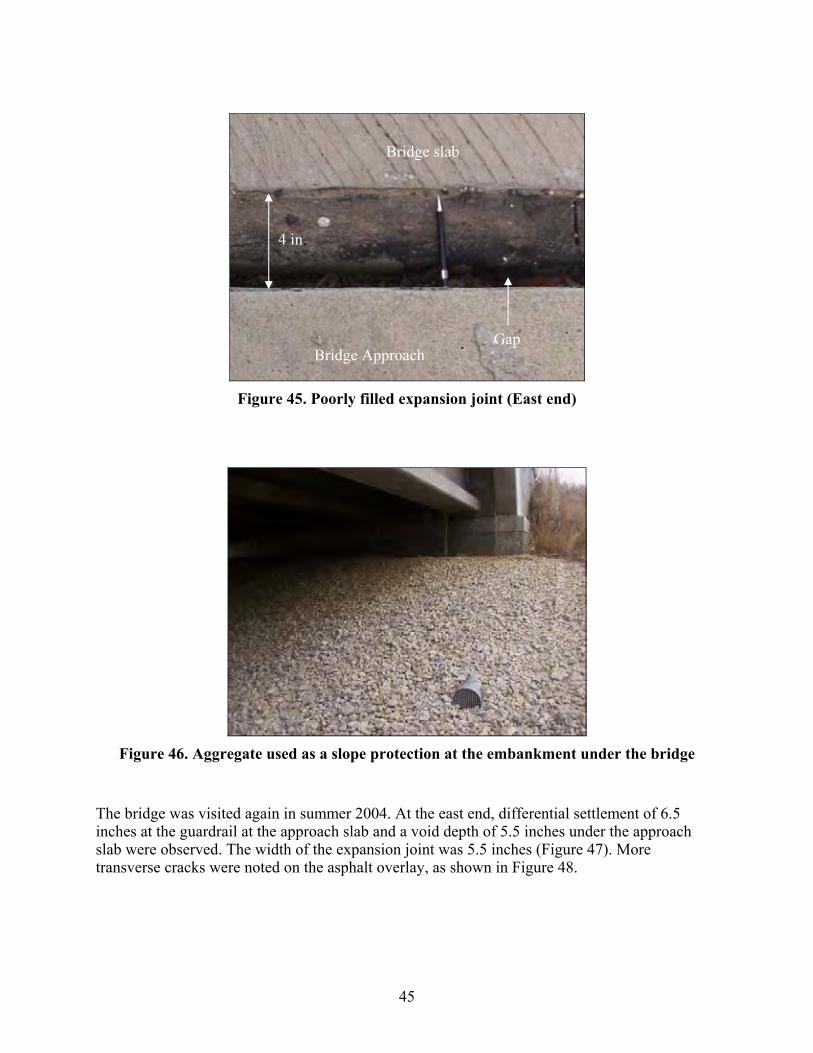
45
Figure 45. Poorly filled expansion joint (East end)
Figure 46. Aggregate used as a slope protection at the embankment under the bridge
The bridge was visited again in summer 2004. At the east end, differential settlement of 6.5 inches at the guardrail at the approach slab and a void depth of 5.5 inches under the approach slab were observed. The width of the expansion joint was 5.5 inches (Figure 47). More transverse cracks were noted on the asphalt overlay, as shown in Figure 48.
Gap
4 in.
Bridge Approach
Bridge slab

46
Figure 47. Poorly sealed expansion joint (East end)
Figure 48. Transverse cracks of asphalt overlay (East end)
At the west end, a void has developed under the approach slab. The void was 5.5 inches at the expansion joint and 4.5 inches at the end of the wingwall (Figure 49). Furthermore, soil erosion at the abutment side was observed (Figure 50). Soil near the abutment sides is silty sand and is considered highly erodible. An aggregate slope protection cover was used at the embankment under the bridge and appeared to be in good condition.
Recycled tire
bluffings used as
joint filler
Gap
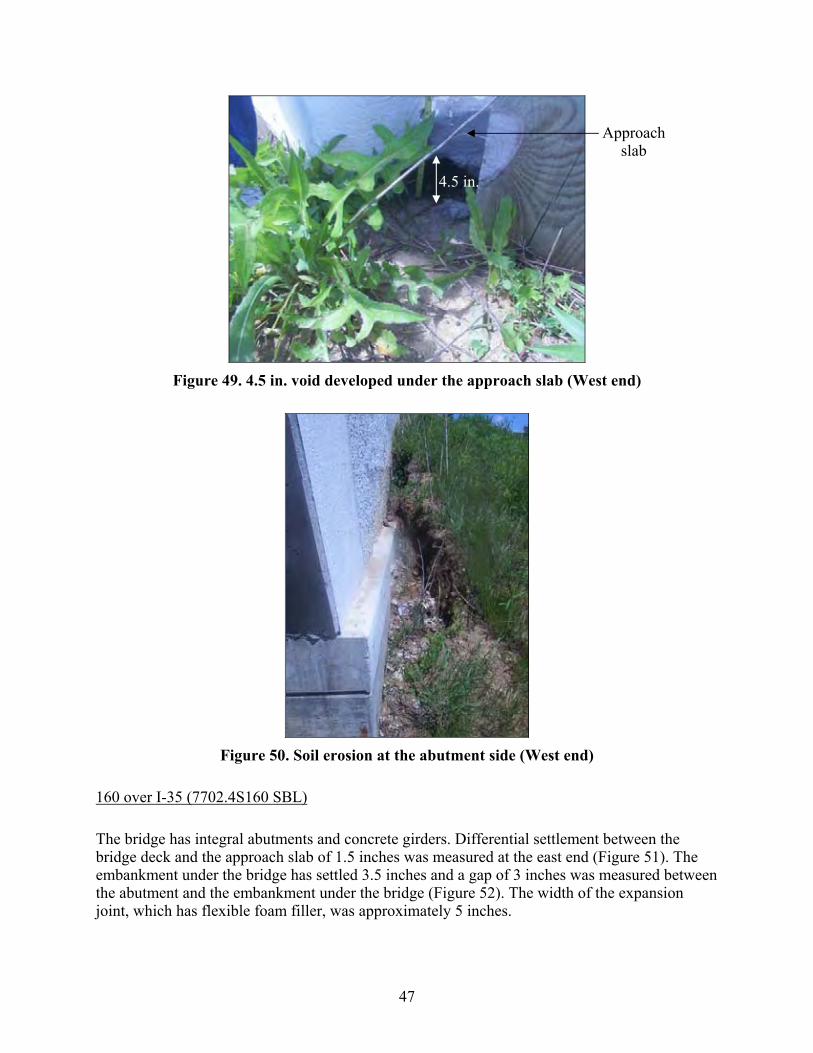
47
Figure 49. 4.5 in. void developed under the approach slab (West end)
Figure 50. Soil erosion at the abutment side (West end)
160 over I-35 (7702.4S160 SBL)
The bridge has integral abutments and concrete girders. Differential settlement between the bridge deck and the approach slab of 1.5 inches was measured at the east end (Figure 51). The embankment under the bridge has settled 3.5 inches and a gap of 3 inches was measured between the abutment and the embankment under the bridge (Figure 52). The width of the expansion joint, which has flexible foam filler, was approximately 5 inches.
Approach slab
4.5 in.
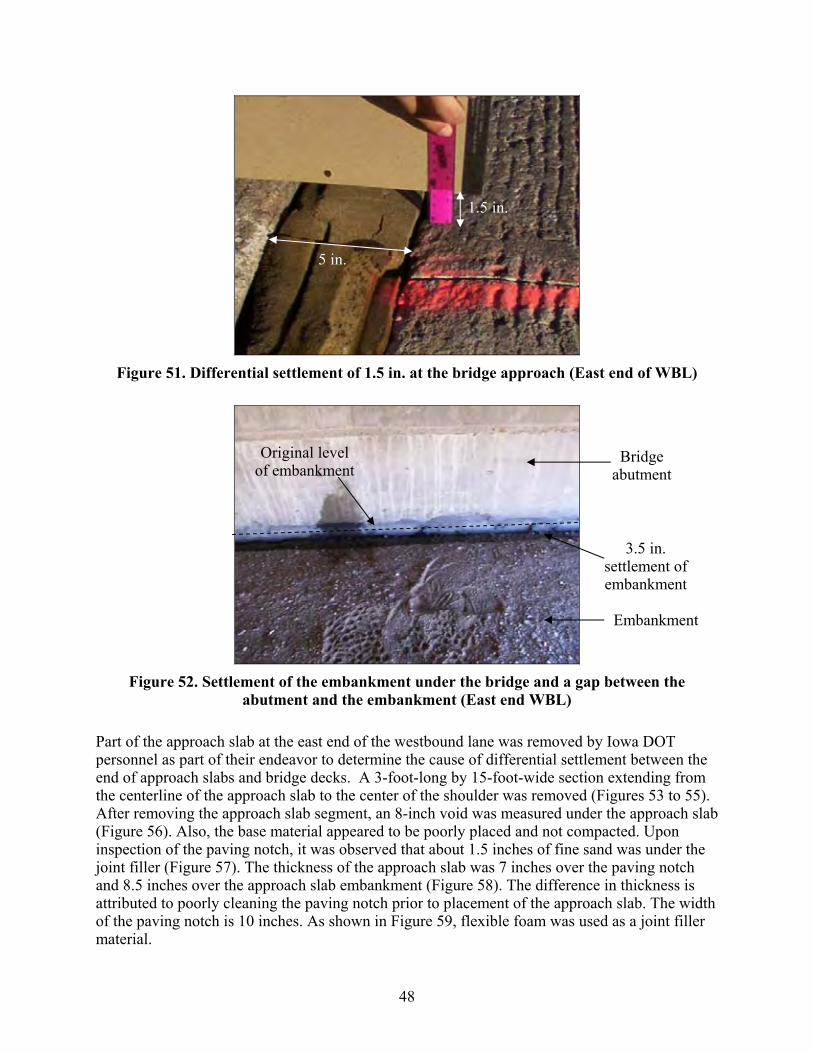
48
Figure 51. Differential settlement of 1.5 in. at the bridge approach (East end of WBL)
Figure 52. Settlement of the embankment under the bridge and a gap between the
abutment and the embankment (East end WBL)
Part of the approach slab at the east end of the westbound lane was removed by Iowa DOT personnel as part of their endeavor to determine the cause of differential settlement between the end of approach slabs and bridge decks. A 3-foot-long by 15-foot-wide section extending from the centerline of the approach slab to the center of the shoulder was removed (Figures 53 to 55). After removing the approach slab segment, an 8-inch void was measured under the approach slab (Figure 56). Also, the base material appeared to be poorly placed and not compacted. Upon inspection of the paving notch, it was observed that about 1.5 inches of fine sand was under the joint filler (Figure 57). The thickness of the approach slab was 7 inches over the paving notch and 8.5 inches over the approach slab embankment (Figure 58). The difference in thickness is attributed to poorly cleaning the paving notch prior to placement of the approach slab. The width of the paving notch is 10 inches. As shown in Figure 59, flexible foam was used as a joint filler material.
Bridge abutment
Embankment
Original level of embankment
5 in.
3.5 in. settlement of embankment
1.5 in.

49
Bridge
3 ft
15 ft
Expansion joint
Section of the approach slab removed
Shoulder
Bridge Approach
Direction of traffic
Figure 53. Top view of the bridge with the location of removed approach slab for
inspection
Figure 54. Section of the approach slab cut and ready to be removed

50
Figure 55. Removing a segment of the bridge approach
Figure 56. Eight-inch void observed under the approach slab
8 in.

51
Figure 57. Layer of fine sand covering the paving notch
Figure 58. Non-uniform approach slab thickness with 1.5 in. increase over the backfill
compared with the thickness over the paving notch
Difference in approach
slab thickness

52
Figure 59. Contaminated expansion joint

53
District 2
Fourteen bridges were inspected in District 2. Poor water management around the bridge abutment was a major problem observed. Table 9 summarizes the major observations made at the inspected bridges. Detailed observations for each bridge are discussed below. Hwy 33 over Hart Groves Creek (1293.7S033)
This bridge was constructed in 1984 and has three spans with integral abutments. Figure 60 shows 3 inches of differential settlement between the bridge slab and the bridge approach at the end of the south-west wingwall. Figure 61 shows concrete deterioration at the west end CF joint, as well as longitudinal cracks in the approach slab. A crack developed between the bridge approach and the wingwall due to the settlement of the approach relative to the wingwall. The width of the crack was 1.5 inches and extended to a length of 4.5 feet. No major erosion was observed at this bridge.
Figure 60. Differential settlement of 3 in. at the south-west corner
3 in. differential settlement

54
Table 9. Summary of major problems observed at district 2
Bridge No. Major Problems Hwy 33 over Hart
Groves Creek (1293.7S003)
• Differential settlement at the abutment wingwall • Cracking expansion joint
Hwy 14 over IANR Railroad (1270.2S014)
• Soil erosion of the embankment under the bridge • Cracking at the approach slab and expansion
joint
Hwy 18 over creek (3414.4R018)
• Void under the bridge approach slab • Soil erosion of the embankment under the bridge • Ponding of water on the embankment under the
bridge Hwy 18 over I&M
Railroad (3412.6L018) • Differential settlement at the abutment wingwall • Cracking of bridge slab
Hwy 18 over Railroad (3412.3L018)
• Dip in approach slab • Cracking of bridge slab
Hwy 18 over creek (3496.7L018)
• Differential settlement at the abutment wingwall and slab drop at bridge deck
• Concrete deterioration at expansion joint
Hwy 18 over UP Railraod (1783.6L018)
• Slab drop at bridge deck • Settlement of embankment under the bridge • Lateral movement of the abutment
I-35 over Beaver Dam Creek (1788.1R035) • Longitudinal cracks of bridge slab
I-35 over County Road B35 (1791.7R035) • No major problems observed
I-35 over City St. (1793.6R035)
• Significant damage to concrete slope protection • Gap between abutment and slope protection
Hwy 169 over E, Fork Des Moines River
(5596.2S169)
• Settlement of the embankment under the bridge • Grouting under approach slab
Hwy 169 over E, Fork Des Moines River
(5592.8S169)
• Cracks at the expansion joint • Grouting under approach slab • Soil erosion along the abutment sides
Hwy 169 over E, Fork Des Moines River
(5588.3S169) • Grouting under approach slab
Hwy 3 over Iowa River (9962.8S003)
• Cracking of bridge approach • Cracks observed at both ends of the bridge • Settlement of the embankment under the bridge

55
Figure 61. Concrete deterioration at the EF joint (West end)
Hwy 14 over IANR Railroad (1270.2S014)
This bridge is a three-span concrete slab bridge (Figure 62). Figure 63 shows erosion of the embankment under the bridge. Cracks were observed in the asphalt overlay around the expansion joint (Figure 64).
Figure 62. Concrete bridge with deep slab and no girders

56
Figure 63. Erosion of the embankment soil under the bridge
Figure 64. Cracked asphalt patch covering the expansion joint
Hwy 18 over Creek (3414.4R018)
This bridge has integral abutments and prestressed concrete girders. A two-inch void was observed under the bridge approach slab. In addition, erosion of the embankments under the bridge was observed. Figure 65 shows water ponding between the embankment and the abutment.
Original location of
the expansion
joint
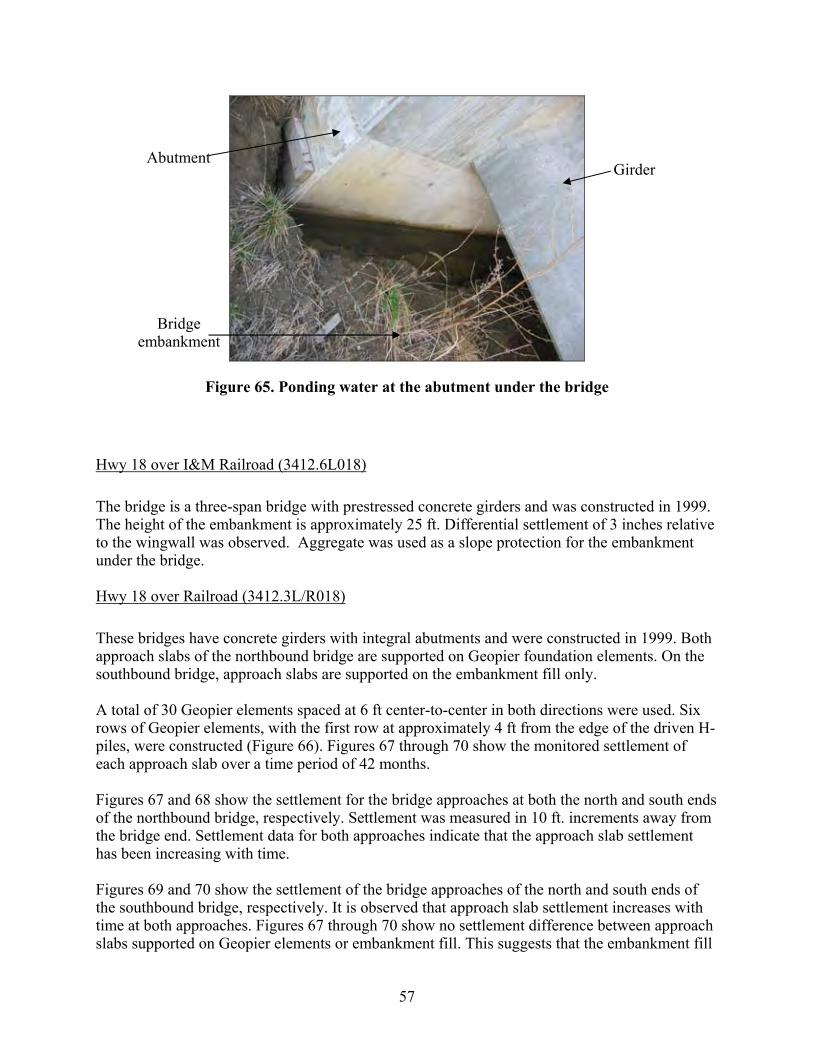
57
Figure 65. Ponding water at the abutment under the bridge
Hwy 18 over I&M Railroad (3412.6L018)
The bridge is a three-span bridge with prestressed concrete girders and was constructed in 1999. The height of the embankment is approximately 25 ft. Differential settlement of 3 inches relative to the wingwall was observed. Aggregate was used as a slope protection for the embankment under the bridge. Hwy 18 over Railroad (3412.3L/R018)
These bridges have concrete girders with integral abutments and were constructed in 1999. Both approach slabs of the northbound bridge are supported on Geopier foundation elements. On the southbound bridge, approach slabs are supported on the embankment fill only. A total of 30 Geopier elements spaced at 6 ft center-to-center in both directions were used. Six rows of Geopier elements, with the first row at approximately 4 ft from the edge of the driven H-piles, were constructed (Figure 66). Figures 67 through 70 show the monitored settlement of each approach slab over a time period of 42 months. Figures 67 and 68 show the settlement for the bridge approaches at both the north and south ends of the northbound bridge, respectively. Settlement was measured in 10 ft. increments away from the bridge end. Settlement data for both approaches indicate that the approach slab settlement has been increasing with time. Figures 69 and 70 show the settlement of the bridge approaches of the north and south ends of the southbound bridge, respectively. It is observed that approach slab settlement increases with time at both approaches. Figures 67 through 70 show no settlement difference between approach slabs supported on Geopier elements or embankment fill. This suggests that the embankment fill
Girder Abutment
Bridge embankment

58
is not the contributor to differential settlement and that perhaps settlement of the embankment foundation is the contributing factor.
16.1'14.1'
12.2'9.9'
7.9'5.9'
2.3'Special backfill
Figure 66. Profile of Geopier elements supporting bridge approach (Reproduced from Pitt
et al. 2003)
Distance away from the bridge (m)
0 5 10 15 20
Settl
emen
t (m
)
0.00
0.02
0.04
0.06
0.08
0.10
Distance away from the bridge (ft)
0 10 20 30 40 50 60
Settl
emen
t (ft)
0.00
0.05
0.10
0.15
0.20
0.25
0.30
61218244242 Right lane
Left lane
Months afterconstruction
Figure 67. Settlement of the approach slab supported on Geopier elements (North end of NB bridge)

59
Distance away from the bridge (m)
0 5 10 15 20
Settl
emen
t (m
)
0.00
0.02
0.04
0.06
0.08
Distance away from the bridge (ft)
0 10 20 30 40 50 60
Settl
emen
t (ft)
0.00
0.05
0.10
0.15
0.20
0.25
61218244242
Left lane
Right lane
Months afterconstruction
Figure 68. Settlement of the approach slab supported on Geopier elements (South end of NB bridge)
Distance away from the bridge (m)
0 5 10 15 20 25
Settl
emen
t (m
)
0.00
0.02
0.04
0.06
0.08
0.10
Distance away from the bridge (ft)
0 10 20 30 40 50 60 70 80
Settl
emen
t (ft)
0.00
0.05
0.10
0.15
0.20
0.25
0.30
61218244242
Left lane
Right lane
Months afterconstruction
Figure 69. Settlement of bridge approach supported on the embankment soil (North end of SB bridge)

60
Distance away from the bridge (m)
0 5 10 15 20
Settl
emen
t (m
)
0.00
0.02
0.04
0.06
0.08
0.10
Distance away from the bridge (ft)
0 10 20 30 40 50 60
Settl
emen
t (ft)
0.00
0.05
0.10
0.15
0.20
0.25
0.30
61218244242
Right lane
Left lane
Months afterconstruction
Figure 70. Settlement of bridge approach supported on embankment soil (South end of SB bridge)
Hwy 18 over Creek (3496.7L/R018)
This bridge has integral abutments and concrete girders. Figure 71 shows that the width of the expansion joint is about 5.5 inches. Recycled tire chips were used as filler material at the expansion joint. Deterioration of the concrete at the expansion joint was also observed. Figure 72 shows about 1 inch differential settlement between the approach slab and the bridge deck. In the summer 2003, profiles of all approach slabs were measured and are shown in Figures 73 and 74. All four approach slabs show nonlinear profiles indicating settlement of the approach slab. Approximately 3.9 inches of differential settlement was measured at the west end of the eastbound bridge approach at the end of the wingwall. The slopes of the eastbound lane approach slabs are -0.009 and 0.017 for the east end and west end, respectively, and -0.009 and 0.02 for the east and west end approach slabs of the westbound lane, respectively.
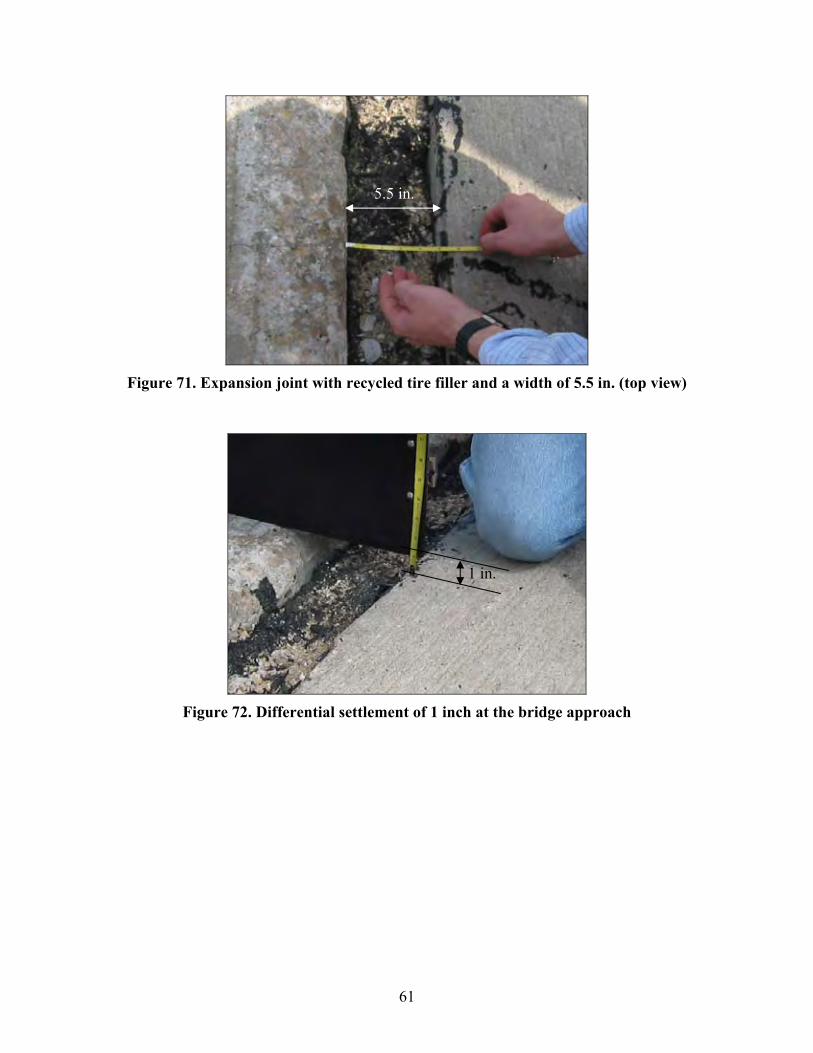
61
Figure 71. Expansion joint with recycled tire filler and a width of 5.5 in. (top view)
Figure 72. Differential settlement of 1 inch at the bridge approach
5.5 in.
1 in.
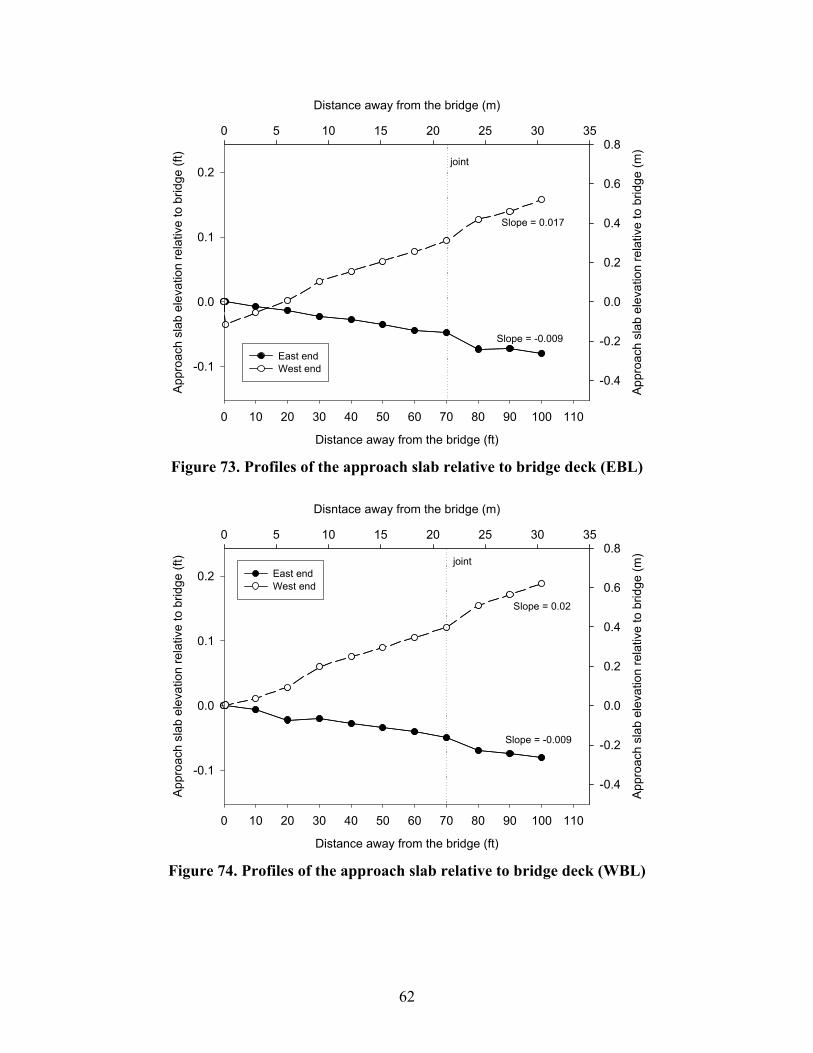
62
Distance away from the bridge (m)
0 5 10 15 20 25 30 35
App
roac
h sl
ab e
leva
tion
rela
tive
to b
ridge
(m)
-0.4
-0.2
0.0
0.2
0.4
0.6
0.8
Distance away from the bridge (ft)
0 10 20 30 40 50 60 70 80 90 100 110
App
roac
h sl
ab e
leva
tion
rela
tive
to b
ridge
(ft)
-0.1
0.0
0.1
0.2
East endWest end
joint
Slope = 0.017
Slope = -0.009
Figure 73. Profiles of the approach slab relative to bridge deck (EBL)
Disntace away from the bridge (m)
0 5 10 15 20 25 30 35
App
roac
h sl
ab e
leva
tion
rela
tive
to b
ridge
(m)
-0.4
-0.2
0.0
0.2
0.4
0.6
0.8
Distance away from the bridge (ft)
0 10 20 30 40 50 60 70 80 90 100 110
App
roac
h sl
ab e
leva
tion
rela
tive
to b
ridge
(ft)
-0.1
0.0
0.1
0.2 East endWest end
joint
Slope = -0.009
Slope = 0.02
Figure 74. Profiles of the approach slab relative to bridge deck (WBL)

63
Hwy 18 over Union Pacific Railroad (1783.6L018)
This bridge was constructed in 1997 and has integral abutments. According to maintenance reports, the approach slab was replaced in July 1999. Differential settlement between the approach slab and the bridge deck was approximately 1.5 inches. The rubber joint filler at the expansion joint was not sealing. The embankment under the bridge has a concrete slope protection. The embankment under the bridge has settled approximately 3.5 inches. A gap of about 1 inch between the embankment under the bridge and the abutment was measured. I-35 over Beaver Dam Creek (1788.1R035)
This bridge was constructed in 1976 with integral abutments. Currently, an asphalt resurfaced approach slab covers the expansion joint, as shown in Figure 75. According to the maintenance reports, the approach slab has been resurfaced more than once.
Figure 75. Asphalt overlay covering the expansion joint at the bridge approach
I-35 over County road B35 (1791.7R035)
This bridge was constructed in 1976 and is a three-span bridge with concrete girders and integral abutments. The approach slab was previously resurfaced with an asphalt overlay. Repairs were done to both the approach slab and the expansion joint. No soil erosion was observed under or around the bridge; however, water was observed running through the expansion joint. No bridge surface drain was observed. I-35 Over City Street (1793.6R035)
This bridge approach was also resurfaced with an asphalt overlay. The embankment has concrete slope protection. Figures 76 and 77 show damage of the concrete slope protection at the south
Original location of
the expansion
joint

64
end of the northbound lane. The depth of the void under the concrete slope protection was approximately 1.6 feet. Figure 78 shows the settlement of the embankment under the bridge. A gap was also observed between the abutment and embankment. The width of the gap between the abutment and the embankment was 6.5 in. In addition, water was running over the concrete slope protection, indicating poor drainage.
(a) Damaged slope protection (b) Closer image of the damaged concrete
Figure 76. Failure of slope protection due to loss of support (south end NBL)
Figure 77. Fractured concrete slope protection
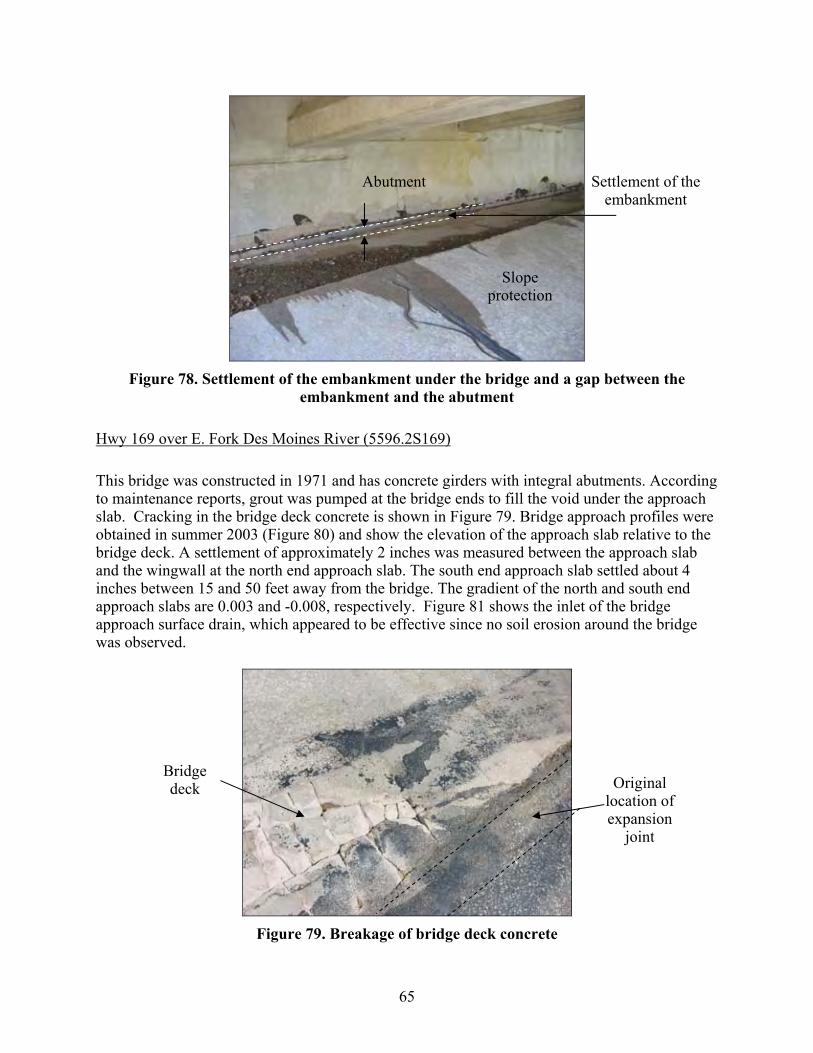
65
Figure 78. Settlement of the embankment under the bridge and a gap between the
embankment and the abutment
Hwy 169 over E. Fork Des Moines River (5596.2S169)
This bridge was constructed in 1971 and has concrete girders with integral abutments. According to maintenance reports, grout was pumped at the bridge ends to fill the void under the approach slab. Cracking in the bridge deck concrete is shown in Figure 79. Bridge approach profiles were obtained in summer 2003 (Figure 80) and show the elevation of the approach slab relative to the bridge deck. A settlement of approximately 2 inches was measured between the approach slab and the wingwall at the north end approach slab. The south end approach slab settled about 4 inches between 15 and 50 feet away from the bridge. The gradient of the north and south end approach slabs are 0.003 and -0.008, respectively. Figure 81 shows the inlet of the bridge approach surface drain, which appeared to be effective since no soil erosion around the bridge was observed.
Figure 79. Breakage of bridge deck concrete
Slope protection
Abutment Settlement of the embankment
Original location of expansion
joint
Bridge deck
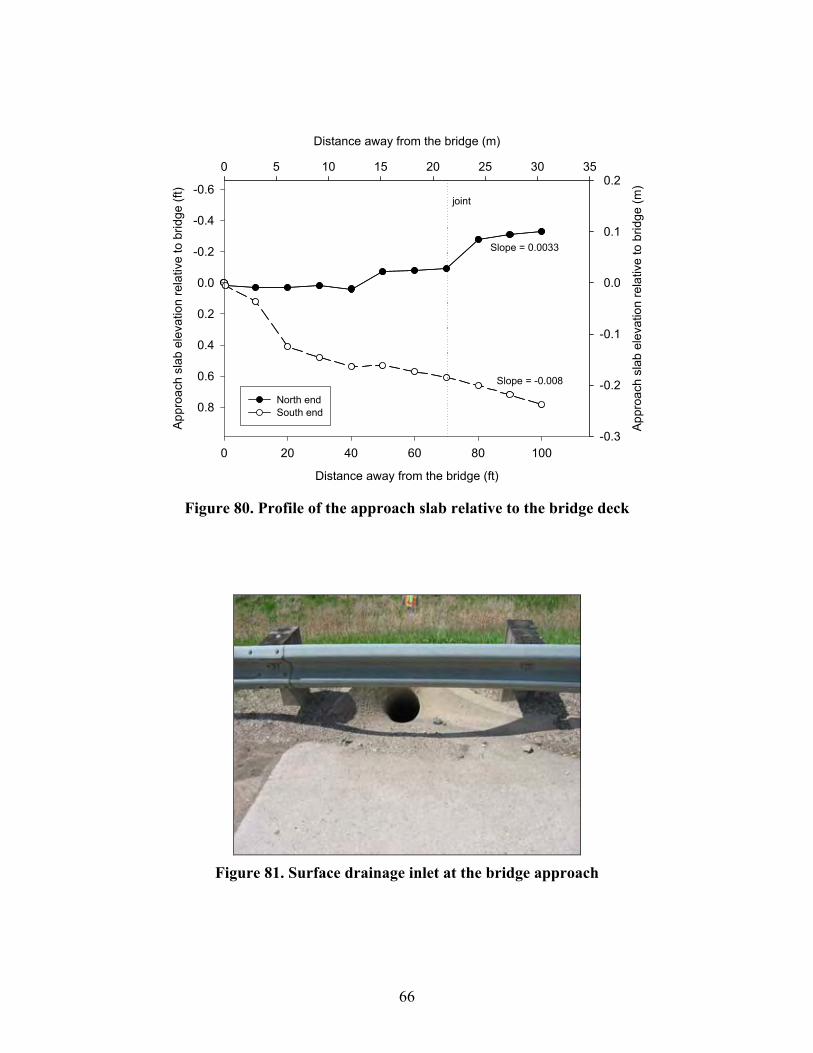
66
Distance away from the bridge (m)
0 5 10 15 20 25 30 35
Appr
oach
sla
b el
evat
ion
rela
tive
to b
ridge
(m)
-0.3
-0.2
-0.1
0.0
0.1
0.2
Distance away from the bridge (ft)
0 20 40 60 80 100
Appr
oach
sla
b el
evat
ion
rela
tive
to b
ridge
(ft) -0.6
-0.4
-0.2
0.0
0.2
0.4
0.6
0.8North endSouth end
joint
Slope = 0.0033
Slope = -0.008
Figure 80. Profile of the approach slab relative to the bridge deck
Figure 81. Surface drainage inlet at the bridge approach

67
Hwy 169 over E. Fork of the Des Moines River (5592.8S169)
This bridge was constructed in 1971 and has concrete girders with integral abutments. The approach slab was resurfaced with an asphalt overlay. Cracks were observed at the expansion joints at the south end of the bridge. Soil erosion along the sides of the abutment was also observed, but no soil erosion of the embankment under the bridge was noted. Figure 82 shows the profiles of the bridge approaches over a distance of 100 ft. at the centerline of both the north and the south ends of the bridge, measured in summer of 2003. The south end approach slab settled about 3 in. between 10 and 20 ft. away from the bridge. The slopes of the north and south end approach slabs are 0.006 and -0.005, respectively.
Distance away from the bridge (m)
0 5 10 15 20 25 30 35
App
roac
h sl
ab e
leva
tion
rela
tive
to b
ridge
(m)
-0.2
-0.1
0.0
0.1
0.2
Distance away from the bridge (ft)
0 10 20 30 40 50 60 70 80 90 100 110
Appr
oach
sla
b el
evat
ion
rela
tive
to b
ridge
(ft)
-0.8
-0.6
-0.4
-0.2
0.0
0.2
0.4
0.6
North endSouth end
jointSlope = 0.006
Slope = -0.005
Figure 82. Profile of the bridge approach relative to bridge slab
Hwy 169 over E. Fork of the Des Moines River (5588.3S169)
This bridge has integral abutments and concrete girders. Similar to the previous two bridges, cracks developed at the bridge slab (Figure 83). No soil erosion was observed at the embankment under the bridge; however, erosion along the abutment sides was visible.
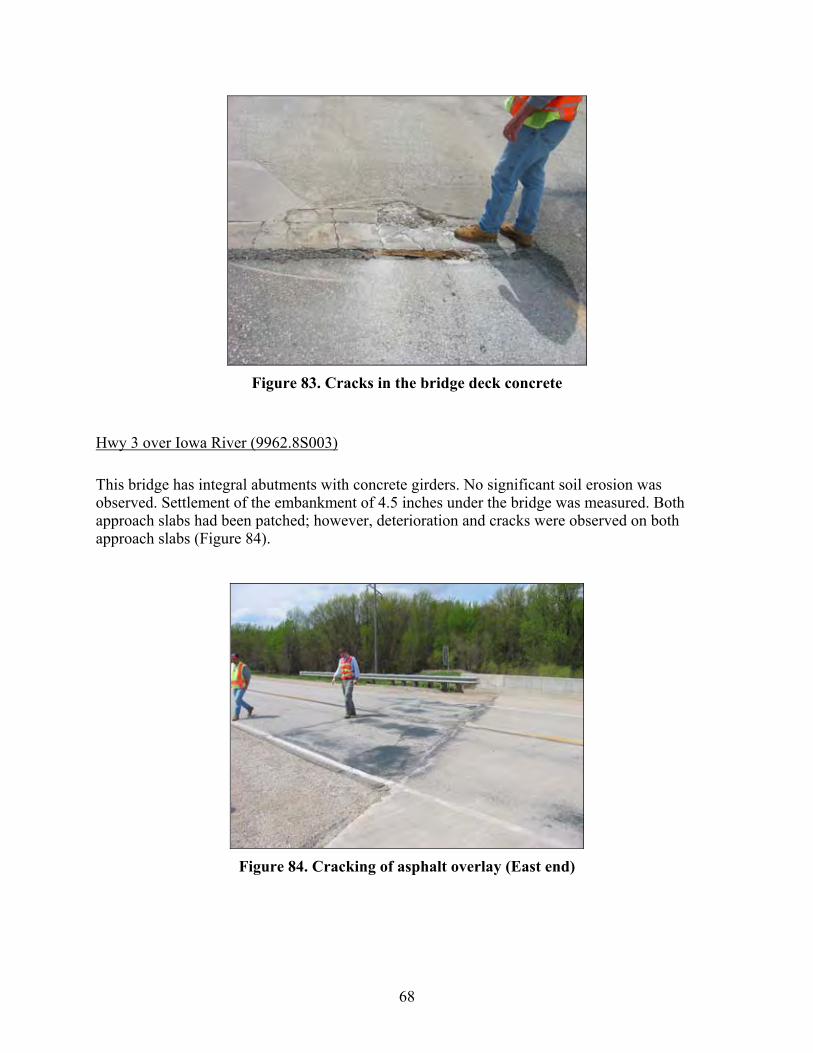
68
Figure 83. Cracks in the bridge deck concrete
Hwy 3 over Iowa River (9962.8S003)
This bridge has integral abutments with concrete girders. No significant soil erosion was observed. Settlement of the embankment of 4.5 inches under the bridge was measured. Both approach slabs had been patched; however, deterioration and cracks were observed on both approach slabs (Figure 84).
Figure 84. Cracking of asphalt overlay (East end)
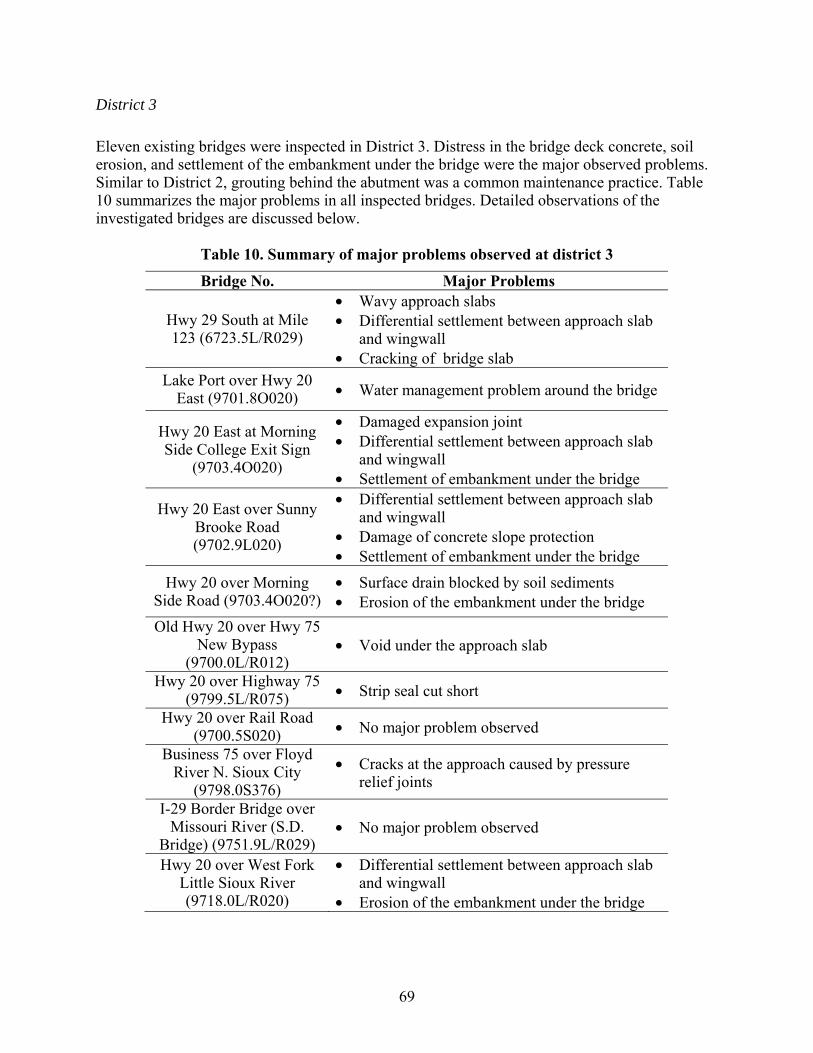
69
District 3
Eleven existing bridges were inspected in District 3. Distress in the bridge deck concrete, soil erosion, and settlement of the embankment under the bridge were the major observed problems. Similar to District 2, grouting behind the abutment was a common maintenance practice. Table 10 summarizes the major problems in all inspected bridges. Detailed observations of the investigated bridges are discussed below.
Table 10. Summary of major problems observed at district 3
Bridge No. Major Problems
Hwy 29 South at Mile 123 (6723.5L/R029)
• Wavy approach slabs • Differential settlement between approach slab
and wingwall • Cracking of bridge slab
Lake Port over Hwy 20 East (9701.8O020) • Water management problem around the bridge
Hwy 20 East at Morning Side College Exit Sign
(9703.4O020)
• Damaged expansion joint • Differential settlement between approach slab
and wingwall • Settlement of embankment under the bridge
Hwy 20 East over Sunny Brooke Road (9702.9L020)
• Differential settlement between approach slab and wingwall
• Damage of concrete slope protection • Settlement of embankment under the bridge
Hwy 20 over Morning Side Road (9703.4O020?)
• Surface drain blocked by soil sediments • Erosion of the embankment under the bridge
Old Hwy 20 over Hwy 75 New Bypass
(9700.0L/R012) • Void under the approach slab
Hwy 20 over Highway 75 (9799.5L/R075) • Strip seal cut short
Hwy 20 over Rail Road (9700.5S020) • No major problem observed
Business 75 over Floyd River N. Sioux City
(9798.0S376) • Cracks at the approach caused by pressure
relief joints
I-29 Border Bridge over Missouri River (S.D.
Bridge) (9751.9L/R029) • No major problem observed
Hwy 20 over West Fork Little Sioux River (9718.0L/R020)
• Differential settlement between approach slab and wingwall
• Erosion of the embankment under the bridge

70
Hwy 29 South at Mile 123 (6723.5L/R029)
This bridge was constructed in 1960. The approach slab had been recently replaced for the south bound bridge lanes and no major problems were observed (Figure 85). Approach slabs for the north bound bridge were resurfaced with asphalt overlays at both ends. However, wavy approach slabs, longitudinal cracks, and differential settlement of 4 inches relative to the wingwall were observed at both ends (Figures 86 to 88). Figure 88 shows differential settlement and cracks at the bridge slab. The cracks were similar to the ones observed at District 2 (See Bridge no. 5596S169). Figure 88 also shows an asphalt patch that was placed over the crack at the bridge slab while inspecting the bridge.
Figure 85. Recently replaced bridge approach slab (SBL)

71
Figure 86. Significant damage of the asphalt overlay on the approach slab (NBL)
Figure 87. Wavy approach slab (NBL)

72
(a) Cracks on the bridge deck (b) Asphalt patch covering the cracks
Figure 88. Asphalt patch placed over cracked bridge slab (NBL)
Lake Port over Hwy 20 East (9701.8O020)
This bridge was constructed in 1977 and has non-integral abutments with concrete girders and concrete approaches. The joints and the approaches were in good condition. Aggregate covered the embankments under the bridges. No major problems were observed at this site. Hwy 20 East at Morning Side College Exit Sign (9703.4O020)
This bridge has an integral abutment and concrete girders. Damage to the expansion joint and 2-inch differential settlement, which was measured at the expansion joint, were observed (Figure 89). The bridge has an asphalt overlay. The slope protection at the embankment under the bridge settled about 3 inches relative to the abutment. Grout, which was pumped to fill the void developed under the approach slab, was observed seeping out between the concrete panels of the slope protection (Figure 90). This suggests that the void extended under the abutment.
Figure 89. Differential settlement between bridge slab and bridge approach
Bridge slab
Bridge approach
2 in. settlement
of approach slab

73
Figure 90. Grout observed on the concrete slope protection overlay indicating that void
extended under the abutment
Hwy 20 East over Sunny Brooke Road (9702.9L020)
This bridge has integral abutments and concrete girders. The embankments under the bridge had a slope protection. The expansion joint at this bridge was 2 inches wide. Figure 91 shows the 4 inches of differential settlement measured between the bridge deck and the shoulder of the bridge approach. This figure also shows alligator cracking at the bridge shoulder. Grout was pumped behind the abutment at the west end of the eastbound lane and under the embankment slope protection cover. The concrete slope protection settled about 6.5 inches relative to the abutment (Figures 92 and 93).
Figure 91. Differential settlement between the bridge deck and the approach slab
Grout
Bridge embankment
Abutment
4 in. differential settlement
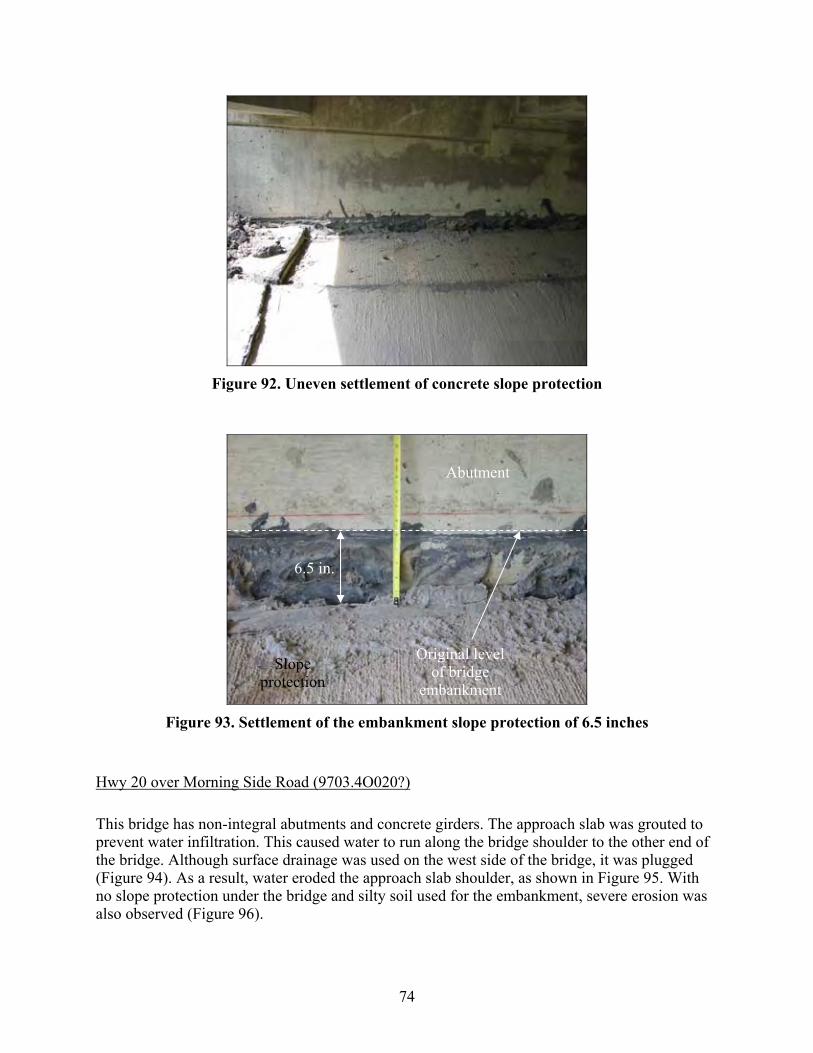
74
Figure 92. Uneven settlement of concrete slope protection
Figure 93. Settlement of the embankment slope protection of 6.5 inches
Hwy 20 over Morning Side Road (9703.4O020?)
This bridge has non-integral abutments and concrete girders. The approach slab was grouted to prevent water infiltration. This caused water to run along the bridge shoulder to the other end of the bridge. Although surface drainage was used on the west side of the bridge, it was plugged (Figure 94). As a result, water eroded the approach slab shoulder, as shown in Figure 95. With no slope protection under the bridge and silty soil used for the embankment, severe erosion was also observed (Figure 96).
Original level of bridge
embankment
Abutment
Slope protection
6.5 in.
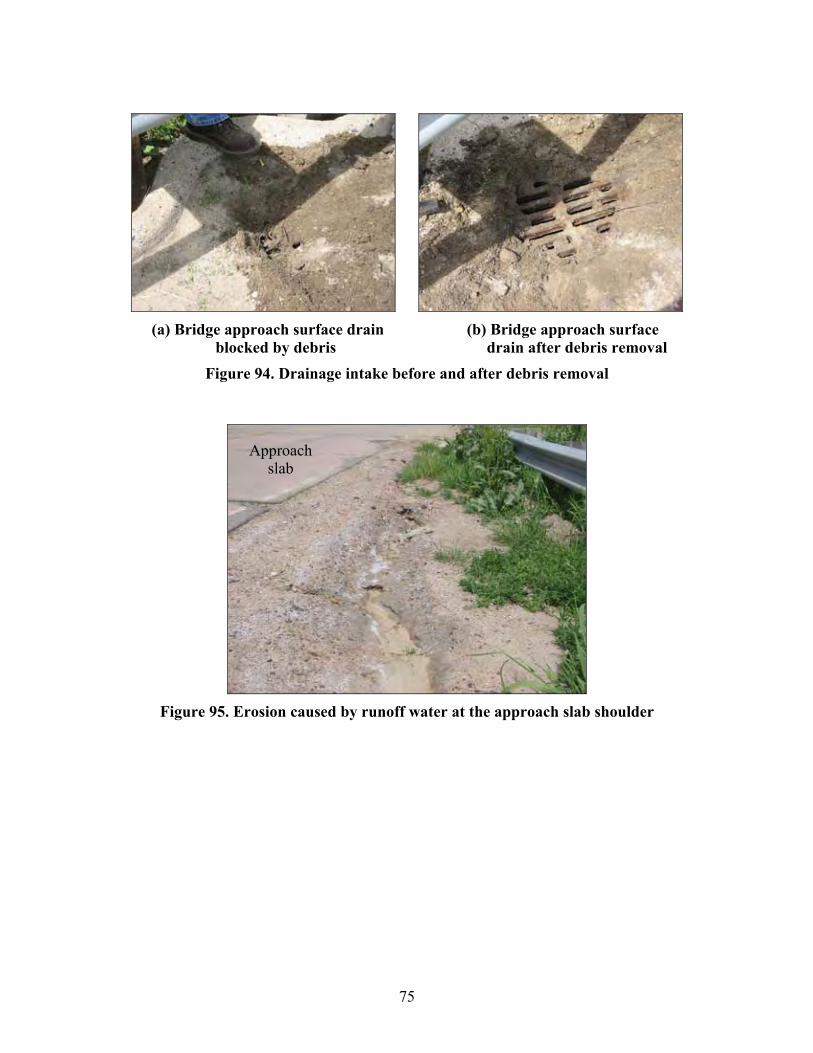
75
(a) Bridge approach surface drain (b) Bridge approach surface
blocked by debris drain after debris removal Figure 94. Drainage intake before and after debris removal
Figure 95. Erosion caused by runoff water at the approach slab shoulder
Approach slab
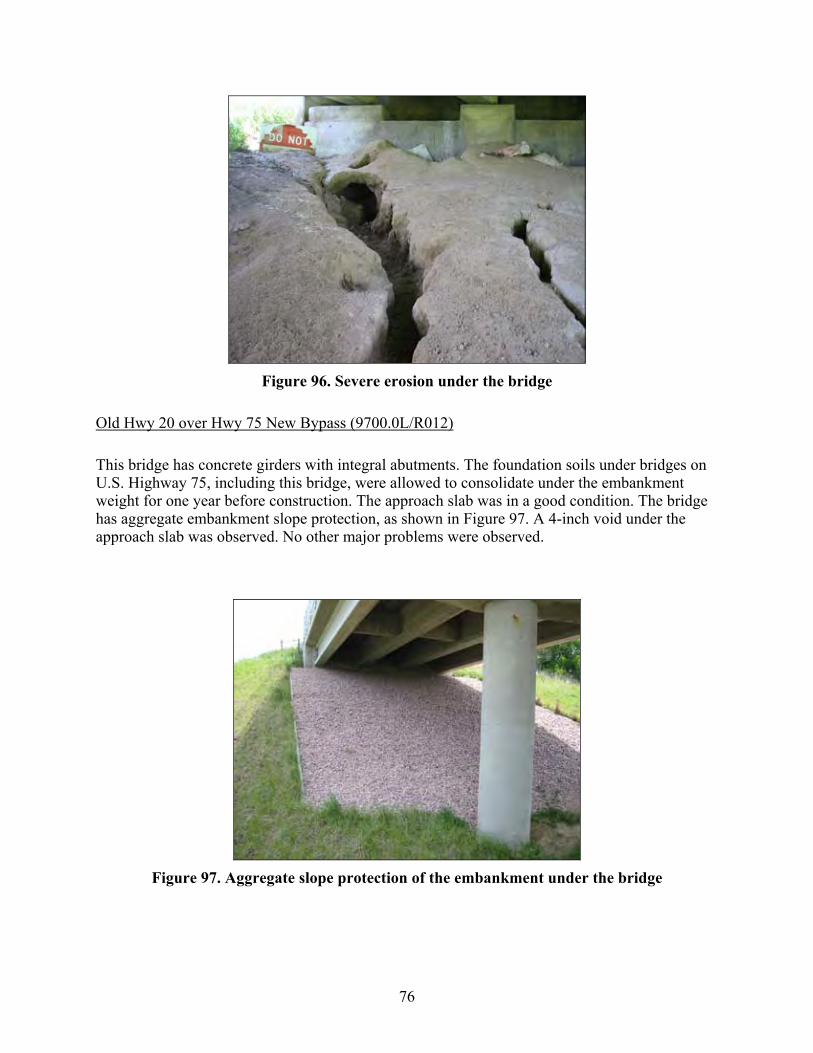
76
Figure 96. Severe erosion under the bridge
Old Hwy 20 over Hwy 75 New Bypass (9700.0L/R012)
This bridge has concrete girders with integral abutments. The foundation soils under bridges on U.S. Highway 75, including this bridge, were allowed to consolidate under the embankment weight for one year before construction. The approach slab was in a good condition. The bridge has aggregate embankment slope protection, as shown in Figure 97. A 4-inch void under the approach slab was observed. No other major problems were observed.
Figure 97. Aggregate slope protection of the embankment under the bridge

77
Hwy 20 over Highway 75 (9799.5L/R075)
The bridge was constructed in 2000 with non-integral abutments. The foundation soils at this bridge were allowed to consolidate under the embankment weight for one year prior to construction. No differential settlement was observed at the approach slabs. Erosion of the soil under the bridge was observed because the strip seal of the expansion join was cut short at both sides of the north bound lane, causing water to run down the sides of the bridge (Figures 98 and 99). At the opposite end of the bridge, the same strip seal problem was noticed and erosion of the embankment soil was observed.
Figure 98. Soil erosion of the embankment under the bridge
Figure 99. Top view of the strip seal cut short (North bound)
Bridge guardrail
Approach slab guardrail
Strip seal
Soil

78
Hwy 20 over Rail Road (9700.5S020)
This bridge has non-integral abutments and steel girders. A finger joint was used at the end of the bridge, as shown in Figure 100. The foundation soil was allowed to consolidate under the embankment weight for one year before construction. The embankment under the bridge has aggregate slope protection. No major problems were observed at this bridge.
Figure 100. Finger type joint
Business 75 over Floyd River N. Sioux City (9798.0S376)
This bridge was constructed in the 1960s and has steel girders with non-integral abutments. Longitudinal and transverse cracks were visible on the approach slab. Figure 101 shows the aggregate that was used as a slope protection under the bridge. After overlaying the approach slab with asphalt, which also covered the expansion joint, a pressure relief joint was made by cutting the approach slab. More pressure relief joints were made as previous joints were deemed non-functional due to debris. The additional joints provide opportunity for water to infiltrate into the subgrade under the approach slab (Figure 102).

79
Figure 101. Aggregate used as embankment slope protection
Figure 102. Pressure relief joints cut at the approach slab
Hwy 20 over West Fork Little Sioux River (9718.0L/R020)
This bridge has steel girders with non-integral abutments. About 2 inches of settlement of the approach slab was measured at the wingwall. Although the soil of the embankment was silty, no embankment slope protection was used under the bridge. As a result, soil erosion was observed, as shown in Figure 103.
Pressure relief joints
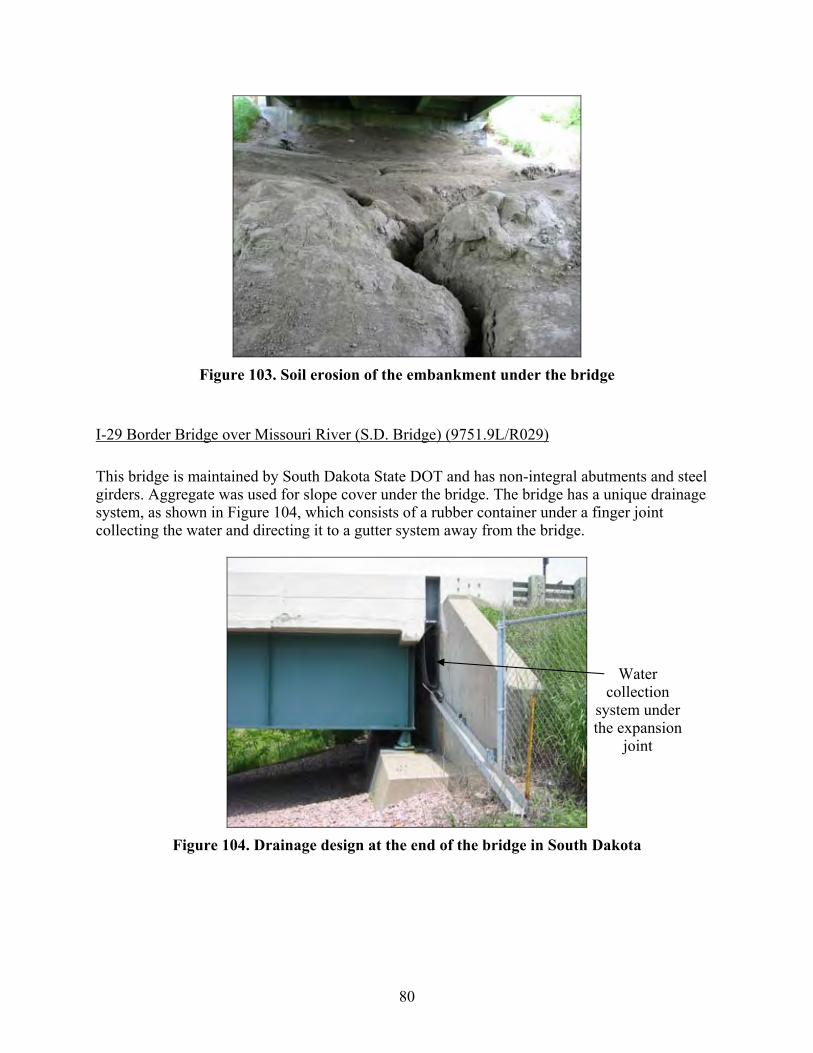
80
Figure 103. Soil erosion of the embankment under the bridge
I-29 Border Bridge over Missouri River (S.D. Bridge) (9751.9L/R029)
This bridge is maintained by South Dakota State DOT and has non-integral abutments and steel girders. Aggregate was used for slope cover under the bridge. The bridge has a unique drainage system, as shown in Figure 104, which consists of a rubber container under a finger joint collecting the water and directing it to a gutter system away from the bridge.
Figure 104. Drainage design at the end of the bridge in South Dakota
Water collection
system under the expansion
joint

81
District 4
Eleven bridges were inspected in District 4. The main observed problems were soil erosion and excessive settlement of the embankments under the bridges and approach slabs. Table 11 summarizes the observations made for District 4 bridges. Detailed descriptions of the problems observed at all inspected bridges are described below. I-80 (0183.6S080)
This is a three-span steel bridge with non-integral abutments. Differential settlement of about 4 inches was observed between the approach slab and wingwall. In addition, damage to the expansion joints was noted. Furthermore, soil erosion under the abutment was observed, which led to the exposure of H-piles supporting the abutment (Figure 105). No slope protection was used for the embankment under the bridge. In addition, it was observed that the approach slab panels were shaking under the impact of traffic loads, indicating a void under the approach slab.
Figure 105. Exposed H-pile caused by soil erosion under the abutment
Exposed Pile
Abutment
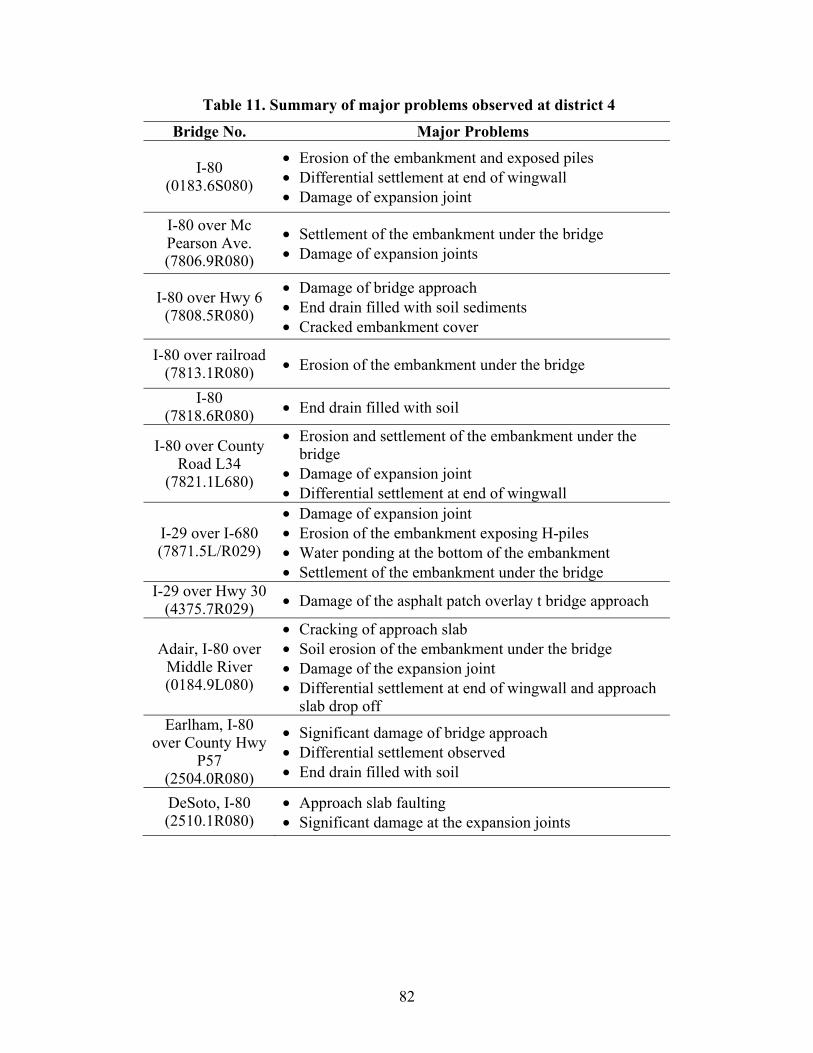
82
Table 11. Summary of major problems observed at district 4
Bridge No. Major Problems
I-80 (0183.6S080)
• Erosion of the embankment and exposed piles • Differential settlement at end of wingwall • Damage of expansion joint
I-80 over Mc Pearson Ave. (7806.9R080)
• Settlement of the embankment under the bridge • Damage of expansion joints
I-80 over Hwy 6 (7808.5R080)
• Damage of bridge approach • End drain filled with soil sediments • Cracked embankment cover
I-80 over railroad (7813.1R080) • Erosion of the embankment under the bridge
I-80 (7818.6R080) • End drain filled with soil
I-80 over County Road L34
(7821.1L680)
• Erosion and settlement of the embankment under the bridge
• Damage of expansion joint • Differential settlement at end of wingwall
I-29 over I-680 (7871.5L/R029)
• Damage of expansion joint • Erosion of the embankment exposing H-piles • Water ponding at the bottom of the embankment • Settlement of the embankment under the bridge
I-29 over Hwy 30 (4375.7R029) • Damage of the asphalt patch overlay t bridge approach
Adair, I-80 over Middle River (0184.9L080)
• Cracking of approach slab • Soil erosion of the embankment under the bridge • Damage of the expansion joint • Differential settlement at end of wingwall and approach
slab drop off Earlham, I-80
over County Hwy P57
(2504.0R080)
• Significant damage of bridge approach • Differential settlement observed • End drain filled with soil
DeSoto, I-80 (2510.1R080)
• Approach slab faulting • Significant damage at the expansion joints
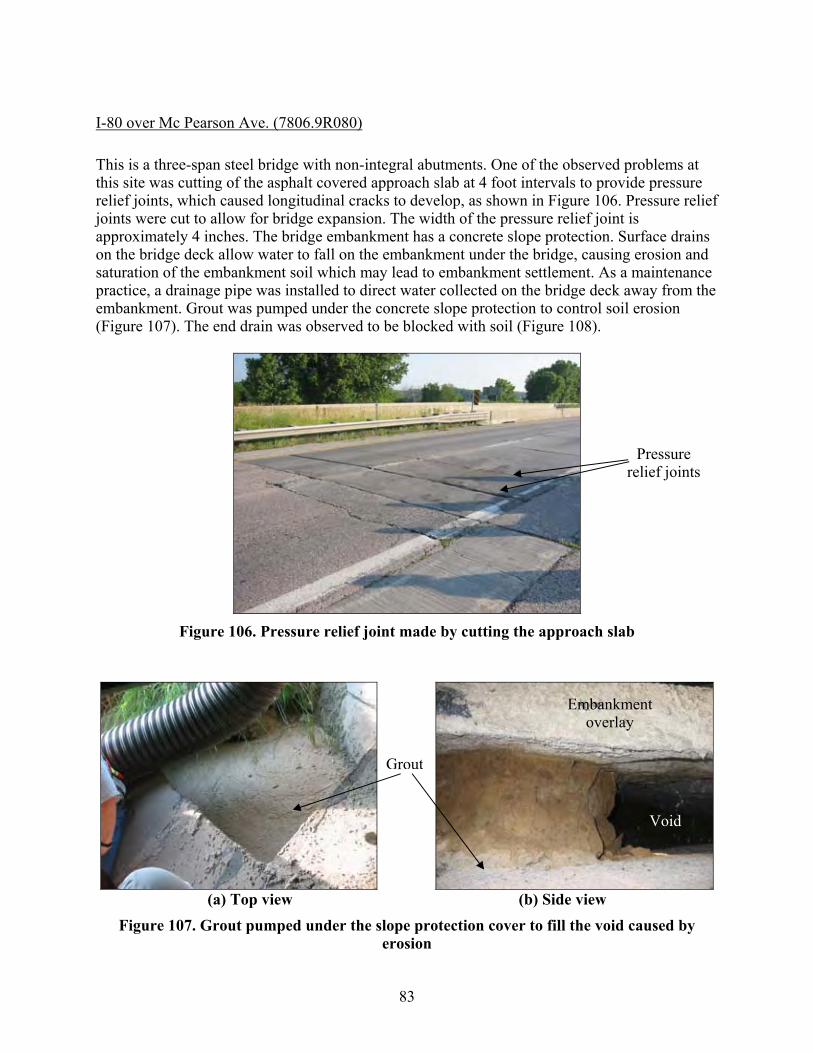
83
I-80 over Mc Pearson Ave. (7806.9R080)
This is a three-span steel bridge with non-integral abutments. One of the observed problems at this site was cutting of the asphalt covered approach slab at 4 foot intervals to provide pressure relief joints, which caused longitudinal cracks to develop, as shown in Figure 106. Pressure relief joints were cut to allow for bridge expansion. The width of the pressure relief joint is approximately 4 inches. The bridge embankment has a concrete slope protection. Surface drains on the bridge deck allow water to fall on the embankment under the bridge, causing erosion and saturation of the embankment soil which may lead to embankment settlement. As a maintenance practice, a drainage pipe was installed to direct water collected on the bridge deck away from the embankment. Grout was pumped under the concrete slope protection to control soil erosion (Figure 107). The end drain was observed to be blocked with soil (Figure 108).
Figure 106. Pressure relief joint made by cutting the approach slab
(a) Top view (b) Side view
Figure 107. Grout pumped under the slope protection cover to fill the void caused by erosion
Embankment overlay
Grout
Pressure relief joints
Void
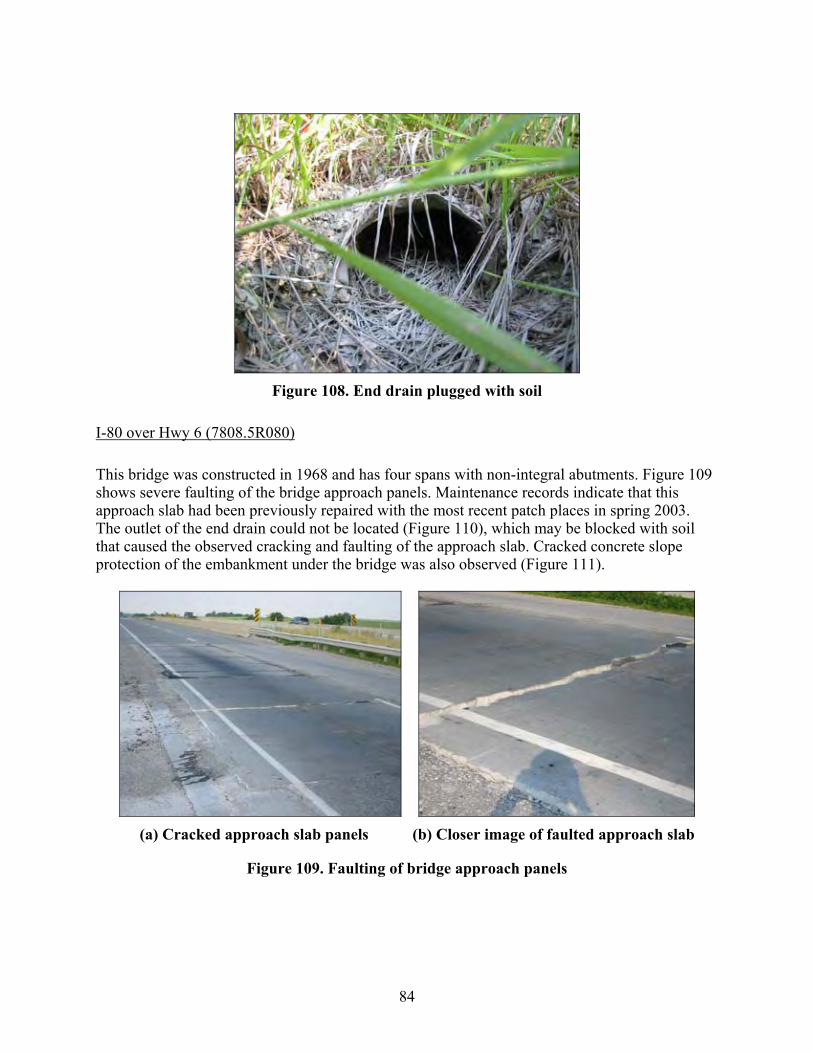
84
Figure 108. End drain plugged with soil
I-80 over Hwy 6 (7808.5R080)
This bridge was constructed in 1968 and has four spans with non-integral abutments. Figure 109 shows severe faulting of the bridge approach panels. Maintenance records indicate that this approach slab had been previously repaired with the most recent patch places in spring 2003. The outlet of the end drain could not be located (Figure 110), which may be blocked with soil that caused the observed cracking and faulting of the approach slab. Cracked concrete slope protection of the embankment under the bridge was also observed (Figure 111).
(a) Cracked approach slab panels (b) Closer image of faulted approach slab
Figure 109. Faulting of bridge approach panels
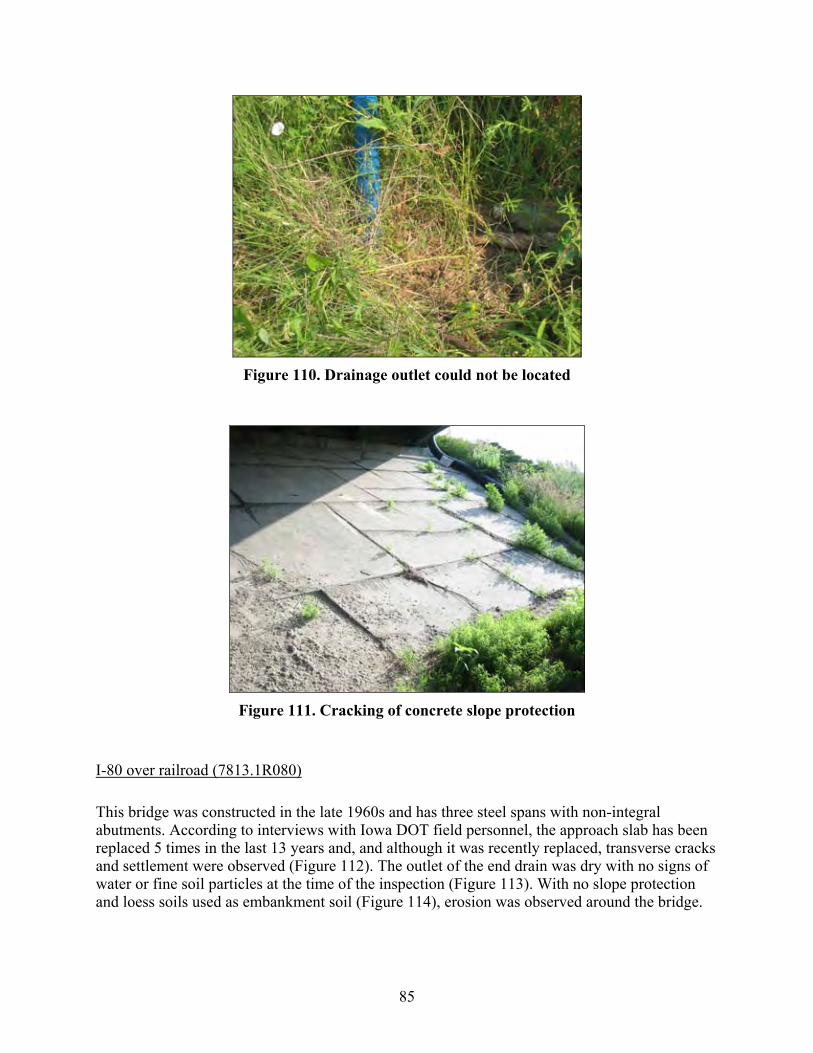
85
Figure 110. Drainage outlet could not be located
Figure 111. Cracking of concrete slope protection
I-80 over railroad (7813.1R080)
This bridge was constructed in the late 1960s and has three steel spans with non-integral abutments. According to interviews with Iowa DOT field personnel, the approach slab has been replaced 5 times in the last 13 years and, and although it was recently replaced, transverse cracks and settlement were observed (Figure 112). The outlet of the end drain was dry with no signs of water or fine soil particles at the time of the inspection (Figure 113). With no slope protection and loess soils used as embankment soil (Figure 114), erosion was observed around the bridge.
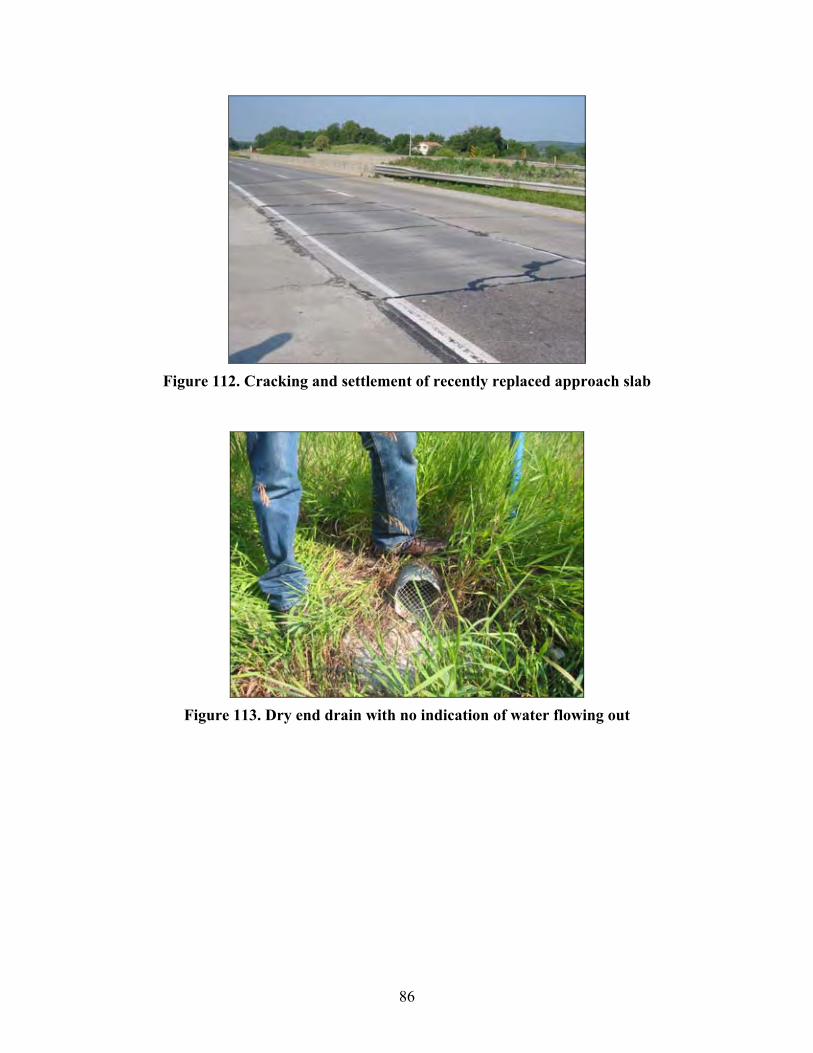
86
Figure 112. Cracking and settlement of recently replaced approach slab
Figure 113. Dry end drain with no indication of water flowing out
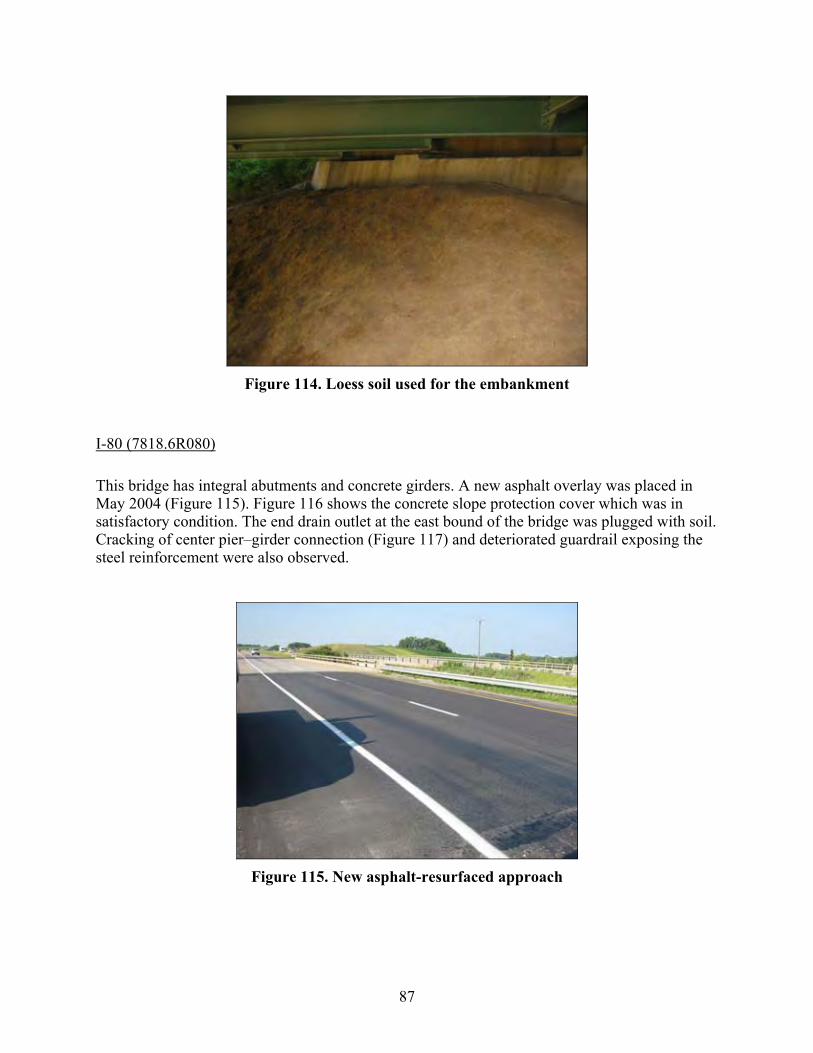
87
Figure 114. Loess soil used for the embankment
I-80 (7818.6R080)
This bridge has integral abutments and concrete girders. A new asphalt overlay was placed in May 2004 (Figure 115). Figure 116 shows the concrete slope protection cover which was in satisfactory condition. The end drain outlet at the east bound of the bridge was plugged with soil. Cracking of center pier–girder connection (Figure 117) and deteriorated guardrail exposing the steel reinforcement were also observed.
Figure 115. New asphalt-resurfaced approach
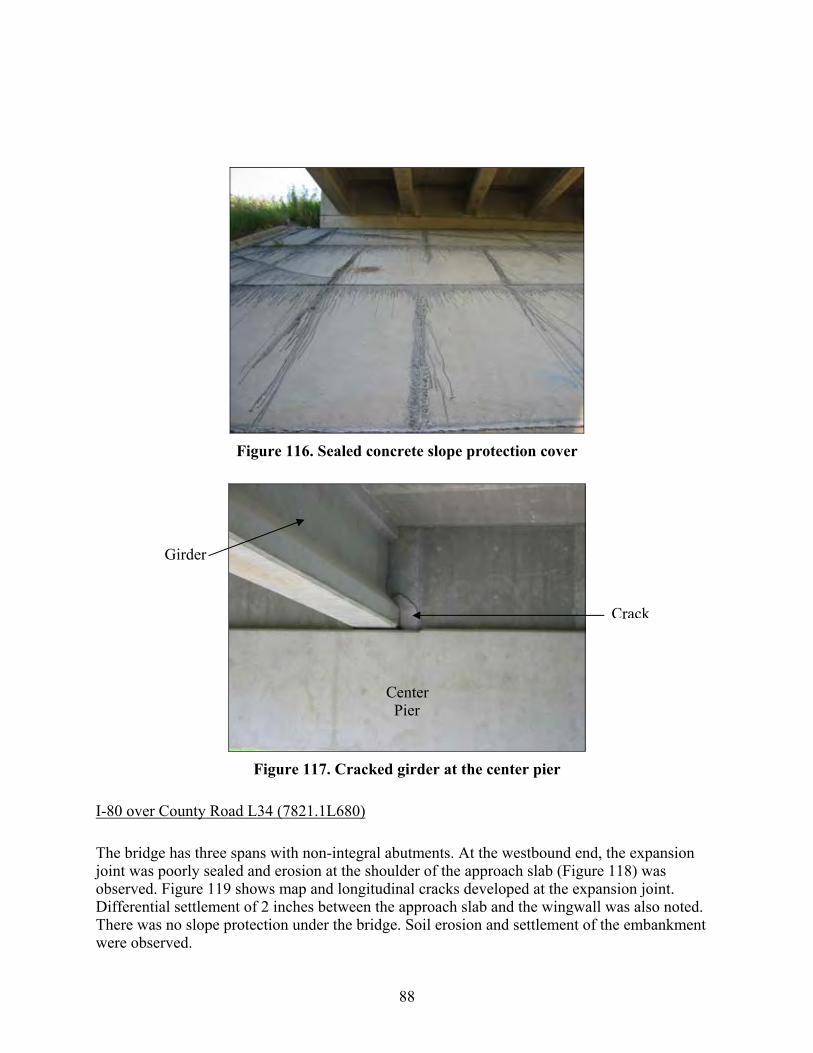
88
Figure 116. Sealed concrete slope protection cover
Figure 117. Cracked girder at the center pier
I-80 over County Road L34 (7821.1L680)
The bridge has three spans with non-integral abutments. At the westbound end, the expansion joint was poorly sealed and erosion at the shoulder of the approach slab (Figure 118) was observed. Figure 119 shows map and longitudinal cracks developed at the expansion joint. Differential settlement of 2 inches between the approach slab and the wingwall was also noted. There was no slope protection under the bridge. Soil erosion and settlement of the embankment were observed.
Girder
Crack
Center Pier

89
Figure 118. Failure at the shoulder of the approach slab (WBL)
Figure 119. Various cracking at the bridge approach (EBL)
I-29 over I-680 (7871.5L/R029)
This bridge has integral abutments and concrete girders. Damage of the expansion joint was visible. Figure 120 shows the bridge surface drain at the northbound lane. This figure illustrates that no drainage pipe was used to direct the water collected on the bridge deck away from the embankment, which may have caused soil erosion under the concrete slope protection. Excessive erosion led to failure of the slope protection at both ends of the bridge and the exposure of H-piles supporting the abutments (Figures 121 and 122). Settlement of the embankment under the bridge at the southbound lane of 10.5 inches was measured (Figure 123). Ponding water was observed at the bottom of the bridge embankment (Figure 124).
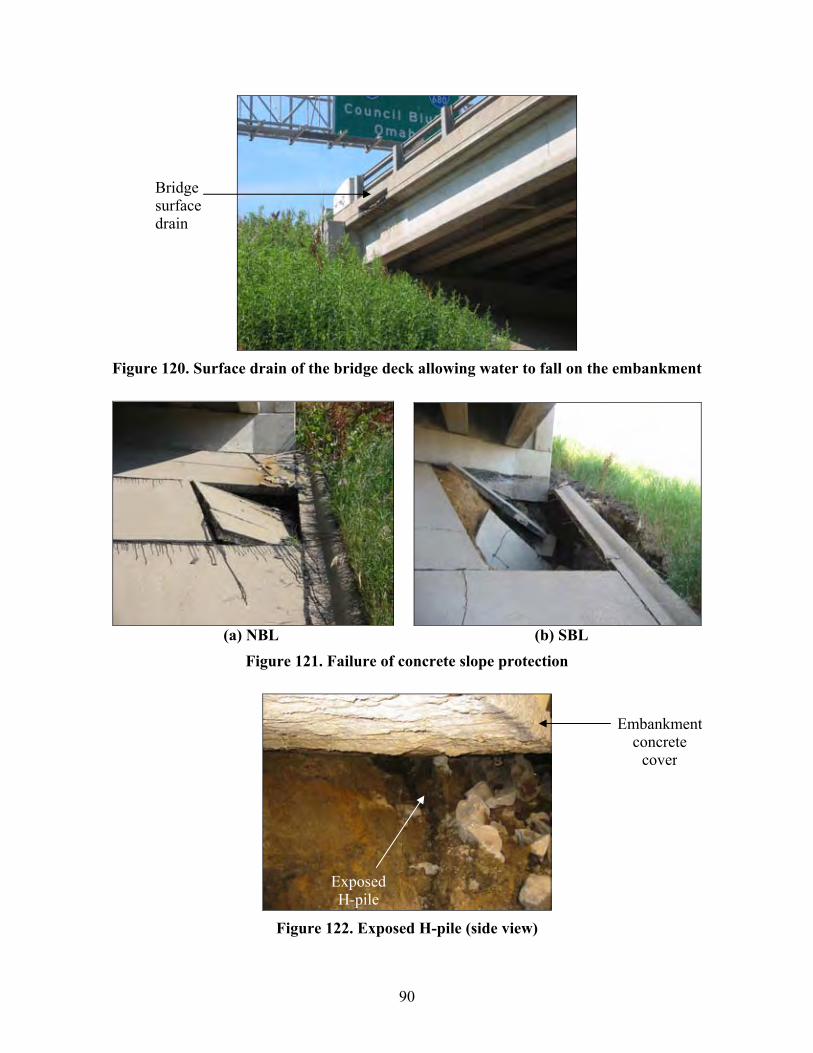
90
Figure 120. Surface drain of the bridge deck allowing water to fall on the embankment
(a) NBL (b) SBL
Figure 121. Failure of concrete slope protection
Figure 122. Exposed H-pile (side view)
Bridge surface drain
Exposed H-pile
Embankment concrete
cover
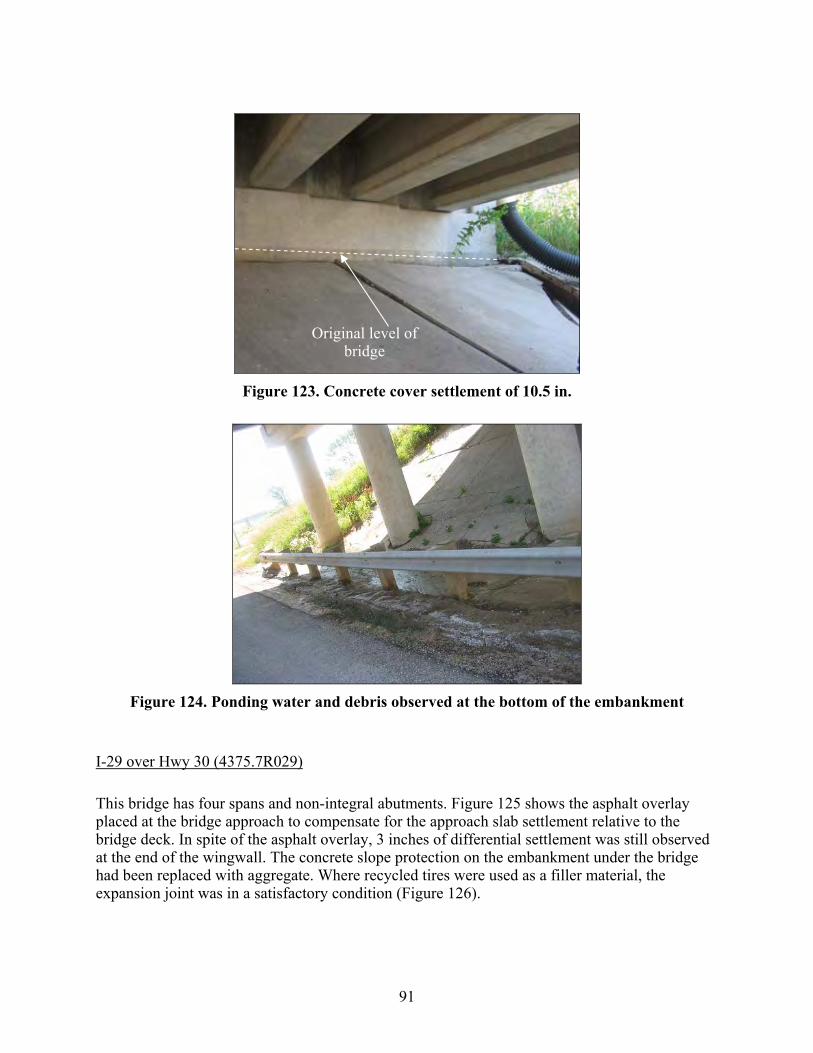
91
Figure 123. Concrete cover settlement of 10.5 in.
Figure 124. Ponding water and debris observed at the bottom of the embankment
I-29 over Hwy 30 (4375.7R029)
This bridge has four spans and non-integral abutments. Figure 125 shows the asphalt overlay placed at the bridge approach to compensate for the approach slab settlement relative to the bridge deck. In spite of the asphalt overlay, 3 inches of differential settlement was still observed at the end of the wingwall. The concrete slope protection on the embankment under the bridge had been replaced with aggregate. Where recycled tires were used as a filler material, the expansion joint was in a satisfactory condition (Figure 126).
Original level of bridge
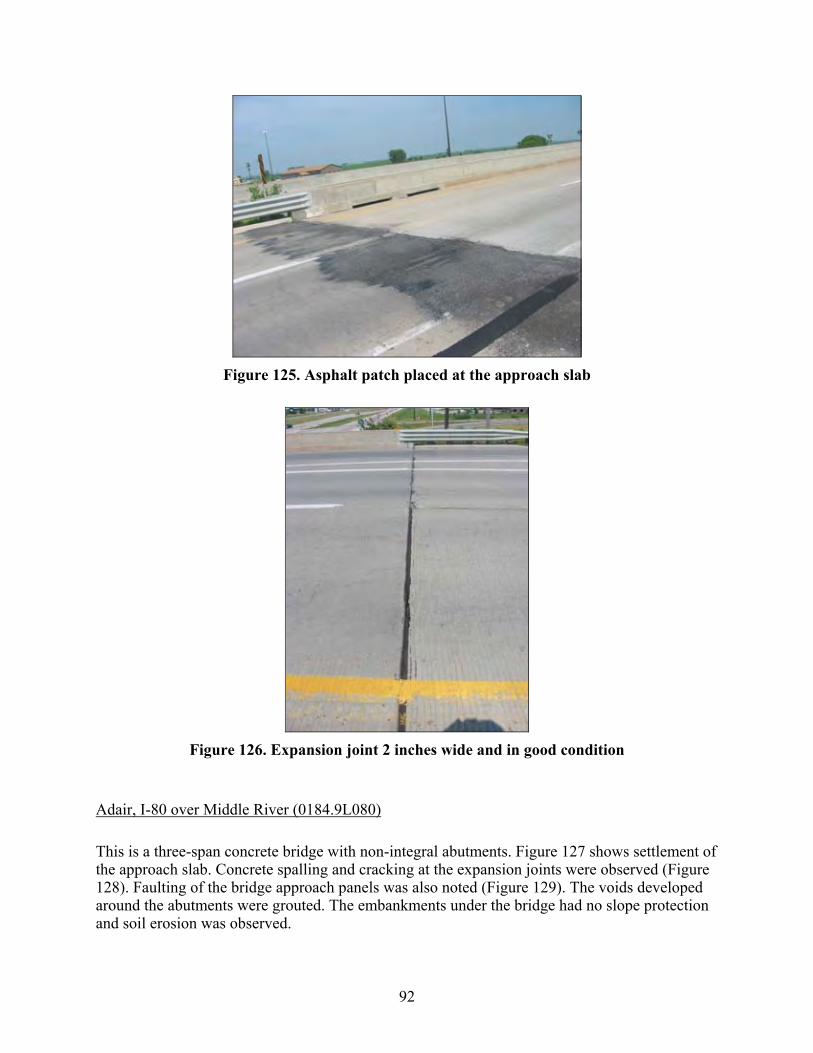
92
Figure 125. Asphalt patch placed at the approach slab
Figure 126. Expansion joint 2 inches wide and in good condition
Adair, I-80 over Middle River (0184.9L080)
This is a three-span concrete bridge with non-integral abutments. Figure 127 shows settlement of the approach slab. Concrete spalling and cracking at the expansion joints were observed (Figure 128). Faulting of the bridge approach panels was also noted (Figure 129). The voids developed around the abutments were grouted. The embankments under the bridge had no slope protection and soil erosion was observed.

93
Figure 127. Settlement of bridge approach
Figure 128. Concrete spalling at the expansion joint
Approach slab
settlement
Concrete spalling

94
Figure 129. Faulting of approach slab panels
Due to the significant damage of the approach slab, the approach slab panels were replaced in July 2003. Figure 130 shows the exposed subgrade after removing the old pavement. Two sections at both ends of the westbound lane were replaced. These sections were at the right lane starting 15 feet away from the bridge and extended over 40 feet. After removal, it rained and saturated the underlying subgrade. A subgrade sample was obtained from the exposed subgrade and was classified as well-graded gravel (GW) (see Appendix B for detailed results).
Figure 130. Bridge approach panel removed for replacement
Earlham, I-80 over County Hwy P57 (2504.0R080)
This is a three-span concrete bridge with non-integral abutments. Settlement and damage of the approach slab and damage of the expansion joint were observed (Figure 131). The embankment under the bridge has concrete slope protection. In addition, the end of drain outlet was blocked with soil.
Faults

95
The approach slab of this bridge was replaced in summer 2003. This section, which is on the right lane at the east end of the eastbound lane, was 30 feet long and approximately 15 feet away from the bridge. Figure 132 shows the broken approach slab pavement before removal and replacement. Figure 133 shows the approach slab section being replaced after removing the old pavement. A sample of the base material was tested in the laboratory and classified as well-graded gravel (GW) according to the Unified Classification System (See Appendix B for results).
Figure 131. Damage of the approach slab section
Figure 132. Approach pavement broken before replacement
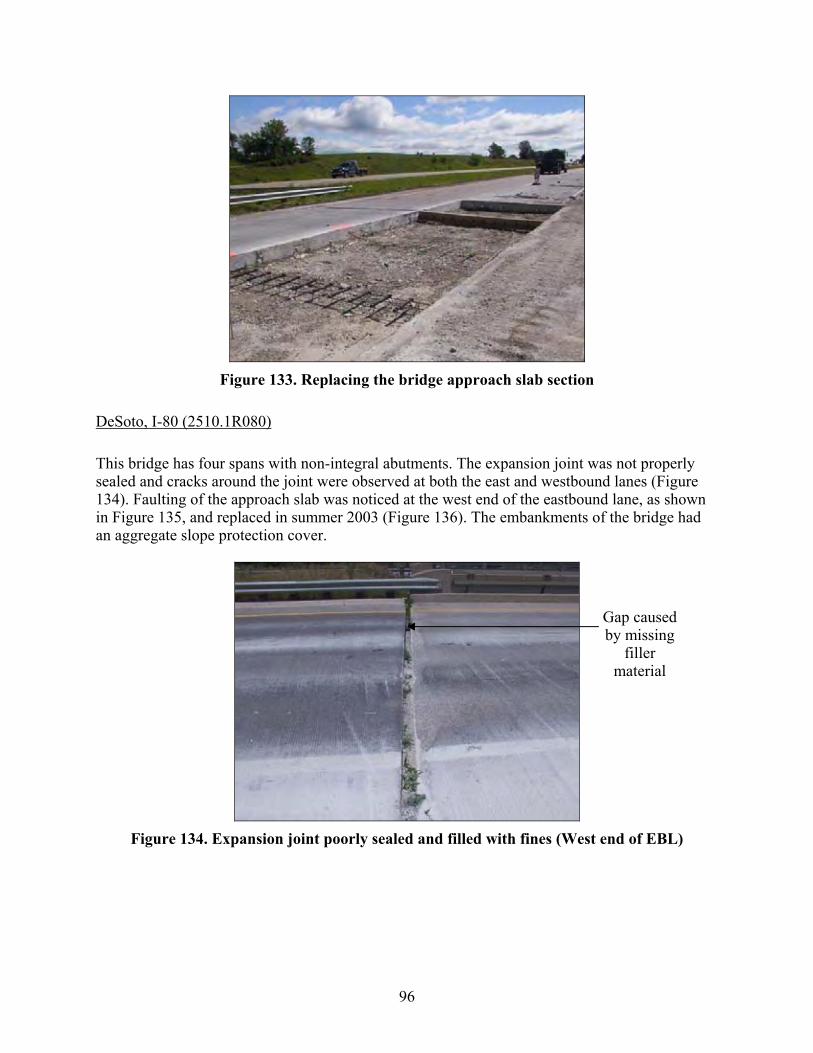
96
Figure 133. Replacing the bridge approach slab section
DeSoto, I-80 (2510.1R080)
This bridge has four spans with non-integral abutments. The expansion joint was not properly sealed and cracks around the joint were observed at both the east and westbound lanes (Figure 134). Faulting of the approach slab was noticed at the west end of the eastbound lane, as shown in Figure 135, and replaced in summer 2003 (Figure 136). The embankments of the bridge had an aggregate slope protection cover.
Figure 134. Expansion joint poorly sealed and filled with fines (West end of EBL)
Gap caused by missing
filler material

97
Figure 135. Faulting of bridge approach concrete panels (West end of EBL)
Figure 136. Replaced bridge approach slab
Faults
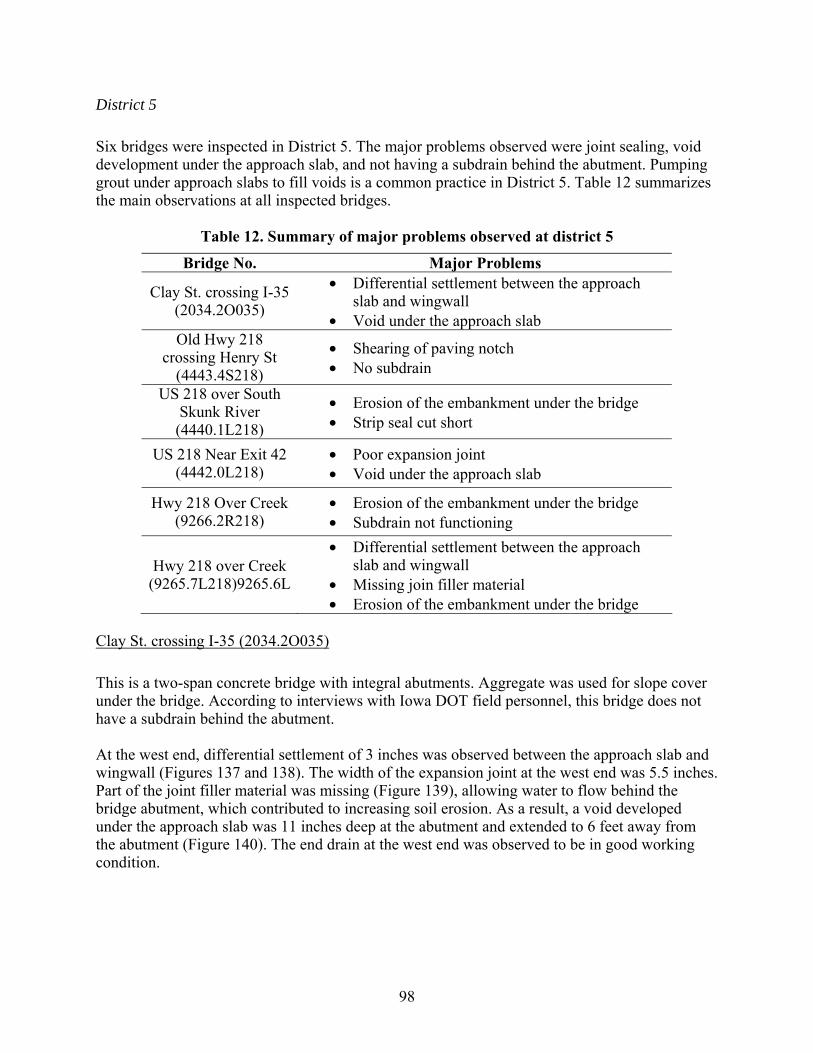
98
District 5
Six bridges were inspected in District 5. The major problems observed were joint sealing, void development under the approach slab, and not having a subdrain behind the abutment. Pumping grout under approach slabs to fill voids is a common practice in District 5. Table 12 summarizes the main observations at all inspected bridges.
Table 12. Summary of major problems observed at district 5
Bridge No. Major Problems
Clay St. crossing I-35 (2034.2O035)
• Differential settlement between the approach slab and wingwall
• Void under the approach slab Old Hwy 218
crossing Henry St (4443.4S218)
• Shearing of paving notch • No subdrain
US 218 over South Skunk River (4440.1L218)
• Erosion of the embankment under the bridge • Strip seal cut short
US 218 Near Exit 42 (4442.0L218)
• Poor expansion joint • Void under the approach slab
Hwy 218 Over Creek (9266.2R218)
• Erosion of the embankment under the bridge • Subdrain not functioning
Hwy 218 over Creek (9265.7L218)9265.6L
• Differential settlement between the approach slab and wingwall
• Missing join filler material • Erosion of the embankment under the bridge
Clay St. crossing I-35 (2034.2O035)
This is a two-span concrete bridge with integral abutments. Aggregate was used for slope cover under the bridge. According to interviews with Iowa DOT field personnel, this bridge does not have a subdrain behind the abutment. At the west end, differential settlement of 3 inches was observed between the approach slab and wingwall (Figures 137 and 138). The width of the expansion joint at the west end was 5.5 inches. Part of the joint filler material was missing (Figure 139), allowing water to flow behind the bridge abutment, which contributed to increasing soil erosion. As a result, a void developed under the approach slab was 11 inches deep at the abutment and extended to 6 feet away from the abutment (Figure 140). The end drain at the west end was observed to be in good working condition.

99
Figure 137. Settlement of approach slab
(a) Settlement of approach slab (b) Closer image of approach settlement
Figure 138. Settlement of approach slab relative to wingwall
Figure 139. Deteriorated expansion joint filler
Approach slab
settlement

100
Figure 140. Void developed under the approach slab
At the east end, differential settlement of about 1 inch between the approach slab and the bridge deck was measured (Figure 141). The expansion joint width was 5 inches. The sealer used to keep the joint filler in place deteriorated shortly after construction, and the forks used to hold the joint material in place were not found. As a result, the joint filler was missing leaving a large gap (Figure 142) allowing water to erode the backfill material under the approach slab. The void developed under the approach slab was about 4 inches deep (Figure 143). Another indication of poor water management was the observed erosion at the sides of the abutment (See Figure 144). Furthermore, concrete spalling was observed at the expansion joint.
Figure 141. Differential settlement at the bridge approach (East end)
11 in. void under
approach slab
Settlement of approach
slab
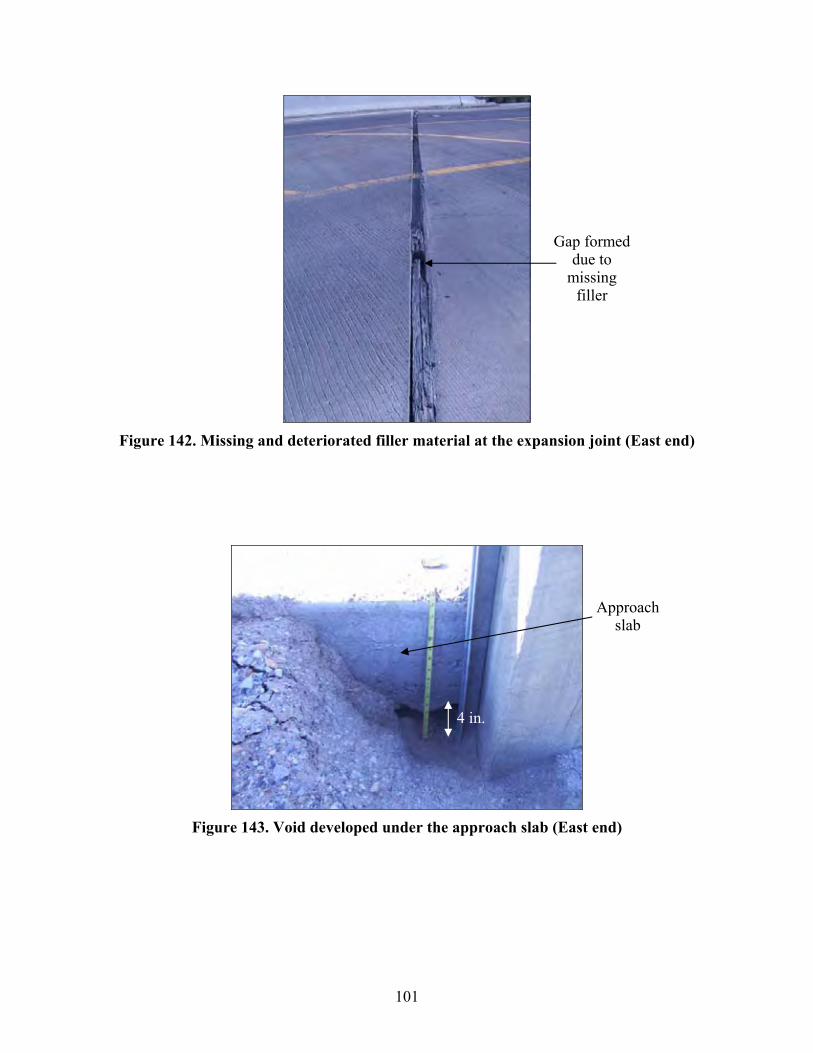
101
Figure 142. Missing and deteriorated filler material at the expansion joint (East end)
Figure 143. Void developed under the approach slab (East end)
Gap formed due to
missing filler
4 in.
Approach slab
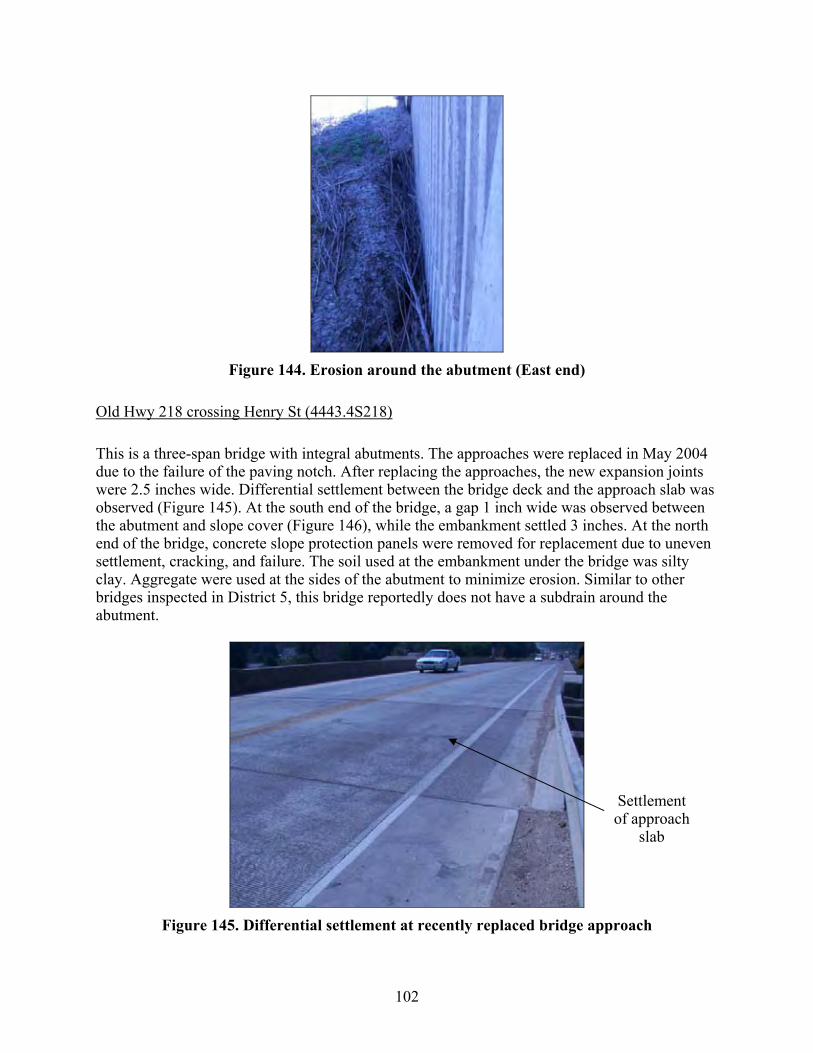
102
Figure 144. Erosion around the abutment (East end)
Old Hwy 218 crossing Henry St (4443.4S218)
This is a three-span bridge with integral abutments. The approaches were replaced in May 2004 due to the failure of the paving notch. After replacing the approaches, the new expansion joints were 2.5 inches wide. Differential settlement between the bridge deck and the approach slab was observed (Figure 145). At the south end of the bridge, a gap 1 inch wide was observed between the abutment and slope cover (Figure 146), while the embankment settled 3 inches. At the north end of the bridge, concrete slope protection panels were removed for replacement due to uneven settlement, cracking, and failure. The soil used at the embankment under the bridge was silty clay. Aggregate were used at the sides of the abutment to minimize erosion. Similar to other bridges inspected in District 5, this bridge reportedly does not have a subdrain around the abutment.
Figure 145. Differential settlement at recently replaced bridge approach
Settlement of approach
slab
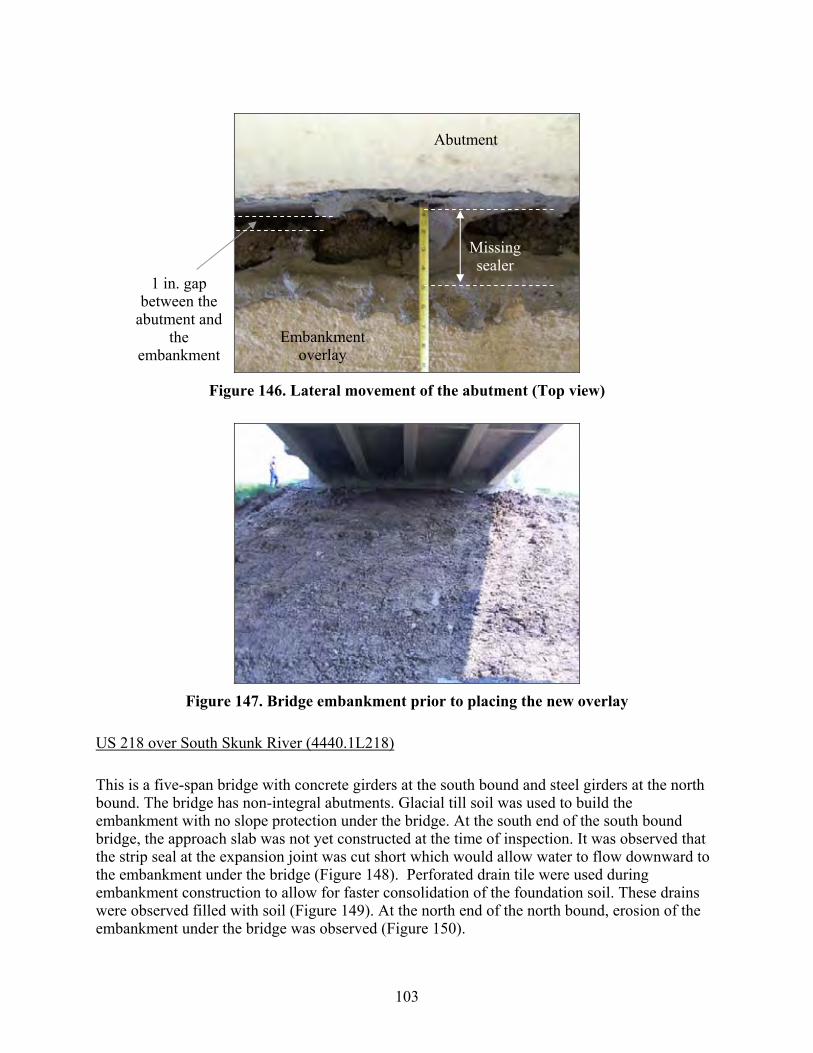
103
Figure 146. Lateral movement of the abutment (Top view)
Figure 147. Bridge embankment prior to placing the new overlay
US 218 over South Skunk River (4440.1L218)
This is a five-span bridge with concrete girders at the south bound and steel girders at the north bound. The bridge has non-integral abutments. Glacial till soil was used to build the embankment with no slope protection under the bridge. At the south end of the south bound bridge, the approach slab was not yet constructed at the time of inspection. It was observed that the strip seal at the expansion joint was cut short which would allow water to flow downward to the embankment under the bridge (Figure 148). Perforated drain tile were used during embankment construction to allow for faster consolidation of the foundation soil. These drains were observed filled with soil (Figure 149). At the north end of the north bound, erosion of the embankment under the bridge was observed (Figure 150).
Abutment
Embankment overlay
Missing sealer
1 in. gap between the
abutment and the
embankment

104
Figure 148. Side view of the strip seal which was cut short (South end of SBL)
Figure 149. Perforated drain tile filled with soil (South end of SBL)
Bridge slab
Approach slab
Strip seal
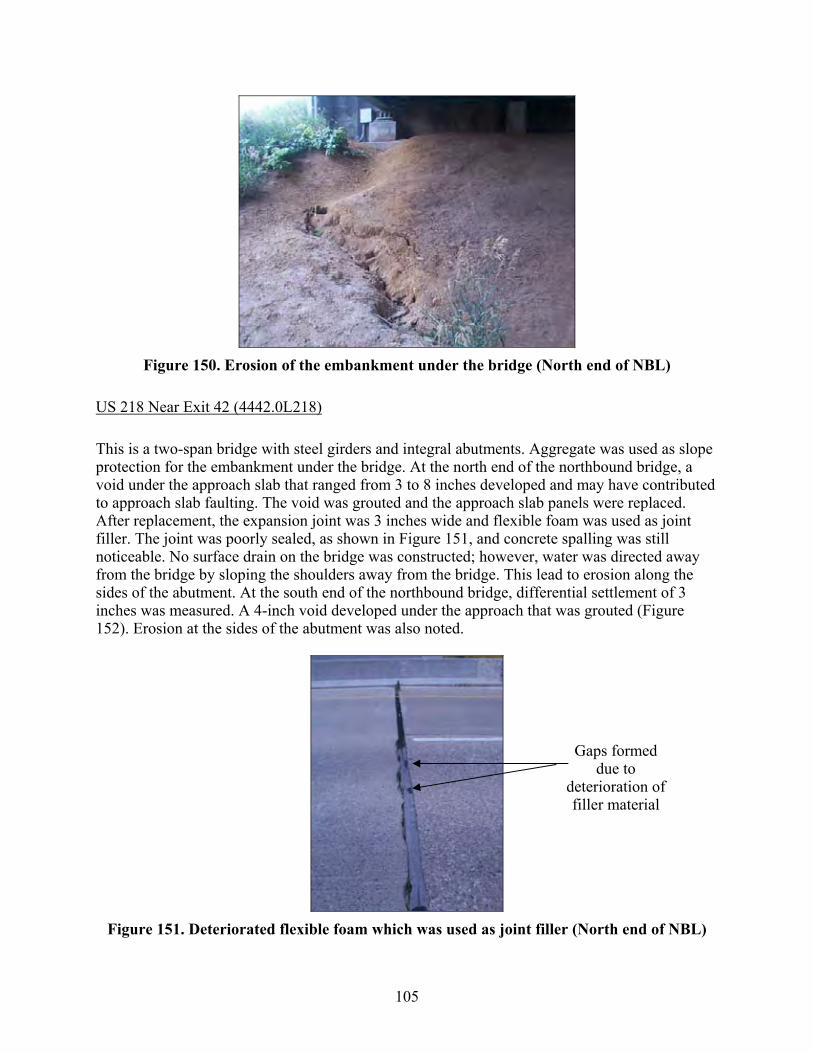
105
Figure 150. Erosion of the embankment under the bridge (North end of NBL)
US 218 Near Exit 42 (4442.0L218)
This is a two-span bridge with steel girders and integral abutments. Aggregate was used as slope protection for the embankment under the bridge. At the north end of the northbound bridge, a void under the approach slab that ranged from 3 to 8 inches developed and may have contributed to approach slab faulting. The void was grouted and the approach slab panels were replaced. After replacement, the expansion joint was 3 inches wide and flexible foam was used as joint filler. The joint was poorly sealed, as shown in Figure 151, and concrete spalling was still noticeable. No surface drain on the bridge was constructed; however, water was directed away from the bridge by sloping the shoulders away from the bridge. This lead to erosion along the sides of the abutment. At the south end of the northbound bridge, differential settlement of 3 inches was measured. A 4-inch void developed under the approach that was grouted (Figure 152). Erosion at the sides of the abutment was also noted.
Figure 151. Deteriorated flexible foam which was used as joint filler (North end of NBL)
Gaps formed due to
deterioration of filler material
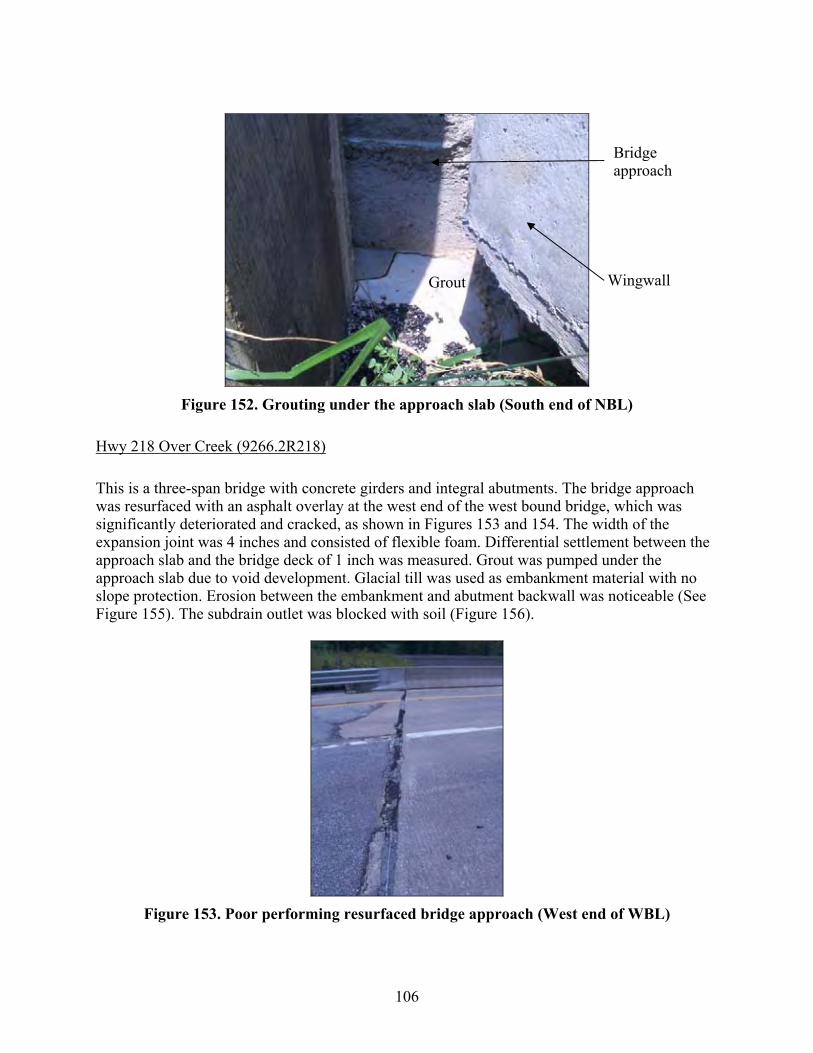
106
Figure 152. Grouting under the approach slab (South end of NBL)
Hwy 218 Over Creek (9266.2R218)
This is a three-span bridge with concrete girders and integral abutments. The bridge approach was resurfaced with an asphalt overlay at the west end of the west bound bridge, which was significantly deteriorated and cracked, as shown in Figures 153 and 154. The width of the expansion joint was 4 inches and consisted of flexible foam. Differential settlement between the approach slab and the bridge deck of 1 inch was measured. Grout was pumped under the approach slab due to void development. Glacial till was used as embankment material with no slope protection. Erosion between the embankment and abutment backwall was noticeable (See Figure 155). The subdrain outlet was blocked with soil (Figure 156).
Figure 153. Poor performing resurfaced bridge approach (West end of WBL)
Wingwall
Bridge approach
Grout
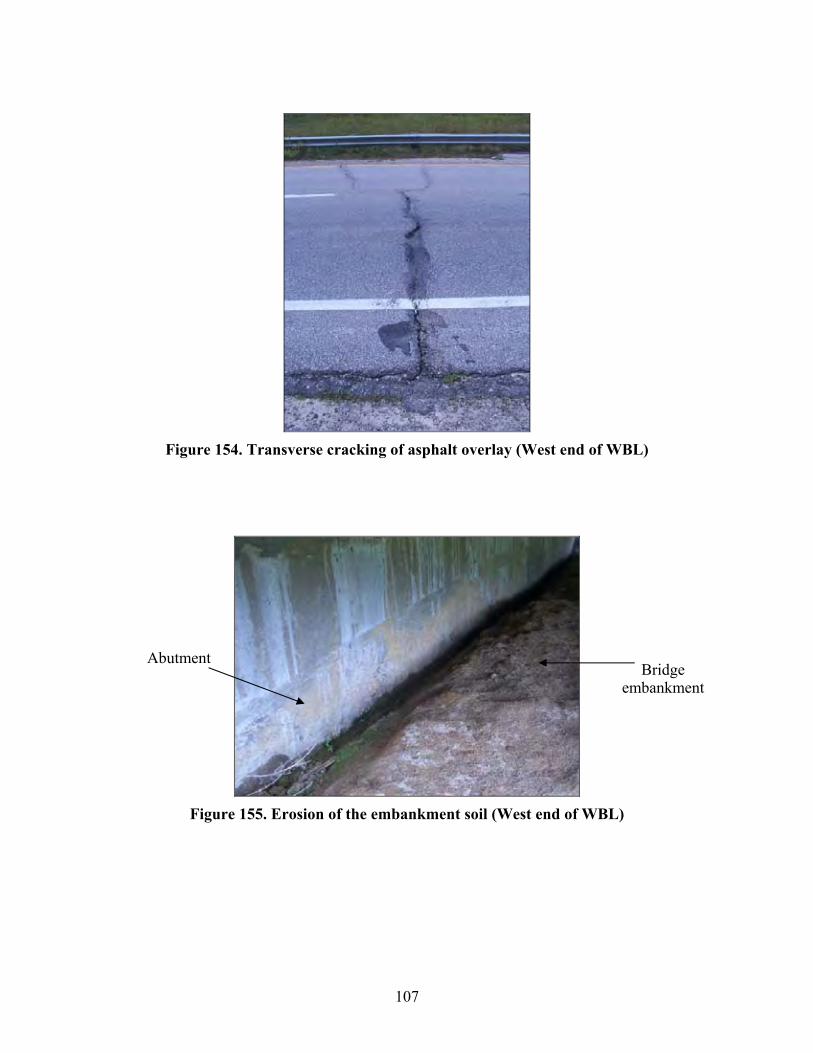
107
Figure 154. Transverse cracking of asphalt overlay (West end of WBL)
Figure 155. Erosion of the embankment soil (West end of WBL)
Bridge embankment
Abutment

108
Figure 156. Subdrain outlet blocked with soil (West end of WBL)
Hwy 218 over Creek (9265.7L218)
This is a three-span bridge with integral abutments. At the east end of the bridge, differential settlement between the approach slab and the wingwall of 1 inch was measured. The width of the expansion joint was 4.5 inches. Parts of the flexible foam joint filler completely came out exposing the paving notch (Figure 157), which was covered with about 3 inches of soil debris. Grout was pumped under the approach slab to fill a void developed behind the abutment. Furthermore, erosion between the embankment under the bridge and the backwall was observed (Figure 158a) where rip-rap was used to control erosion (Figure 158b).
Figure 157. Missing filler material exposing the pavement notch (East end of WBL)
Soil blocking subdrain
outlet
Missing filler material and soil on top of
the paving notch
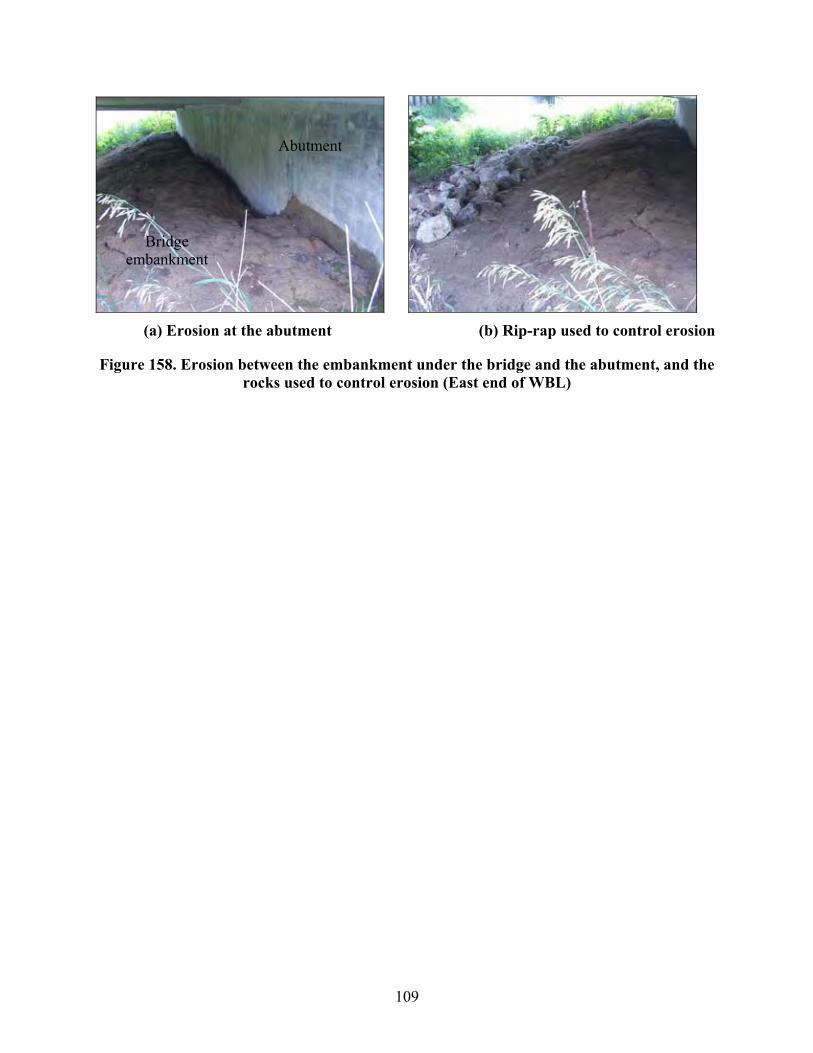
109
(a) Erosion at the abutment (b) Rip-rap used to control erosion
Figure 158. Erosion between the embankment under the bridge and the abutment, and the rocks used to control erosion (East end of WBL)
Abutment
Bridge embankment

110
District 6
Seven bridges were inspected in District 6. The major observed problems were settlement and erosion of the embankment under the bridge. Grouting under the approach is a common practice in District 6. Table 13 summarizes the major observations. Detailed observations of the investigated bridges are discussed below.
Table 13. Summary of major problems observed at district 6
Bridge No. Major Problems
Hwy 1 over Cedar River (5704.2S001)
• Differential settlement between approach slab and wingwall
• Strip seal cut short Hwy 151 over Big Creek
(5742.4R151) • Differential settlement indicated by overlay • Erosion along the sides of the abutment
Hwy 218 over Hwy 921 (5289.8R218)
• Lateral movement of the abutment • Slab drop between approach and bridge deck
I-380 over Clear Creek (5200.5R380)
• Damage of expansion joints • Erosion of the embankment under the bridge • Ponding of water at the embankment under the
bridge
I-380 over Hwy 6 (5200.8R380)
• Damage to the slope protection • Settlement of the embankment under the
bridge • Lateral movement of the abutment
I-380 over Airport Rd. (5718.4O380)
• Differential settlement between approach slab and wingwall
• Cracks of approach slab • Damage of expansion joint
I-380 over I-80 (5200.0R380)
• Erosion at the embankment exposing H-piles • Erosion along the abutment sides • Uneven settlement of concrete slope
protection
Hwy 1 over Cedar River (5704.2S001)
This bridge was constructed in 1992 and has concrete girders with non-integral abutments. Three inches of differential settlement was observed at the bridge approach guardrails (Figures 159). The strip seal was cut short. The embankment under the bridge was built with loess soil with no slope protection (Figure 160). Water appeared to be flowing through the expansion joint to the embankment under the bridge. To fill the void developed behind the abutment, the bridge was grouted in 2003.

111
Figure 159. Differential settlement at the bridge approach (South bound)
Figure 160. Wet loess soil observed at the embankment under the bridge
Hwy 151 over Big Creek (5742.4R151)
This bridge was constructed in 1992 and has three spans with integral abutments. No slope protection was used under the bridge and wet embankment soil was observed. Erosion along the sides of the abutment was also observed. According to the maintenance reports, a void developed around the abutment and has been grouted twice in the last 10 years. The second grouting was performed in June 2003. The approach slabs were also overlaid with 2 inches of asphalt to alleviate the differential settlement at the bridge approach, as shown in Figure 161.
3 in.
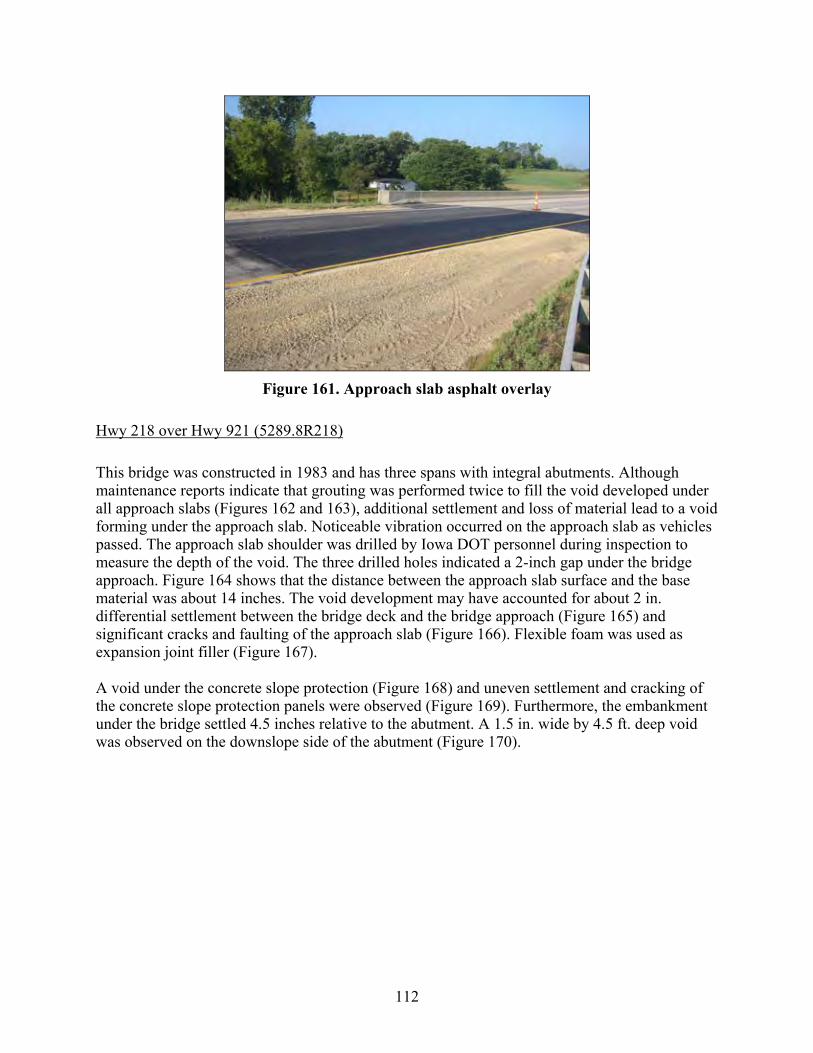
112
Figure 161. Approach slab asphalt overlay
Hwy 218 over Hwy 921 (5289.8R218)
This bridge was constructed in 1983 and has three spans with integral abutments. Although maintenance reports indicate that grouting was performed twice to fill the void developed under all approach slabs (Figures 162 and 163), additional settlement and loss of material lead to a void forming under the approach slab. Noticeable vibration occurred on the approach slab as vehicles passed. The approach slab shoulder was drilled by Iowa DOT personnel during inspection to measure the depth of the void. The three drilled holes indicated a 2-inch gap under the bridge approach. Figure 164 shows that the distance between the approach slab surface and the base material was about 14 inches. The void development may have accounted for about 2 in. differential settlement between the bridge deck and the bridge approach (Figure 165) and significant cracks and faulting of the approach slab (Figure 166). Flexible foam was used as expansion joint filler (Figure 167). A void under the concrete slope protection (Figure 168) and uneven settlement and cracking of the concrete slope protection panels were observed (Figure 169). Furthermore, the embankment under the bridge settled 4.5 inches relative to the abutment. A 1.5 in. wide by 4.5 ft. deep void was observed on the downslope side of the abutment (Figure 170).
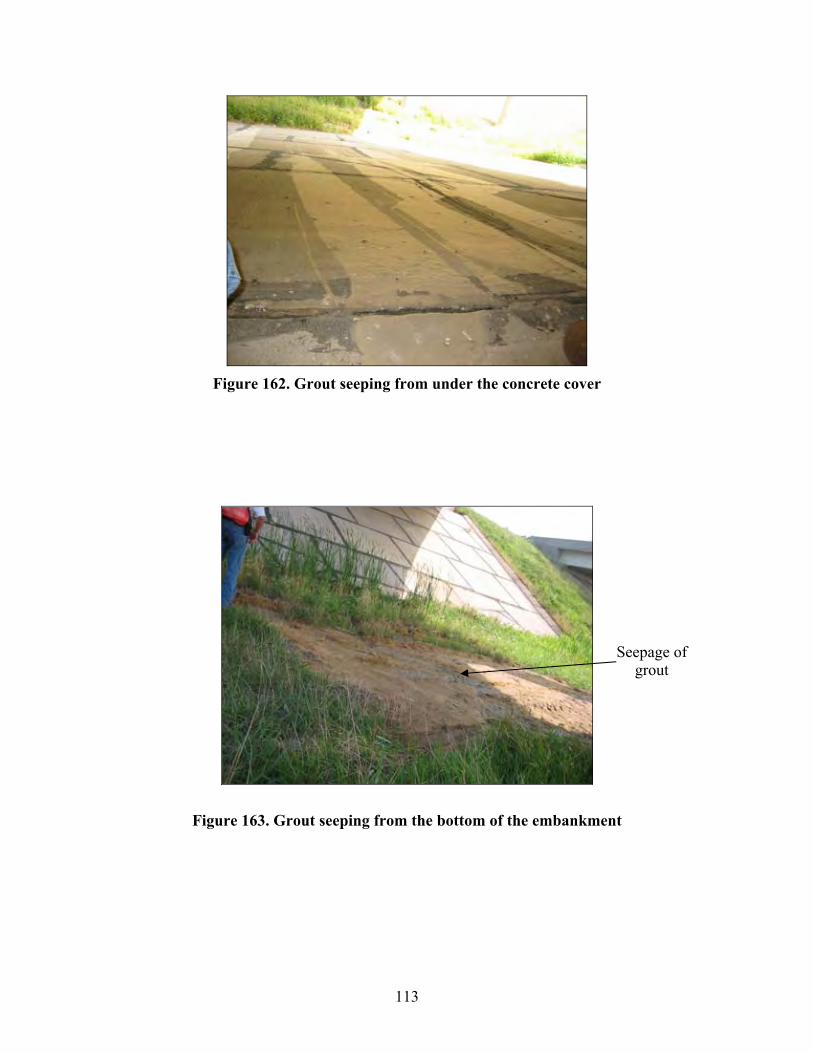
113
Figure 162. Grout seeping from under the concrete cover
Figure 163. Grout seeping from the bottom of the embankment
Seepage of grout

114
(a) Drilling at the approach slab (b) Measuring the void
Figure 164. Drilling at the approach slab shoulder indicating 2 in. deep void
Figure 165. Differential settlement at approach slab
Settlement of approach
slab
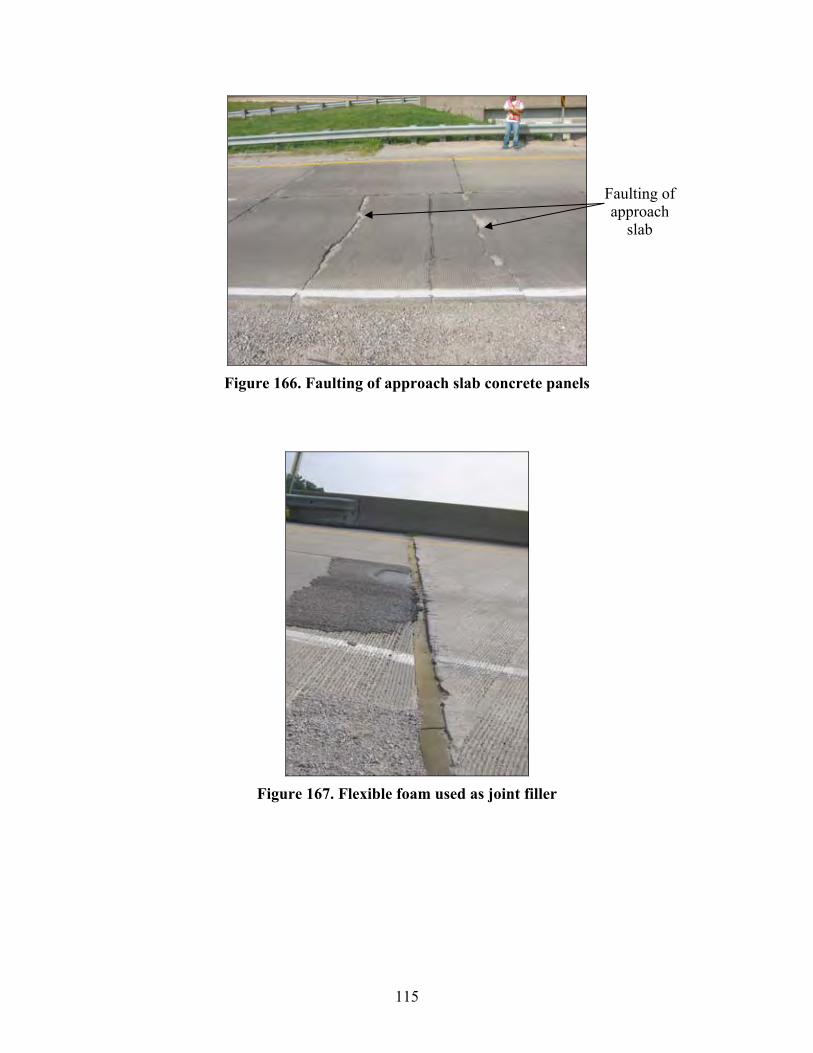
115
Figure 166. Faulting of approach slab concrete panels
Figure 167. Flexible foam used as joint filler
Faulting of approach
slab

116
(a) Void under slope protection (b) Closer image of the developed void
Figure 168. Void created by erosion and settlement after grouting
Figure 169. Cracking of the concrete slope protection overlay
Embankment overlay
Embankment overlay
Erosion at the embankment

117
Figure 170. Gap between abutment and embankment
I-380 over Clear Creek (5200.5R380)
This bridge was constructed in 1971 and has three spans with integral abutments. Cracks and concrete spalling were observed around the expansion joint (Figure 171). Soil erosion and ponding of water were noted on the embankment under the bridge (Figures 172 and 173). Aggregate and an erosion blanket were used for slope stabilization, as shown in Figure 174. According to the maintenance records for this bridge, the near end of the right lane of the bridge approach was grouted using 5 cubic yards of flowable mortar in fall 2002.
Figure 171. Concrete spalling and cracking at the expansion joint
Abutment
Slope protection
1.5 in. wide and 4.5 ft. deep gap

118
Figure 172. Soil erosion of the embankment under the bridge
Figure 173. Water ponding at the embankment (Top view)
Bridge abutment
Bridge embankment
Bridge embankment
Abutment
Water ponding and void under the abutment
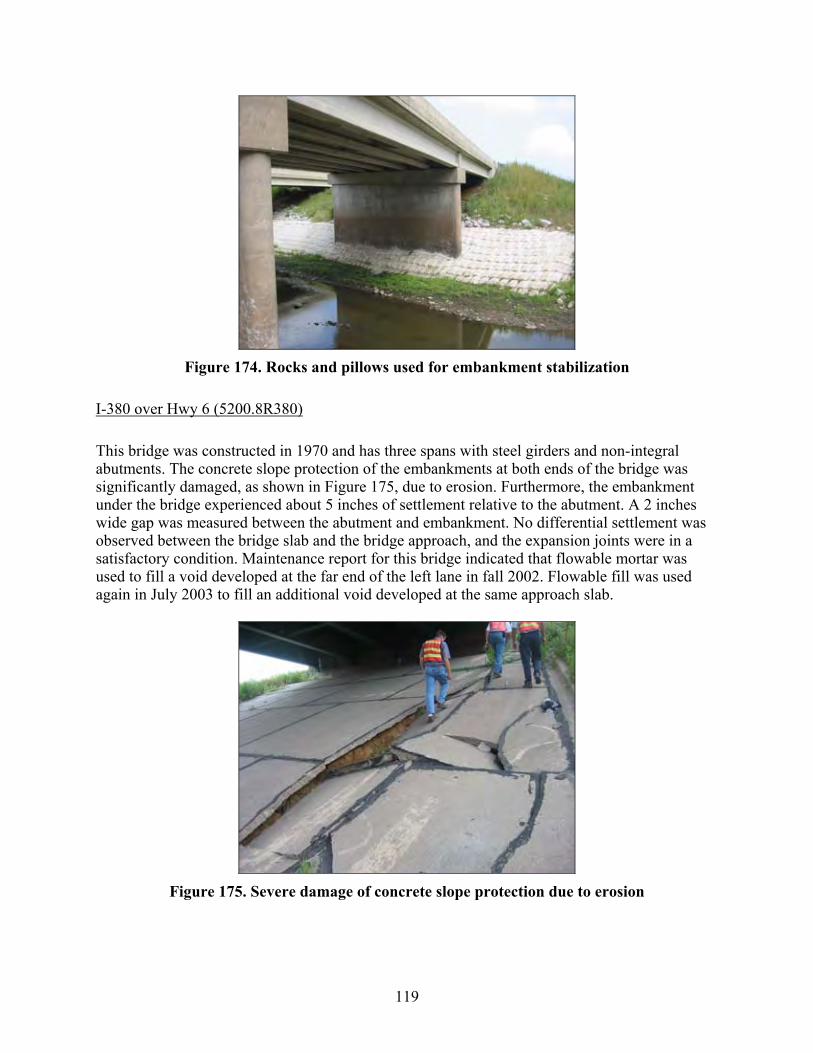
119
Figure 174. Rocks and pillows used for embankment stabilization
I-380 over Hwy 6 (5200.8R380)
This bridge was constructed in 1970 and has three spans with steel girders and non-integral abutments. The concrete slope protection of the embankments at both ends of the bridge was significantly damaged, as shown in Figure 175, due to erosion. Furthermore, the embankment under the bridge experienced about 5 inches of settlement relative to the abutment. A 2 inches wide gap was measured between the abutment and embankment. No differential settlement was observed between the bridge slab and the bridge approach, and the expansion joints were in a satisfactory condition. Maintenance report for this bridge indicated that flowable mortar was used to fill a void developed at the far end of the left lane in fall 2002. Flowable fill was used again in July 2003 to fill an additional void developed at the same approach slab.
Figure 175. Severe damage of concrete slope protection due to erosion
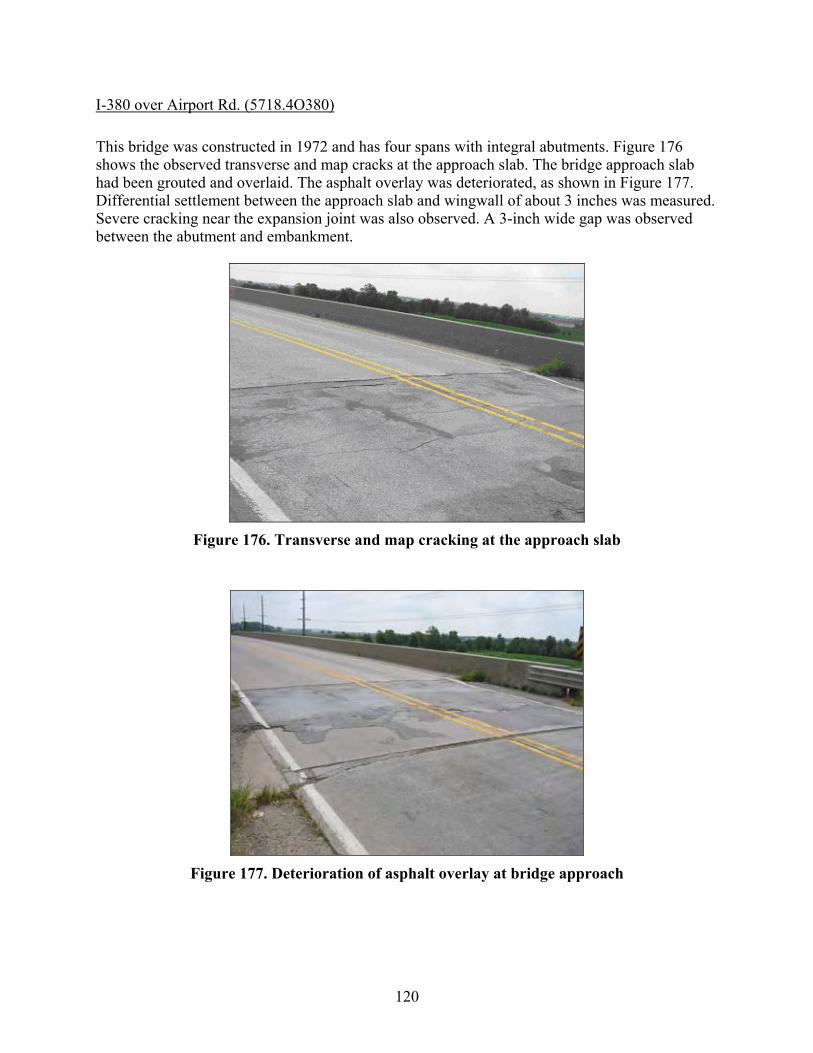
120
I-380 over Airport Rd. (5718.4O380)
This bridge was constructed in 1972 and has four spans with integral abutments. Figure 176 shows the observed transverse and map cracks at the approach slab. The bridge approach slab had been grouted and overlaid. The asphalt overlay was deteriorated, as shown in Figure 177. Differential settlement between the approach slab and wingwall of about 3 inches was measured. Severe cracking near the expansion joint was also observed. A 3-inch wide gap was observed between the abutment and embankment.
Figure 176. Transverse and map cracking at the approach slab
Figure 177. Deterioration of asphalt overlay at bridge approach

121
I-380 over I-80 (5200.0R380)
This bridge was not inspected during the field visit; however, some figures and maintenance reports were provided by Iowa DOT. This bridge has four spans with non-integral abutments. Figure 178 shows uneven settlement of the concrete slope protection of the embankment under the bridge. The near end of the right lane of the bridge was grouted in August 2003 to fill the void developed behind the abutment, which exposed the H-piles (Figures 179 to 182).
Figure 178. Uneven concrete slope protection
Figure 179. Soil erosion around the abutment
Abutment
Erosion around the abutment

122
Figure 180. Erosion under the concrete slope protection (Side view)
Figure 181. Void created under bridge approach exposing H-piles (Side view)
Abutment
Embankment overlay
Exposed H-piles
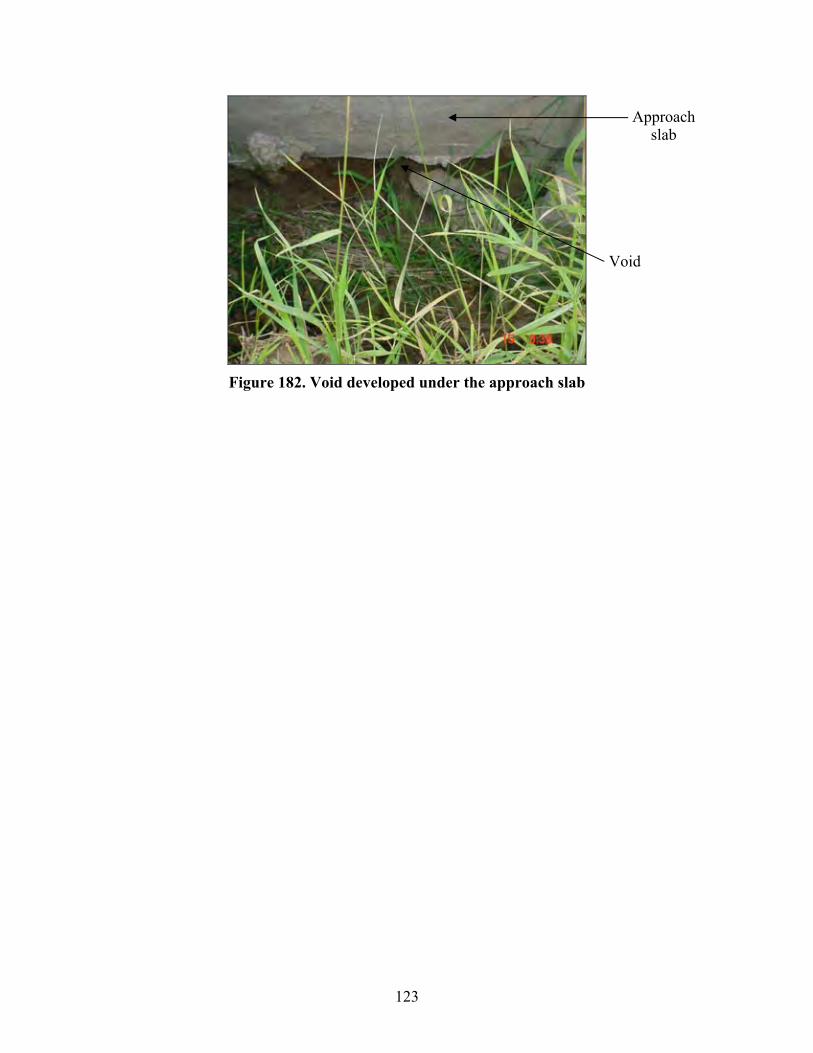
123
Figure 182. Void developed under the approach slab
Approach slab
Void
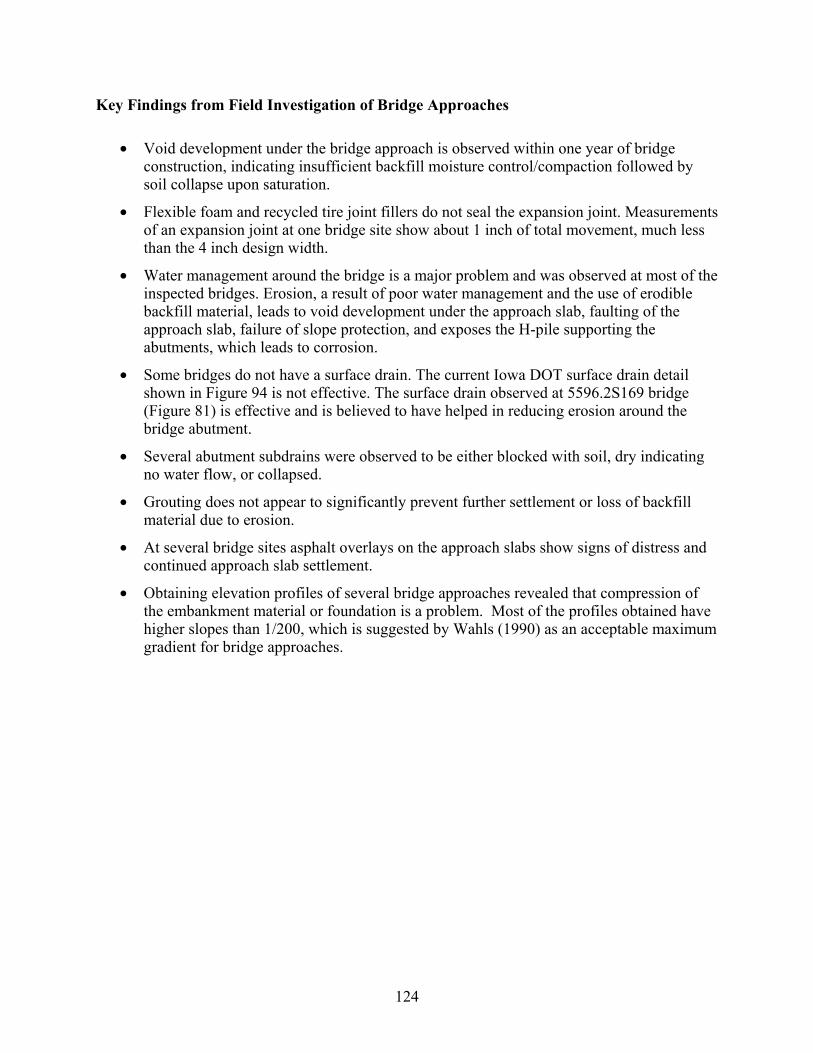
124
Key Findings from Field Investigation of Bridge Approaches
• Void development under the bridge approach is observed within one year of bridge construction, indicating insufficient backfill moisture control/compaction followed by soil collapse upon saturation.
• Flexible foam and recycled tire joint fillers do not seal the expansion joint. Measurements of an expansion joint at one bridge site show about 1 inch of total movement, much less than the 4 inch design width.
• Water management around the bridge is a major problem and was observed at most of the inspected bridges. Erosion, a result of poor water management and the use of erodible backfill material, leads to void development under the approach slab, faulting of the approach slab, failure of slope protection, and exposes the H-pile supporting the abutments, which leads to corrosion.
• Some bridges do not have a surface drain. The current Iowa DOT surface drain detail shown in Figure 94 is not effective. The surface drain observed at 5596.2S169 bridge (Figure 81) is effective and is believed to have helped in reducing erosion around the bridge abutment.
• Several abutment subdrains were observed to be either blocked with soil, dry indicating no water flow, or collapsed.
• Grouting does not appear to significantly prevent further settlement or loss of backfill material due to erosion.
• At several bridge sites asphalt overlays on the approach slabs show signs of distress and continued approach slab settlement.
• Obtaining elevation profiles of several bridge approaches revealed that compression of the embankment material or foundation is a problem. Most of the profiles obtained have higher slopes than 1/200, which is suggested by Wahls (1990) as an acceptable maximum gradient for bridge approaches.
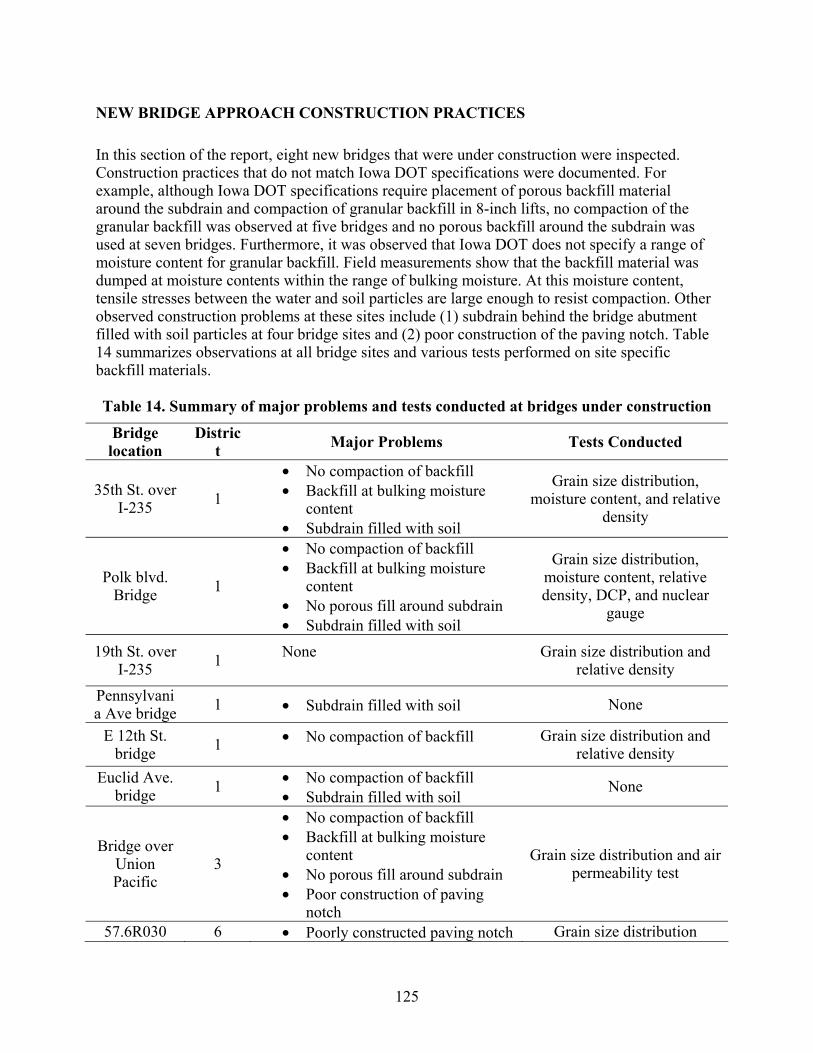
125
NEW BRIDGE APPROACH CONSTRUCTION PRACTICES
In this section of the report, eight new bridges that were under construction were inspected. Construction practices that do not match Iowa DOT specifications were documented. For example, although Iowa DOT specifications require placement of porous backfill material around the subdrain and compaction of granular backfill in 8-inch lifts, no compaction of the granular backfill was observed at five bridges and no porous backfill around the subdrain was used at seven bridges. Furthermore, it was observed that Iowa DOT does not specify a range of moisture content for granular backfill. Field measurements show that the backfill material was dumped at moisture contents within the range of bulking moisture. At this moisture content, tensile stresses between the water and soil particles are large enough to resist compaction. Other observed construction problems at these sites include (1) subdrain behind the bridge abutment filled with soil particles at four bridge sites and (2) poor construction of the paving notch. Table 14 summarizes observations at all bridge sites and various tests performed on site specific backfill materials. Table 14. Summary of major problems and tests conducted at bridges under construction
Bridge location
District Major Problems Tests Conducted
35th St. over I-235 1
• No compaction of backfill • Backfill at bulking moisture
content • Subdrain filled with soil
Grain size distribution, moisture content, and relative
density
Polk blvd. Bridge 1
• No compaction of backfill • Backfill at bulking moisture
content • No porous fill around subdrain • Subdrain filled with soil
Grain size distribution, moisture content, relative density, DCP, and nuclear
gauge
19th St. over I-235 1 None
Grain size distribution and
relative density Pennsylvania Ave bridge 1 • Subdrain filled with soil None
E 12th St. bridge 1 • No compaction of backfill
Grain size distribution and
relative density Euclid Ave.
bridge 1 • No compaction of backfill • Subdrain filled with soil
None
Bridge over Union Pacific
3
• No compaction of backfill • Backfill at bulking moisture
content • No porous fill around subdrain • Poor construction of paving
notch
Grain size distribution and air permeability test
57.6R030 6 • Poorly constructed paving notch Grain size distribution
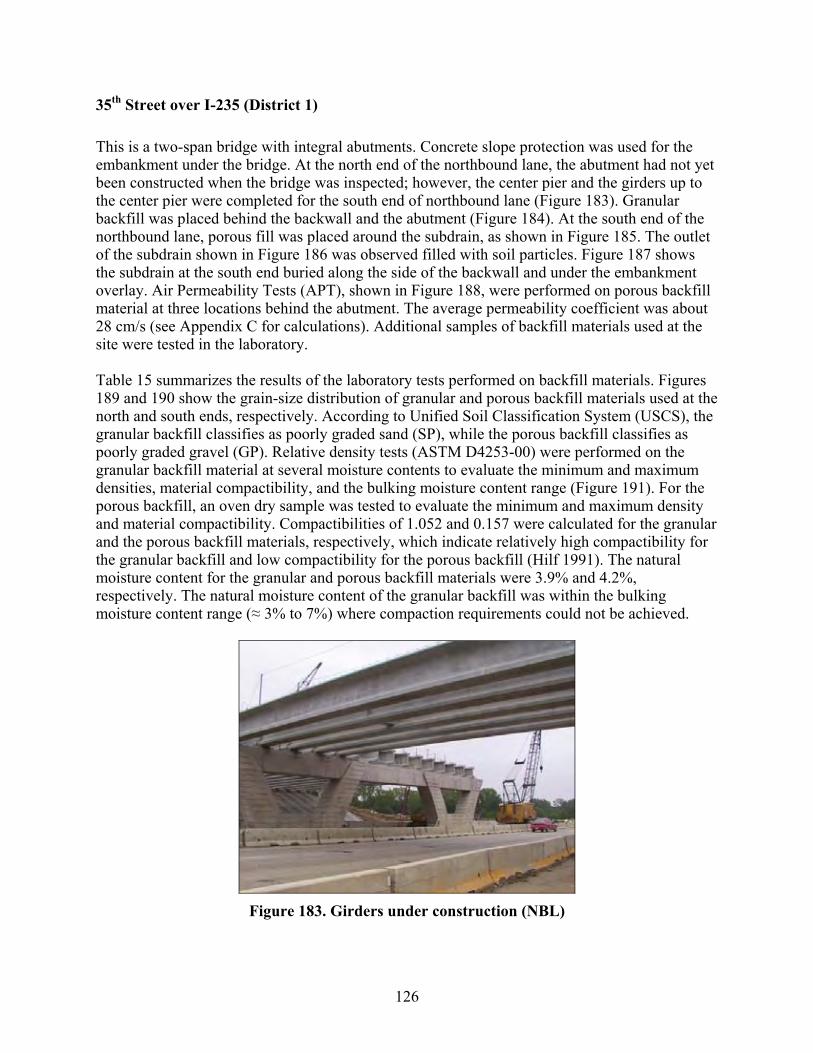
126
35th Street over I-235 (District 1)
This is a two-span bridge with integral abutments. Concrete slope protection was used for the embankment under the bridge. At the north end of the northbound lane, the abutment had not yet been constructed when the bridge was inspected; however, the center pier and the girders up to the center pier were completed for the south end of northbound lane (Figure 183). Granular backfill was placed behind the backwall and the abutment (Figure 184). At the south end of the northbound lane, porous fill was placed around the subdrain, as shown in Figure 185. The outlet of the subdrain shown in Figure 186 was observed filled with soil particles. Figure 187 shows the subdrain at the south end buried along the side of the backwall and under the embankment overlay. Air Permeability Tests (APT), shown in Figure 188, were performed on porous backfill material at three locations behind the abutment. The average permeability coefficient was about 28 cm/s (see Appendix C for calculations). Additional samples of backfill materials used at the site were tested in the laboratory. Table 15 summarizes the results of the laboratory tests performed on backfill materials. Figures 189 and 190 show the grain-size distribution of granular and porous backfill materials used at the north and south ends, respectively. According to Unified Soil Classification System (USCS), the granular backfill classifies as poorly graded sand (SP), while the porous backfill classifies as poorly graded gravel (GP). Relative density tests (ASTM D4253-00) were performed on the granular backfill material at several moisture contents to evaluate the minimum and maximum densities, material compactibility, and the bulking moisture content range (Figure 191). For the porous backfill, an oven dry sample was tested to evaluate the minimum and maximum density and material compactibility. Compactibilities of 1.052 and 0.157 were calculated for the granular and the porous backfill materials, respectively, which indicate relatively high compactibility for the granular backfill and low compactibility for the porous backfill (Hilf 1991). The natural moisture content for the granular and porous backfill materials were 3.9% and 4.2%, respectively. The natural moisture content of the granular backfill was within the bulking moisture content range (≈ 3% to 7%) where compaction requirements could not be achieved.
Figure 183. Girders under construction (NBL)
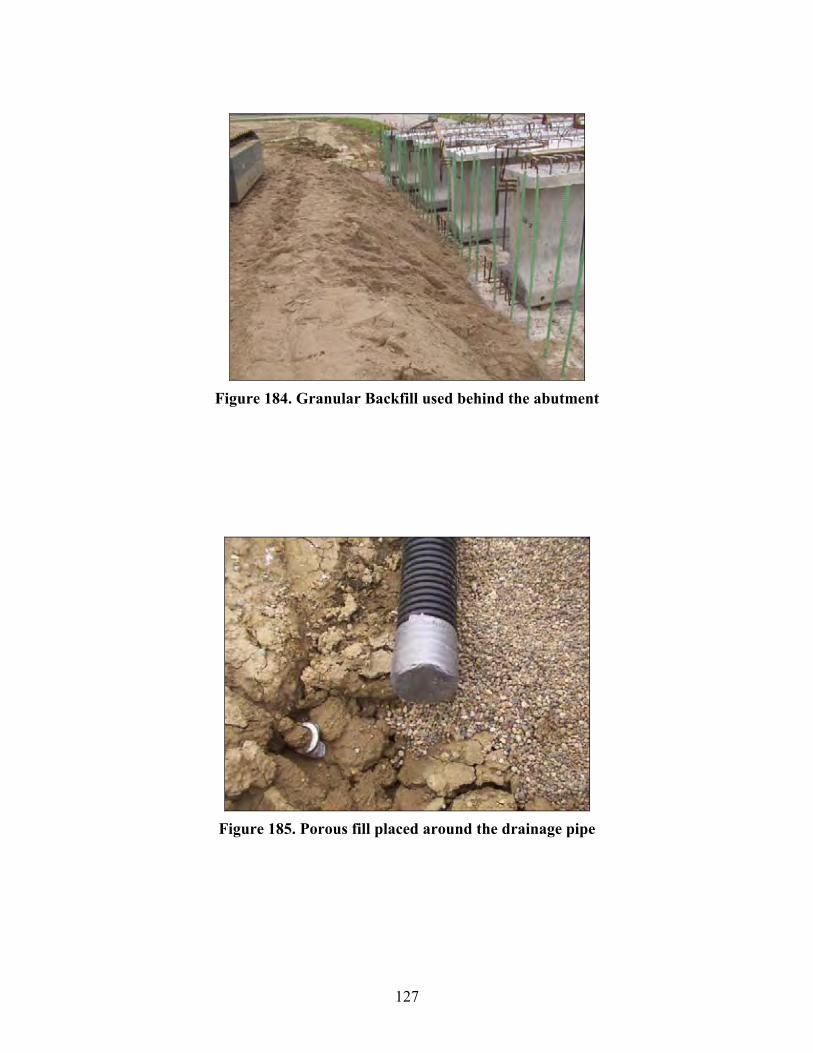
127
Figure 184. Granular Backfill used behind the abutment
Figure 185. Porous fill placed around the drainage pipe

128
Figure 186. Subdrain outlet at the bottom of the embankment
Figure 187. Subdrain along the side of the abutment
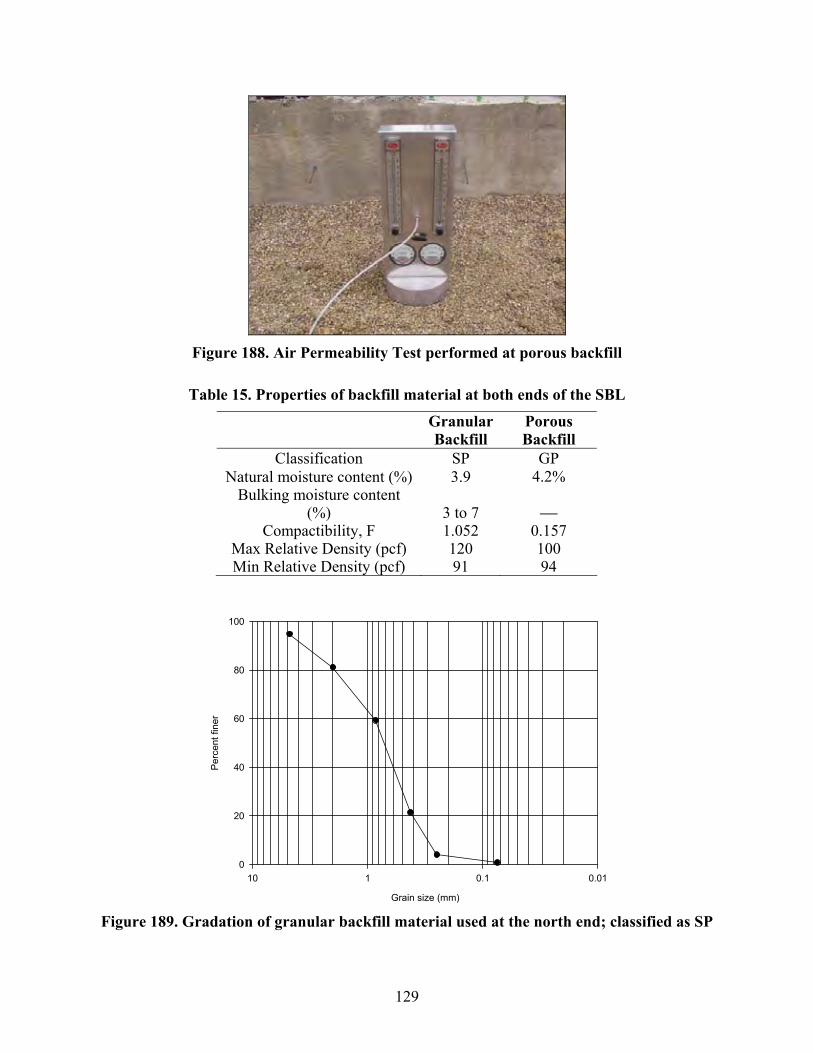
129
Figure 188. Air Permeability Test performed at porous backfill
Table 15. Properties of backfill material at both ends of the SBL
Granular Backfill
Porous Backfill
Classification SP GP Natural moisture content (%) 3.9 4.2%
Bulking moisture content (%) 3 to 7 ⎯
Compactibility, F 1.052 0.157 Max Relative Density (pcf) 120 100 Min Relative Density (pcf) 91 94
Grain size (mm)
0.010.1110
Perc
ent f
iner
0
20
40
60
80
100
Figure 189. Gradation of granular backfill material used at the north end; classified as SP

130
Grain size (mm)
0.1110100
Per
cent
fine
r
0
20
40
60
80
100
Figure 190. Gradation of porous backfill material used at the south end; classified as GP
Moisture content (%)
0 2 4 6 8 10 12 14 16
Dry
den
sity
(kN
/m3 )
17.6
17.8
18.0
18.2
18.4
18.6
18.8
19.0
Dry
den
sity
(pcf
)
112
114
116
118
120
Figure 191. Dry density–moisture content relationship of granular backfill used at the
North end. Vibrating table tests (ASTM D4253-00).
131
Polk Blvd Bridge over I-235 (District 1)
This bridge was inspected four times⎯twice in June, once in July, and once in October of 2003. At this location, the old bridge was being replaced and widened. The new bridge has concrete girders with integral abutments. During the first inspection, the old bridge at the north bound had been removed and the center pier of the new lane was being constructed (Figures 192 and 193). The old southbound lane bridge was still open for traffic and had non-integral abutments. At the southbound lane, concrete spalling of the abutment was observed (Figure 194). This bridge had a concrete slope protection cover for the embankment under the bridge. The bridge was inspected again in June 2003. During this field visit, the H-piles were being installed at the north end of the northbound lane, as shown in Figure 195. In July 2003, the bridge was visited again where retaining wall construction was taking place at the south end of the northbound lane (Figure 196). At the north end, the backwall was already constructed. Granular backfill material was used behind the abutment, as shown in Figure 197. No porous backfill was observed around the subdrain (Figure 198). When examined, the perforated drainage pipe was filled with sand particles. The bridge was inspected again in October 2003. The new north bound was completed and open for traffic, while the old south bound was removed and construction of the new bridge was in progress. During this field visit, H-piles were being driven at the north end, as shown in Figure 199. At the south end, construction and compaction of the backfill behind the retaining wall using a vibratory base plate was taking place (Figures 200 and 201) and the piles were already installed. The backfill material used behind the abutment was tested in the field and in the laboratory. Dynamic Cone Penetration (DCP) tests were performed at three locations behind the backwall at the north end of the north bound. Estimated California Bearing Ratio (CBR) values ranged from 1 to 8 at all test locations (Figures 202 through 205) indicating a soft/loose backfill material. Nuclear gage tests were also conducted at two locations behind the north end backwall. The average measured dry density was 105 pcf and the moisture content was 4.7%. Figure 206 shows the grain-size distribution for the granular backfill material, which was classified as SP according to the USCS. Minimum and maximum density, compactibility, and bulking moisture content for granular backfill were estimated using the relative density test (ASTM D4253-00). The maximum dry density was 113 pcf, the minimum dry density was 96 pcf, and the bulking moisture content ranged from 3% to 5% (Figure 207). The measured moisture content of the backfill material at the site was within this bulking moisture content range. Using the measured dry density in the field, the calculated relative density is 56%, which is medium dense. Compactibility of the granular backfill of 0.54 was calculated, which indicates a low compactibility for the backfill material (see Appendix C for calculations).
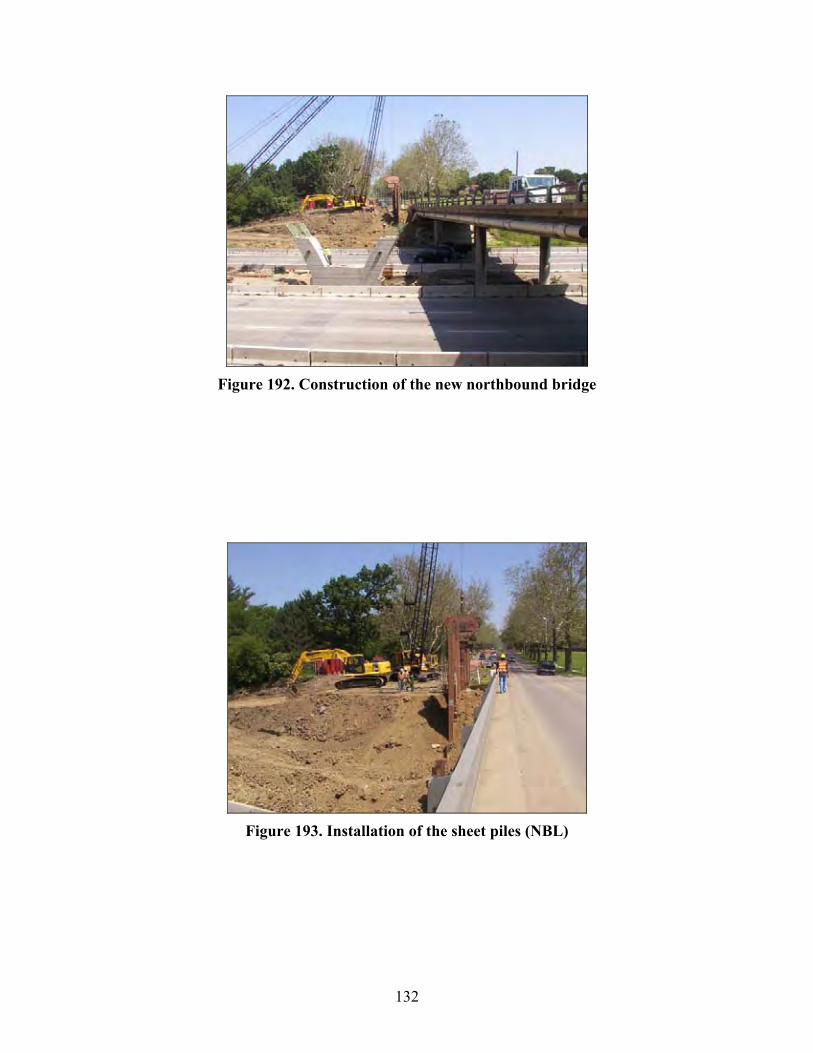
132
Figure 192. Construction of the new northbound bridge
Figure 193. Installation of the sheet piles (NBL)

133
Figure 194. Concrete spalling at the abutment (SBL)
Figure 195. Installation of H-Piles (North end of NBL)
Abutment
Girder
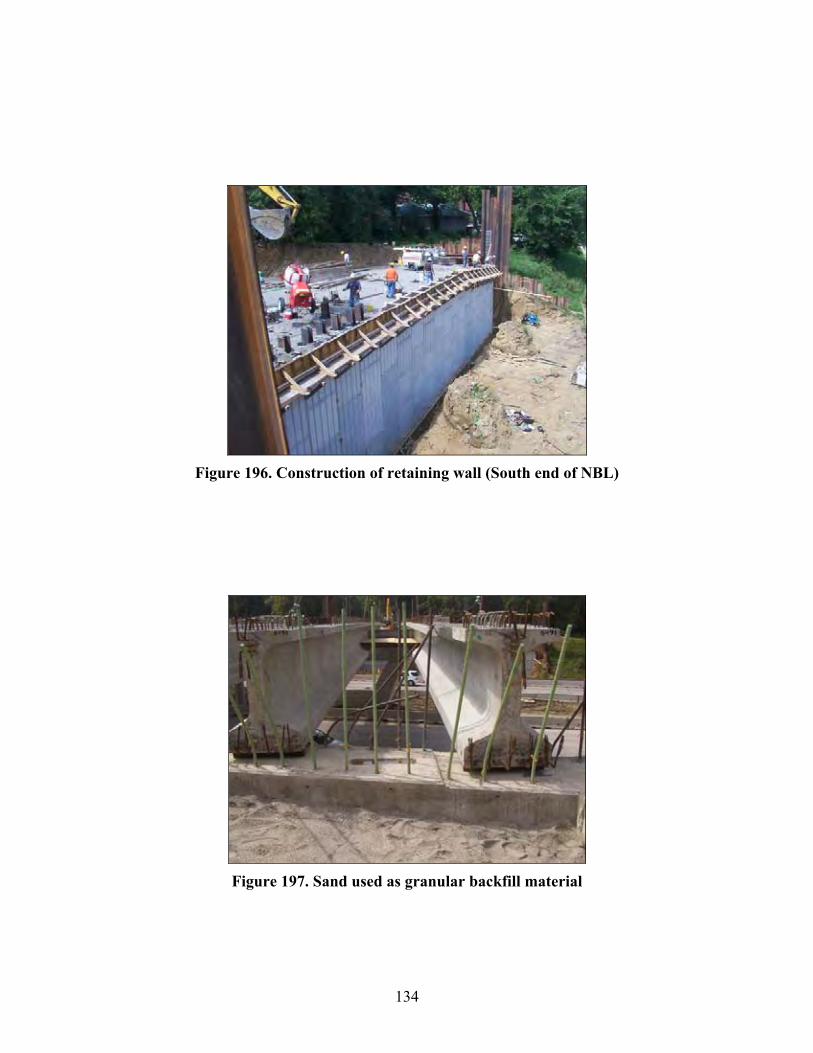
134
Figure 196. Construction of retaining wall (South end of NBL)
Figure 197. Sand used as granular backfill material

135
Figure 198. No porous fill surrounding the subdrain (North end NBL)
Figure 199. H-piles being driven

136
Figure 200. Construction of the retaining wall (South end of SBL)
Figure 201. Compaction of retaining wall fill material (South end of SBL)

137
Figure 202. DCP and Nuclear gauge tests (South end of NBL)
0
5
10
15
20
25
30
35
40
1 10 100
CBR
DEP
TH, i
n.
0
100
200
300
400
500
600
700
800
900
10001 10 100
DEP
TH, m
m
Figure 203. DCP test results (Location 1 North end of NBL)
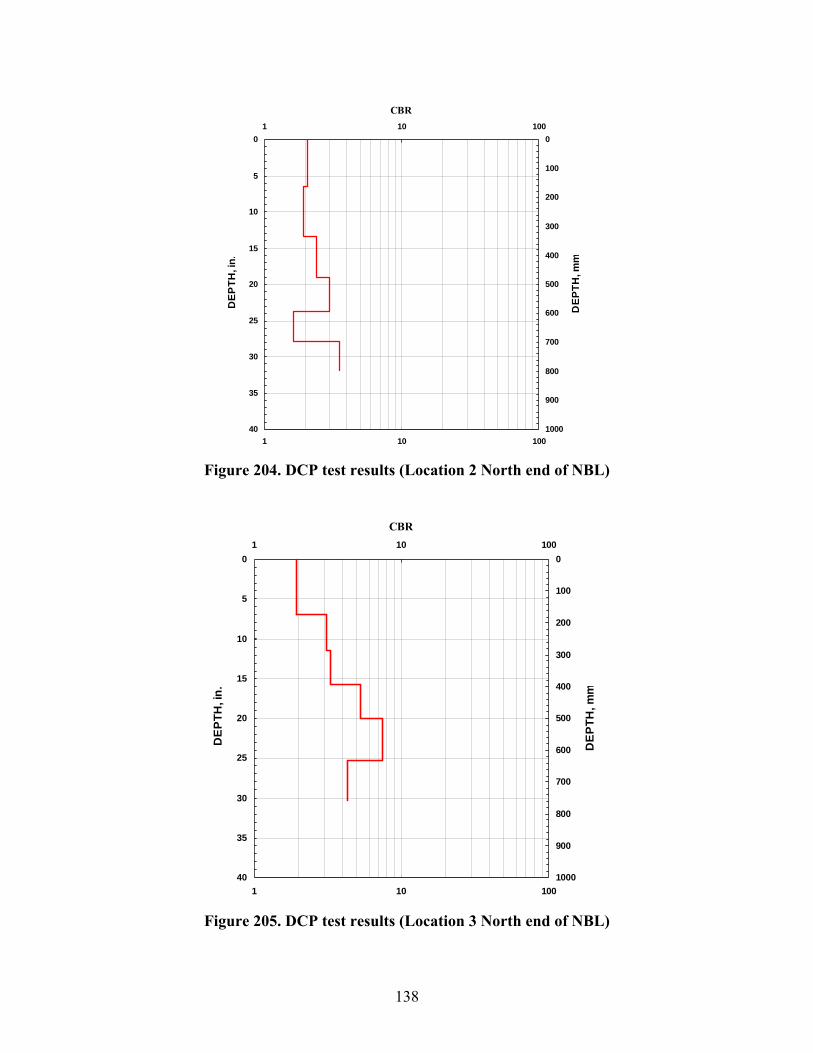
138
0
5
10
15
20
25
30
35
40
1 10 100
CBR
DEP
TH, i
n.
0
100
200
300
400
500
600
700
800
900
10001 10 100
DEP
TH, m
m
Figure 204. DCP test results (Location 2 North end of NBL)
0
5
10
15
20
25
30
35
40
1 10 100
CBR
DE
PTH
, in.
0
100
200
300
400
500
600
700
800
900
10001 10 100
DE
PTH
, mm
Figure 205. DCP test results (Location 3 North end of NBL)
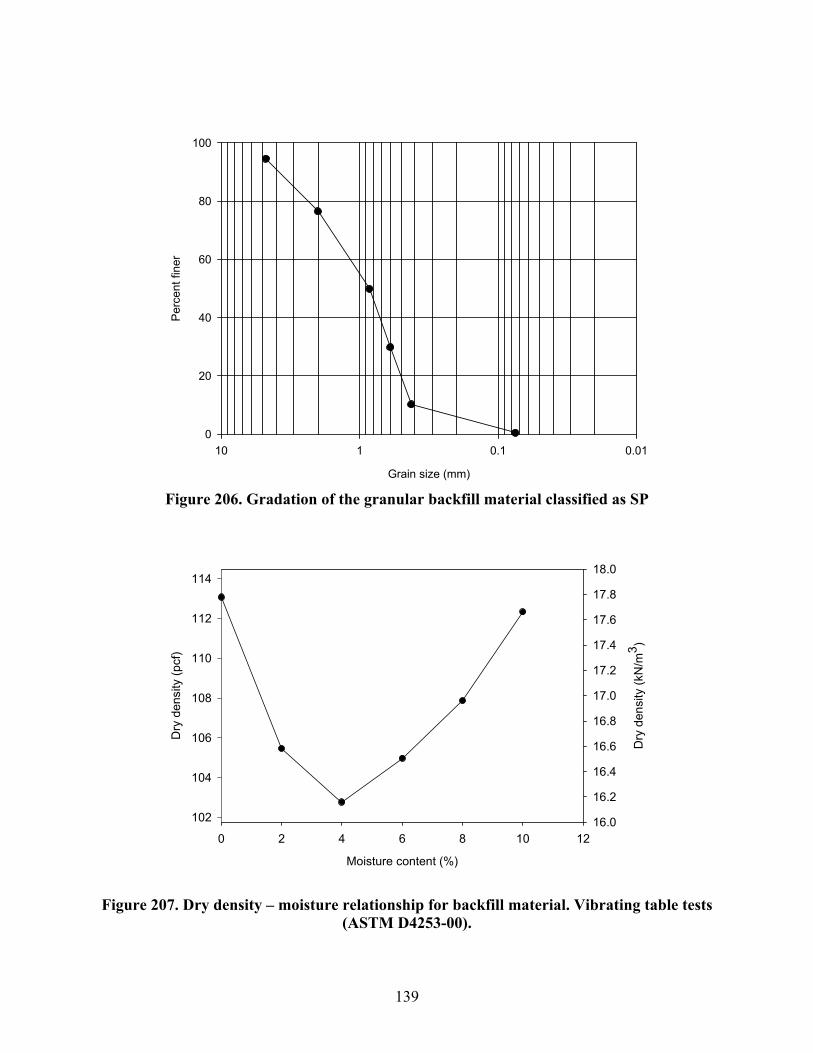
139
Grain size (mm)
0.010.1110
Per
cent
fine
r
0
20
40
60
80
100
Figure 206. Gradation of the granular backfill material classified as SP
Moisture content (%)
0 2 4 6 8 10 12
Dry
den
sity
(kN
/m3 )
16.0
16.2
16.4
16.6
16.8
17.0
17.2
17.4
17.6
17.8
18.0
Dry
den
sity
(pcf
)
102
104
106
108
110
112
114
Figure 207. Dry density – moisture relationship for backfill material. Vibrating table tests (ASTM D4253-00).
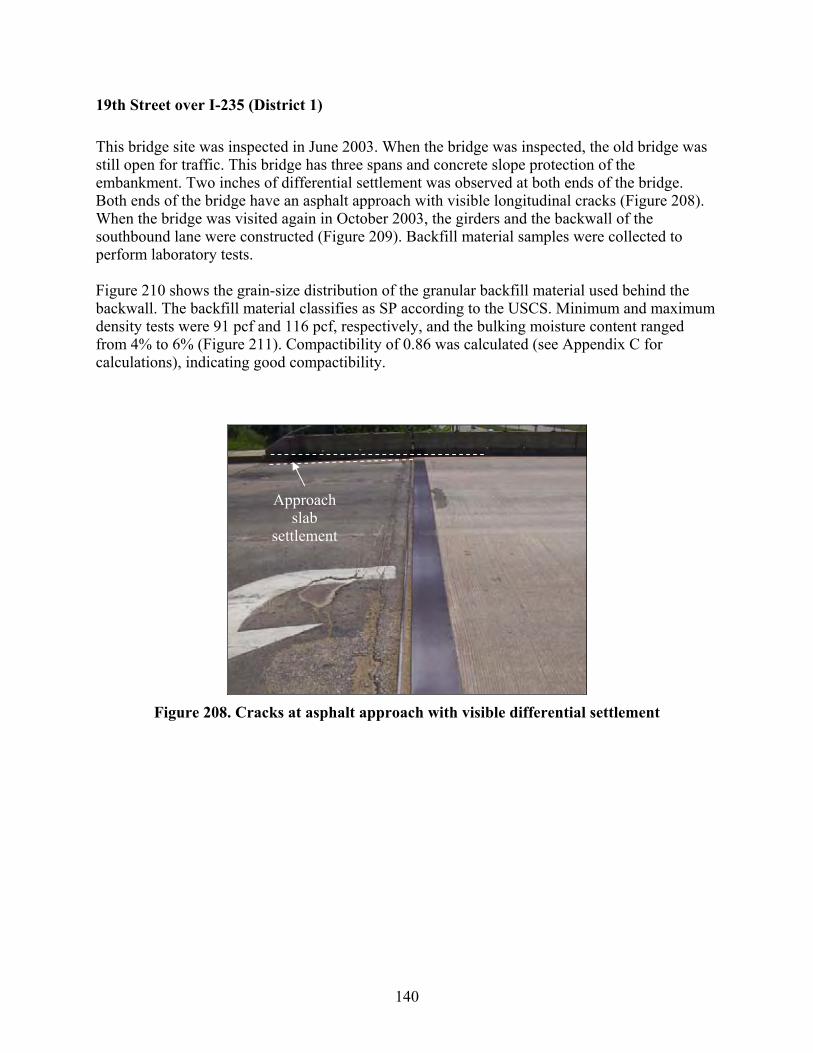
140
19th Street over I-235 (District 1)
This bridge site was inspected in June 2003. When the bridge was inspected, the old bridge was still open for traffic. This bridge has three spans and concrete slope protection of the embankment. Two inches of differential settlement was observed at both ends of the bridge. Both ends of the bridge have an asphalt approach with visible longitudinal cracks (Figure 208). When the bridge was visited again in October 2003, the girders and the backwall of the southbound lane were constructed (Figure 209). Backfill material samples were collected to perform laboratory tests. Figure 210 shows the grain-size distribution of the granular backfill material used behind the backwall. The backfill material classifies as SP according to the USCS. Minimum and maximum density tests were 91 pcf and 116 pcf, respectively, and the bulking moisture content ranged from 4% to 6% (Figure 211). Compactibility of 0.86 was calculated (see Appendix C for calculations), indicating good compactibility.
Figure 208. Cracks at asphalt approach with visible differential settlement
Approach slab
settlement

141
Figure 209. Construction of steel girders and backwall
Grain size (mm)
0.010.1110
Per
cent
fine
r
0
20
40
60
80
100
Figure 210. Gradation of granular backfill classified as SP

142
Moisture content (%)
0 2 4 6 8 10 12 14
Dry
den
sity
(kN
/m3 )
17.0
17.2
17.4
17.6
17.8
18.0
18.2
18.4
Dry
den
sity
(pcf
)
110
112
114
116
Figure 211. Density – moisture relationship for granular backfill. Vibrating table tests
(ASTM D4253-00).
Pennsylvania Avenue over I-235 (District 1)
This bridge was inspected in June and October 2003. In June, the center piers were still under construction, as shown in Figure 212. In October, the concrete slope protection for the embankment under the bridge was constructed (Figure 213). No porous backfill was placed around the subdrain. Figure 214 shows the outlet of the subdrain at the bottom of the embankment surrounded by granular backfill. When inspected, the subdrain was filled with soil.
Figure 212. Construction of center pier

143
Figure 213. Embankment concrete slope protection
Figure 214. Subdrain outlet at the bottom of the embankment
East 12th Street over I-235 (District 1)
During the first inspection in June 2003, the center pier and the backwall of both ends were under construction (Figure 215). As shown in Figure 215a, the soil near the south end of the northbound abutment appeared to be wet sandy soil. When inspected in October 2003, the construction of the bridge slab was in progress (Figure 216). Figure 217 shows the reinforcement of the abutment which was at 1 ft. spacing. A sample of backfill material was tested in the laboratory to determine the classification and compactibility. Figure 218 shows the grain size distribution of the backfill material. The granular backfill
Subdrain outlet

144
obtained at the backwall of the south bound was classified as SP according to the USCS. Relative density tests resulted in minimum and maximum dry densities of 96 pcf and 125 pcf and the bulking moisture content range of 3% to 5% (Figure 219). Compactibility of 1.227 was calculated indicating good compactibility of the backfill material (see Appendix C for calculations).
(a) Backwall construction (b) Center pier construction
Figure 215. Construction of backwall and center pier
Figure 216. Construction of bridge slab (NBL)
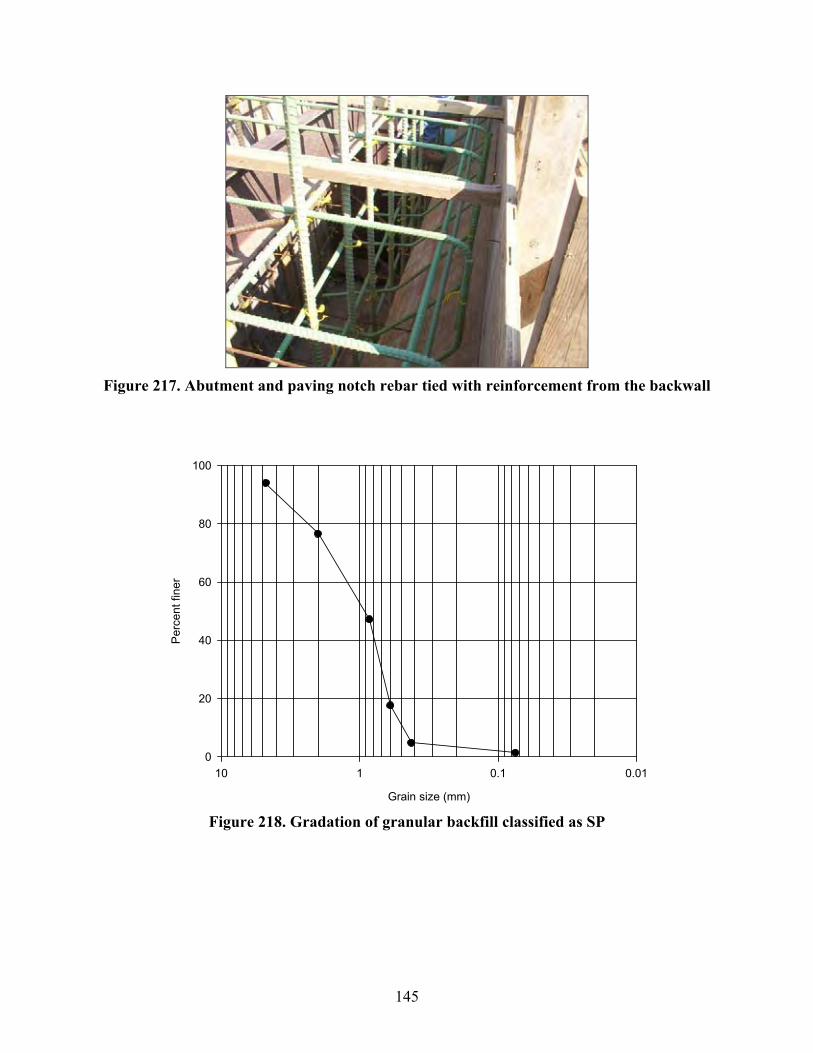
145
Figure 217. Abutment and paving notch rebar tied with reinforcement from the backwall
Grain size (mm)
0.010.1110
Per
cent
fine
r
0
20
40
60
80
100
Figure 218. Gradation of granular backfill classified as SP
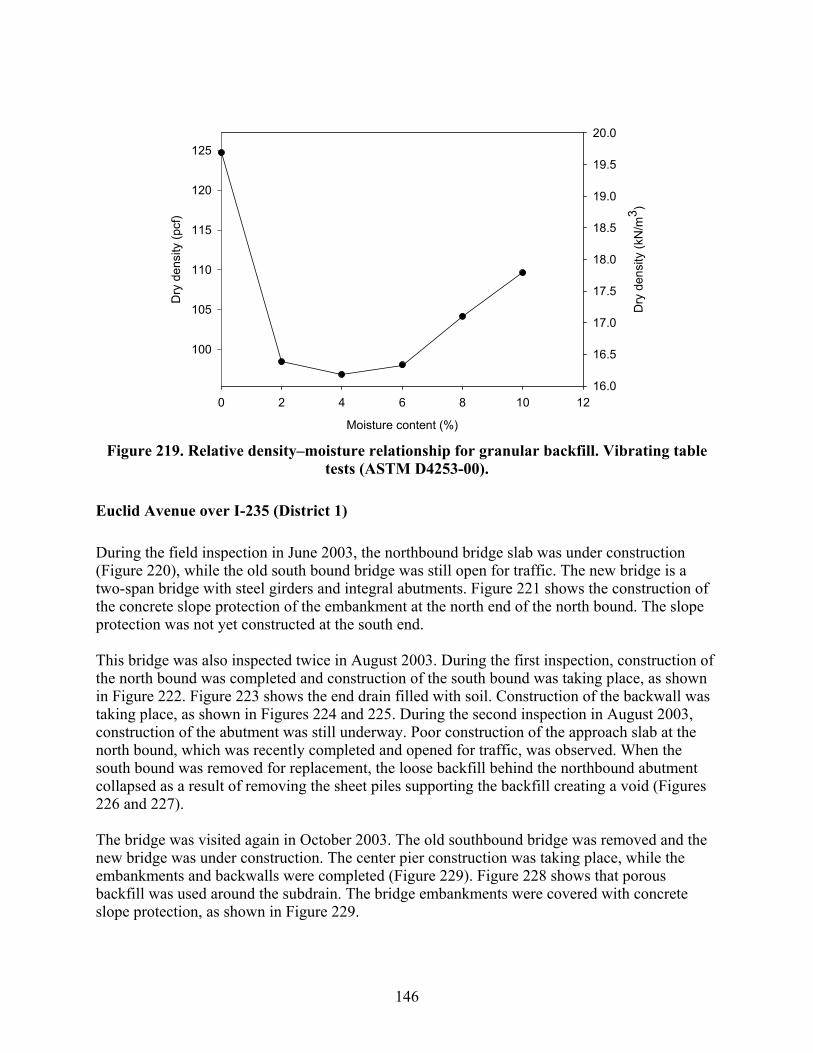
146
Moisture content (%)
0 2 4 6 8 10 12
Dry
den
sity
(kN
/m3 )
16.0
16.5
17.0
17.5
18.0
18.5
19.0
19.5
20.0
Dry
den
sity
(pcf
)
100
105
110
115
120
125
Figure 219. Relative density–moisture relationship for granular backfill. Vibrating table
tests (ASTM D4253-00).
Euclid Avenue over I-235 (District 1)
During the field inspection in June 2003, the northbound bridge slab was under construction (Figure 220), while the old south bound bridge was still open for traffic. The new bridge is a two-span bridge with steel girders and integral abutments. Figure 221 shows the construction of the concrete slope protection of the embankment at the north end of the north bound. The slope protection was not yet constructed at the south end. This bridge was also inspected twice in August 2003. During the first inspection, construction of the north bound was completed and construction of the south bound was taking place, as shown in Figure 222. Figure 223 shows the end drain filled with soil. Construction of the backwall was taking place, as shown in Figures 224 and 225. During the second inspection in August 2003, construction of the abutment was still underway. Poor construction of the approach slab at the north bound, which was recently completed and opened for traffic, was observed. When the south bound was removed for replacement, the loose backfill behind the northbound abutment collapsed as a result of removing the sheet piles supporting the backfill creating a void (Figures 226 and 227). The bridge was visited again in October 2003. The old southbound bridge was removed and the new bridge was under construction. The center pier construction was taking place, while the embankments and backwalls were completed (Figure 229). Figure 228 shows that porous backfill was used around the subdrain. The bridge embankments were covered with concrete slope protection, as shown in Figure 229.

147
Figure 220. Construction of bridge slab
Figure 221. Construction of slope protection at the embankment
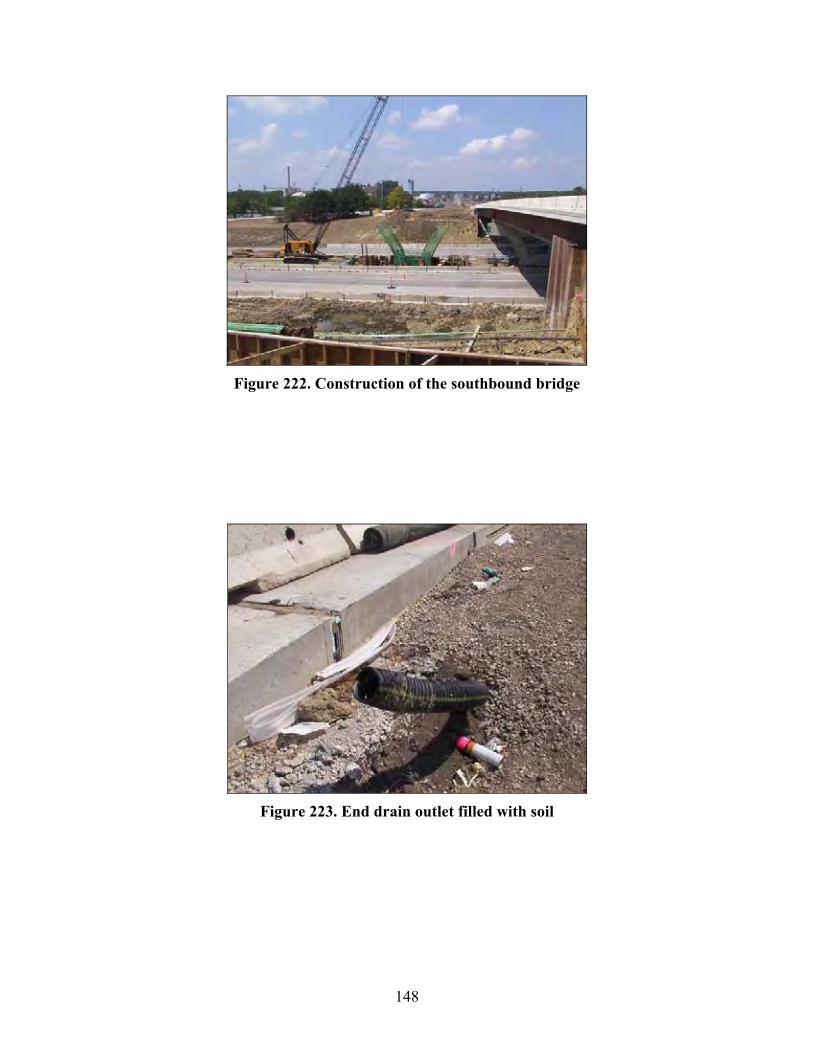
148
Figure 222. Construction of the southbound bridge
Figure 223. End drain outlet filled with soil
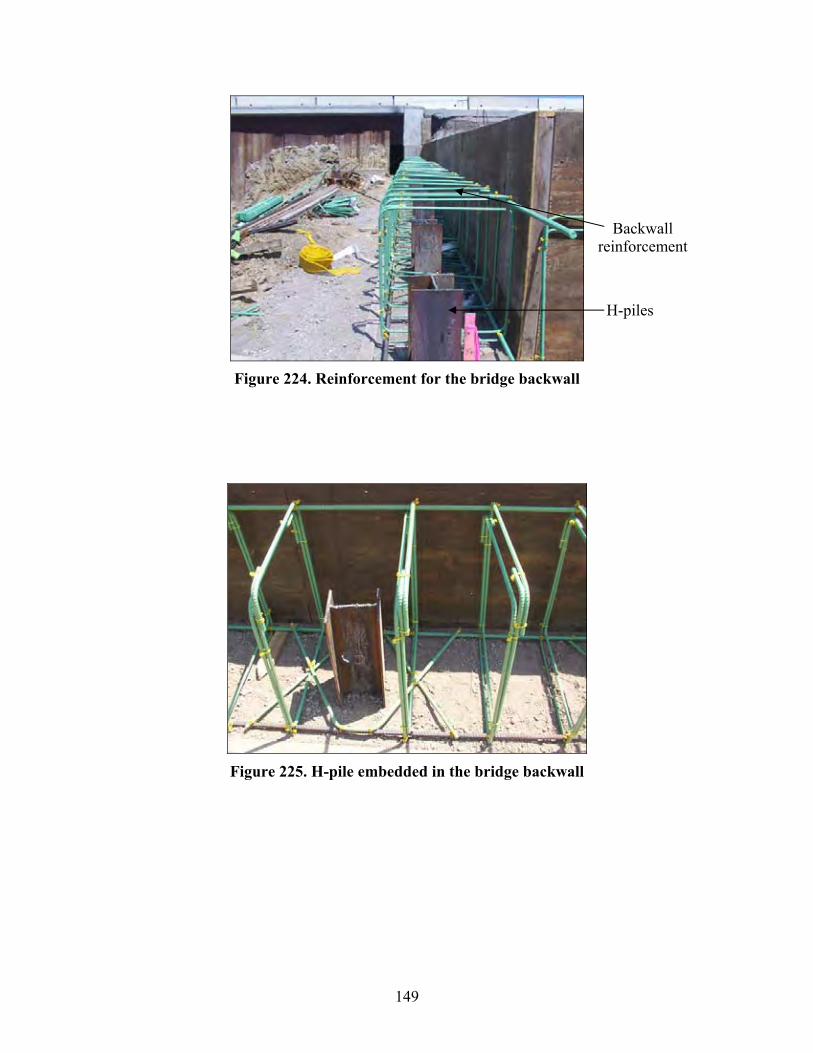
149
Figure 224. Reinforcement for the bridge backwall
Figure 225. H-pile embedded in the bridge backwall
Backwall reinforcement
H-piles
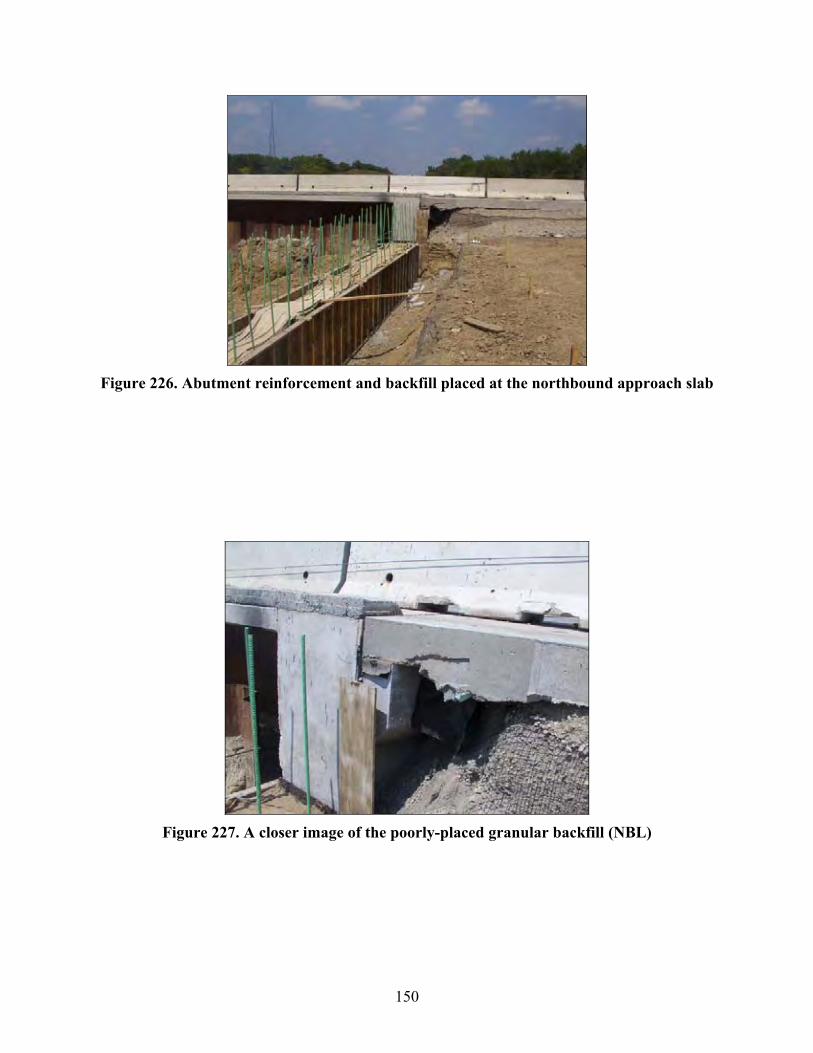
150
Figure 226. Abutment reinforcement and backfill placed at the northbound approach slab
Figure 227. A closer image of the poorly-placed granular backfill (NBL)
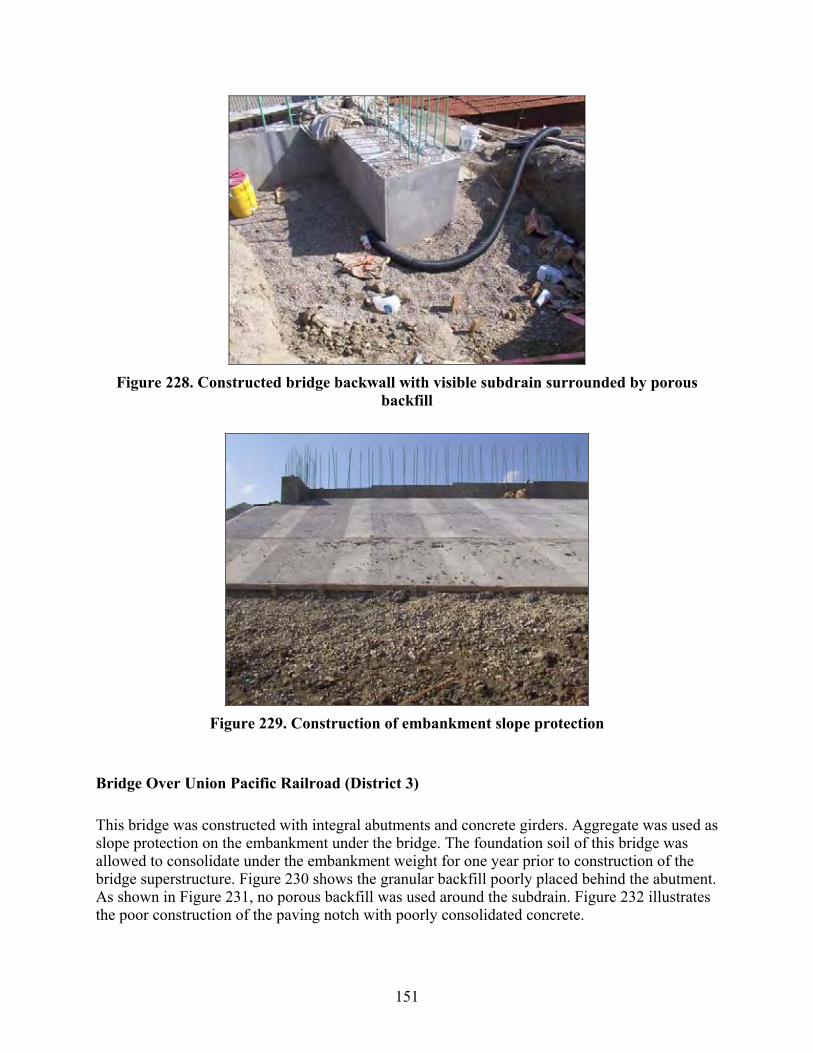
151
Figure 228. Constructed bridge backwall with visible subdrain surrounded by porous
backfill
Figure 229. Construction of embankment slope protection
Bridge Over Union Pacific Railroad (District 3)
This bridge was constructed with integral abutments and concrete girders. Aggregate was used as slope protection on the embankment under the bridge. The foundation soil of this bridge was allowed to consolidate under the embankment weight for one year prior to construction of the bridge superstructure. Figure 230 shows the granular backfill poorly placed behind the abutment. As shown in Figure 231, no porous backfill was used around the subdrain. Figure 232 illustrates the poor construction of the paving notch with poorly consolidated concrete.

152
The backfill material sample obtained at the bridge site, which had a moisture content of 4.1%, classifies as SP according to the USCS. Figure 233 shows the grain-size distribution of the granular backfill material. A coefficient of permeability of 0.01 cm/s (see Appendix C for calculations) was measured following constant head permeability tests methods (ASTM D 2434).
Figure 230. Poorly placed granular backfill
Figure 231. Granular backfill surrounding the subdrain
AbutmentWingwall
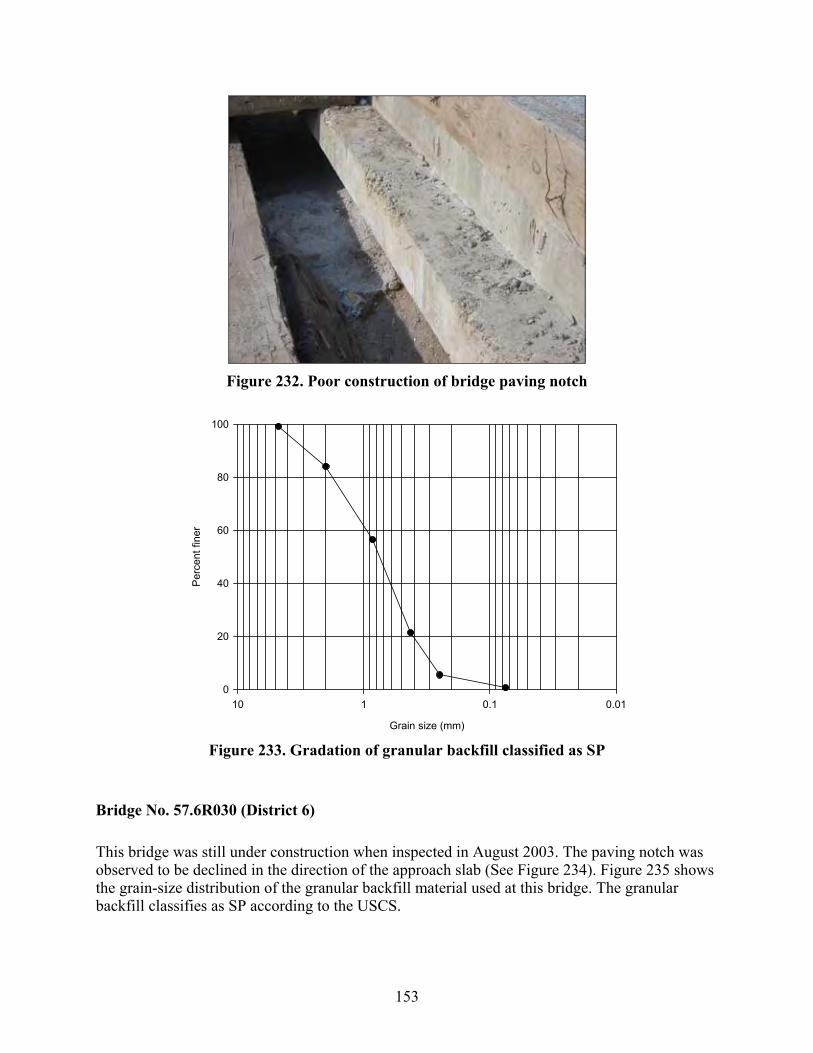
153
Figure 232. Poor construction of bridge paving notch
Grain size (mm)
0.010.1110
Per
cent
fine
r
0
20
40
60
80
100
Figure 233. Gradation of granular backfill classified as SP
Bridge No. 57.6R030 (District 6)
This bridge was still under construction when inspected in August 2003. The paving notch was observed to be declined in the direction of the approach slab (See Figure 234). Figure 235 shows the grain-size distribution of the granular backfill material used at this bridge. The granular backfill classifies as SP according to the USCS.

154
Figure 234. Declined paving notch
Grain size (mm)
0.010.1110100
Per
cent
fine
r
0
20
40
60
80
100
Figure 235. Gradation of granular backfill classified as SP
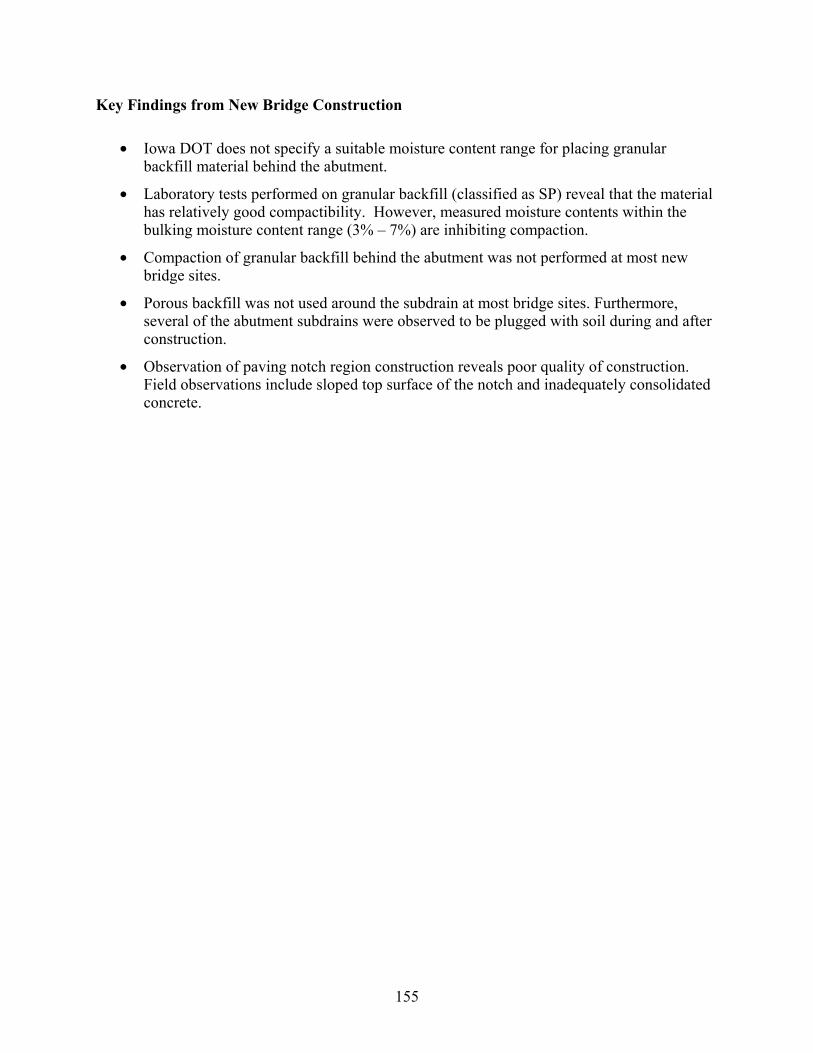
155
Key Findings from New Bridge Construction
• Iowa DOT does not specify a suitable moisture content range for placing granular backfill material behind the abutment.
• Laboratory tests performed on granular backfill (classified as SP) reveal that the material has relatively good compactibility. However, measured moisture contents within the bulking moisture content range (3% – 7%) are inhibiting compaction.
• Compaction of granular backfill behind the abutment was not performed at most new bridge sites.
• Porous backfill was not used around the subdrain at most bridge sites. Furthermore, several of the abutment subdrains were observed to be plugged with soil during and after construction.
• Observation of paving notch region construction reveals poor quality of construction. Field observations include sloped top surface of the notch and inadequately consolidated concrete.

156
MAINTENANCE AND REHABILITATION PRACTICES
Observations of repair and maintenance practices were carried out at several bridge sites on US highway 65 near Des Moines and one Bridge site on US highway 218. In July 2004, a project was let to address bridge approach problems at seven sites on a thirteen mile section of US65 on the east side of Des Moines. The project involved replacing seven abutment paving notches and approach slabs (five bridges) and raising four approach slabs (two bridges) using URETEK method. This uses expanding, high density polyurethane foam to lift and fill voids under concrete slabs. This section of the report describes results from this investigation phase of the project. Bridge at US 218 crossing Railroad (District 5)
This bridge has three spans with steel girders and non-integral abutments. The bridge approach was grouted to fill a void (see Figure 236). During the field inspection, replacement of both approach slabs and the paving notch of the northbound lanes were in progress. The approach slabs were replaced due to excessive settlement and cracking, which is believed to be a result of severe erosion and subsequent void development. At the south end of the bridge, new granular backfill was placed and compacted in 8-inch-loose lifts using a vibratory base plate. The width of the newly constructed paving notch was 12 inches, with an expansion joint width of 2.5 inches (Figure 237). The bridge did not have subdrains and none were installed. The bridge embankment soil is mostly silty clay with no slope protection. At the north end of the bridge, re-construction of the abutment was still in progress (Figure 238).
Figure 236. Grout pumped under existing approach (South end of SBL)
Bridge approach
Grout
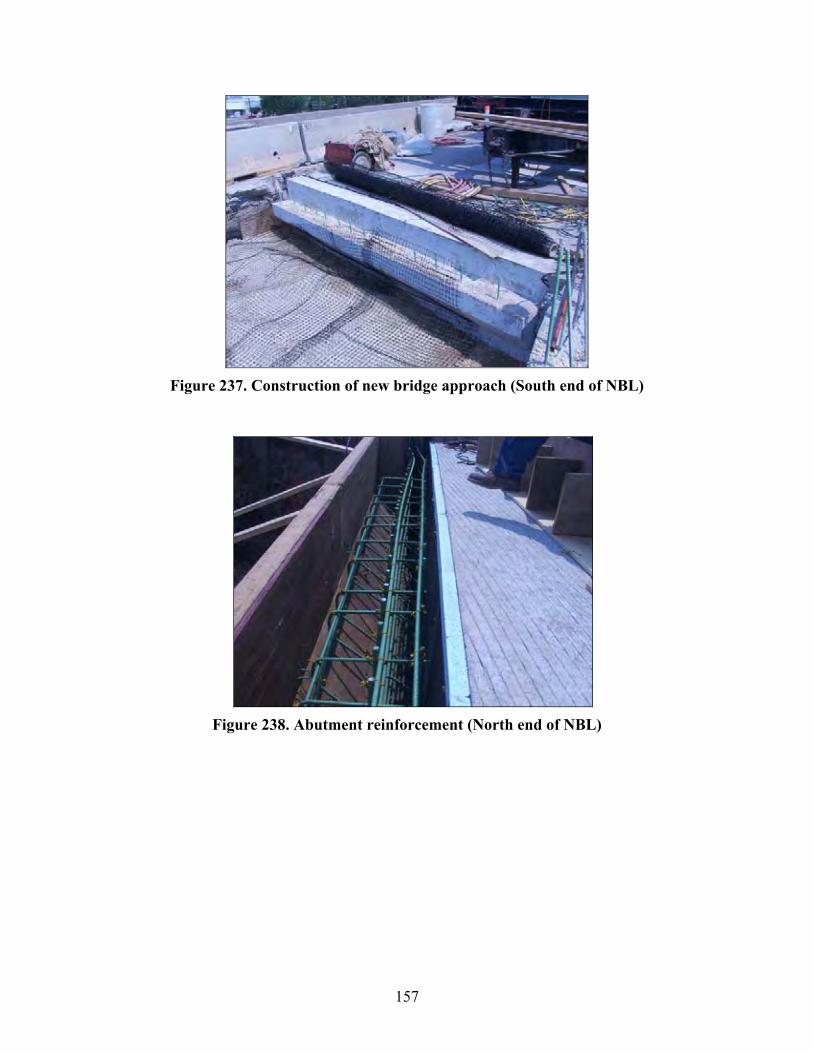
157
Figure 237. Construction of new bridge approach (South end of NBL)
Figure 238. Abutment reinforcement (North end of NBL)
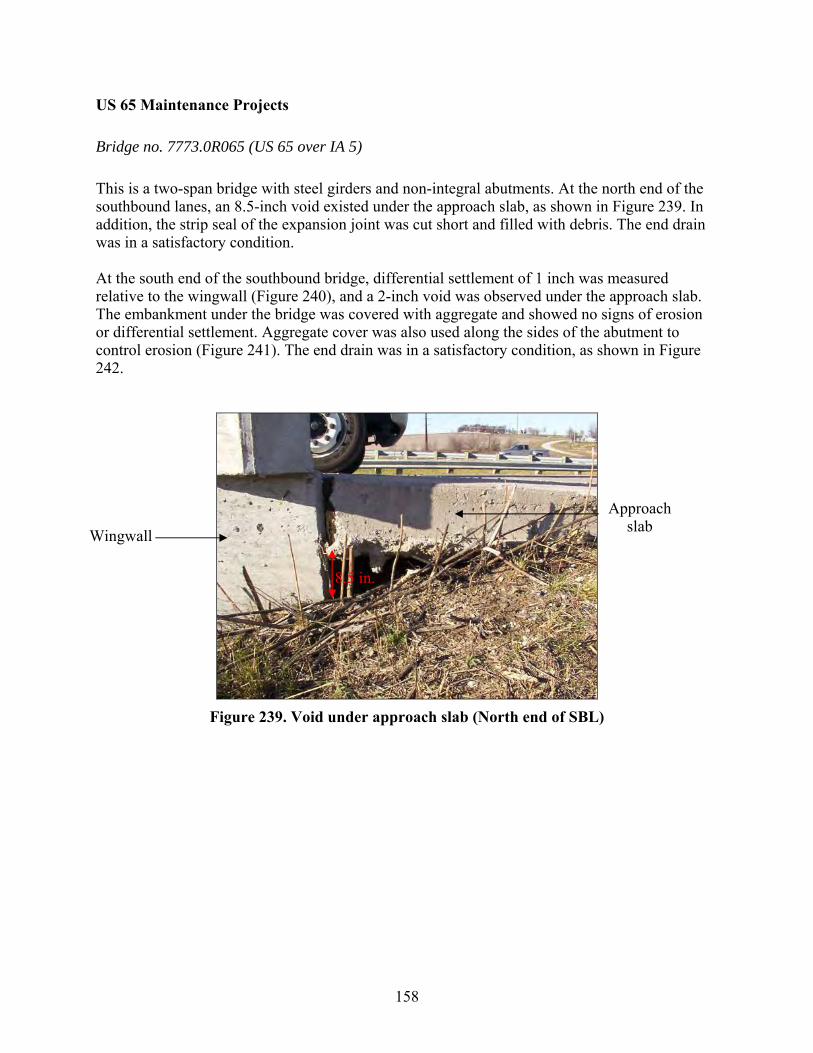
158
US 65 Maintenance Projects
Bridge no. 7773.0R065 (US 65 over IA 5)
This is a two-span bridge with steel girders and non-integral abutments. At the north end of the southbound lanes, an 8.5-inch void existed under the approach slab, as shown in Figure 239. In addition, the strip seal of the expansion joint was cut short and filled with debris. The end drain was in a satisfactory condition. At the south end of the southbound bridge, differential settlement of 1 inch was measured relative to the wingwall (Figure 240), and a 2-inch void was observed under the approach slab. The embankment under the bridge was covered with aggregate and showed no signs of erosion or differential settlement. Aggregate cover was also used along the sides of the abutment to control erosion (Figure 241). The end drain was in a satisfactory condition, as shown in Figure 242.
Figure 239. Void under approach slab (North end of SBL)
Approach slab Wingwall
8.5 in.
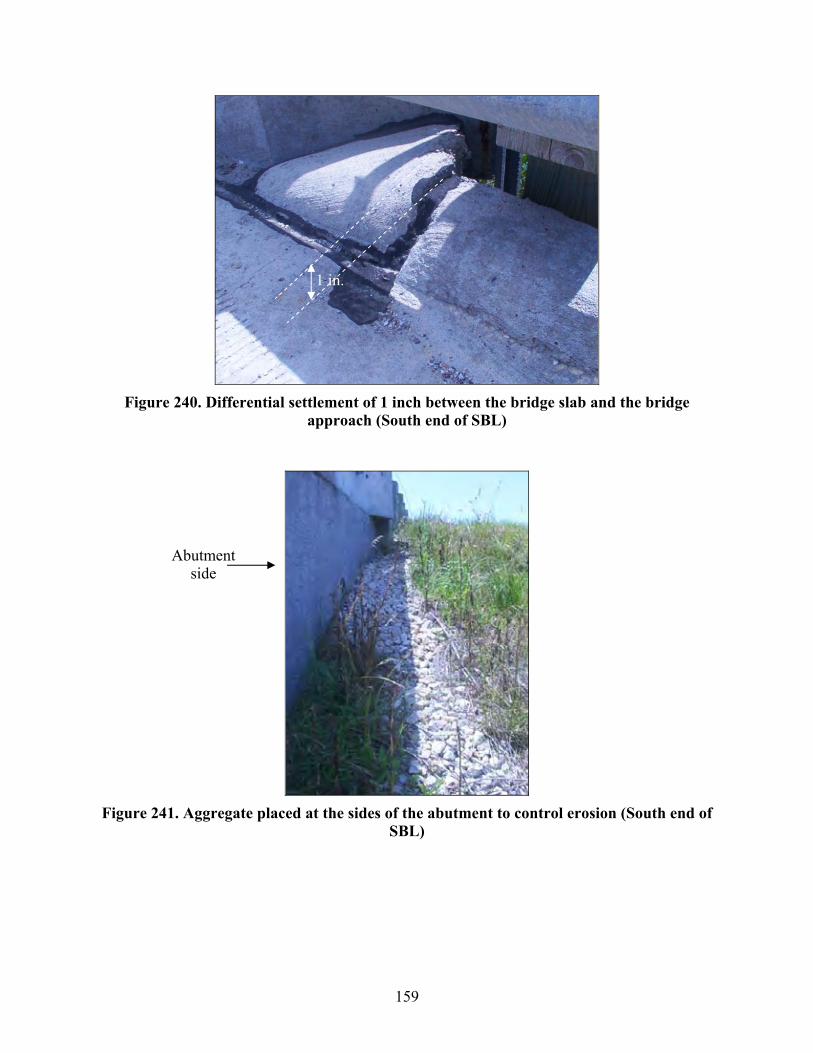
159
Figure 240. Differential settlement of 1 inch between the bridge slab and the bridge
approach (South end of SBL)
Figure 241. Aggregate placed at the sides of the abutment to control erosion (South end of
SBL)
1 in.
Abutment side

160
Figure 242. End drain in a satisfactory condition (South end of SBL)
At this bridge site, Iowa DOT personnel cored the approach slabs to measure the size of the void under the pavement. Two cores were collected ⎯ one at the edge line and one at the center⎯of the right lane at about 15 inches from the bridge. As the cored concrete was dropped into the void, the distance relative to the original slab level was measured to estimate the void size. The concrete sample was then removed and the core was filled with expanding foam. At this bridge, the approach slab of the north end of the north bound was cored and a 2-inch void was measured. Due to the large void observed at the edge of the approach slab (See Figure 239), an additional third core was taken at the center line about 18 ft away from the bridge, but no void was detected. The thickness of the cored concrete was about 10.5 inches. The research team measured the profile of approach slabs. The elevation of the approach slab and the roadway at the CF joint relative to the bridge slab at the edge line of the right lane were also measured. The line connecting the elevations of the points on the bridge slab and the point on the roadway are assumed to be the original profile of the approach slab. Bridge approach differential settlement can then be estimated using the difference between the measured profile and the original profile. At this bridge, profiles of the north and south ends of the southbound lane are shown in Figure 243. Differential settlement of 0.5 inches was estimated between the approach slab and the roadway at both ends of the southbound lanes. The slopes for the north and south end approach slabs are -0.007 and -0.018. The approach slabs are sloping away from the bridge, which may indicate settlement of the foundation soil or compression of the embankment material. According to the Iowa DOT repair recommendation, only the approach slab at the north end was replaced. The subdrains of the northbound lanes were inspected using the Iowa DOT snake camera (Figures 244 and 245). At the north end, water and mud were observed within the first 9 ft. inside the subdrain (Figures 246 and 247). The snake camera was pulled out, cleaned, and

161
reinserted. However, the camera could not be pushed beyond 14.4 ft., where the subdrain had collapsed. At the south end, the subdrain was completely dry and did not have any observed water or soil debris. The camera, however, could not be pushed beyond 9.8 ft. into the subdrain because of subdrain collapse.
Distance away from the bridge (ft)
0 10 20 30 40 50 60 70 80
App
roac
h sl
ab e
leva
tion
rela
tive
to b
ridge
sla
b (ft
)
-1.0
-0.8
-0.6
-0.4
-0.2
0.0
Distance away from the bridge (m)
0 2 4 6 8 10 12 14 16 18 20 22 24
App
roac
h sl
ab e
leva
tion
rela
tive
to b
ridge
sla
b (m
)
-0.30
-0.25
-0.20
-0.15
-0.10
-0.05
0.00
North endSouth end
Slope = -0.018
Slope = -0.007
Figure 243. Profiles of the approach slab relative to bridge slab (SBL)
Figure 244. Snake camera used to inspect subdrains
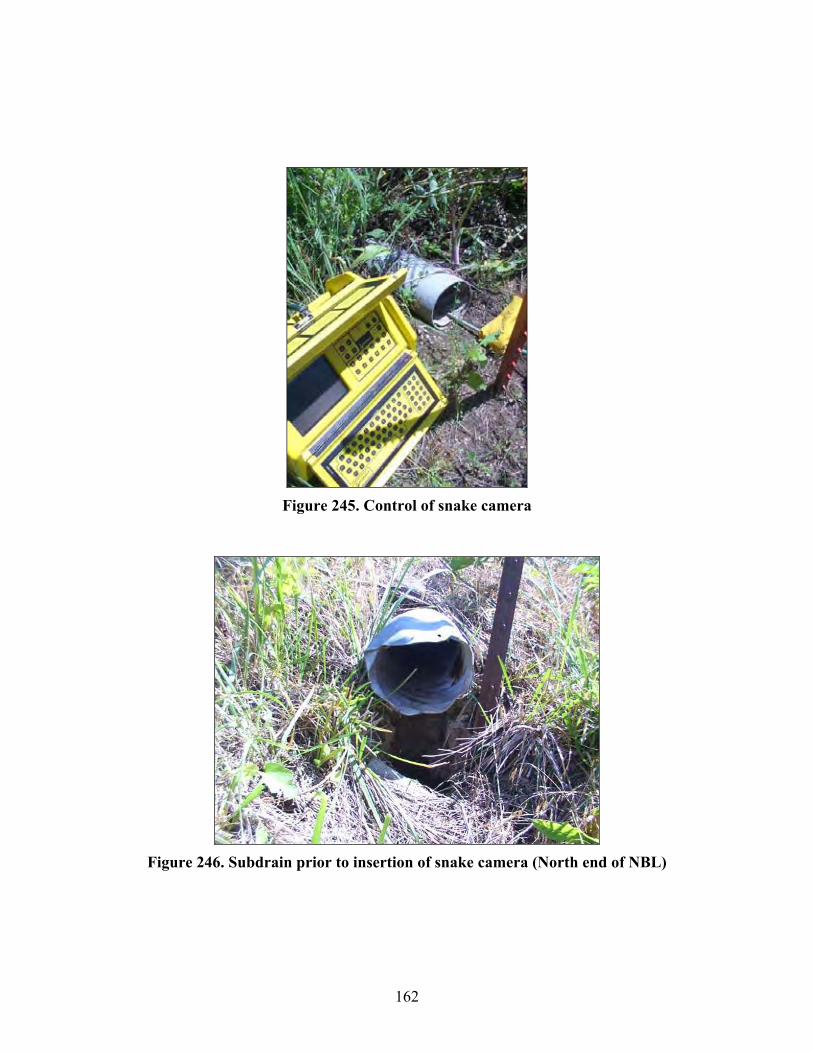
162
Figure 245. Control of snake camera
Figure 246. Subdrain prior to insertion of snake camera (North end of NBL)
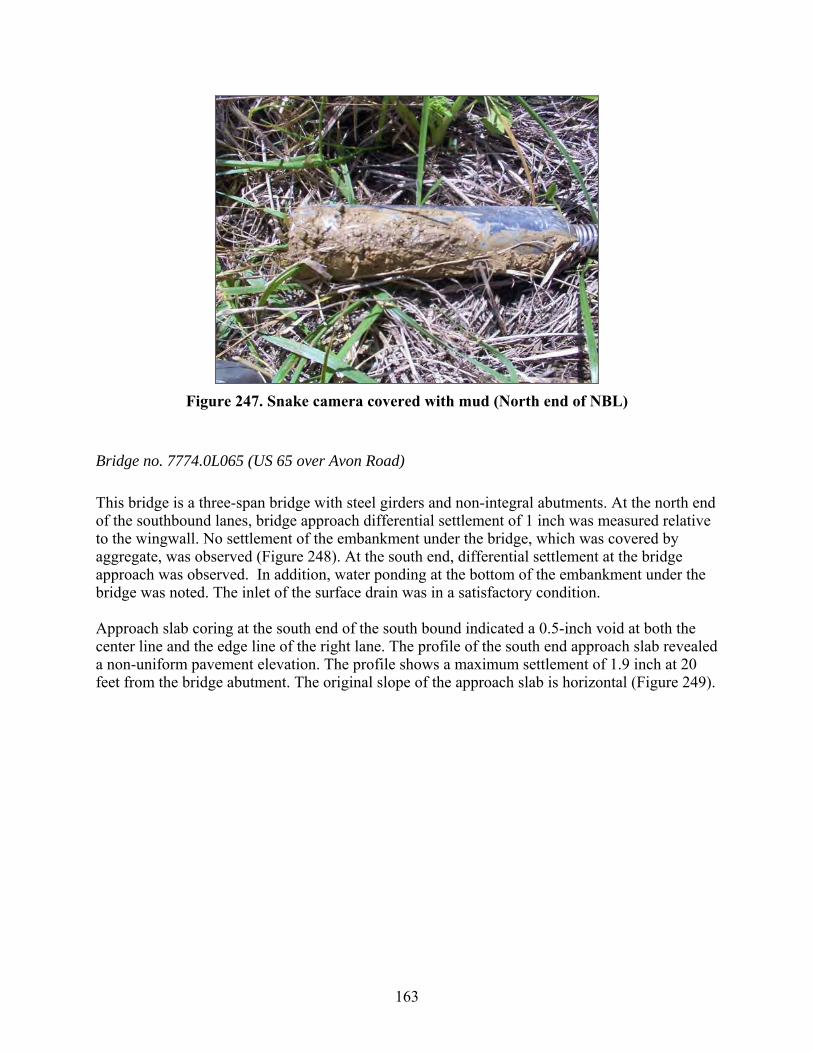
163
Figure 247. Snake camera covered with mud (North end of NBL)
Bridge no. 7774.0L065 (US 65 over Avon Road)
This bridge is a three-span bridge with steel girders and non-integral abutments. At the north end of the southbound lanes, bridge approach differential settlement of 1 inch was measured relative to the wingwall. No settlement of the embankment under the bridge, which was covered by aggregate, was observed (Figure 248). At the south end, differential settlement at the bridge approach was observed. In addition, water ponding at the bottom of the embankment under the bridge was noted. The inlet of the surface drain was in a satisfactory condition. Approach slab coring at the south end of the south bound indicated a 0.5-inch void at both the center line and the edge line of the right lane. The profile of the south end approach slab revealed a non-uniform pavement elevation. The profile shows a maximum settlement of 1.9 inch at 20 feet from the bridge abutment. The original slope of the approach slab is horizontal (Figure 249).
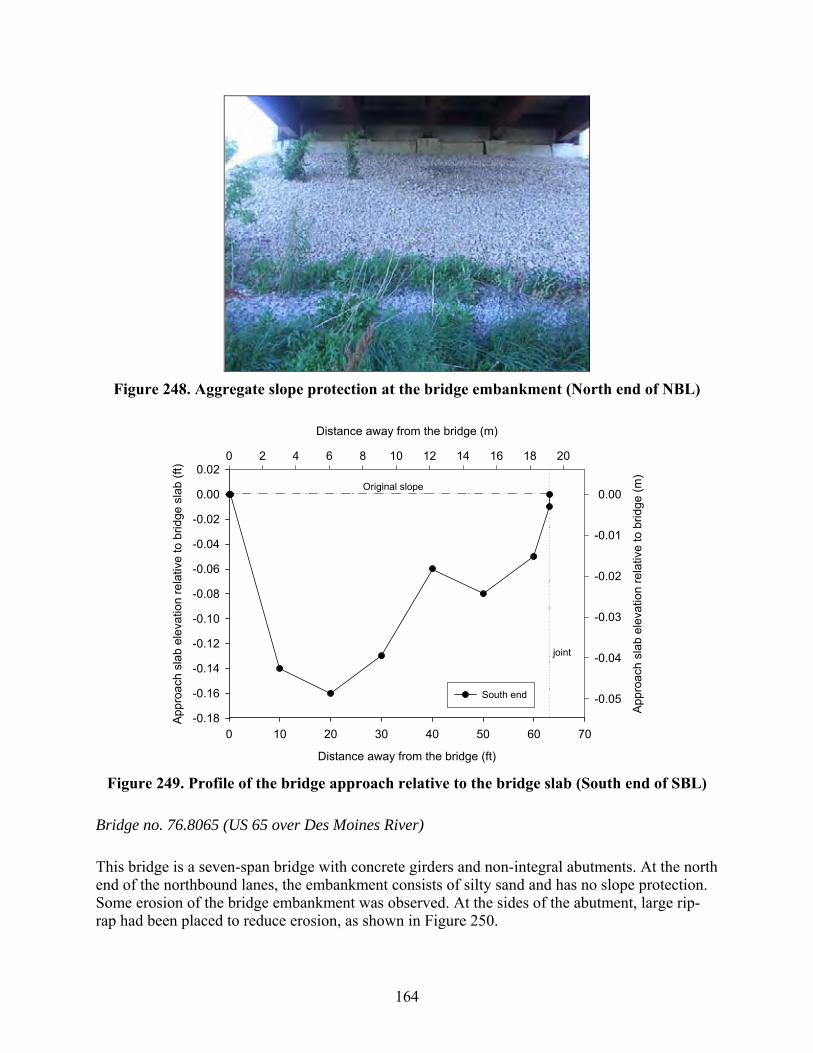
164
Figure 248. Aggregate slope protection at the bridge embankment (North end of NBL)
Distance away from the bridge (ft)
0 10 20 30 40 50 60 70
App
roac
h sl
ab e
leva
tion
rela
tive
to b
ridge
sla
b (ft
)
-0.18
-0.16
-0.14
-0.12
-0.10
-0.08
-0.06
-0.04
-0.02
0.00
0.02
Distance away from the bridge (m)
0 2 4 6 8 10 12 14 16 18 20
App
roac
h sl
ab e
leva
tion
rela
tive
to b
ridge
(m)
-0.05
-0.04
-0.03
-0.02
-0.01
0.00
South end
joint
Original slope
Figure 249. Profile of the bridge approach relative to the bridge slab (South end of SBL)
Bridge no. 76.8065 (US 65 over Des Moines River)
This bridge is a seven-span bridge with concrete girders and non-integral abutments. At the north end of the northbound lanes, the embankment consists of silty sand and has no slope protection. Some erosion of the bridge embankment was observed. At the sides of the abutment, large rip-rap had been placed to reduce erosion, as shown in Figure 250.
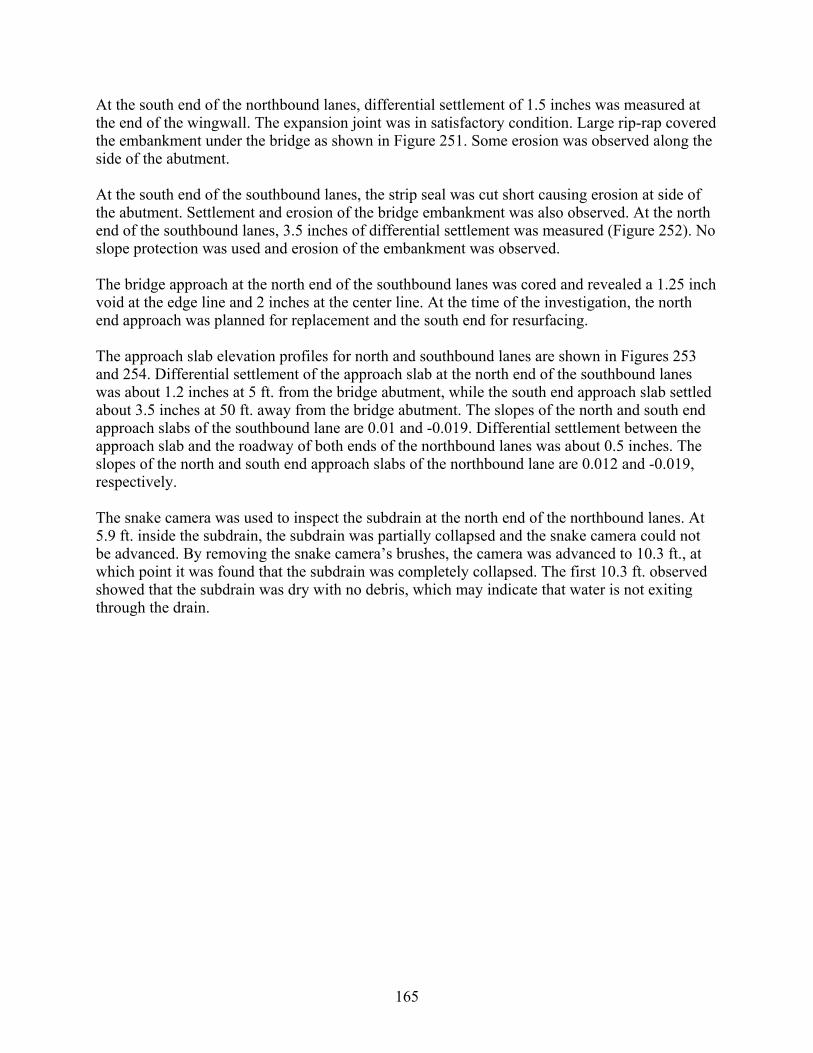
165
At the south end of the northbound lanes, differential settlement of 1.5 inches was measured at the end of the wingwall. The expansion joint was in satisfactory condition. Large rip-rap covered the embankment under the bridge as shown in Figure 251. Some erosion was observed along the side of the abutment. At the south end of the southbound lanes, the strip seal was cut short causing erosion at side of the abutment. Settlement and erosion of the bridge embankment was also observed. At the north end of the southbound lanes, 3.5 inches of differential settlement was measured (Figure 252). No slope protection was used and erosion of the embankment was observed. The bridge approach at the north end of the southbound lanes was cored and revealed a 1.25 inch void at the edge line and 2 inches at the center line. At the time of the investigation, the north end approach was planned for replacement and the south end for resurfacing. The approach slab elevation profiles for north and southbound lanes are shown in Figures 253 and 254. Differential settlement of the approach slab at the north end of the southbound lanes was about 1.2 inches at 5 ft. from the bridge abutment, while the south end approach slab settled about 3.5 inches at 50 ft. away from the bridge abutment. The slopes of the north and south end approach slabs of the southbound lane are 0.01 and -0.019. Differential settlement between the approach slab and the roadway of both ends of the northbound lanes was about 0.5 inches. The slopes of the north and south end approach slabs of the northbound lane are 0.012 and -0.019, respectively. The snake camera was used to inspect the subdrain at the north end of the northbound lanes. At 5.9 ft. inside the subdrain, the subdrain was partially collapsed and the snake camera could not be advanced. By removing the snake camera’s brushes, the camera was advanced to 10.3 ft., at which point it was found that the subdrain was completely collapsed. The first 10.3 ft. observed showed that the subdrain was dry with no debris, which may indicate that water is not exiting through the drain.
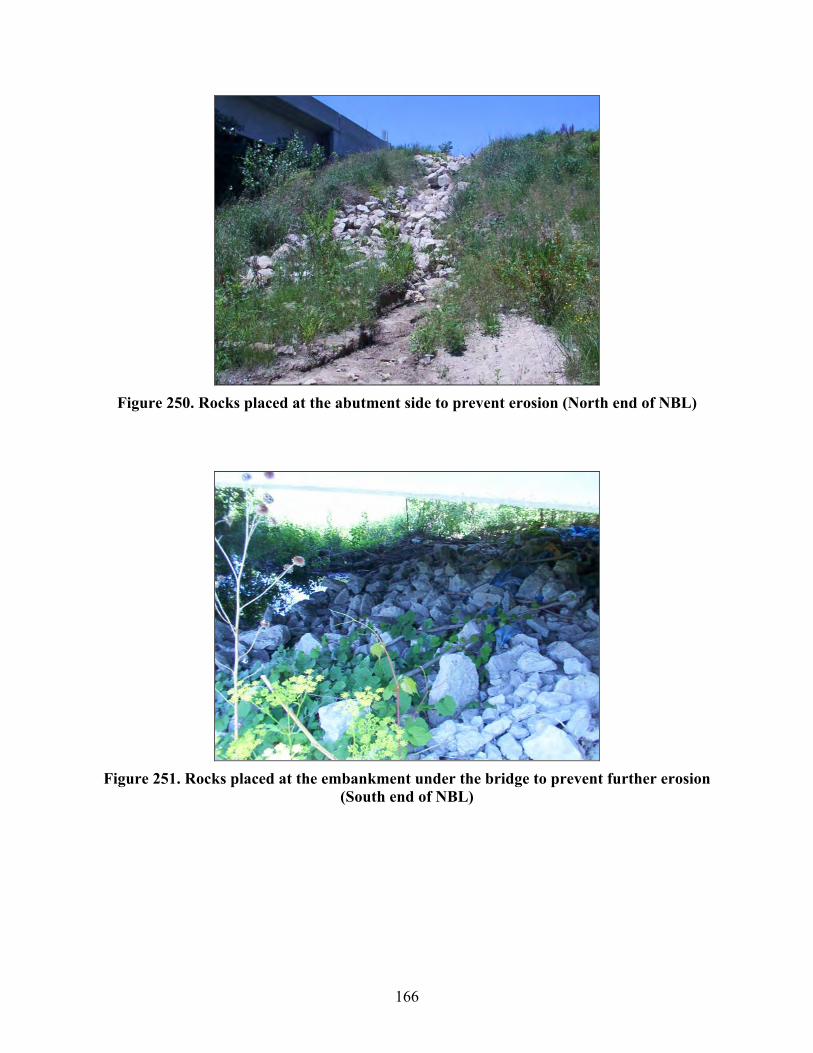
166
Figure 250. Rocks placed at the abutment side to prevent erosion (North end of NBL)
Figure 251. Rocks placed at the embankment under the bridge to prevent further erosion
(South end of NBL)

167
Figure 252. Settlement of approach slab (North end NBL)
Distance away from the bridge (ft)
0 10 20 30 40 50 60 70
App
roac
h sl
ab e
leva
tion
rela
tive
to b
ridge
sla
b (ft
)
-1.5
-1.0
-0.5
0.0
0.5
1.0
Distance away from the bridge (m)
0 2 4 6 8 10 12 14 16 18 20
App
roac
h sl
ab e
leva
tion
rela
tive
to b
ridge
sla
b (m
)
-0.4
-0.2
0.0
0.2
North endSouth end
Slope = 0.012
Slope = -0.019
Figure 253. Profiles of the approach slab relative to bridge slab (NBL)
Approach slab
settlement
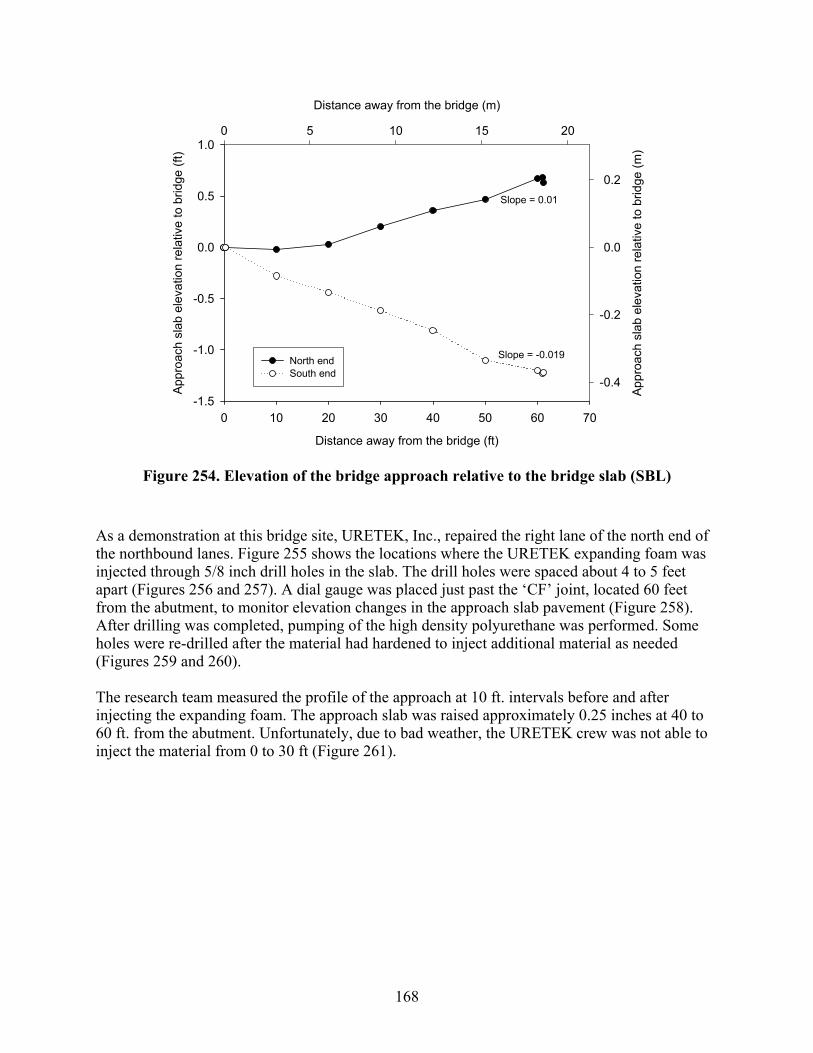
168
Distance away from the bridge (ft)
0 10 20 30 40 50 60 70
App
roac
h sl
ab e
leva
tion
rela
tive
to b
ridge
(ft)
-1.5
-1.0
-0.5
0.0
0.5
1.0
Distance away from the bridge (m)
0 5 10 15 20
App
roac
h sl
ab e
leva
tion
rela
tive
to b
ridge
(m)
-0.4
-0.2
0.0
0.2
North endSouth end
Slope = 0.01
Slope = -0.019
Figure 254. Elevation of the bridge approach relative to the bridge slab (SBL)
As a demonstration at this bridge site, URETEK, Inc., repaired the right lane of the north end of the northbound lanes. Figure 255 shows the locations where the URETEK expanding foam was injected through 5/8 inch drill holes in the slab. The drill holes were spaced about 4 to 5 feet apart (Figures 256 and 257). A dial gauge was placed just past the ‘CF’ joint, located 60 feet from the abutment, to monitor elevation changes in the approach slab pavement (Figure 258). After drilling was completed, pumping of the high density polyurethane was performed. Some holes were re-drilled after the material had hardened to inject additional material as needed (Figures 259 and 260). The research team measured the profile of the approach at 10 ft. intervals before and after injecting the expanding foam. The approach slab was raised approximately 0.25 inches at 40 to 60 ft. from the abutment. Unfortunately, due to bad weather, the URETEK crew was not able to inject the material from 0 to 30 ft (Figure 261).
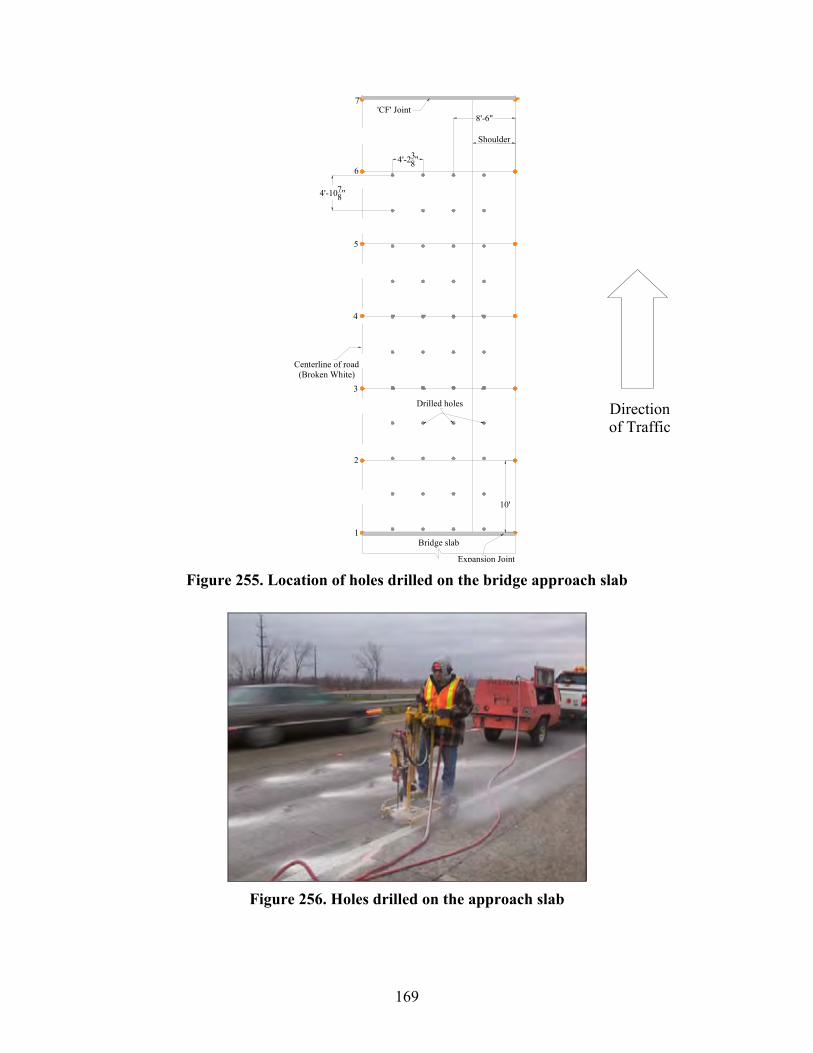
169
Bridge slab
Expansion Joint
8'-6"
4'-238"
4'-1078"
'CF' Joint
Shoulder
10'
Drilled holes
Centerline of road(Broken White)
1
2
3
4
5
6
7
Figure 255. Location of holes drilled on the bridge approach slab
Figure 256. Holes drilled on the approach slab
Direction of Traffic
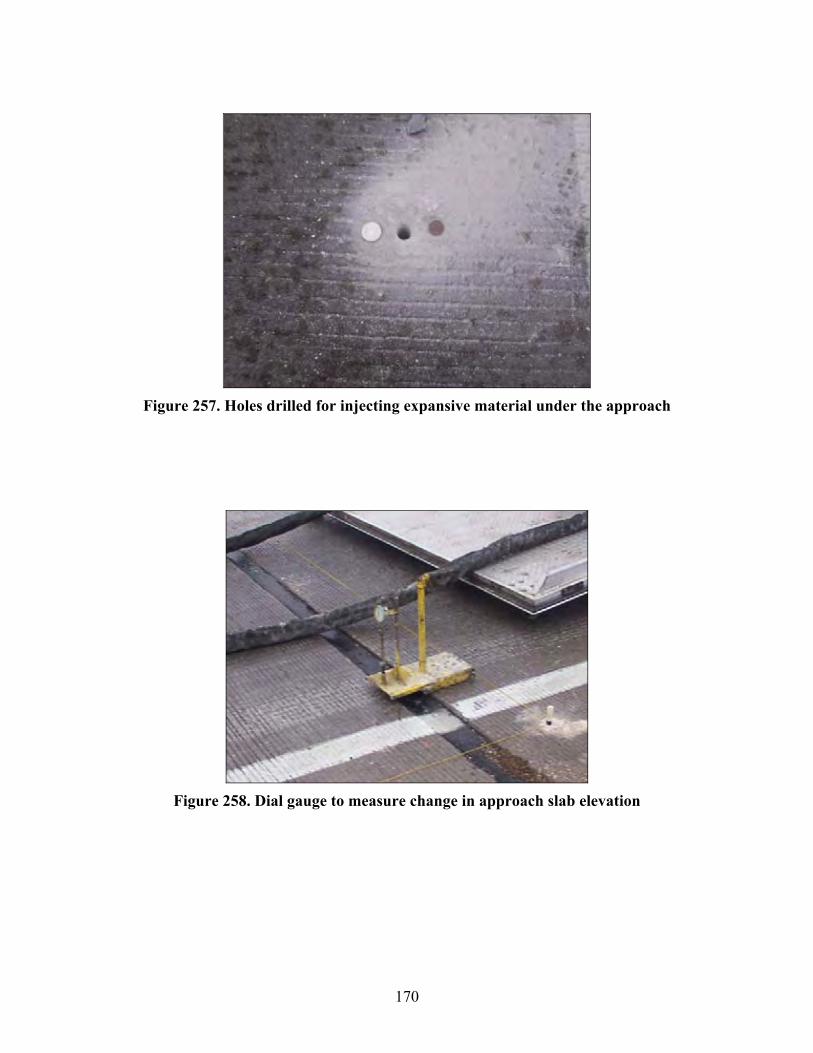
170
Figure 257. Holes drilled for injecting expansive material under the approach
Figure 258. Dial gauge to measure change in approach slab elevation
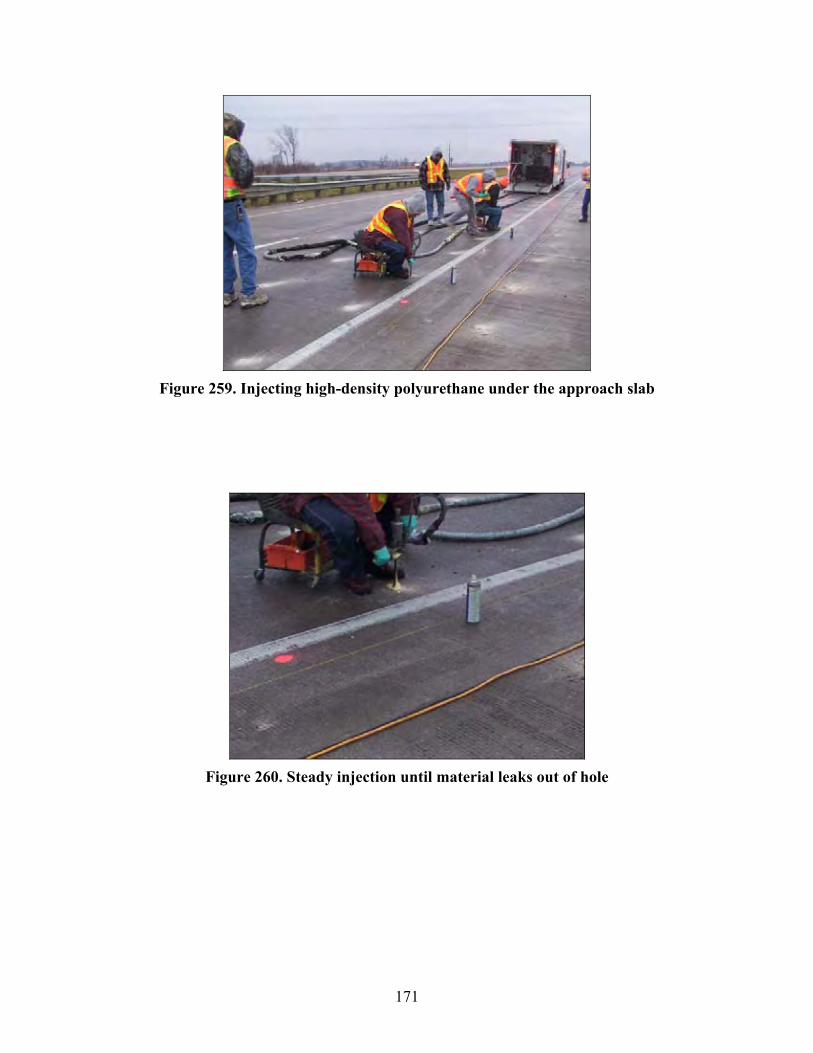
171
Figure 259. Injecting high-density polyurethane under the approach slab
Figure 260. Steady injection until material leaks out of hole
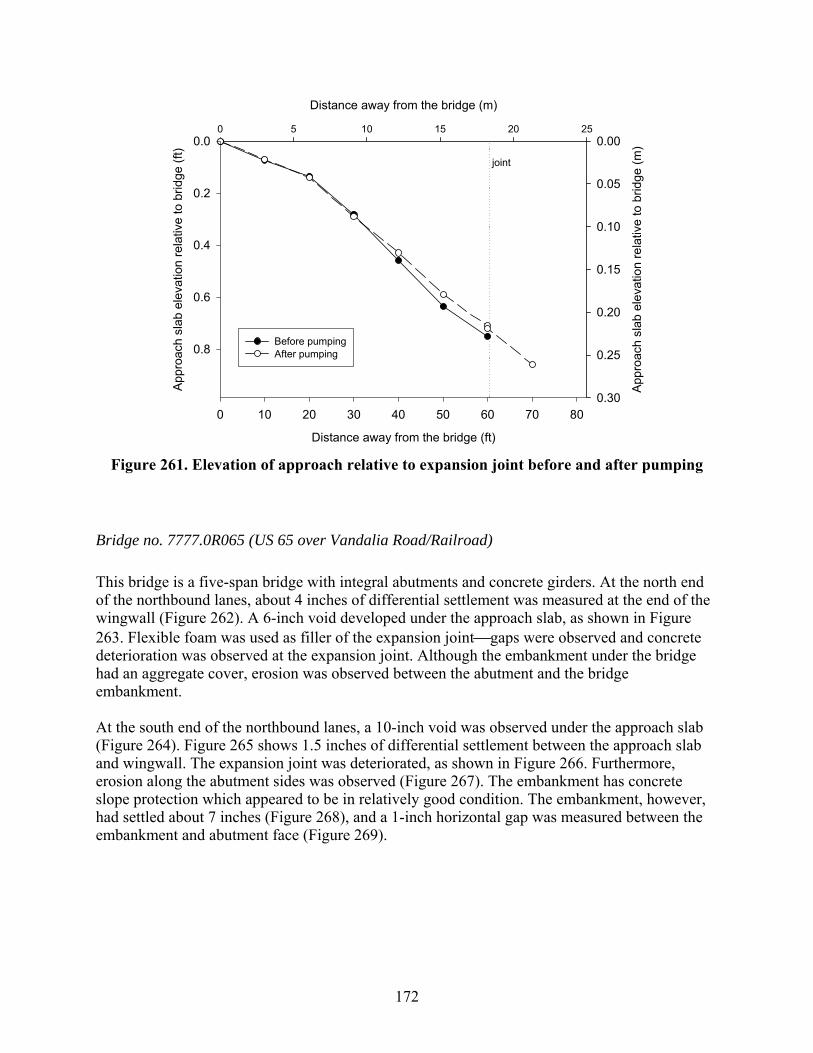
172
Distance away from the bridge (m)
0 5 10 15 20 25
Appr
oach
sla
b el
evat
ion
rela
tive
to b
ridge
(m)0.00
0.05
0.10
0.15
0.20
0.25
0.30
Distance away from the bridge (ft)
0 10 20 30 40 50 60 70 80
Appr
oach
sla
b el
evat
ion
rela
tive
to b
ridge
(ft)
0.0
0.2
0.4
0.6
0.8Before pumpingAfter pumping
joint
Figure 261. Elevation of approach relative to expansion joint before and after pumping
Bridge no. 7777.0R065 (US 65 over Vandalia Road/Railroad)
This bridge is a five-span bridge with integral abutments and concrete girders. At the north end of the northbound lanes, about 4 inches of differential settlement was measured at the end of the wingwall (Figure 262). A 6-inch void developed under the approach slab, as shown in Figure 263. Flexible foam was used as filler of the expansion joint⎯gaps were observed and concrete deterioration was observed at the expansion joint. Although the embankment under the bridge had an aggregate cover, erosion was observed between the abutment and the bridge embankment. At the south end of the northbound lanes, a 10-inch void was observed under the approach slab (Figure 264). Figure 265 shows 1.5 inches of differential settlement between the approach slab and wingwall. The expansion joint was deteriorated, as shown in Figure 266. Furthermore, erosion along the abutment sides was observed (Figure 267). The embankment has concrete slope protection which appeared to be in relatively good condition. The embankment, however, had settled about 7 inches (Figure 268), and a 1-inch horizontal gap was measured between the embankment and abutment face (Figure 269).

173
Figure 262. Differential settlement at the bridge approach (North end of NBL)
Figure 263. A 6 in. void developed under the approach slab (North end of NBL)
4 in.
6 in.
Approach slab
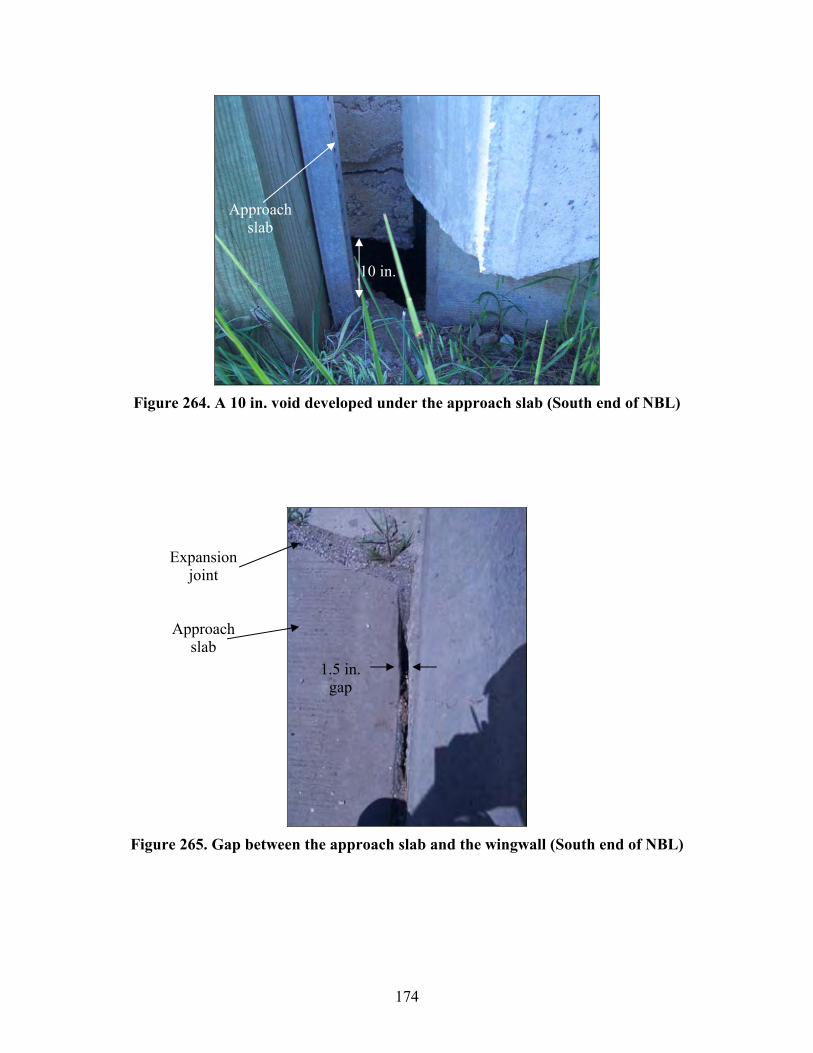
174
Figure 264. A 10 in. void developed under the approach slab (South end of NBL)
Figure 265. Gap between the approach slab and the wingwall (South end of NBL)
Approach slab
10 in.
1.5 in. gap
Expansion joint
Approach slab
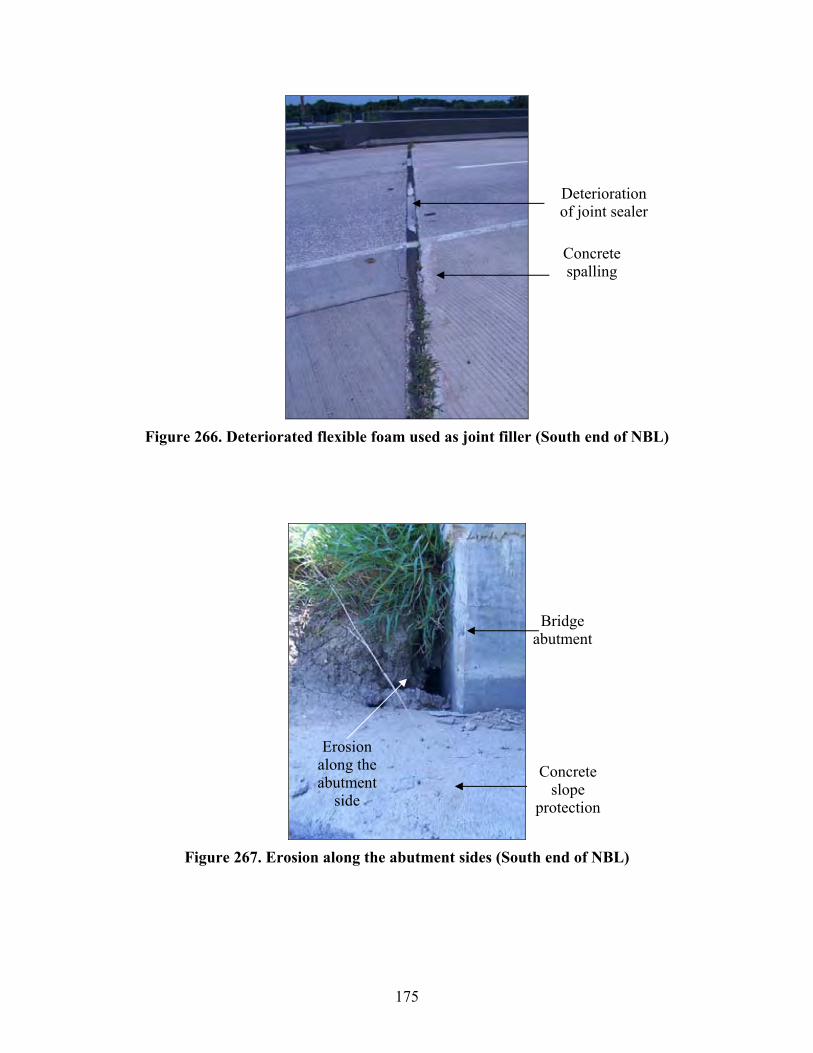
175
Figure 266. Deteriorated flexible foam used as joint filler (South end of NBL)
Figure 267. Erosion along the abutment sides (South end of NBL)
Deterioration of joint sealer
Concrete spalling
Bridge abutment
Concrete slope
protection
Erosion along the abutment
side

176
Figure 268. Settlement of the embankment under the bridge (South end of NBL)
Figure 269. Top view showing the 1 in. gap between the abutment and concrete slope cover
(South end of NBL)
Original level of embankment
7 in.
Bridge abutment
Slope protection
Slope protection
Bridge abutment
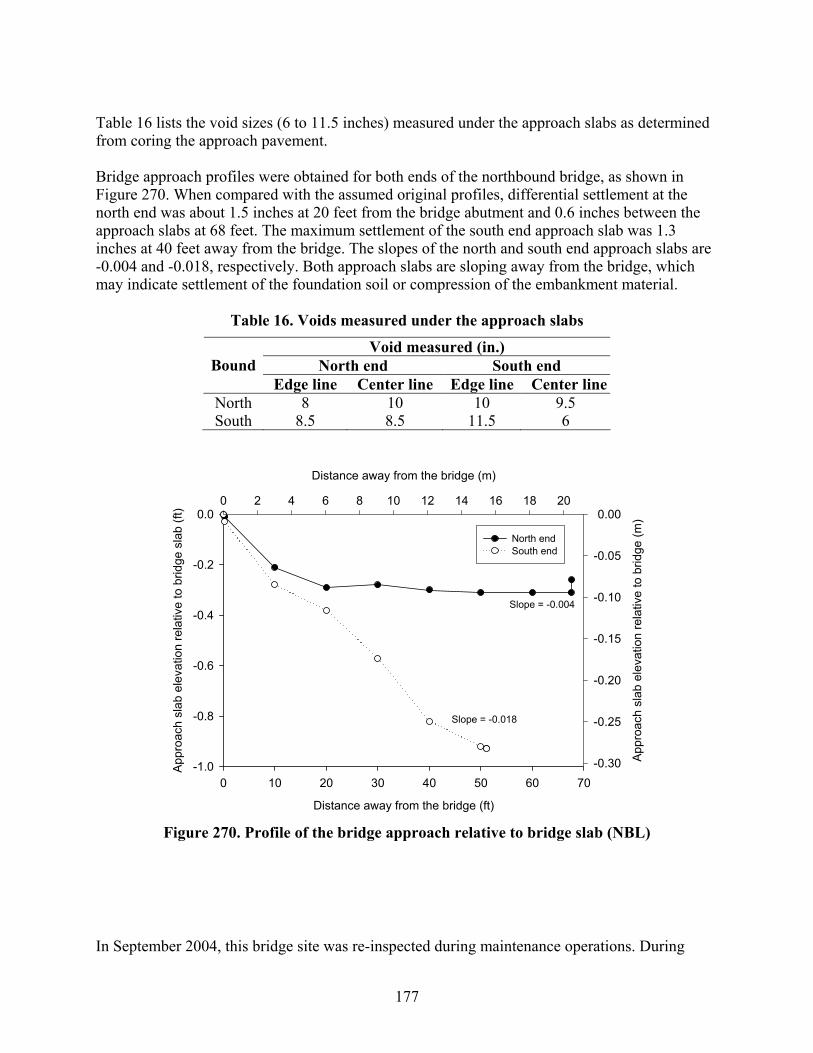
177
Table 16 lists the void sizes (6 to 11.5 inches) measured under the approach slabs as determined from coring the approach pavement. Bridge approach profiles were obtained for both ends of the northbound bridge, as shown in Figure 270. When compared with the assumed original profiles, differential settlement at the north end was about 1.5 inches at 20 feet from the bridge abutment and 0.6 inches between the approach slabs at 68 feet. The maximum settlement of the south end approach slab was 1.3 inches at 40 feet away from the bridge. The slopes of the north and south end approach slabs are -0.004 and -0.018, respectively. Both approach slabs are sloping away from the bridge, which may indicate settlement of the foundation soil or compression of the embankment material.
Table 16. Voids measured under the approach slabs
Void measured (in.) North end South end Bound
Edge line Center line Edge line Center line North 8 10 10 9.5 South 8.5 8.5 11.5 6
Distance away from the bridge (ft)
0 10 20 30 40 50 60 70
App
roac
h sl
ab e
leva
tion
rela
tive
to b
ridge
sla
b (ft
)
-1.0
-0.8
-0.6
-0.4
-0.2
0.0
Distance away from the bridge (m)
0 2 4 6 8 10 12 14 16 18 20
App
roac
h sl
ab e
leva
tion
rela
tive
to b
ridge
(m)
-0.30
-0.25
-0.20
-0.15
-0.10
-0.05
0.00
North endSouth end
Slope = -0.004
Slope = -0.018
Figure 270. Profile of the bridge approach relative to bridge slab (NBL)
In September 2004, this bridge site was re-inspected during maintenance operations. During

178
inspection, replacement of the right lane approach slabs at the south bound bridge was in progress (Figure 271). The left lane was still opened to traffic. The north end approach slab was removed while the south end approach slab was torn down and being removed. A void was observed under the left lane of the north end, as shown in Figure 272. The void was 9 inches deep at the abutment and about 1 inch at 4 feet away. Figure 273 shows that shear failure of portions of the paving notch of the left lane occurred such that the approach slab was only resting on about 0.5 inches of the paving notch (Figure 274). At the south end approach slab, about 1 inch of slab drop at the bridge deck was observed (Figure 275). Recycled tire chips were used as a joint filler material at the expansion joint. Similar to the north end, the approach slab at the south end was resting on only 1 inch of the paving notch, as shown in Figure 276. Under the approach slab, a 10-inch-deep void was measured at the abutment and extended 5 feet away from the bridge. To evaluate subgrade strength, DCP tests were performed at the north and south ends of the southbound bridge at 2 feet from the abutment. At the north end, the DCP test was conducted on the old special backfill material. At the south end, the DCP test was conducted on the new compacted special backfill (Figure 277). The results of the DCP testing conducted on the old backfill material showed that the CBR values ranged from 2 to 15, as shown in Figure 278. DCP test results conducted on the new compacted special backfill shows that the CBR values range from 1.5 to 15. No significant difference was measured between the CBR values of both the old and the new compacted special backfill (Figure 279).
(a) North end approach slab (b) South end approach slab
Figure 271. Replacement of approach slabs at the south bound
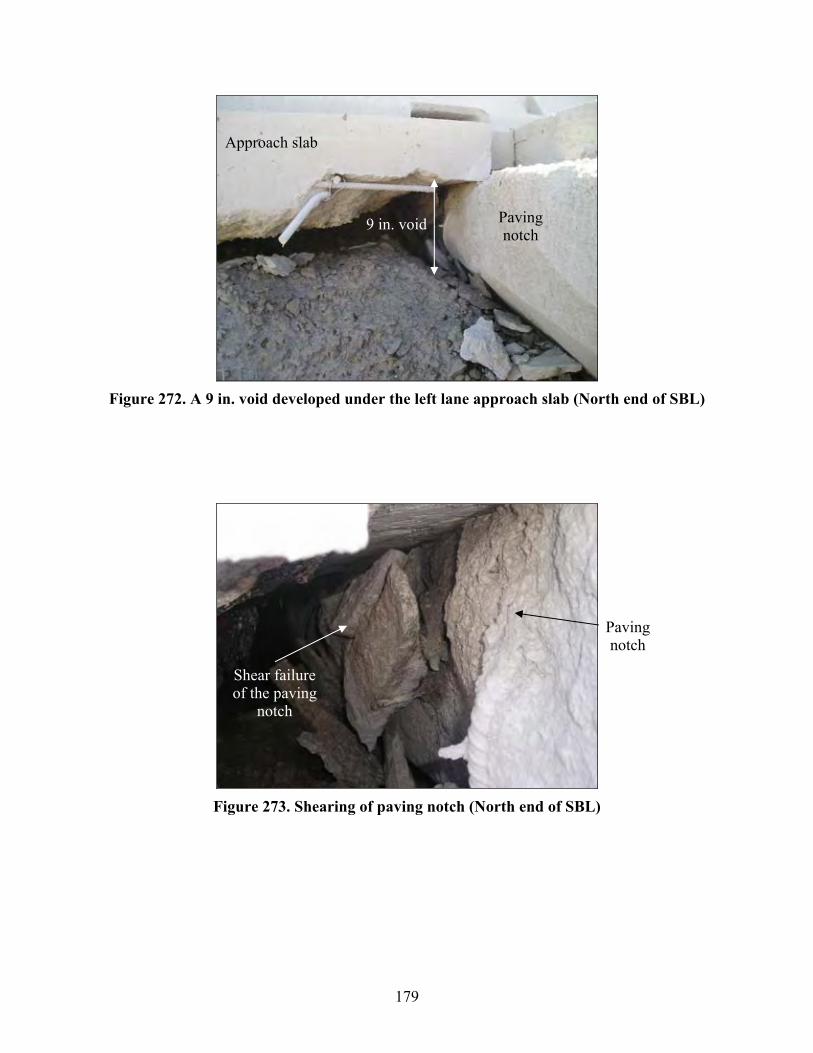
179
Figure 272. A 9 in. void developed under the left lane approach slab (North end of SBL)
Figure 273. Shearing of paving notch (North end of SBL)
Approach slab
Paving notch
9 in. void
Paving notch
Shear failure of the paving
notch
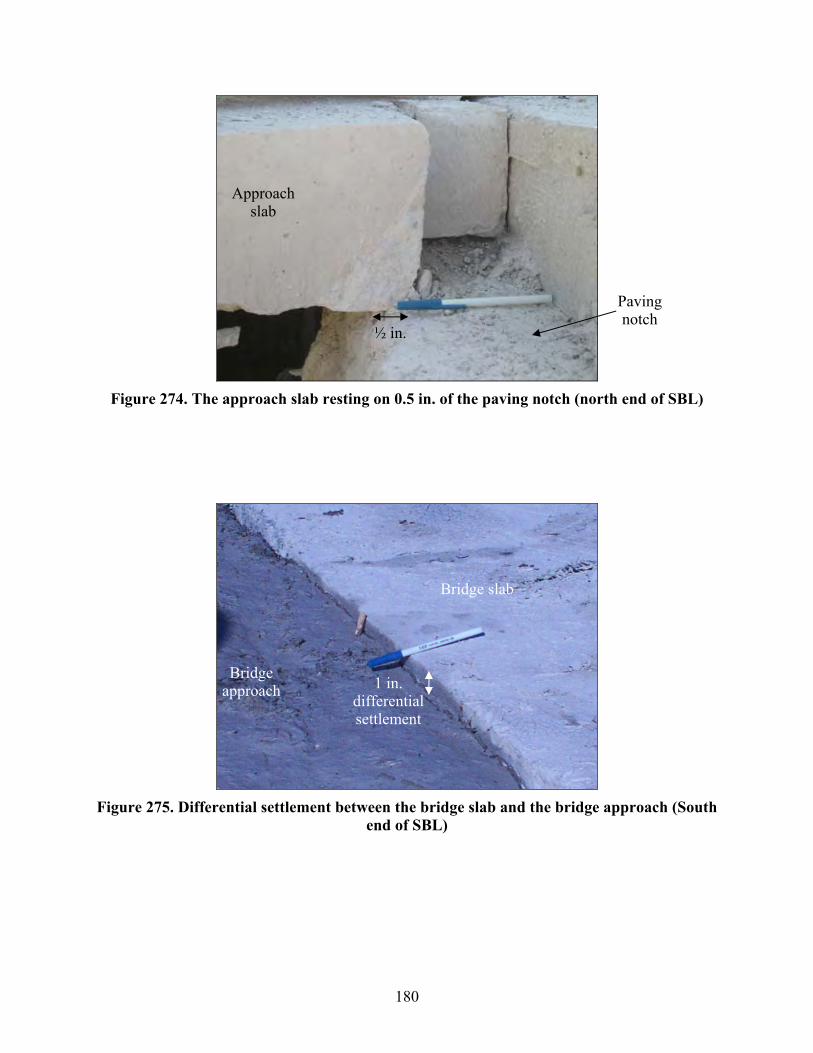
180
Figure 274. The approach slab resting on 0.5 in. of the paving notch (north end of SBL)
Figure 275. Differential settlement between the bridge slab and the bridge approach (South
end of SBL)
Approach slab
Paving notch
Bridge slab
Bridge approach 1 in.
differential settlement
½ in.

181
Figure 276. Approach slab resting on 1 inch of the paving notch, and a 10-inch-void
developed under the approach slab (South end of SBL)
Figure 277. Compacted special backfill (South end of SBL)
Approach slab
1 in. Paving notch
10 in. void
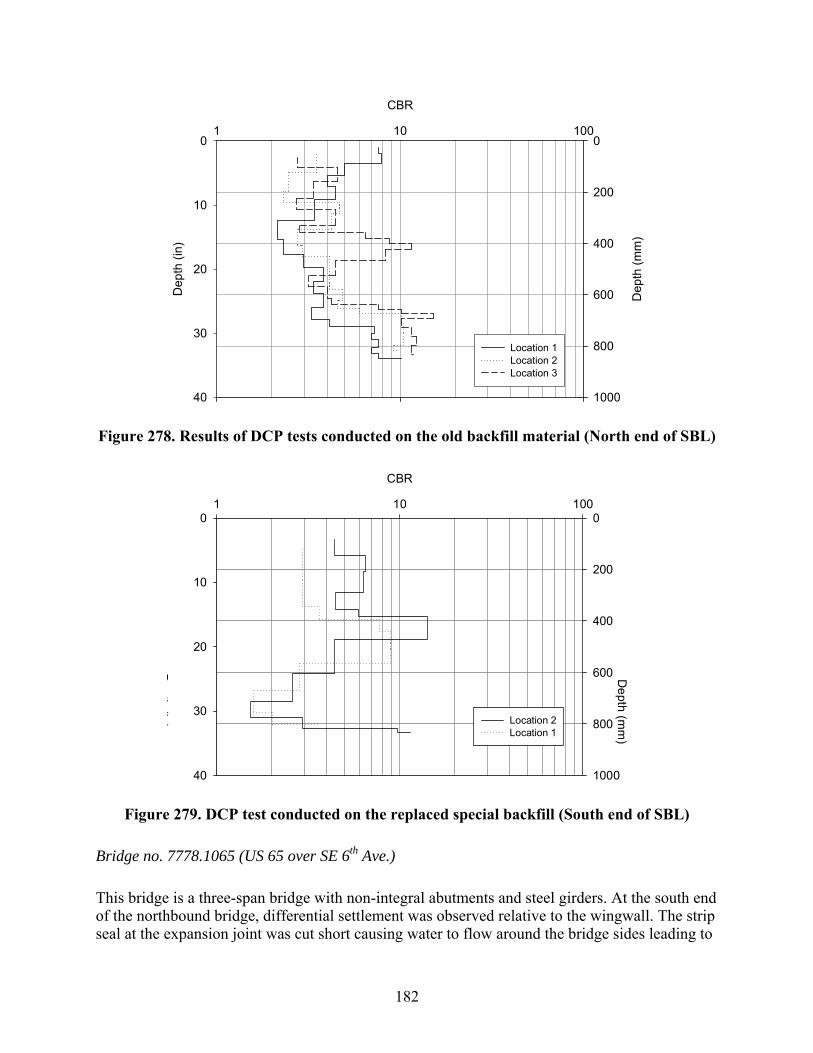
182
CBR
1 10 100
Dep
th (m
m)
0
200
400
600
800
1000
Dep
th (i
n)
0
10
20
30
40
Location 1Location 2Location 3
Figure 278. Results of DCP tests conducted on the old backfill material (North end of SBL)
CBR
1 10 100
Depth (m
m)
0
200
400
600
800
1000
Dth
(i)
0
10
20
30
40
Location 2Location 1
Figure 279. DCP test conducted on the replaced special backfill (South end of SBL)
Bridge no. 7778.1065 (US 65 over SE 6th Ave.)
This bridge is a three-span bridge with non-integral abutments and steel girders. At the south end of the northbound bridge, differential settlement was observed relative to the wingwall. The strip seal at the expansion joint was cut short causing water to flow around the bridge sides leading to
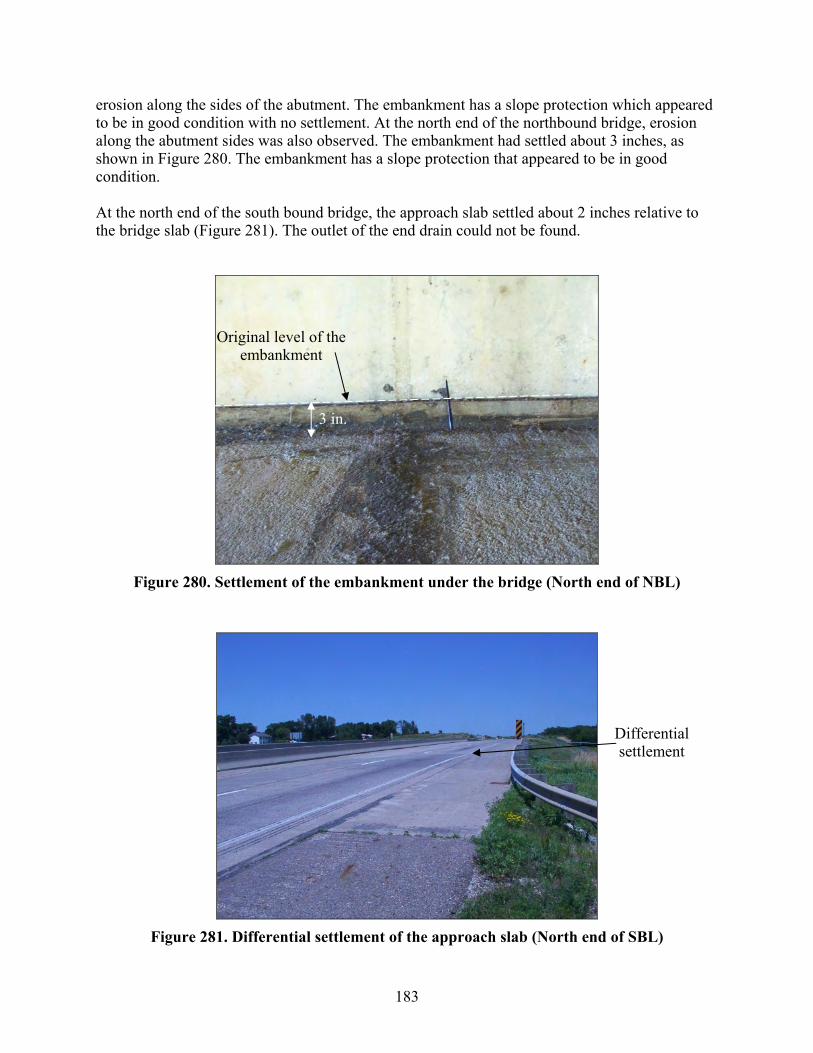
183
erosion along the sides of the abutment. The embankment has a slope protection which appeared to be in good condition with no settlement. At the north end of the northbound bridge, erosion along the abutment sides was also observed. The embankment had settled about 3 inches, as shown in Figure 280. The embankment has a slope protection that appeared to be in good condition. At the north end of the south bound bridge, the approach slab settled about 2 inches relative to the bridge slab (Figure 281). The outlet of the end drain could not be found.
Figure 280. Settlement of the embankment under the bridge (North end of NBL)
Figure 281. Differential settlement of the approach slab (North end of SBL)
3 in.
Original level of the embankment
Differential settlement
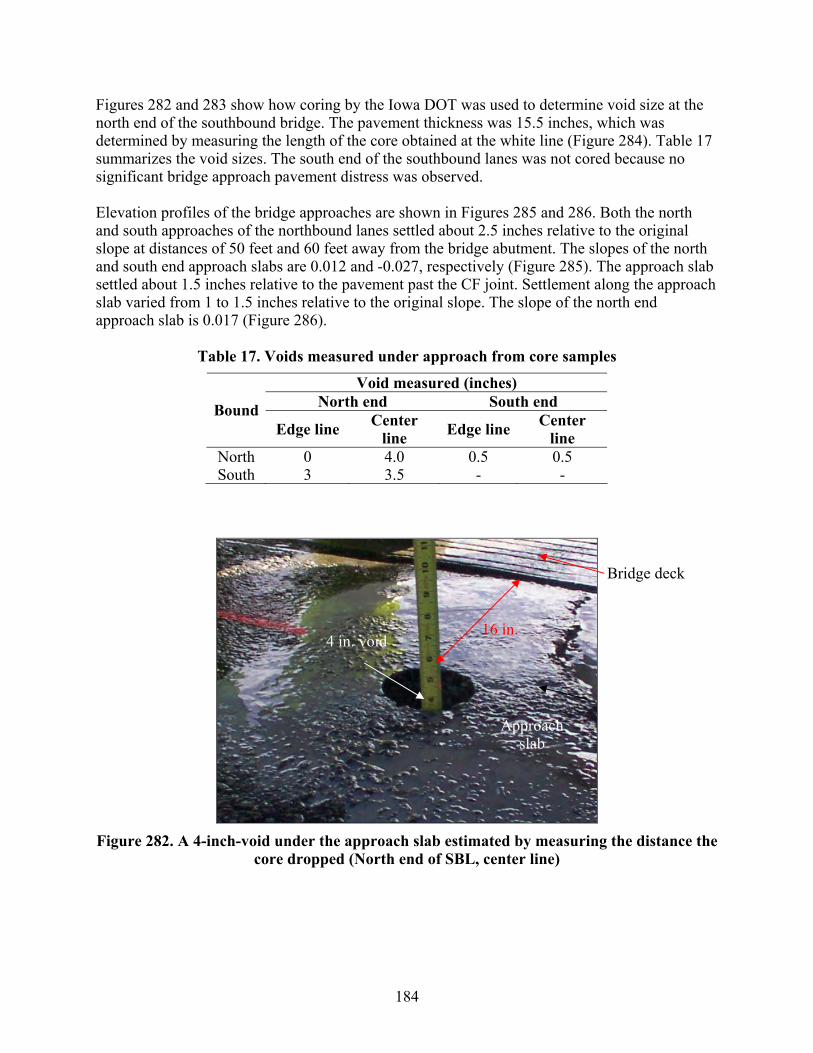
184
Figures 282 and 283 show how coring by the Iowa DOT was used to determine void size at the north end of the southbound bridge. The pavement thickness was 15.5 inches, which was determined by measuring the length of the core obtained at the white line (Figure 284). Table 17 summarizes the void sizes. The south end of the southbound lanes was not cored because no significant bridge approach pavement distress was observed. Elevation profiles of the bridge approaches are shown in Figures 285 and 286. Both the north and south approaches of the northbound lanes settled about 2.5 inches relative to the original slope at distances of 50 feet and 60 feet away from the bridge abutment. The slopes of the north and south end approach slabs are 0.012 and -0.027, respectively (Figure 285). The approach slab settled about 1.5 inches relative to the pavement past the CF joint. Settlement along the approach slab varied from 1 to 1.5 inches relative to the original slope. The slope of the north end approach slab is 0.017 (Figure 286).
Table 17. Voids measured under approach from core samples
Void measured (inches) North end South end Bound
Edge line Center line Edge line Center
line North 0 4.0 0.5 0.5 South 3 3.5 - -
Figure 282. A 4-inch-void under the approach slab estimated by measuring the distance the
core dropped (North end of SBL, center line)
16 in.
Bridge deck
Approach slab
4 in. void
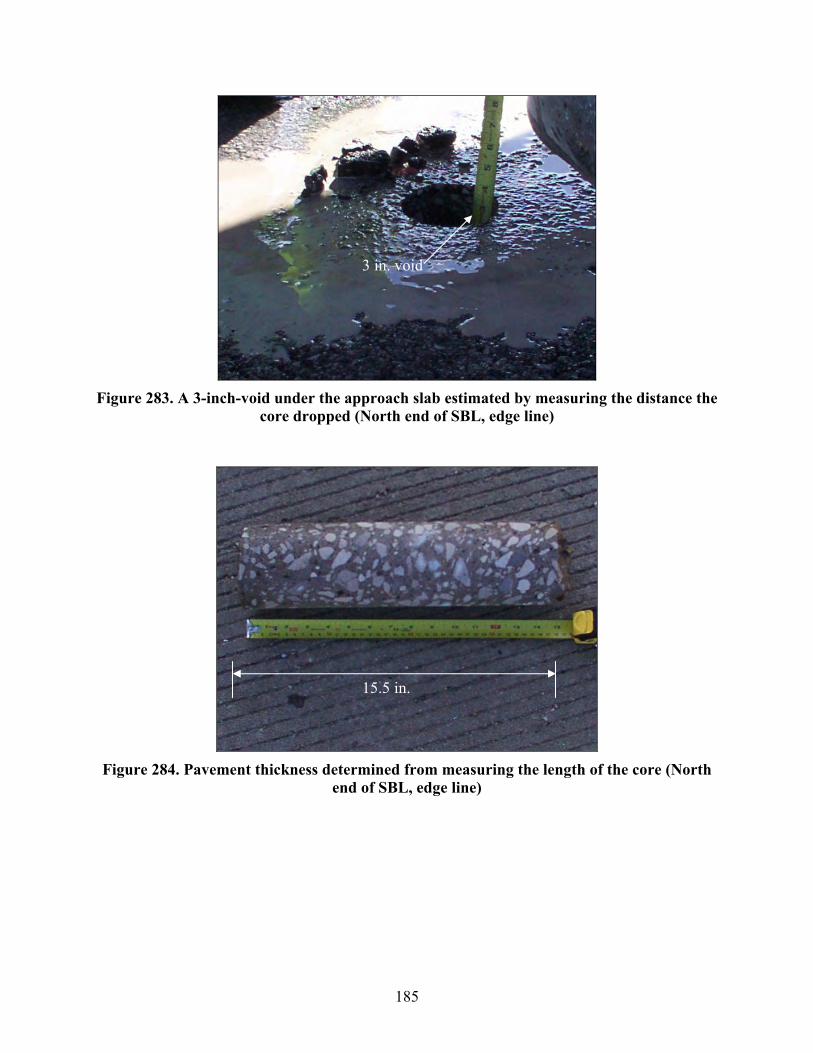
185
Figure 283. A 3-inch-void under the approach slab estimated by measuring the distance the
core dropped (North end of SBL, edge line)
Figure 284. Pavement thickness determined from measuring the length of the core (North
end of SBL, edge line)
15.5 in.
3 in. void

186
Distance away from the bridge (ft)
0 10 20 30 40 50 60 70
App
roac
h sl
ab e
leva
tion
rela
tive
to b
ridge
sla
b (ft
)
-2.0
-1.5
-1.0
-0.5
0.0
0.5
1.0
Distance away from the bridge (m)
0 2 4 6 8 10 12 14 16 18 20
App
roac
h sl
ab e
leva
tion
rela
tive
to b
ridge
(m)
-0.6
-0.4
-0.2
0.0
0.2North endSouth end
Slope = 0.013
Slope = -0.027
Figure 285. Profile of the bridge approach relative to bridge slab (NBL)
Distance away from the bridge (ft)
0 10 20 30 40 50 60 70 80
Appr
oach
sla
b el
evat
ion
rela
tive
to b
ridge
(ft)
0.0
0.2
0.4
0.6
0.8
1.0
1.2
1.4
Distance away from the bridge (m)
0 5 10 15 20
Appr
oach
sla
b el
evat
ion
rela
tive
to b
ridge
(m)
0.00
0.05
0.10
0.15
0.20
0.25
0.30
0.35
0.40
North end
Slope = 0.017
Figure 286. Profile of the bridge approach relative to bridge slab (SBL)
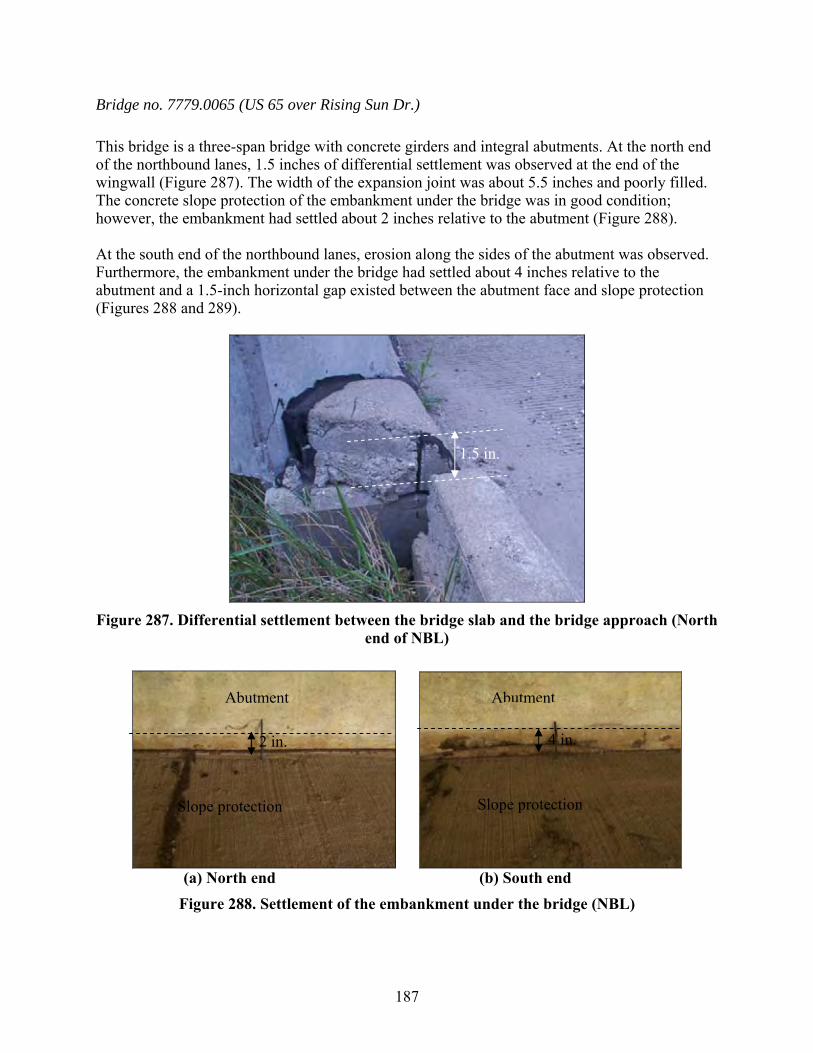
187
Bridge no. 7779.0065 (US 65 over Rising Sun Dr.)
This bridge is a three-span bridge with concrete girders and integral abutments. At the north end of the northbound lanes, 1.5 inches of differential settlement was observed at the end of the wingwall (Figure 287). The width of the expansion joint was about 5.5 inches and poorly filled. The concrete slope protection of the embankment under the bridge was in good condition; however, the embankment had settled about 2 inches relative to the abutment (Figure 288). At the south end of the northbound lanes, erosion along the sides of the abutment was observed. Furthermore, the embankment under the bridge had settled about 4 inches relative to the abutment and a 1.5-inch horizontal gap existed between the abutment face and slope protection (Figures 288 and 289).
Figure 287. Differential settlement between the bridge slab and the bridge approach (North
end of NBL)
(a) North end (b) South end
Figure 288. Settlement of the embankment under the bridge (NBL)
1.5 in.
2 in.
Slope protection
Abutment
4 in.
Slope protection
Abutment
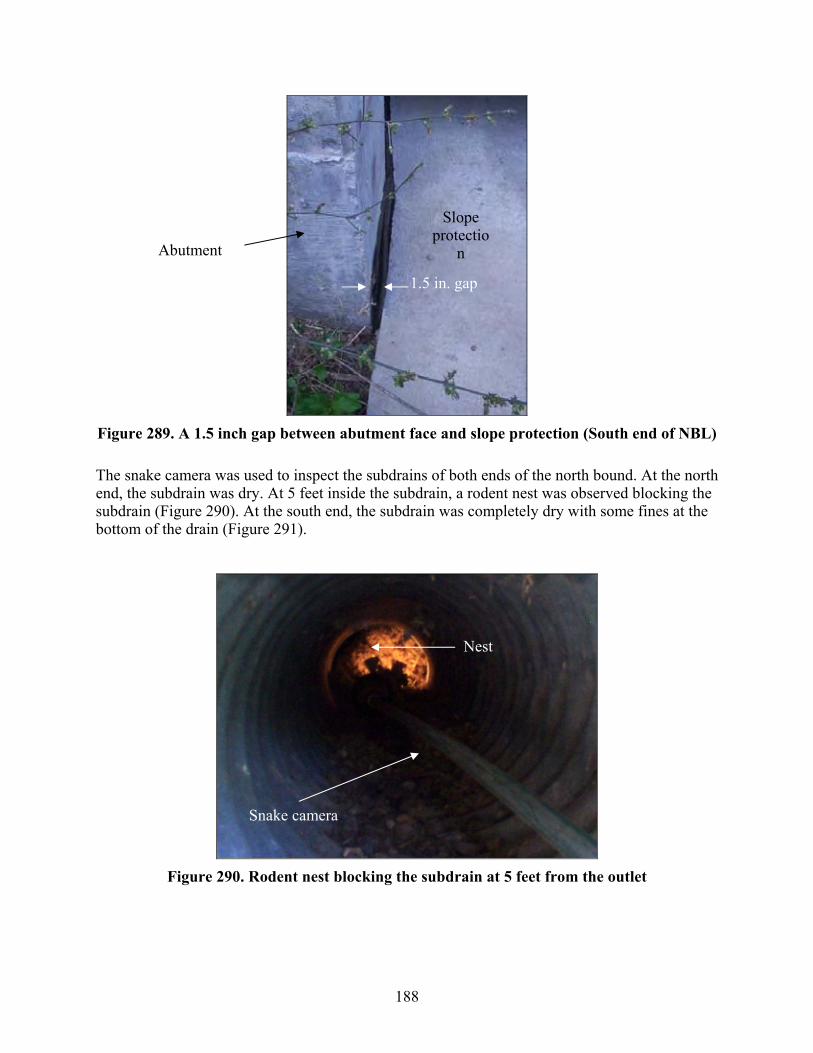
188
Figure 289. A 1.5 inch gap between abutment face and slope protection (South end of NBL)
The snake camera was used to inspect the subdrains of both ends of the north bound. At the north end, the subdrain was dry. At 5 feet inside the subdrain, a rodent nest was observed blocking the subdrain (Figure 290). At the south end, the subdrain was completely dry with some fines at the bottom of the drain (Figure 291).
Figure 290. Rodent nest blocking the subdrain at 5 feet from the outlet
Slope protectio
nAbutment
1.5 in. gap
Nest
Snake camera
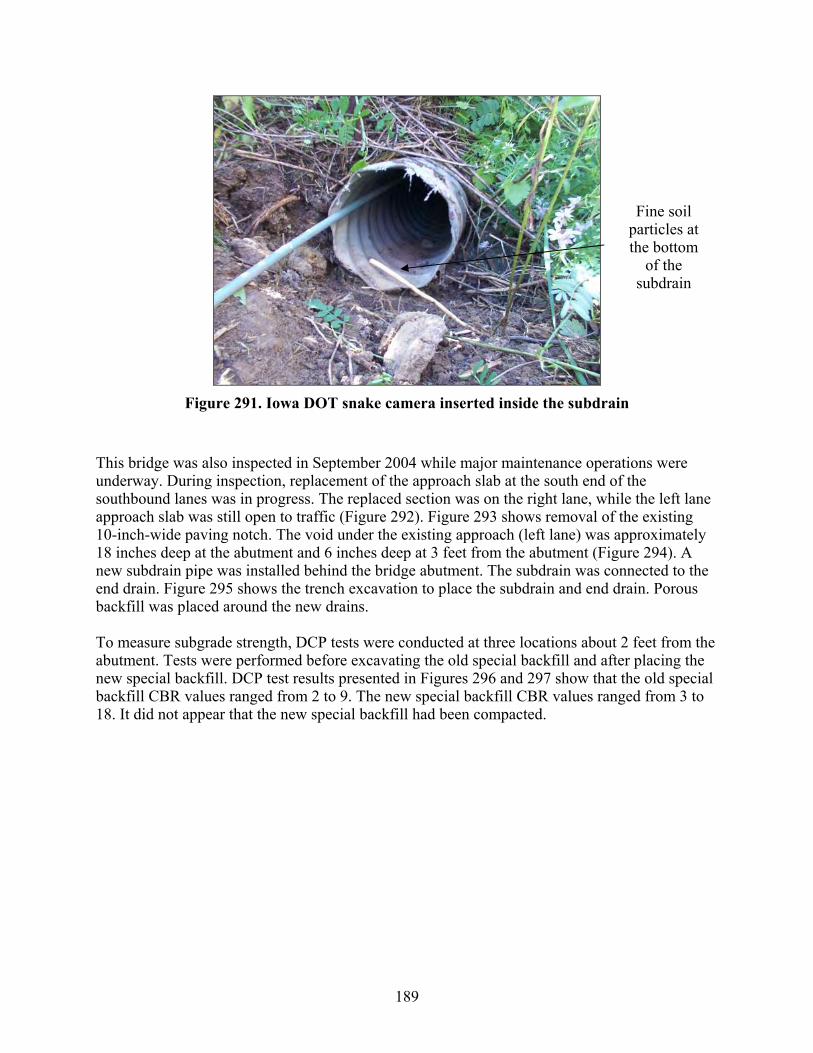
189
Figure 291. Iowa DOT snake camera inserted inside the subdrain
This bridge was also inspected in September 2004 while major maintenance operations were underway. During inspection, replacement of the approach slab at the south end of the southbound lanes was in progress. The replaced section was on the right lane, while the left lane approach slab was still open to traffic (Figure 292). Figure 293 shows removal of the existing 10-inch-wide paving notch. The void under the existing approach (left lane) was approximately 18 inches deep at the abutment and 6 inches deep at 3 feet from the abutment (Figure 294). A new subdrain pipe was installed behind the bridge abutment. The subdrain was connected to the end drain. Figure 295 shows the trench excavation to place the subdrain and end drain. Porous backfill was placed around the new drains. To measure subgrade strength, DCP tests were conducted at three locations about 2 feet from the abutment. Tests were performed before excavating the old special backfill and after placing the new special backfill. DCP test results presented in Figures 296 and 297 show that the old special backfill CBR values ranged from 2 to 9. The new special backfill CBR values ranged from 3 to 18. It did not appear that the new special backfill had been compacted.
Fine soil particles at the bottom
of the subdrain

190
60 ft
S
Direction of
traffic
Approach slab
Replaced section
Expansion joint
Bridge
(a) Replaced approach slab (b) Schematic of the replaced section Figure 292. Replacement of the right lane approach slab (South end of SBL)
Figure 293. Tearing down the old pavement notch (South end of SBL)

191
Figure 294. A void developed under the left lane approach slab which was 1.5-feet-deep at
the bridge abutment (South end of SBL)
(a) Trench excavated to install subdrain (b) Trench excavated to connect the subdrain to the end drain
Figure 295. Installing a drainage system under the right lane approach slab
1.5 ft void
Paving notch
Approach slab

192
CBR
1 10 100
Dep
th (m
m)
0
200
400
600
800
1000
Dep
th (i
n)
0
10
20
30
40
Location 1Location 2Location 3
Figure 296. Results of DCP test conducted on special backfill material before excavation
(South end of SBL)
CBR
1 10 100
Dep
th (m
m)
0
200
400
600
800
1000
Dep
th (i
n)
0
10
20
30
40
Location 1Location 2Location 3
Figure 297. Results of DCP test conducted on special backfill material after replacement
(South end of SBL)

193
Bridge no. 7779.4065 (US 65 over IA 163)
This bridge is a four-span bridge with concrete girders and integral abutments. At the north end of the northbound lanes, the approach had an asphalt overlay that was cracked and had settled about 4.5 inches. Erosion along the sides of the abutment was observed. The embankment had concrete slope protection that was in a good condition. The embankment, however, had settled about 3.5 inches relative to the abutment. The outlet of the end drain was in a satisfactory condition. At the south end of the northbound lanes, differential settlement of 2.5 inches was measured at the end of the wingwall (Figure 298). Concrete spalling and cracking of the asphalt overlay were observed at the expansion joint (Figure 299). Concrete slope protection of the embankment under the bridge was in good condition; however, it settled about 3.5 inches relative to the abutment (Figure 300) and had a 0.5-inch gap at the abutment face. At the north end of the southbound lanes, 4 inches of differential settlement at the bridge approach was measured at the end of the wingwall (Figure 301). Recycled tire chips were used as joint filler for the expansion joint, as shown in Figure 302. The width of the expansion joint was about 5 inches. The concrete slope protection was in good condition. Approach slabs at both ends of the southbound lane were cored. Table 18 summarizes the measured void size, pavement thickness, and paving notch dimensions at the approach slabs. The void under the approach slab was about 9.5 inches at the edge line of the north end approach slab (Figure 303). Profiles were obtained for all four ends of the bridge approach pavements (Figures 304 and 305). Differential settlement of the approach slab relative to the bridge slab for both ends of the northbound lane was about 1 inch. The slopes are -0.013 and -0.001 for the north and south end approach slabs, respectively. For the southbound lanes, the maximum settlement relative to the original profile was about 2 inches and 1.8 inches for the north and south end approaches, respectively. The slopes for the north and south ends approach slabs of the southbound lane are -0.015 and -0.002, respectively. Both approach slabs are sloping away from the bridge, which may indicate settlement of foundation soil or compression of the embankment material.
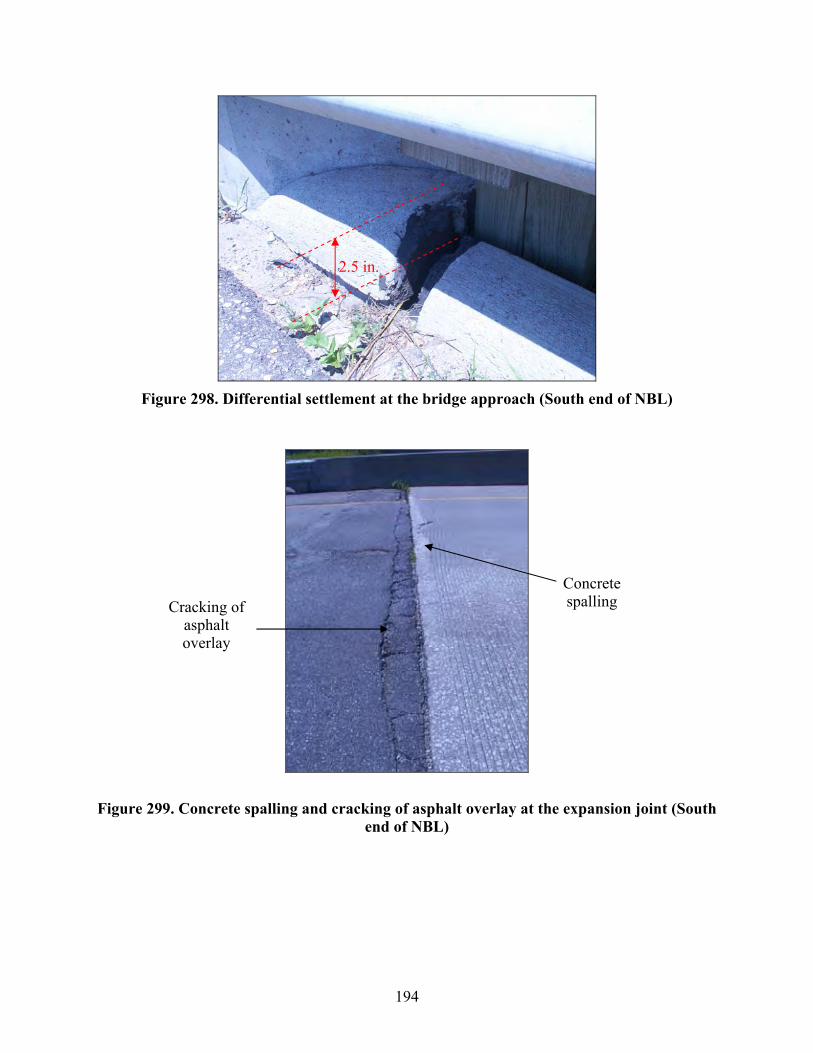
194
Figure 298. Differential settlement at the bridge approach (South end of NBL)
Figure 299. Concrete spalling and cracking of asphalt overlay at the expansion joint (South end of NBL)
2.5 in.
Concrete spalling Cracking of
asphalt overlay
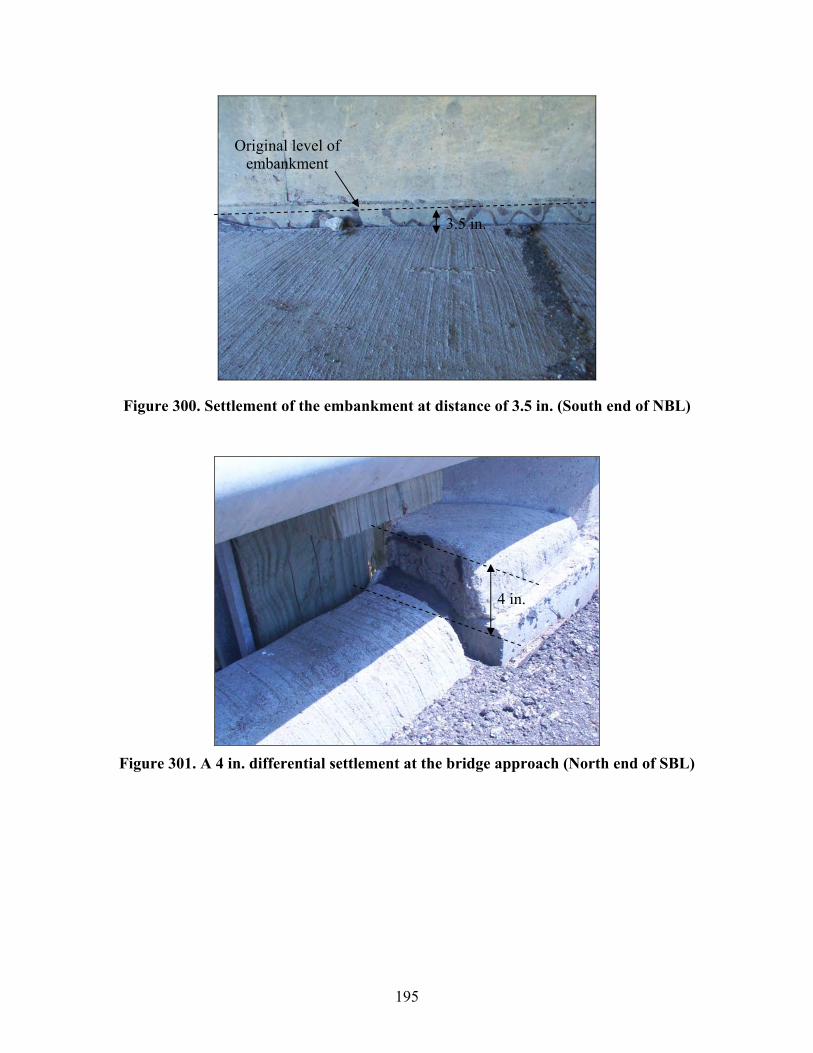
195
Figure 300. Settlement of the embankment at distance of 3.5 in. (South end of NBL)
Figure 301. A 4 in. differential settlement at the bridge approach (North end of SBL)
Original level of embankment
3.5 in.
4 in.

196
Figure 302. Recycled tires used as joint filler
Table 18. Measurements of the void size, paving notch, and pavement thickness at the Southbound lane
Void size (in.) Notch dimension (in.)
Pavement thickness (in.) Bridge
End Edge line
Center line
Edge line
Center line
Edge line
Center line
North 9.5 6.5 - 10.25 - - South 5 3.75 8.5 9 12.5 14
Figure 303. A 9.5 in. void under the approach slab estimated by measuring the distance the core dropped (North end of SBL)
5 in.
9.5 in. void

197
Distance away from the bridge (ft)
0 10 20 30 40 50 60 70
App
roac
h sl
ab e
leva
tion
rela
tive
to b
ridge
sla
b (ft
)
-1.0
-0.8
-0.6
-0.4
-0.2
0.0
Distance away from the bridge (m)
0 2 4 6 8 10 12 14 16 18 20
App
roac
h sl
ab e
leva
tion
rela
tive
to b
ridge
(m)
-0.30
-0.25
-0.20
-0.15
-0.10
-0.05
0.00
North endSouth end
Slope = -0.001
Slope = -0.013
Figure 304. Profile of the bridge approach relative to bridge slab (NBL)
Distance away from the bridge (ft)
0 10 20 30 40 50 60 70
App
roac
h sl
ab e
leva
tion
rela
tive
to b
ridge
(ft)
-1.0
-0.8
-0.6
-0.4
-0.2
0.0
Distance away from the bridge (m)
0 5 10 15 20
App
roac
h sl
ab e
leva
tion
rela
tive
to b
ridge
(m)
-0.30
-0.25
-0.20
-0.15
-0.10
-0.05
0.00
North endSouth end
Slope = -0.015
Slope = -0.002
Figure 305. Profile of the bridge approach relative to bridge slab (SBL)

198
By using the snake camera at the north end of the northbound subdrain outlet, it was revealed that the subdrain was blocked with soil debris (Figure 306). Unlike other bridges where the subdrain outlet was day-lighted horizontally away from the abutment, this outlet was located at the bottom of the downslope embankment.
Figure 306. Subdrain outlet, located at the bottom of the embankment, blocked by soil
debris
Bridge no. 80.8R065 (US 65 over NE 27th St.)
This bridge is a three-span bridge with concrete girders and integral abutments. At the north end of the northbound lanes, differential settlement of 2.5 inches was measured relative to the wingwall. Transverse cracks at the approach slab were visible (Figure 307). The expansion joint was 3.25 inches wide and filled with flexible foam filler, but not sealed. No settlement was observed at the embankment under the bridge, and the concrete slope protection appeared to be in a good condition. The outlet of the subdrain was in a satisfactory condition but was dry. Approach slab coring was performed by the Iowa DOT at the right lane of the north end of the northbound lanes. The measured void under the approach slab was about 1.5 inches at the edge line and 2 inches at the center line. Elevation profile measurements are shown in Figure 308. The maximum settlement relative to the original profile was about 2 inches at 20 feet from the bridge abutment. The slope of the approach slab is 0.016.
Subdrain outlet blocked by soil
particles

199
Figure 307. Transverse cracks at the bridge approach
Distance away from the bridge (ft)
0 10 20 30 40 50 60
Appr
oach
sla
b el
evat
ion
rela
tive
to b
ridge
sla
b (ft
)
0.0
0.2
0.4
0.6
0.8
1.0
Distance away from the bridge (m)
0 2 4 6 8 10 12 14 16 18
Appr
oach
sla
b el
evat
ion
rela
tive
to b
ridge
(m)
0.00
0.05
0.10
0.15
0.20
0.25
0.30
North end
Slope = 0.016
Figure 308. Profile of the bridge approach relative to bridge slab (North end of NBL)
Bridge no. 7781.2065 (US 65 over 4 mile Creek/ Railroad)
This bridge is a four-span bridge with steel girders and non-integral abutments. At the north end of the southbound lane, differential settlement of 3 inches was measured relative to the wingwall.
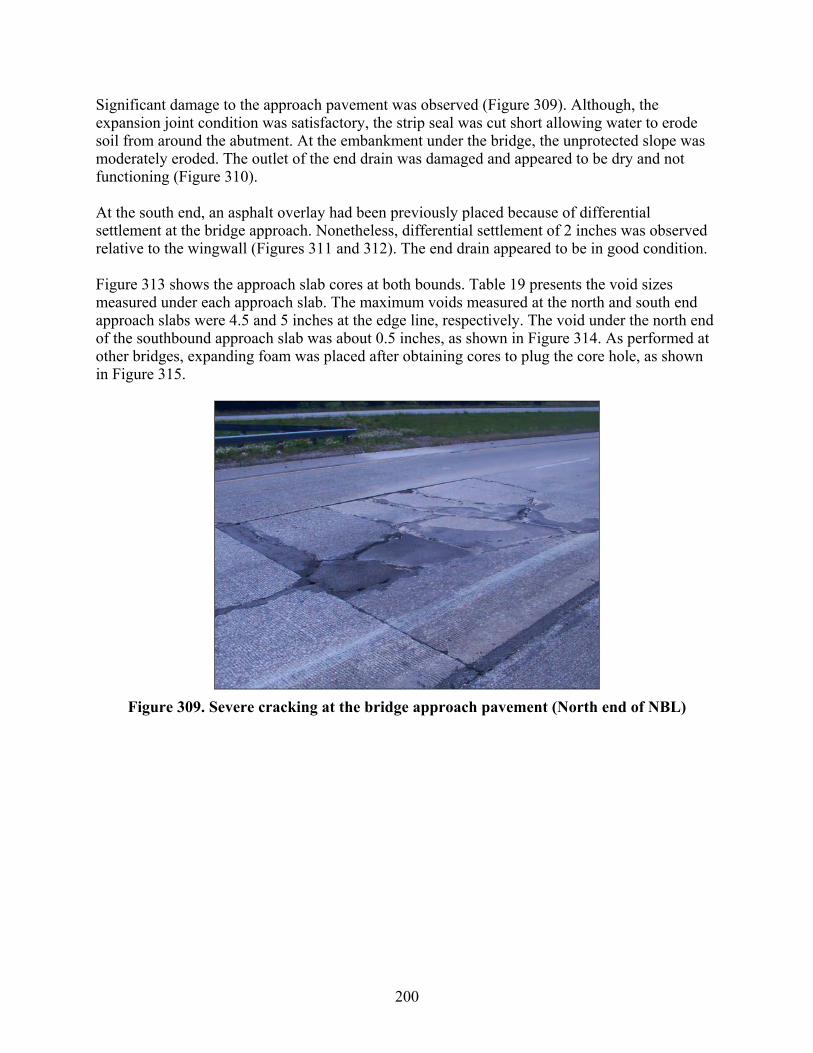
200
Significant damage to the approach pavement was observed (Figure 309). Although, the expansion joint condition was satisfactory, the strip seal was cut short allowing water to erode soil from around the abutment. At the embankment under the bridge, the unprotected slope was moderately eroded. The outlet of the end drain was damaged and appeared to be dry and not functioning (Figure 310). At the south end, an asphalt overlay had been previously placed because of differential settlement at the bridge approach. Nonetheless, differential settlement of 2 inches was observed relative to the wingwall (Figures 311 and 312). The end drain appeared to be in good condition. Figure 313 shows the approach slab cores at both bounds. Table 19 presents the void sizes measured under each approach slab. The maximum voids measured at the north and south end approach slabs were 4.5 and 5 inches at the edge line, respectively. The void under the north end of the southbound approach slab was about 0.5 inches, as shown in Figure 314. As performed at other bridges, expanding foam was placed after obtaining cores to plug the core hole, as shown in Figure 315.
Figure 309. Severe cracking at the bridge approach pavement (North end of NBL)

201
Figure 310. Damaged end drain (North end of NBL)
Figure 311. Settlement of bridge approach (South end of NBL)
Differential settlement
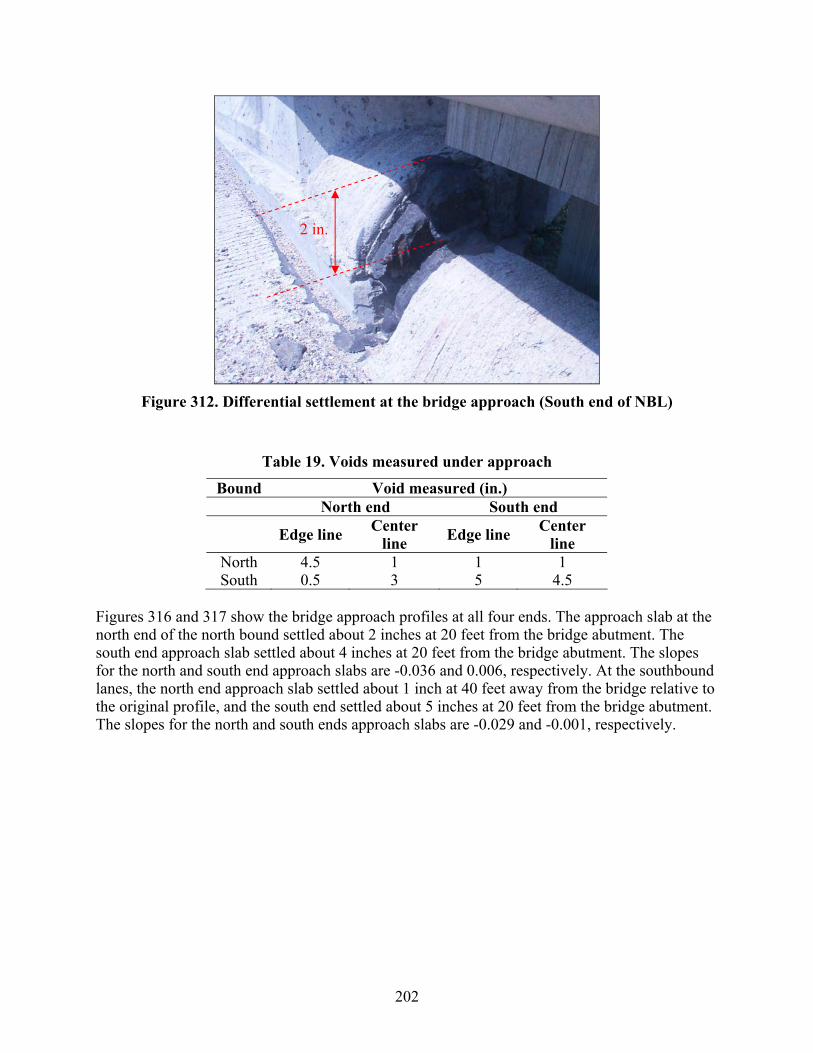
202
Figure 312. Differential settlement at the bridge approach (South end of NBL)
Table 19. Voids measured under approach
Bound Void measured (in.) North end South end
Edge line Center line Edge line Center
line North 4.5 1 1 1 South 0.5 3 5 4.5
Figures 316 and 317 show the bridge approach profiles at all four ends. The approach slab at the north end of the north bound settled about 2 inches at 20 feet from the bridge abutment. The south end approach slab settled about 4 inches at 20 feet from the bridge abutment. The slopes for the north and south end approach slabs are -0.036 and 0.006, respectively. At the southbound lanes, the north end approach slab settled about 1 inch at 40 feet away from the bridge relative to the original profile, and the south end settled about 5 inches at 20 feet from the bridge abutment. The slopes for the north and south ends approach slabs are -0.029 and -0.001, respectively.
2 in.
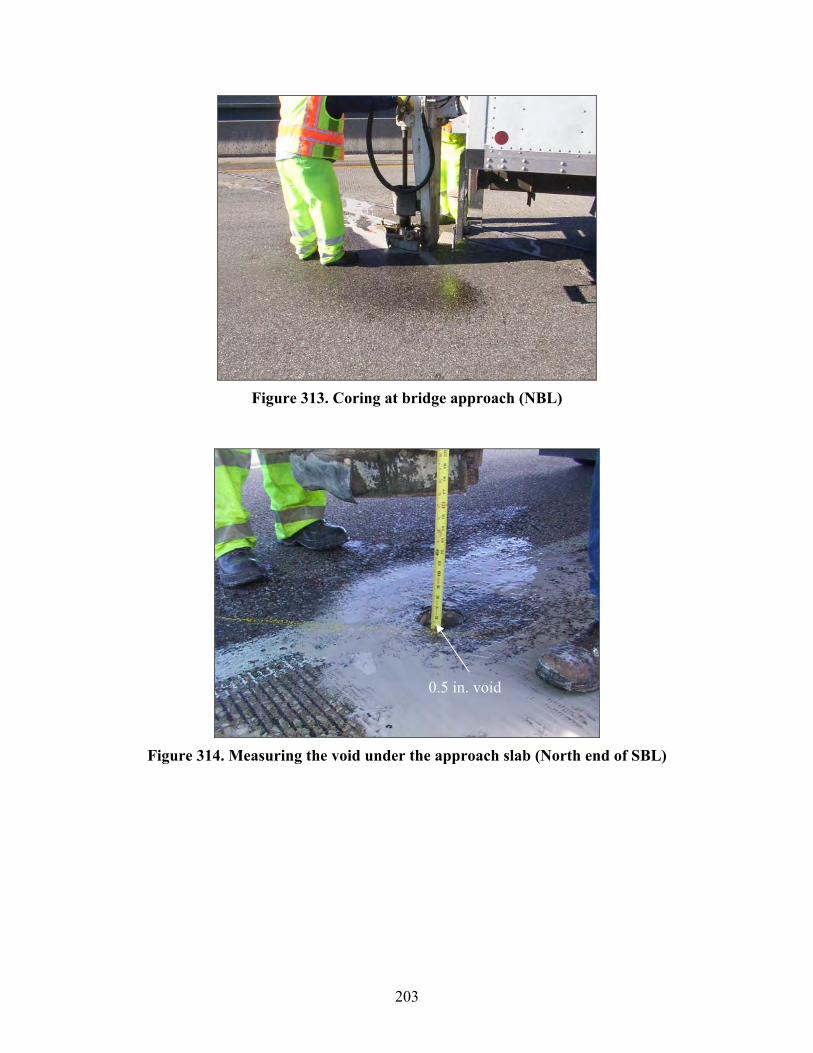
203
Figure 313. Coring at bridge approach (NBL)
Figure 314. Measuring the void under the approach slab (North end of SBL)
0.5 in. void

204
Figure 315. Expanding foam placed in the core hole of the approach slab (NBL)
Distance away from the bridge (ft)
0 10 20 30 40 50 60 70 80
Appr
oach
sla
b el
evat
ion
rela
tive
to b
ridge
sla
b (ft
)
-2.0
-1.5
-1.0
-0.5
0.0
0.5
Distance away from the bridge (m)
0 2 4 6 8 10 12 14 16 18 20 22 24
Appr
oach
sla
b el
evat
ion
rela
tive
to b
ridge
(m)
-0.6
-0.5
-0.4
-0.3
-0.2
-0.1
0.0
0.1
North endSouth end
Slope = 0.006
Slope = -0.036
Figure 316. Profile of the bridge approach relative to bridge slab (NBL)
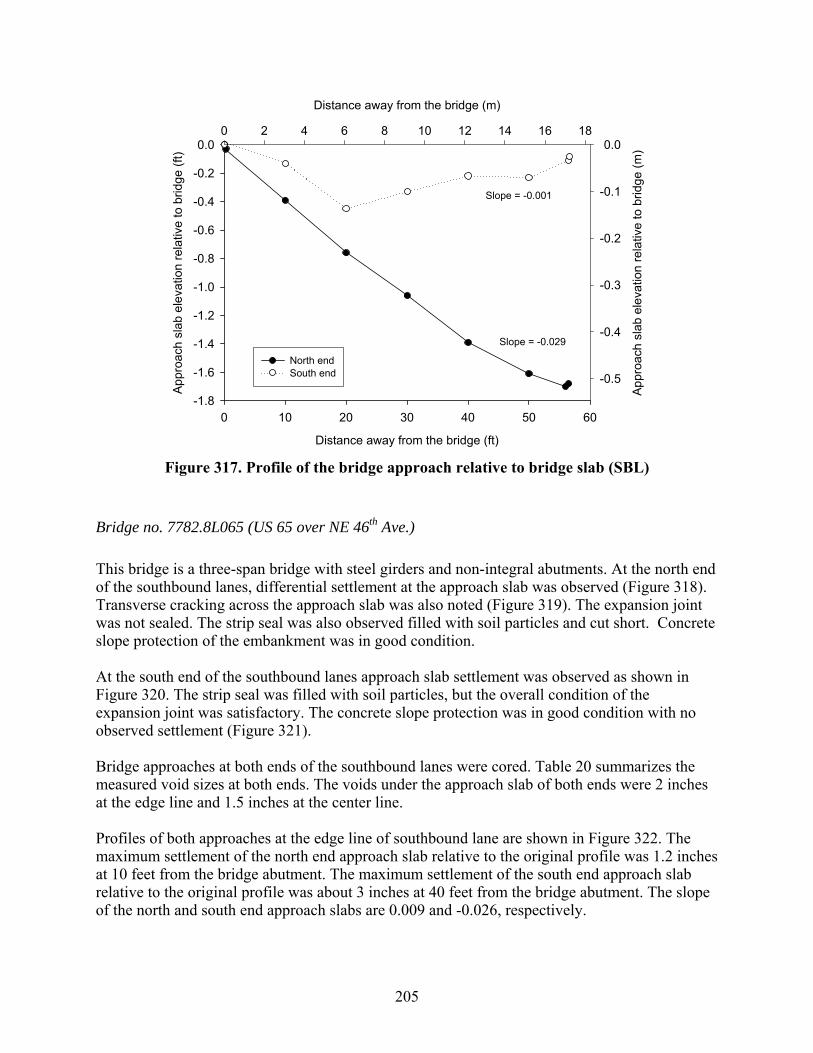
205
Distance away from the bridge (ft)
0 10 20 30 40 50 60
App
roac
h sl
ab e
leva
tion
rela
tive
to b
ridge
(ft)
-1.8
-1.6
-1.4
-1.2
-1.0
-0.8
-0.6
-0.4
-0.2
0.0
Distance away from the bridge (m)
0 2 4 6 8 10 12 14 16 18
App
roac
h sl
ab e
leva
tion
rela
tive
to b
ridge
(m)
-0.5
-0.4
-0.3
-0.2
-0.1
0.0
North endSouth end
Slope = -0.029
Slope = -0.001
Figure 317. Profile of the bridge approach relative to bridge slab (SBL)
Bridge no. 7782.8L065 (US 65 over NE 46th Ave.)
This bridge is a three-span bridge with steel girders and non-integral abutments. At the north end of the southbound lanes, differential settlement at the approach slab was observed (Figure 318). Transverse cracking across the approach slab was also noted (Figure 319). The expansion joint was not sealed. The strip seal was also observed filled with soil particles and cut short. Concrete slope protection of the embankment was in good condition. At the south end of the southbound lanes approach slab settlement was observed as shown in Figure 320. The strip seal was filled with soil particles, but the overall condition of the expansion joint was satisfactory. The concrete slope protection was in good condition with no observed settlement (Figure 321). Bridge approaches at both ends of the southbound lanes were cored. Table 20 summarizes the measured void sizes at both ends. The voids under the approach slab of both ends were 2 inches at the edge line and 1.5 inches at the center line. Profiles of both approaches at the edge line of southbound lane are shown in Figure 322. The maximum settlement of the north end approach slab relative to the original profile was 1.2 inches at 10 feet from the bridge abutment. The maximum settlement of the south end approach slab relative to the original profile was about 3 inches at 40 feet from the bridge abutment. The slope of the north and south end approach slabs are 0.009 and -0.026, respectively.
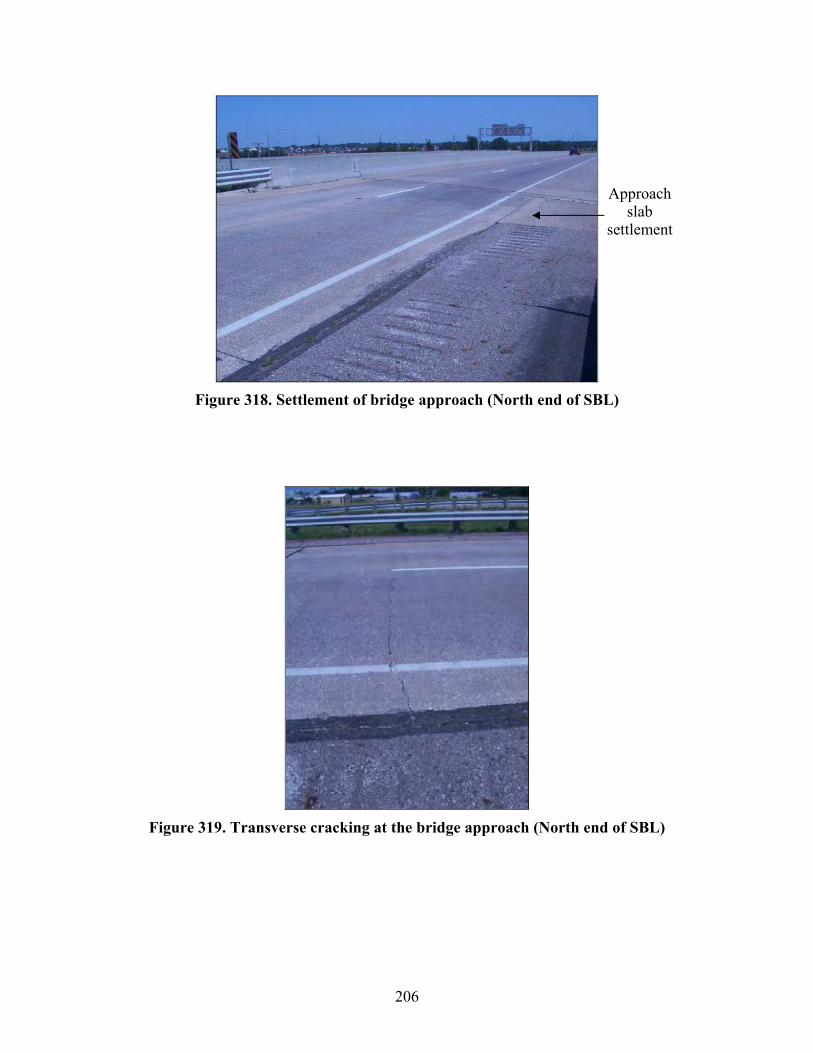
206
Figure 318. Settlement of bridge approach (North end of SBL)
Figure 319. Transverse cracking at the bridge approach (North end of SBL)
Approach slab
settlement
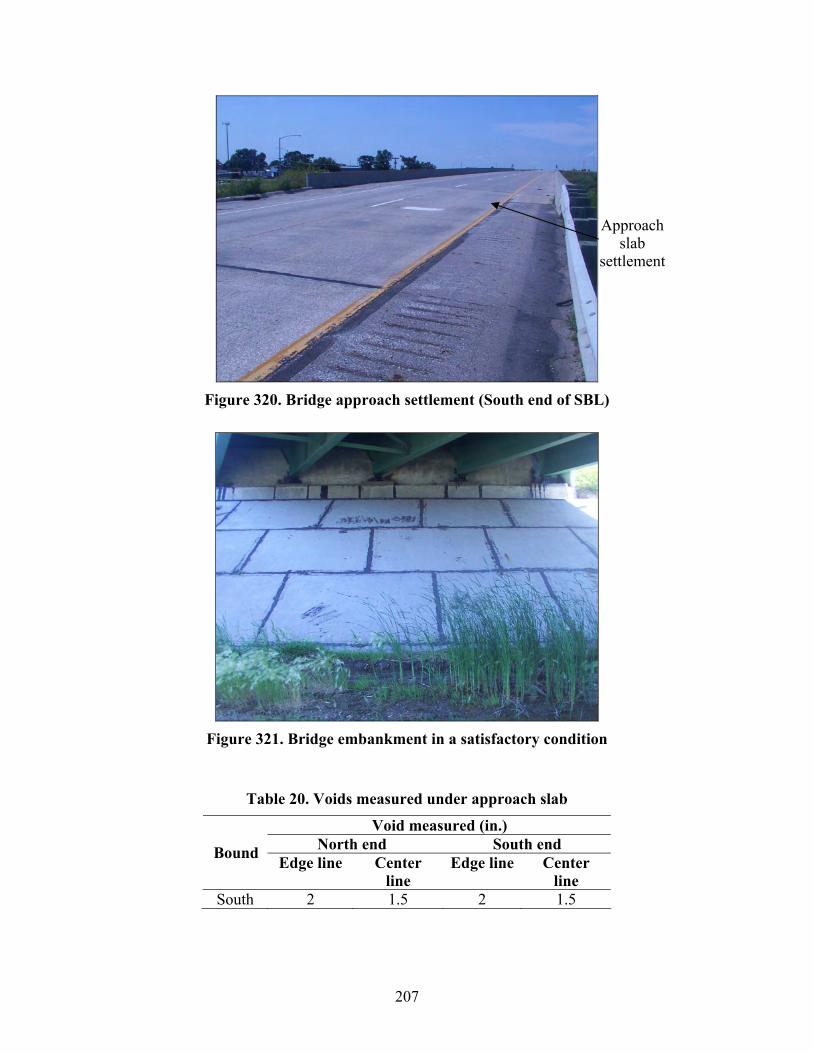
207
Figure 320. Bridge approach settlement (South end of SBL)
Figure 321. Bridge embankment in a satisfactory condition
Table 20. Voids measured under approach slab
Void measured (in.) North end South end Bound Edge line Center
line Edge line Center
line South 2 1.5 2 1.5
Approach slab
settlement

208
Distance away from the bridge (ft)
0 10 20 30 40 50 60 70 80
App
roac
h sl
ab e
leva
tion
rela
tive
to b
ridge
(ft)
-2.0
-1.5
-1.0
-0.5
0.0
0.5
Distance away from the bridge (m)
0 2 4 6 8 10 12 14 16 18 20 22 24
Appr
oach
sla
b el
evat
ion
rela
tive
to b
ridge
(m)
North endSouth end
Slope = 0.009
Slope = -0.026
Figure 322. Profile of the bridge approach relative to bridge slab (SBL)
Bridge no. 7783.1065 (US 6/Hubbell)
This bridge is a four-span bridge with concrete girders and integral abutments. Although the north end of the northbound lane was overlaid with asphalt, differential settlement of 2 inches was measured at the end of the wingwall (Figure 323). A 2-inch gap between the bridge approach and the wingwall developed due to settlement of the approach slab relative to the wingwall (Figure 324). Recycled tire chips were used as joint filler in the expansion joint. The embankment had settled about 4 inches and a 2-inch horizontal gap had formed between the abutment and embankment, as shown in Figure 325. The slope protection, however, was still in a satisfactory condition. At the south end of the northbound lanes, differential settlement of 1 inch was measured at the end of the wingwall (Figure 326). The width of the expansion joint was about 5 inches. Recycled tire chips were used as joint filler and did not seal the joint. Settlement of the embankment was 4 inches. The end drain was observed to be damaged and not functioning. At the north end of the southbound lanes, differential settlement was about 2 inches. Moderate erosion along the sides of the abutment was observed. The concrete slope protection of the embankment under the bridge was in a good condition; however, the embankment settled 3 inches, and a 2-inch gap had developed between the embankment and the abutment (Figure 327).
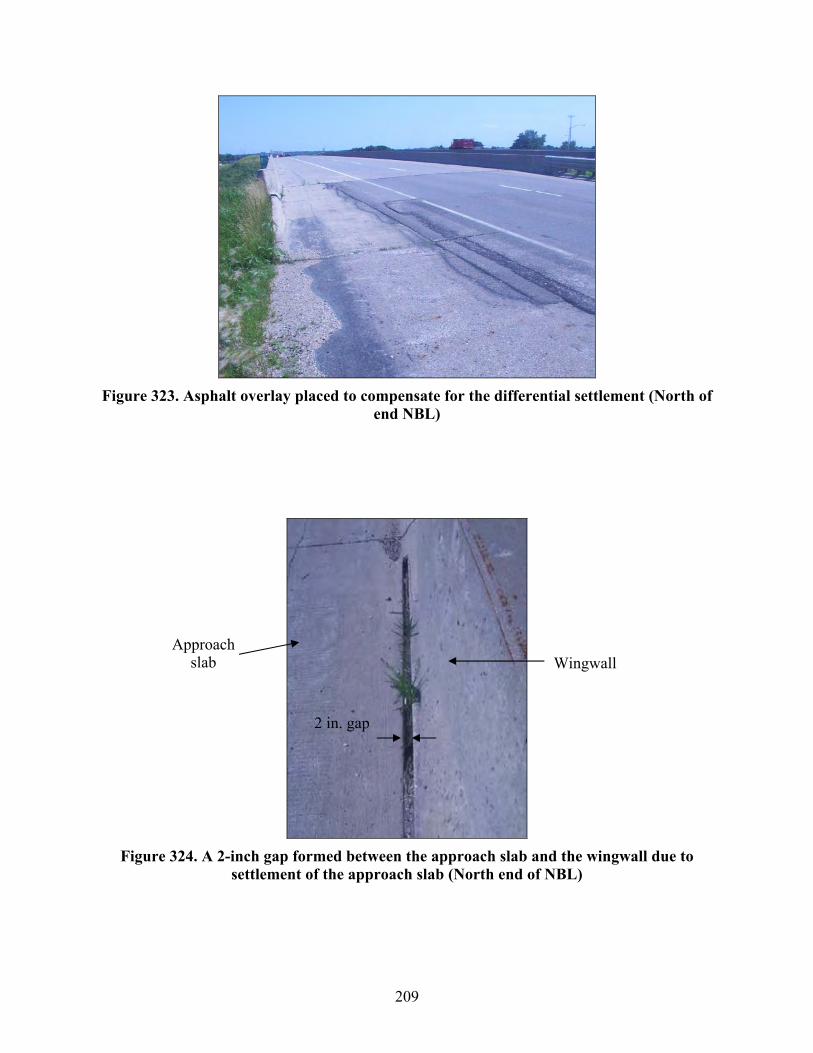
209
Figure 323. Asphalt overlay placed to compensate for the differential settlement (North of
end NBL)
Figure 324. A 2-inch gap formed between the approach slab and the wingwall due to
settlement of the approach slab (North end of NBL)
2 in. gap
Wingwall Approach
slab
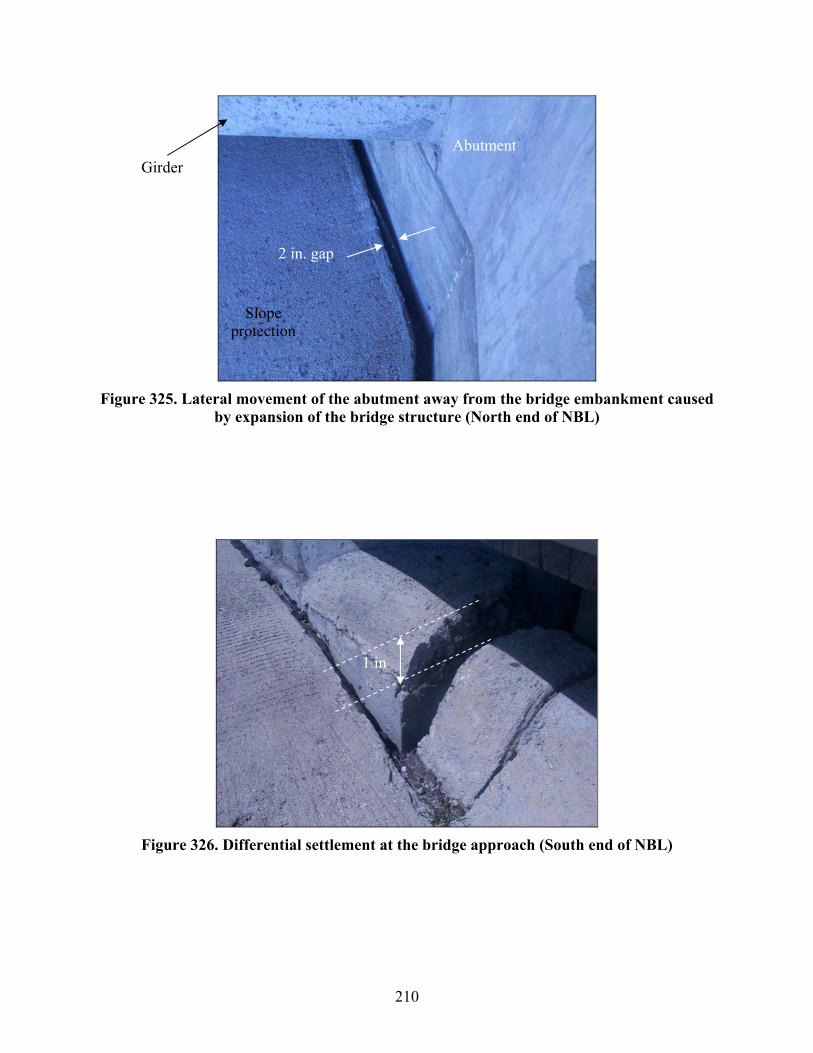
210
Figure 325. Lateral movement of the abutment away from the bridge embankment caused
by expansion of the bridge structure (North end of NBL)
Figure 326. Differential settlement at the bridge approach (South end of NBL)
Girder
2 in. gap
Abutment
Slope protection
1 in.
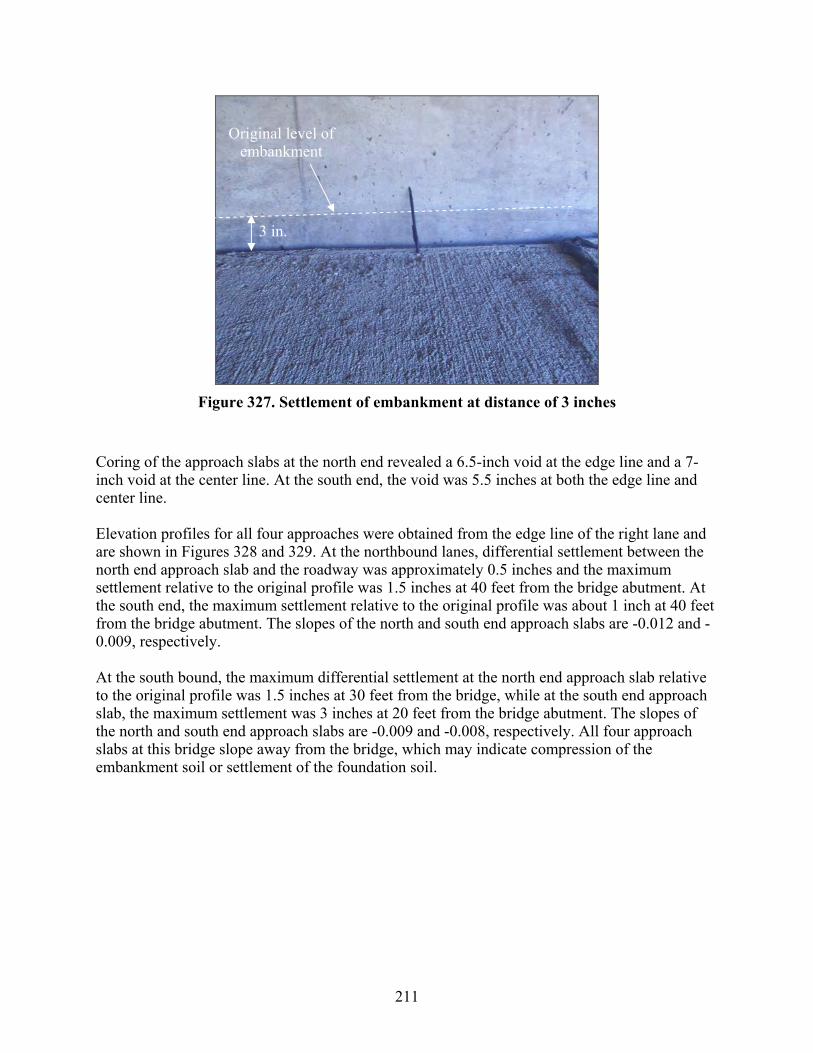
211
Figure 327. Settlement of embankment at distance of 3 inches
Coring of the approach slabs at the north end revealed a 6.5-inch void at the edge line and a 7-inch void at the center line. At the south end, the void was 5.5 inches at both the edge line and center line. Elevation profiles for all four approaches were obtained from the edge line of the right lane and are shown in Figures 328 and 329. At the northbound lanes, differential settlement between the north end approach slab and the roadway was approximately 0.5 inches and the maximum settlement relative to the original profile was 1.5 inches at 40 feet from the bridge abutment. At the south end, the maximum settlement relative to the original profile was about 1 inch at 40 feet from the bridge abutment. The slopes of the north and south end approach slabs are -0.012 and -0.009, respectively. At the south bound, the maximum differential settlement at the north end approach slab relative to the original profile was 1.5 inches at 30 feet from the bridge, while at the south end approach slab, the maximum settlement was 3 inches at 20 feet from the bridge abutment. The slopes of the north and south end approach slabs are -0.009 and -0.008, respectively. All four approach slabs at this bridge slope away from the bridge, which may indicate compression of the embankment soil or settlement of the foundation soil.
3 in.
Original level of embankment
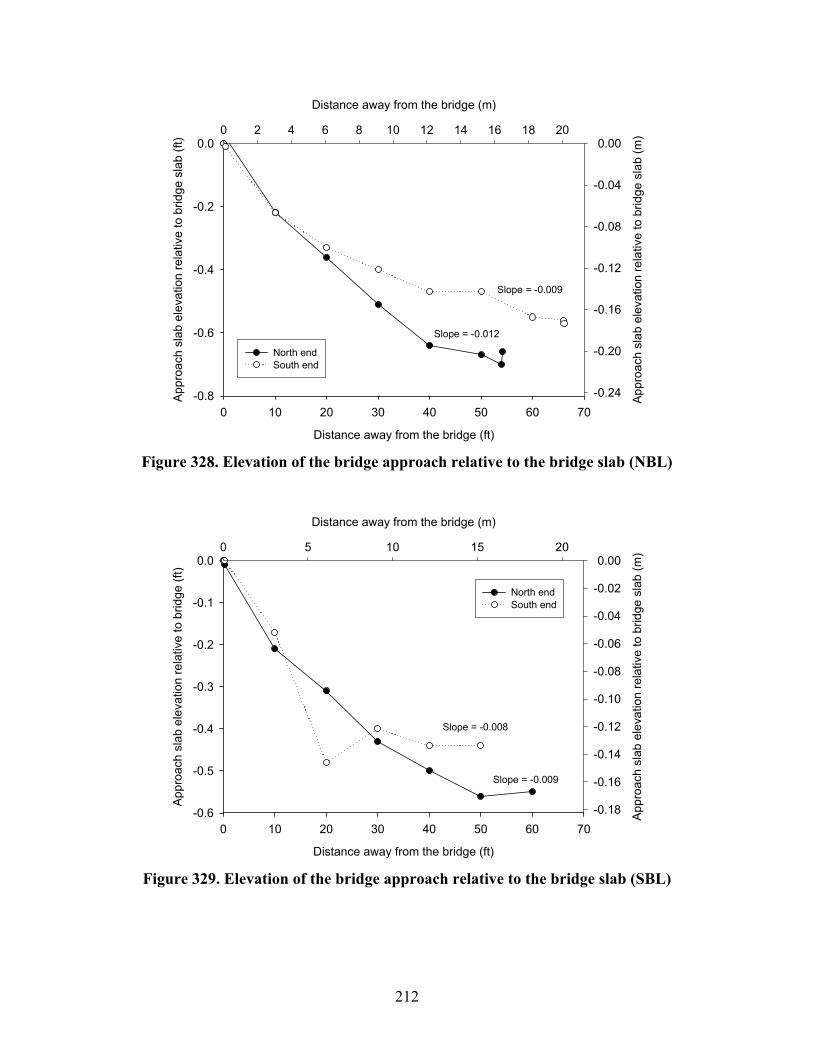
212
Distance away from the bridge (ft)
0 10 20 30 40 50 60 70
App
roac
h sl
ab e
leva
tion
rela
tive
to b
ridge
sla
b (ft
)
-0.8
-0.6
-0.4
-0.2
0.0
Distance away from the bridge (m)
0 2 4 6 8 10 12 14 16 18 20
App
roac
h sl
ab e
leva
tion
rela
tive
to b
ridge
sla
b (m
)
-0.24
-0.20
-0.16
-0.12
-0.08
-0.04
0.00
North endSouth end
Slope = -0.012
Slope = -0.009
Figure 328. Elevation of the bridge approach relative to the bridge slab (NBL)
Distance away from the bridge (ft)
0 10 20 30 40 50 60 70
App
roac
h sl
ab e
leva
tion
rela
tive
to b
ridge
(ft)
-0.6
-0.5
-0.4
-0.3
-0.2
-0.1
0.0
Distance away from the bridge (m)
0 5 10 15 20
App
roac
h sl
ab e
leva
tion
rela
tive
to b
ridge
sla
b (m
)
-0.18
-0.16
-0.14
-0.12
-0.10
-0.08
-0.06
-0.04
-0.02
0.00
North endSouth end
Slope = -0.008
Slope = -0.009
Figure 329. Elevation of the bridge approach relative to the bridge slab (SBL)

213
Bridge no. 1783.6018
This bridge, which is a three-span bridge constructed in 1997, has integral abutments, concrete girders, and crosses over a railroad. According to the maintenance report, the approach slab was replaced in July 1999. At the west end of the eastbound lane, differential settlement between the bridge approach and the bridge deck at the wingwall was approximately 1.5 inches (Figure 330). Furthermore, the expansion joint sealer was deteriorated exposing the flexible foam filler material, which was poorly sealing the expansion joint leaving a gap for water to flow around the bridge, as shown in Figure 331. The bridge embankment has a slope protection, which was in good condition; however, the embankment settled 3.5 inches, as shown in Figure 332. A 1-inch gap between the bridge embankment and the bridge abutment was measured (Figure 333). At the east end of the eastbound lane, differential settlement at the wingwall was 1 inch (Figure 334). Similar to the west end, the sealer material at the expansion joint was deteriorated exposing the flexible foam material, which poorly sealed the expansion joint. In addition, concrete spalling near the expansion joint was observed (See Figure 335).
Figure 330. Differential settlement between the bridge approach and the approach slab
(West end of EBL)
1.5 in.
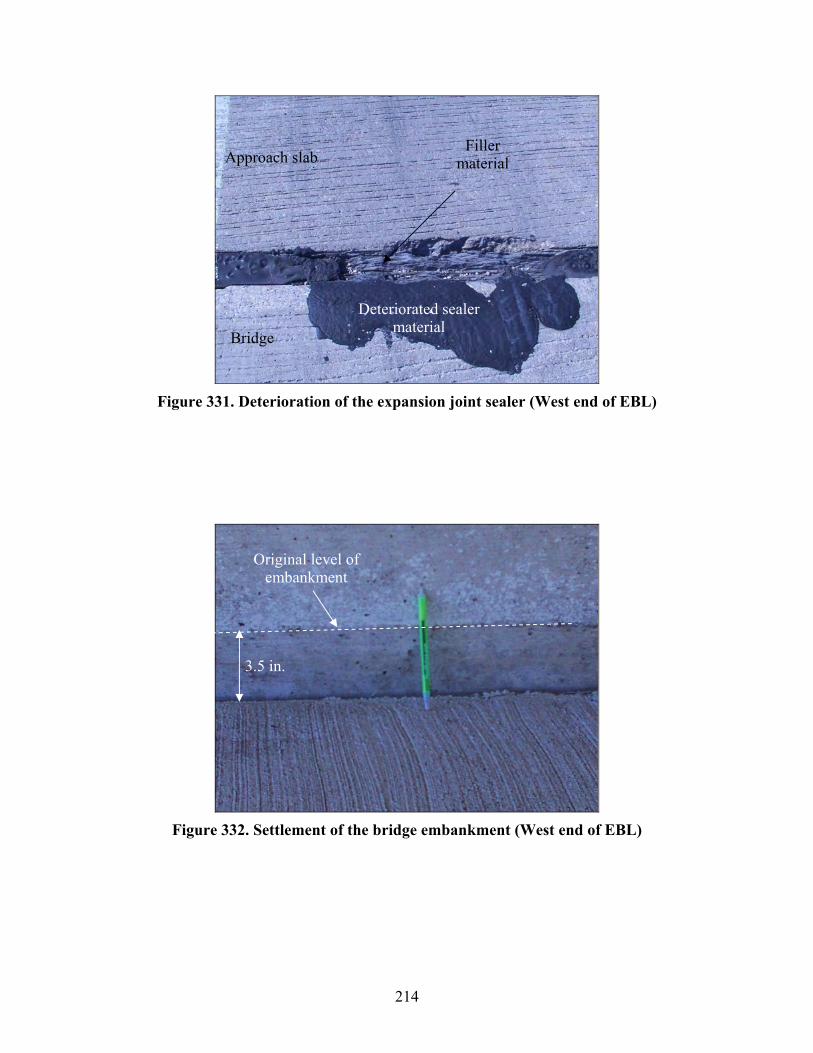
214
Figure 331. Deterioration of the expansion joint sealer (West end of EBL)
Figure 332. Settlement of the bridge embankment (West end of EBL)
Approach slab Filler
material
Bridge
Deteriorated sealer material
Original level of embankment
3.5 in.

215
Figure 333. Top view showing a gap between the bridge embankment and the bridge
abutment (West end of EBL)
Figure 334. Differential settlement between the bridge approach and the approach slab
(East end of EBL)
Slope protection
1 in. gap
Bridge abutment
1 in.

216
Figure 335. Poorly sealed expansion joint with concrete spalling (East end of EBL)
URETEK, Inc., injected polyurethane material under both approach slabs at the eastbound lane to alleviate the bump caused by excessive settlement. The profiles of the approach slabs before and after injecting the expansive polyurethane were measured. Both approaches were lifted approximately 1.8 inches at 20 feet away from the bridge; however, both approach slabs were lifted approximately 0.5 inch higher than the bridge deck level, creating a bump.
Distance away from the bridge (ft)
0 10 20 30 40 50 60 70
App
roac
h sl
ab e
leva
tion
rela
tive
to b
ridge
sla
b (ft
)
-0.4
-0.3
-0.2
-0.1
0.0
0.1
Distance away from the bridge (m)
0 5 10 15 20
App
roac
h sl
ab e
leva
tion
rela
tive
to b
ridge
(m)
-0.12
-0.10
-0.08
-0.06
-0.04
-0.02
0.00
0.02East end before liftingWest end before liftingEast end after liftingWest end after lifting
Figure 336. Approach slabs elevations before and after injecting the expansive
polyurethane (EBL)
Concrete spalling

217
Key Findings from Maintenance Practices
• Backfill materials under poorly performing approach slabs are loose and undercompacted. Results from tests on newly placed backfill material suggest that the new material is not properly compacted.
• At one location, the approach slab pavement was observed resting on only 0.5 inch of the paving notch, which was a result of the front portion of the paving notch breaking off.
• Coring by Iowa DOT personnel through several approach slabs revealed that voids are highest near the bridge abutment and decrease with distance away from the abutment. The measured void sizes range from 0.5 inch to 12 inches.
• An investigation using the Iowa DOT snake camera at the subdrain outlets demonstrated that most of the investigated subdrains are not functioning properly. The subdrains were either dry with no evidence of water or blocked with soil fines and debris or had collapsed.
• At two bridge sites it was shown that the URETEK method successfully lifted the approach slab. Further monitoring is required to verify long-term performance of this system.
• From the 26 approach slab elevation profiles collected on U.S. 65 near Des Moines, about 80% of the approach slab gradients are higher than 1/200, as suggested by Wahls (1990) as a maximum slope for bridge approaches, and about 20% of the approach slabs were sloping away from the bridge which can be attributed to compression of the embankment material or settlement of the foundation soil.
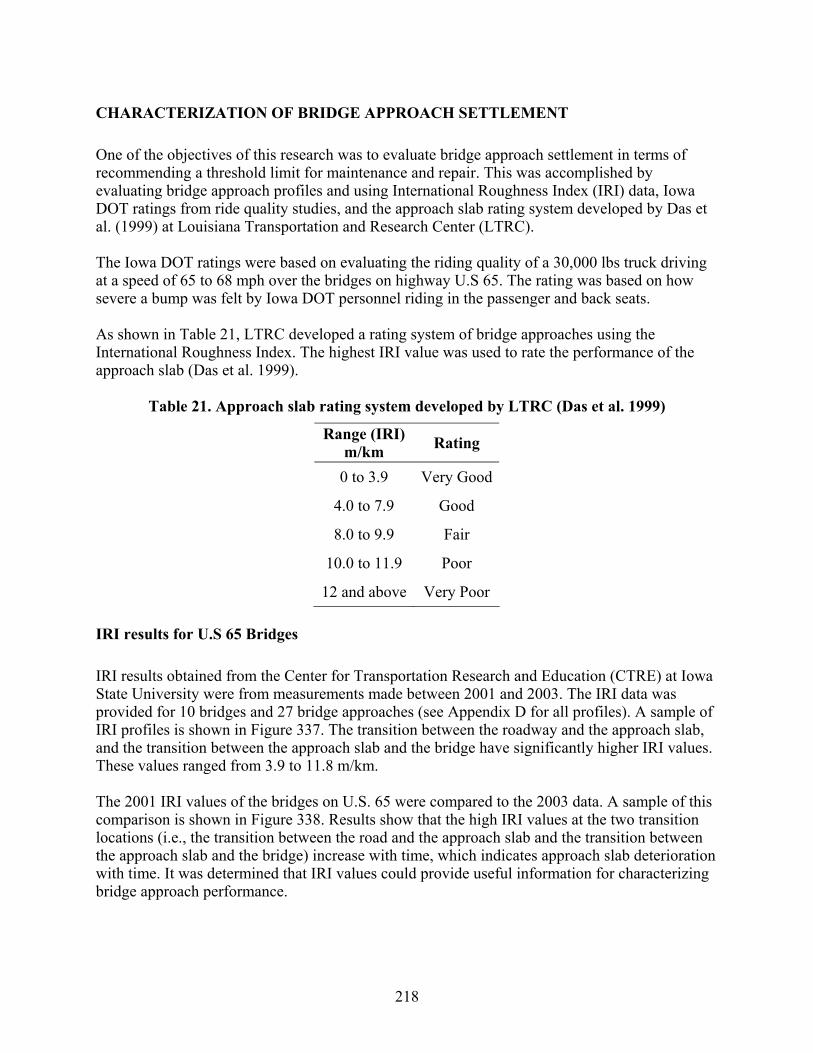
218
CHARACTERIZATION OF BRIDGE APPROACH SETTLEMENT
One of the objectives of this research was to evaluate bridge approach settlement in terms of recommending a threshold limit for maintenance and repair. This was accomplished by evaluating bridge approach profiles and using International Roughness Index (IRI) data, Iowa DOT ratings from ride quality studies, and the approach slab rating system developed by Das et al. (1999) at Louisiana Transportation and Research Center (LTRC). The Iowa DOT ratings were based on evaluating the riding quality of a 30,000 lbs truck driving at a speed of 65 to 68 mph over the bridges on highway U.S 65. The rating was based on how severe a bump was felt by Iowa DOT personnel riding in the passenger and back seats. As shown in Table 21, LTRC developed a rating system of bridge approaches using the International Roughness Index. The highest IRI value was used to rate the performance of the approach slab (Das et al. 1999).
Table 21. Approach slab rating system developed by LTRC (Das et al. 1999)
Range (IRI) m/km Rating
0 to 3.9 Very Good
4.0 to 7.9 Good
8.0 to 9.9 Fair
10.0 to 11.9 Poor
12 and above Very Poor IRI results for U.S 65 Bridges
IRI results obtained from the Center for Transportation Research and Education (CTRE) at Iowa State University were from measurements made between 2001 and 2003. The IRI data was provided for 10 bridges and 27 bridge approaches (see Appendix D for all profiles). A sample of IRI profiles is shown in Figure 337. The transition between the roadway and the approach slab, and the transition between the approach slab and the bridge have significantly higher IRI values. These values ranged from 3.9 to 11.8 m/km. The 2001 IRI values of the bridges on U.S. 65 were compared to the 2003 data. A sample of this comparison is shown in Figure 338. Results show that the high IRI values at the two transition locations (i.e., the transition between the road and the approach slab and the transition between the approach slab and the bridge) increase with time, which indicates approach slab deterioration with time. It was determined that IRI values could provide useful information for characterizing bridge approach performance.

219
Distance (m)
0 20 40 60 80 100 120 140 160 180 200 220 240
IRI (
m/k
m)
0
1
2
3
4
5
6
7
8
9
Distance (ft)
0 100 200 300 400 500 600 700
IRI (
in/m
i)
0
100
200
300
400
500Left laneRight lane
Roa
dway
Brid
ge a
ppro
ach
Brid
ge
Brid
ge a
ppro
ach
Roa
dway
Figure 337. IRI graph; Bridge no. 7777.0065 SBL
Distance (m)
0 50 100 150 200 250
IRI (
m/k
m)
0
2
4
6
8
10
12
Distance (ft)
0 100 200 300 400 500 600 700 800
IRI (
in/m
i)
0
100
200
300
400
500
600
700 Left lane 2003Right lane 2003Left lane 2001Right lane 2001
Roa
dway Brid
ge
Brid
ge a
ppro
ach
Roa
dwayBrid
ge a
ppro
ach
Figure 338. Increase of International Roughness Index with time; Bridge no. 7773.0065
NBL

220
Bridge Approach Index
The elevation profiles of 38 bridge approaches were measured relative to the bridge deck. All profiles were measured at the edge line of the right lane. The slopes of the bridge approach slabs were calculated using the elevations of the first and last points on the bridge approach profile. Figure 339 shows that the majority of the slopes are higher that 1/200 suggested by Wahls (1990) as a maximum slope for bridge approaches. According to this criterion, bridge approaches with slopes higher than 1/200 require maintenance. To further characterize the performance of bridge approaches, the Bridge Approach Index (BI) was developed. The BI is calculated as the area between the original profile and the existing profile of the approach slab divided by its length. The area is determined by subtracting the integration of the original profile, which is assumed to be a straight line connecting the bridge slab to the pavement elevation just past the CF joint, and the existing profile over the length of the approach slab. In general, the higher the calculated BI, the worse the approach slab condition. Figure 340 shows the profiles of two approach slabs relative to the original profile. A shown, the north end settled more than the south end, which is reflected in the higher area calculation between the original and existing profile. The area calculated for the north end was 50.2 ft2 (4.7 m2), while the area calculated for the south end was 28.4 ft2 (2.6 m2). After dividing by the length, the BI values for these two approaches were 0.822 and 0.557, respectively.
Slope
0.00 0.01 0.02 0.03 0.04
Freq
uenc
y
0
2
4
6
8
10
12Slope = 1/200
Figure 339. A frequency plot for slopes calculated from approach slab profiles
Require maintenance

221
Distance away from the bridge (m)
0 5 10 15 20 25
App
roac
h sl
ab e
leva
tion
rela
tive
to b
ridge
(m)
-0.30
-0.25
-0.20
-0.15
-0.10
-0.05
0.00
Distance away from the bridge (ft)
0 10 20 30 40 50 60 70 80
App
roac
h sl
ab e
leva
tion
rela
tive
to b
ridge
(ft)
-0.8
-0.6
-0.4
-0.2
0.0
North endSouth end
Figure 340. Elevation of two approach slabs relative to bridge; Bridge no. 7777.0065 NBL
Rating Criteria
Table 22 presents a summary of both the BI and IRI data used to develop the rating criteria for bridge approaches. The table also presents the Iowa DOT rating of the approach slabs, which generally gives lower approach slab ratings than the LTRC ratings. This indicates that using one IRI value at the bridge approach may not provide sufficient information. The rating system developed herein for characterizing approach slab performance is thus based on both the BI and the maximum IRI values at the bridge approach. Table 22 shows comparisons between IRI, BI, and Iowa DOT ride quality ratings. Figure 341 shows the developed rating system. Bridge approaches on Highway U.S. 65 were rated according to the developed rating system, as shown in Table 23. According to the rating system, 84% of these approaches rated as very poor, 8% poor, 4% fair, and 4% good. Approach slabs that rate below fair should be targeted for maintenance. Thus, 92% of the approaches inspected on Highway U.S. 65 require maintenance.
Original profile
Current profile

222
Table 22. Summary of data used to rate the performance of approach slabs
Bridge no. Location IRIbridge (m/km)
IRICF joint (m/km)
IRImax (m/km)
IADOT rating
LTRC Rating
Area (ft2)
Length (ft)
BI (ft)
7773.0065 NE_NBL 11.8 1.9 11.8 Poor Poor 0.0996 50.5 0.0020 7773.0065 SE_NBL 6.7 3.9 6.7 Good Good 7.45 76.5 0.0974
7774.0L065 SE_SBL 8.3 1.6 8.3 Poor Fair 7.068 63 0.1122 7776.8065 NE_NBL 8.1 4.7 8.1 Poor Fair 4.222 51 0.0828 7776.8065 SE_NBL 5.8 4.5 5.8 Fair Good 10.014 61.5 0.1628 7776.8065 NE_SBL 5.4 3.1 5.4 Poor Good 26.09 61.5 0.4242 7776.8065 SE_SBL 5.6 3.1 5.6 Fair Good 1.204 61 0.0197 7777.0065 NE_NBL 6.7 3.8 6.7 Poor Good 50.162 61 0.8223 7777.0065 SE_NBL 5.3 3.4 5.3 Poor Good 28.43 51 0.5575 7778.1065 NE_NBL 6.8 3.4 6.8 Poor Good 4.215 47 0.0897 7778.1065 SE_NBL 5.7 2.1 5.7 Poor Good 0.545 67 0.0081 7778.1065 NE_SBL 10.3 4.8 10.3 Poor Poor 29.78 70 0.4254 7779.4065 NE_NBL 8.5 4.1 8.5 Poor Fair 0.1422 58 0.0025 7779.4065 SE_NBL 9.9 5.0 9.9 Poor Fair 189.25 62 3.0524 7779.4065 NE_SBL 7.7 1.2 7.7 Fair Good 6.238 61.5 0.1014 7779.4065 SE_SBL 4.8 2.9 4.8 Poor Good 59.65 60 0.9942
7780.8R065 NE_NBL 7.9 3.2 7.9 Poor Good 17.396 54.5 0.3192
7781.2065 NE_NBL 9.3 11.6 11.6 Very poor Poor 33.36 78 0.4277
7781.2065 SE_NBL 7.6 4.5 7.6 Very poor Good 59.62 54 1.1041
7781.2065 NE_SBL 9.6 5.5 9.6 Very poor Fair 5.91 56.5 0.1046
7781.2065 SE_SBL 8.5 5.3 8.5 Very poor Fair 9.703 56.5 0.1717
7782.8L065 NE_SBL 3.9 2.0 3.9 Poor Very Good 5.14 52 0.0988
7783.1065 NE_NBL 4.8 5.8 5.8 Poor Good 17.92 54 0.3319 7783.1065 SE_NBL 5.2 3.2 5.2 Fair Good 151.79 66 2.2998
7783.1065 NE_SBL 3.8 2.8 3.8 Poor Very Good 0.2256 60 0.0038
7783.1065 SE_NBL 5.5 2.2 5.5 Poor Good 272.39 50 5.4478

223
Figure 341. Rating system of bridge approach performance
0.017 to 0.115(0.007 to 0.035)
Rating: Very poor
Rating: Poor
Rating: Fair
Rating: Good
Rating: Poor
Rating: Very poorBridge
ApproachIndex
≥ 0.016 (0.006)
≥ 0.116 (0.036)
IRImax ≤ 379 (5.9)
IRImax ≥ 380 (6.0)
Rating: Very poor
IRImax ≤ 247 (3.9)
248 (4.0) ≤ IRImax ≤ 380 (6.0)
381 (6.1) ≤ IRImax≤ 507 (8.0)
IRImax ≥ 508 (8.0)
*Bridge Approach Index, ft (m)*IRI, in/mi (m/km)
0.017 to 0.115(0.007 to 0.035)
Rating: Very poor
Rating: Poor
Rating: Fair
Rating: Good
Rating: Poor
Rating: Very poorBridge
ApproachIndex
≥ 0.016 (0.006)
≥ 0.116 (0.036)
IRImax ≤ 379 (5.9)
IRImax ≥ 380 (6.0)
Rating: Very poor
IRImax ≤ 247 (3.9)
248 (4.0) ≤ IRImax ≤ 380 (6.0)
381 (6.1) ≤ IRImax≤ 507 (8.0)
IRImax ≥ 508 (8.0)
*Bridge Approach Index, ft (m)*IRI, in/mi (m/km)
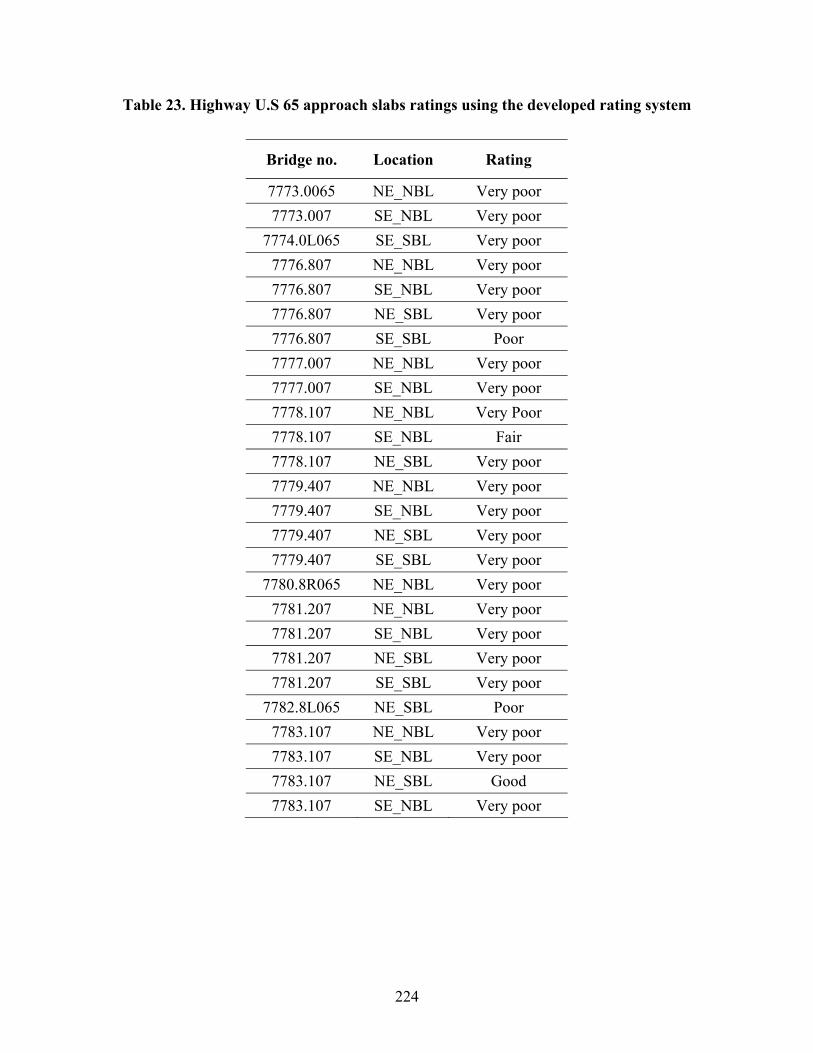
224
Table 23. Highway U.S 65 approach slabs ratings using the developed rating system
Bridge no. Location Rating
7773.0065 NE_NBL Very poor 7773.007 SE_NBL Very poor
7774.0L065 SE_SBL Very poor 7776.807 NE_NBL Very poor 7776.807 SE_NBL Very poor 7776.807 NE_SBL Very poor 7776.807 SE_SBL Poor 7777.007 NE_NBL Very poor 7777.007 SE_NBL Very poor 7778.107 NE_NBL Very Poor 7778.107 SE_NBL Fair 7778.107 NE_SBL Very poor 7779.407 NE_NBL Very poor 7779.407 SE_NBL Very poor 7779.407 NE_SBL Very poor 7779.407 SE_SBL Very poor
7780.8R065 NE_NBL Very poor 7781.207 NE_NBL Very poor 7781.207 SE_NBL Very poor 7781.207 NE_SBL Very poor 7781.207 SE_SBL Very poor
7782.8L065 NE_SBL Poor 7783.107 NE_NBL Very poor 7783.107 SE_NBL Very poor 7783.107 NE_SBL Good 7783.107 SE_NBL Very poor
225
Key Findings from Characterizing Bridge Approach Settlement
• Maximum values of IRI were observed at the transition between the bridge and the approach slab and the approach slab and the roadway.
• IRI values at the bridge approach increased with time indicating bridge approach settlement.
• BI and maximum IRI values around the bridge can be used as criteria to initiate maintenance of the bridge approach.
• According to the newly developed rating system, several of the bridge approaches on US highway 65 near Des Moines needed maintenance or repair. Several of the approach slabs were repaired in 2004.

226
CHARACTERISTICS OF BACKFILL MATERIALS
Comparing Backfill Grain Size Distributions to Average Opening of Drainage Pipe
Even though it was specified, at many bridge sites it was observed that no porous backfill was placed around the subdrain. Generally, granular backfill was used in lieu of porous backfill. Iowa DOT specifies that granular backfill material must have 20% to 100% passing the No. 8 sieve and up to 10 % passing the No. 200 sieve. Figure 342 shows a typical perforated drainage pipe used for subdrain construction. The width of ten random pipe perforations was measured to compare to the size of granular backfill particles. The largest measured pipe opening was 0.09 in. (2.3 mm) and the average pipe opening was 0.07 in. (2.0 mm), which is similar to the No. 8 sieve opening (2.36 mm). Further, it was found that the majority of granular backfill soil particles are smaller than the subdrain perforation size, which possibly lead to plugged drains. Table 24 shows that the percentage of granular backfill soil particles smaller than the average subdrain perforation is about 80%.
(a) Perforated drainage pipe (b) Closer view of pipe openings
Figure 342. Perforated drainage pipe used around Iowa bridges
Table 24. Comparing backfill grain sizes to the average pipe opening
Bridge location Backfill type
Moisture content percent
Classification
Percentage finer than the
average pipe perforation (2 mm)
35th St. Porous 4.15 GP 1 35th St. Granular 3.9 SP 81
Polk Blvd. Granular 4.6 SP 78 19th St. Granular 5.0 SP 79
East 12th St. Granular - SP 78 Bridge over Union
Pacific RR Granular 4.1 SP 84
Bridge no. 57.6R030 Granular - SP 30

227
Collapse Index Test
Iowa DOT does not specify a compaction moisture content range for granular backfill materials. During the field inspection of several bridges, it was observed that the granular backfill was placed at a moisture content ranging from about 3% to 5% (Table 24), which is within the bulking moisture content range (i.e., ≈ 3% to 7%) for granular backfill. Furthermore, the backfill material was placed without compaction at most sites, which compounds the problem. When saturated at a later time, the material is therefore susceptible to collapse. This is a result of water tension being released allowing the particles to compact. To evaluate the potential settlement associated with soil collapse, Collapse Index Test was developed and performed on several granular backfill materials. Experiment Test Setup
Figure 343 shows the apparatus to measure the collapse index for granular backfill materials. The apparatus consists of 0.66 ft. in diameter by 3 ft. in length Plexiglas cylinder open from both ends. A 1 in. sieve is mounted at 1.2 ft. above the cylinder.
20 cm0.66 ft
4.3 ft131.5 cm 3.11 ft
94.8 cm
1'' Sieve (25 mm)
Plexiglas cylinder
Figure 343. Assembled apparatus to measure collapse index
The test procedures consist of the following steps:
1. The tested backfill material is poured through the 1 inch sieve at a total drop height of 4.3 ft.
2. Fill to the top of the cylinder. 3. Strike the cylinder three times with a rubber mallet at four sides. Add additional soil to
the cylinder as needed. 4. Record the final height of the backfill material (L). 5. Saturate the fill material by adding water from the top of the cylinder.

228
6. Keep adding water until the material is saturated and water flows out the bottom of the cylinder.
7. Record the change in height. 8. Add more water and record any additional height drop and record the total change in
height (∆L). 9. Calculate the collapse index using equation (3).
Collapse index = 100×⎟⎠⎞
⎜⎝⎛ ∆
LL (3)
Test Results
Granular Backfill
Granular backfill material was obtained from Hallett Materials Quarry in Ames, Iowa. Figure 344 shows the gradation curve with comparisons to granular backfill materials used at four bridge sites evaluated during this study. The granular backfill used in this experiment classifies as poorly graded sand (SP) according to the USCS. Results provided in Figure 345 show that the highest measured collapse index value is 6% at initial moisture content ranging from 4% to 6% (see Appendix C for detailed calculations). This was not unexpected given that bulking water content typically ranges from 3% to 7% for this type of materials. At a 6% collapse value, 0.5 ft. of settlement would be expected for every 10 ft. of fill. Porous Backfill
The porous backfill used in the experiments was collected from a production site in Des Moines, Iowa, and classifies as poorly graded gravel (GP) according to the USCS (Figure 346). The material did not experience collapse settlement at an initial moisture content ranging from 0% to 12%. As a result, this material would not expected to settle due to collapse from saturation. Potential for Soil Erosion
Erosion was one of the major problems observed at the inspected bridge site in Iowa. Briaud et al. (1997) reported that soils with silt and fine sand are more erodible that other soil types and provided a range of most erodible soils (Figure 347). This erodible soil range was compared with the Iowa DOT granular backfill gradation requirement (Figure 348) and backfill materials collected at four bridge sites (Figure 349). Both gradations have a common region with the range of most erodible soils. Changing Iowa DOT specification of granular backfill material from 20% to 100% to 20% to 60% passing sieve number 8 (2.36 mm) would shift the backfill material gradation out of the most erodible soil region. On the other hand, Iowa DOT gradation requirement for porous backfill and the porous backfill sample obtained from bridge carrying 35th St. over I-235 around the subdrain were compared to the range of most erodible soils (Figure 350). Both gradations are out of the most erodible soil range. Therefore, porous backfill would be expected to be a more erosion resistant material than granular backfill and also, as described above, less susceptible to collapse.

229
Grain size (mm)
0.010.1110
Per
cent
fine
r
0
20
40
60
80
100
Tested35th St.19th St.E12th St.Polk Blvd.
Figure 344. Gradation of tested granular backfill materials compared with the gradation of
samples collected at four under-construction bridges
Moisture content, %
0 2 4 6 8 10 12 14
Col
laps
e in
dex,
%
0
1
2
3
4
5
6
7
Figure 345. Collapse index – moisture content relationship for granular backfill material

230
Grain size (mm)
0.010.1110100
Per
cent
fine
r
0
20
40
60
80
100
Figure 346. Gradation curve for porous backfill
Grain size (mm)
0.0001 0.001 0.01 0.1 1 10 1000
20
40
60
80
100 Clay size Silt size Sand size Gravel size
Most erodible soils
Figure 347. Range of most erodible soils (Reproduced from Briaud et al. 1997)
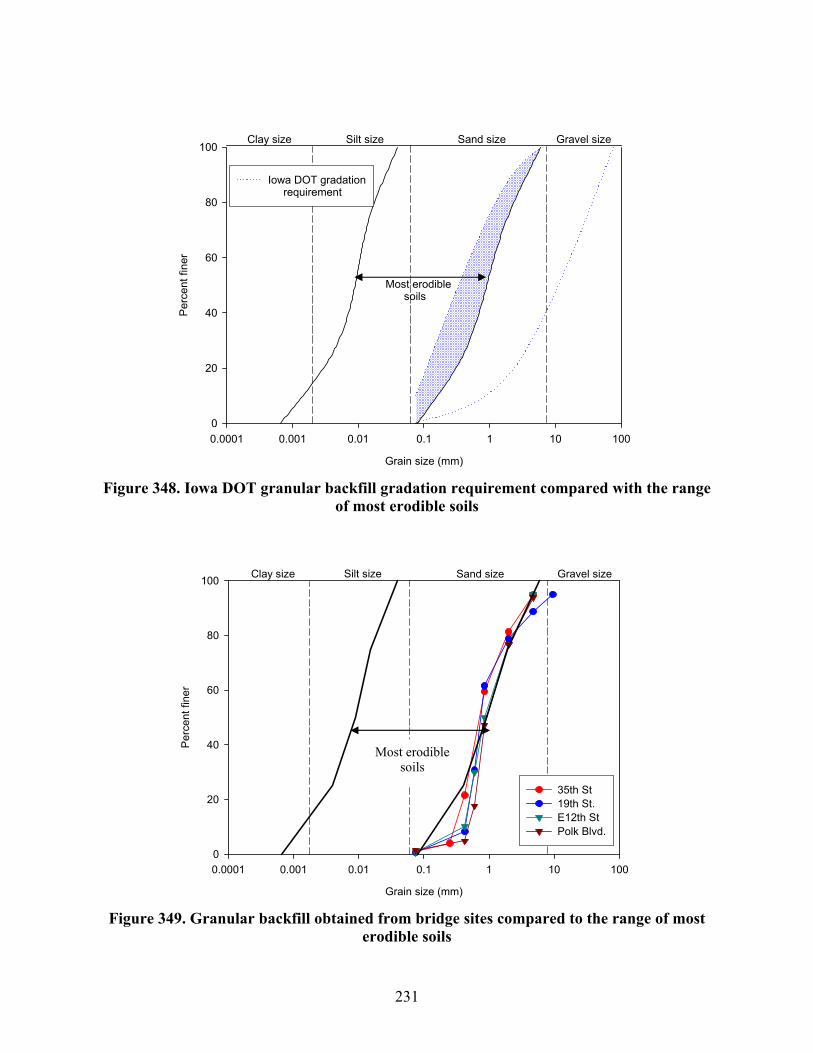
231
Grain size (mm)
0.0001 0.001 0.01 0.1 1 10 100
Per
cent
fine
r
0
20
40
60
80
100
Iowa DOT gradation requirement
Silt sizeClay size Sand size Gravel size
Most erodible soils
Figure 348. Iowa DOT granular backfill gradation requirement compared with the range
of most erodible soils
Grain size (mm)
0.0001 0.001 0.01 0.1 1 10 100
Per
cent
fine
r
0
20
40
60
80
100
35th St19th St.E12th StPolk Blvd.
Clay size Silt size Sand size Gravel size
Figure 349. Granular backfill obtained from bridge sites compared to the range of most
erodible soils
Most erodible soils
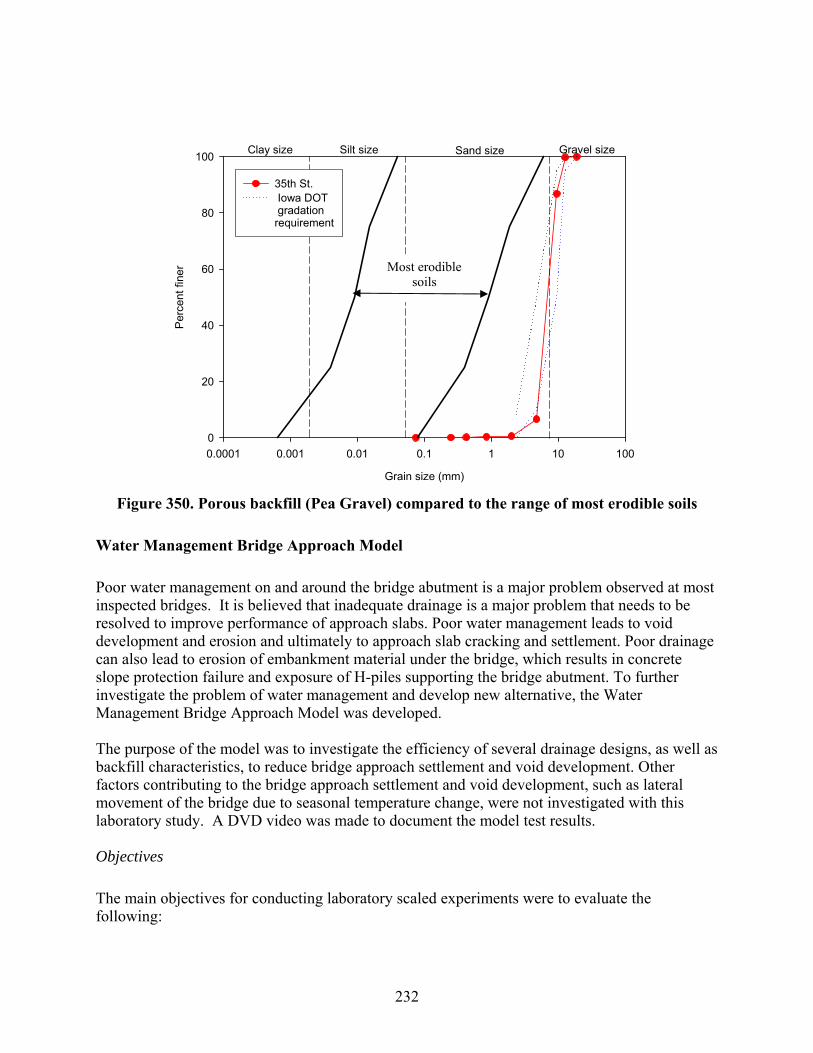
232
Grain size (mm)
0.0001 0.001 0.01 0.1 1 10 100
Per
cent
fine
r
0
20
40
60
80
100
35th St. Iowa DOT gradationrequirement
Clay size Silt size Sand size Gravel size
Figure 350. Porous backfill (Pea Gravel) compared to the range of most erodible soils
Water Management Bridge Approach Model
Poor water management on and around the bridge abutment is a major problem observed at most inspected bridges. It is believed that inadequate drainage is a major problem that needs to be resolved to improve performance of approach slabs. Poor water management leads to void development and erosion and ultimately to approach slab cracking and settlement. Poor drainage can also lead to erosion of embankment material under the bridge, which results in concrete slope protection failure and exposure of H-piles supporting the bridge abutment. To further investigate the problem of water management and develop new alternative, the Water Management Bridge Approach Model was developed. The purpose of the model was to investigate the efficiency of several drainage designs, as well as backfill characteristics, to reduce bridge approach settlement and void development. Other factors contributing to the bridge approach settlement and void development, such as lateral movement of the bridge due to seasonal temperature change, were not investigated with this laboratory study. A DVD video was made to document the model test results. Objectives
The main objectives for conducting laboratory scaled experiments were to evaluate the following:
Most erodible soils

233
• The current Iowa DOT drainage and backfill specifications • The current drainage and backfill field practice • Various backfill and drainage alternatives based on previous related research and
practices of other states Description of Model
The Water Management Bridge Approach Model consists of an approach slab, abutment, and a drainage pipe. The model is scaled to about one-fourth of the original dimensions, except for the drainage pipe and soil (Figures 351 and 352), which are full-scale. The model is 29 inches high, 23 inches wide and 32 inches long. The dimensions of the abutment are shown in Figure 353. Plexiglas is used to retain the backfill material inside. A perforated HDPE pipe with a 4-inch diameter was installed that is similar to the subdrain pipe used in the field. The spacing between the approach slab and the abutment (i.e., the expansion joint) was 1 inch (25% scale of the 4-inch expansion joint used by Iowa DOT). The center of the drainage pipe was positioned at 5 inches from the abutment and 3 inches above the bottom of the model. Water is forced to flow through the expansion joint, under the approach slab, through the drainage system, and out of the subdrain. The water is then collected in a trench around the model and pumped back into the model via a submerged water pump. To disperse the water before flowing into the expansion joint, a perforated Plexiglas tank is placed on top of the expansion joint. The inlet flow is altered as necessary until a maximum steady state condition is achieved. Once a steady state flow is reached, the flow rate is fixed until the end of the test. To compare different drainage details, each test was allowed to run for four hours in a steady-state condition. Settlement at the end of the approach slab, void development, and maximum steady state water flow were recorded for each experiment. Settlement was calculated by measuring the difference between the approach slab elevation before and after the test.
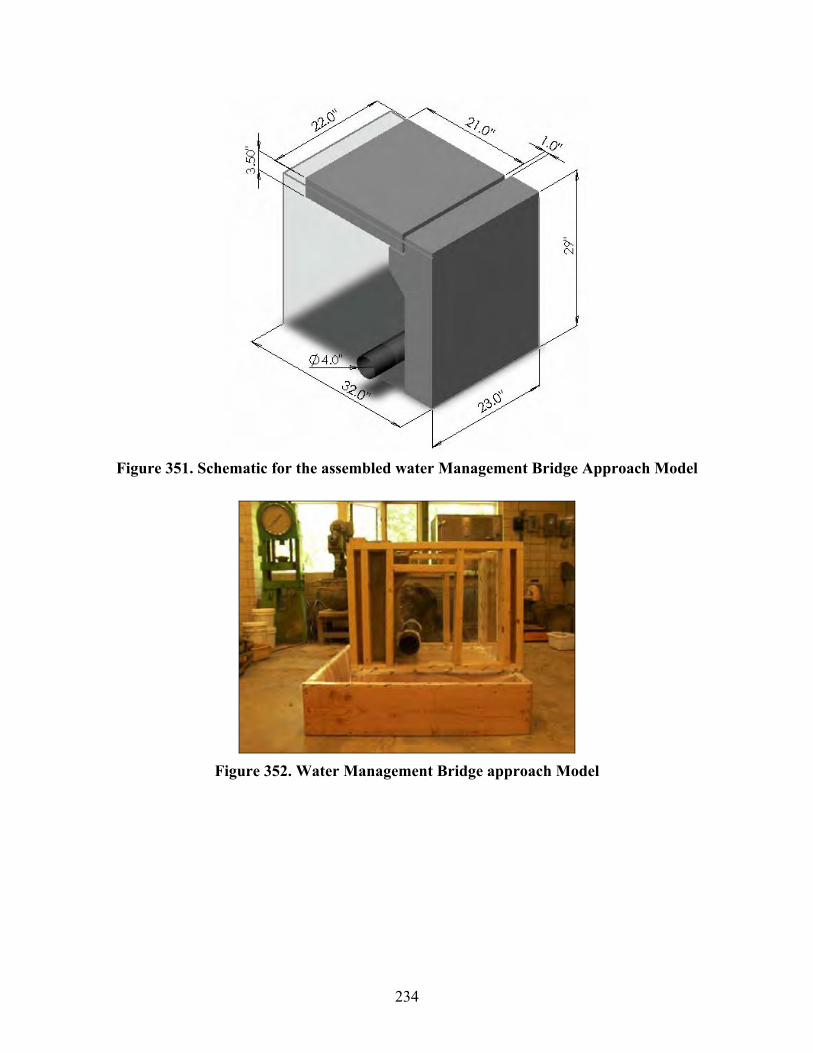
234
Figure 351. Schematic for the assembled water Management Bridge Approach Model
Figure 352. Water Management Bridge approach Model

235
Figure 353. Dimension of the abutment used in the model
Backfill Materials
Figures 354 through 357 present the grain-size distribution curves for the granular backfill, porous backfill, crushed limestone special backfill, and tire chips used through out the model tests. The granular and porous backfill materials were the same as the materials used in the collapse index tests. The granular backfill classifies as SP with a bulking moisture content range of 3% to 6%. The porous backfill and limestone special backfill classify as GP. All these materials met the Iowa DOT gradation requirements (Refer to section 4109.02 in Iowa DOT Standard Specifications for Highway and Bridge Construction 2004).
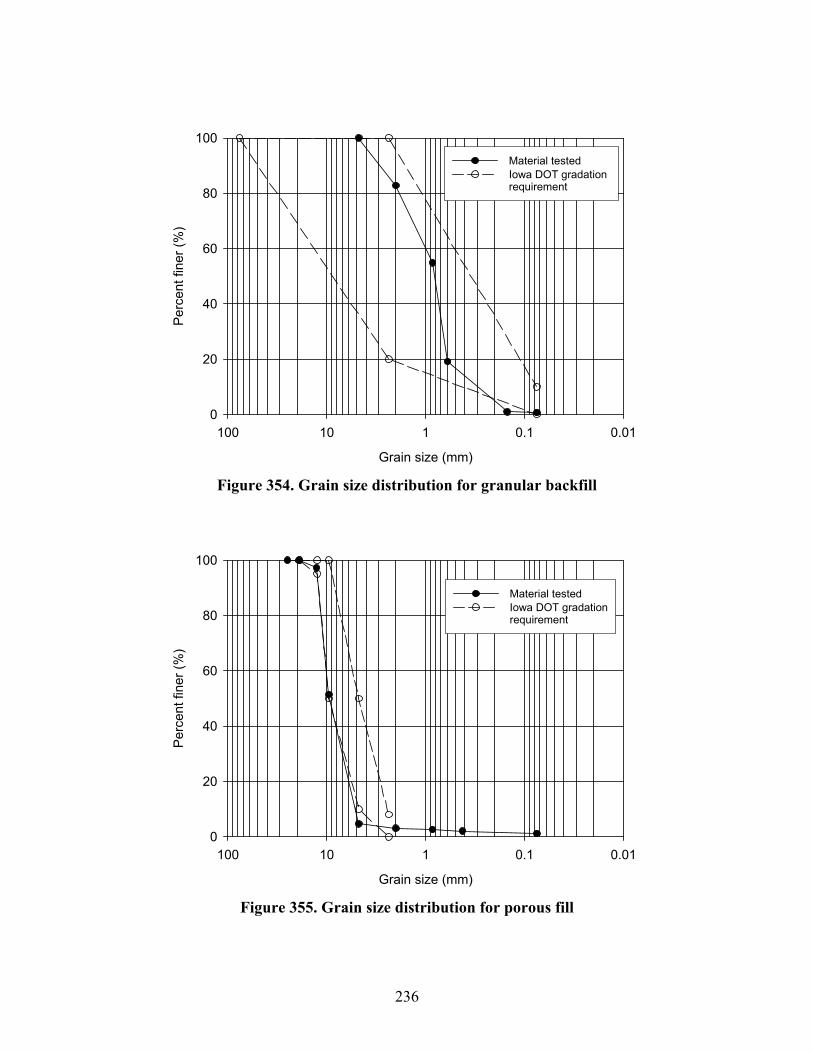
236
Grain size (mm)
0.010.1110100
Per
cent
fine
r (%
)
0
20
40
60
80
100Material testedIowa DOT gradation requirement
Figure 354. Grain size distribution for granular backfill
Grain size (mm)
0.010.1110100
Per
cent
fine
r (%
)
0
20
40
60
80
100
Material testedIowa DOT gradationrequirement
Figure 355. Grain size distribution for porous fill
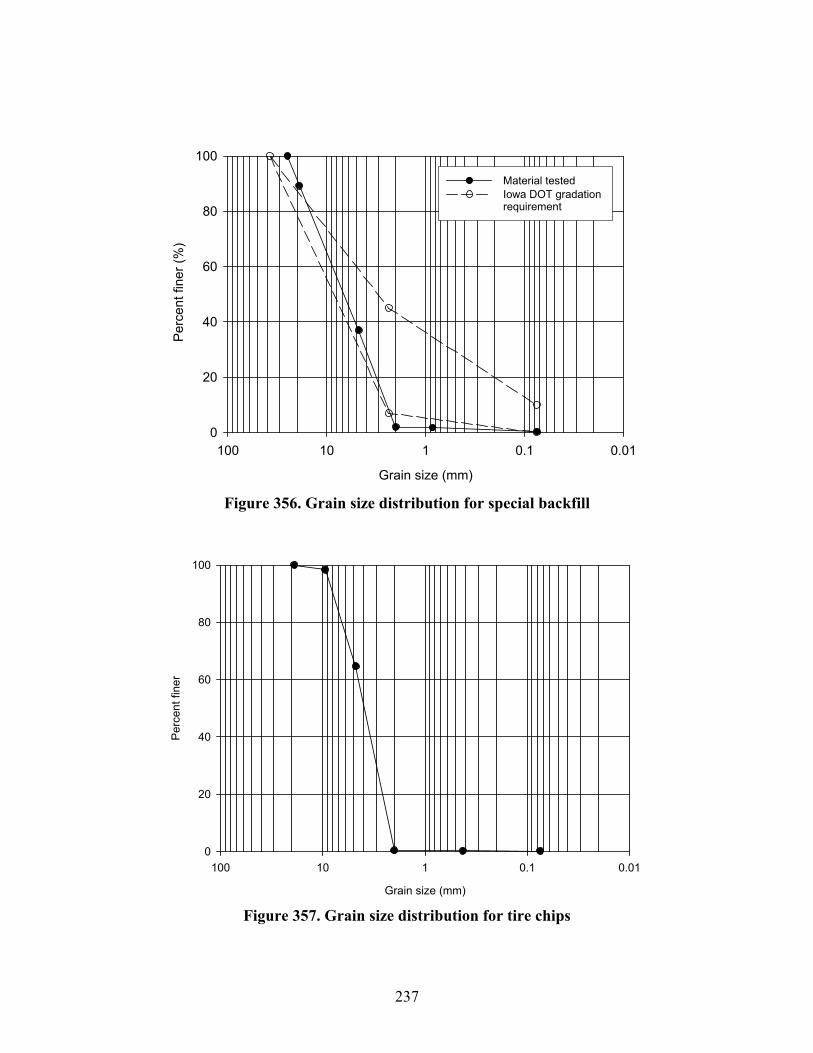
237
Grain size (mm)
0.010.1110100
Per
cent
fine
r (%
)
0
20
40
60
80
100
Material testedIowa DOT gradation requirement
Figure 356. Grain size distribution for special backfill
Grain size (mm)
0.010.1110100
Per
cent
fine
r
0
20
40
60
80
100
Figure 357. Grain size distribution for tire chips
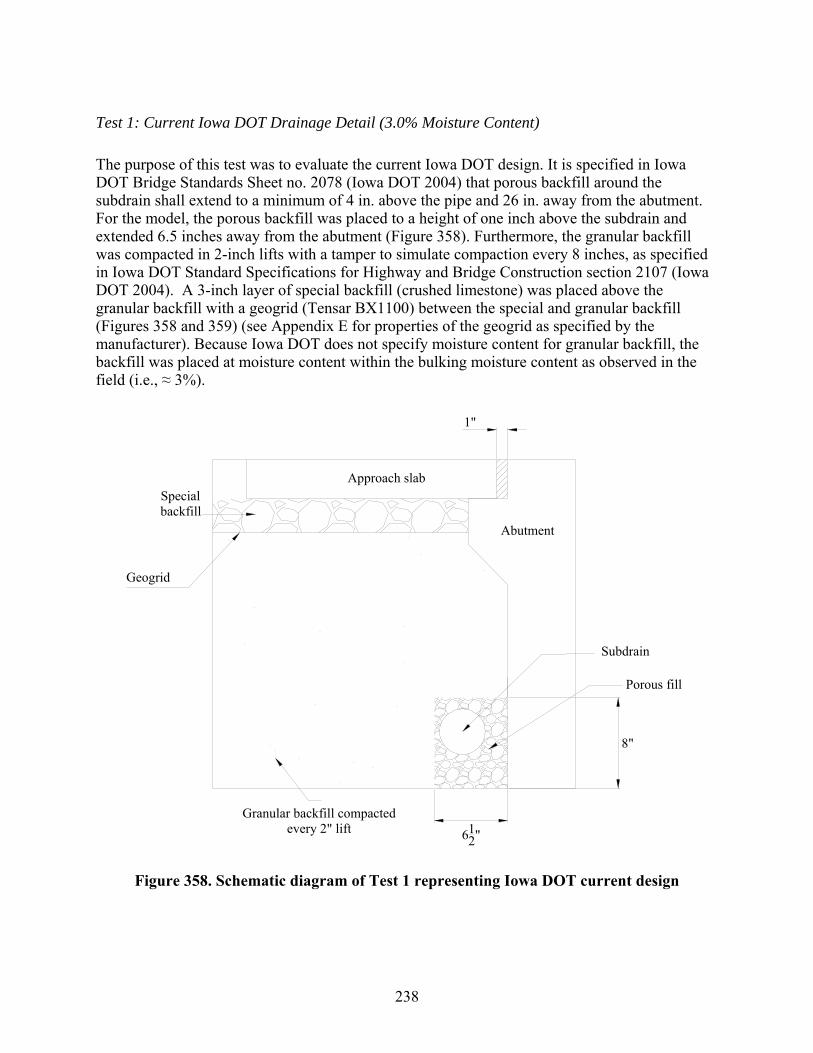
238
Test 1: Current Iowa DOT Drainage Detail (3.0% Moisture Content)
The purpose of this test was to evaluate the current Iowa DOT design. It is specified in Iowa DOT Bridge Standards Sheet no. 2078 (Iowa DOT 2004) that porous backfill around the subdrain shall extend to a minimum of 4 in. above the pipe and 26 in. away from the abutment. For the model, the porous backfill was placed to a height of one inch above the subdrain and extended 6.5 inches away from the abutment (Figure 358). Furthermore, the granular backfill was compacted in 2-inch lifts with a tamper to simulate compaction every 8 inches, as specified in Iowa DOT Standard Specifications for Highway and Bridge Construction section 2107 (Iowa DOT 2004). A 3-inch layer of special backfill (crushed limestone) was placed above the granular backfill with a geogrid (Tensar BX1100) between the special and granular backfill (Figures 358 and 359) (see Appendix E for properties of the geogrid as specified by the manufacturer). Because Iowa DOT does not specify moisture content for granular backfill, the backfill was placed at moisture content within the bulking moisture content as observed in the field (i.e., ≈ 3%).
Porous fill
Subdrain
Approach slab
Granular backfill compactedevery 2" lift
1"
Abutment
8"
612"
Geogrid
Specialbackfill
Figure 358. Schematic diagram of Test 1 representing Iowa DOT current design

239
Figure 359. Geogrid placed between the granular and special backfill
Water began to flow out of the subdrain after 10 minutes of introducing water through the expansion joint. Initially, fine soil particles were observed in the water. After 15 minutes, the water became clear. Table 25 summarizes the results of this test. The maximum achieved steady state flow was 32cm3/sec. A void developed at the abutment that measured 4.5 inches deep and extended through the full width of the approach slab. The maximum differential settlement was 2 inches (Figures 360 and 361). An interesting observation is that water only entered the drain tile from the bottom perforations. One might expect water to enter from the top and bottom perforations. A possible explanation of why water only entered from the bottom is that the soil particles plugged the voids of the porous backfill and/or the pipe openings.
Table 25. Summary of Test 1 results
Backfill type Granular backfill with porous fill around subdrain and special backfill under the approach slab
Moisture content 3.0 % Compaction By tamper every 2 in. lift
Left side: 2.0 in. Settlement (in)
Right side: 1.5 in. Left side: 4.5 in. deep at the abutment face and
extending 8.5 in. under the approach slab Void (in) Right side: 3.5 in. deep at the abutment face and extending 9.0 in. under the approach slab
Maximum steady state flow (cm3/sec) 32.0
Time for water to drain (min) 10

240
(a) Front view (b) Side view
Figure 360. Level of bridge approach before the test
(a) Front view (b) Side view
Figure 361. Level of approach after the test
Test 2: Current Iowa DOT Drainage Detail with Saturated Granular Backfill
The purpose of this test was to observe the effect granular backfill at a high water content on approach slab settlement, void development, and steady flow rate. The granular backfill was placed at a moisture content of 12.6% and lifts were compacted every 2 inches using a tamper. This moisture content was used based on the results of Collapse Index Test performed on granular backfill where no collapse was observed at moisture content between 8% and 12% (see section discussing Characteristics of Backfill Materials). The current Iowa DOT design detail was used, as shown in Figure 362 (see setup of test 1).

241
Figure 362. Placing special backfill over geogrid
Water began to drain after 12 minutes from initiating the test. Initially, fine soil particles were washed out with water. After 17 minutes, the water became clear. Table 26 summarizes the results from this test. Compaction of the granular backfill at high water content significantly reduced the bridge approach settlement and void formation (Figures 363 and 364). However, the maximum achieved steady state flow did not change at 31 cm3/sec. Water was again observed seeping into the subdrain from the bottom perforation and not the top.
Table 26 . Summary of Test 2 results
Backfill type Granular backfill with porous fill around subdrain and special backfill under the approach slab
Moisture content 12.6 % Compaction By tamper every 2 in. lift
No settlement Settlement (in)
No settlement None
Void (in) None
Maximum steady state flow (cm3/sec) 31
Time for water to drain (min) 12
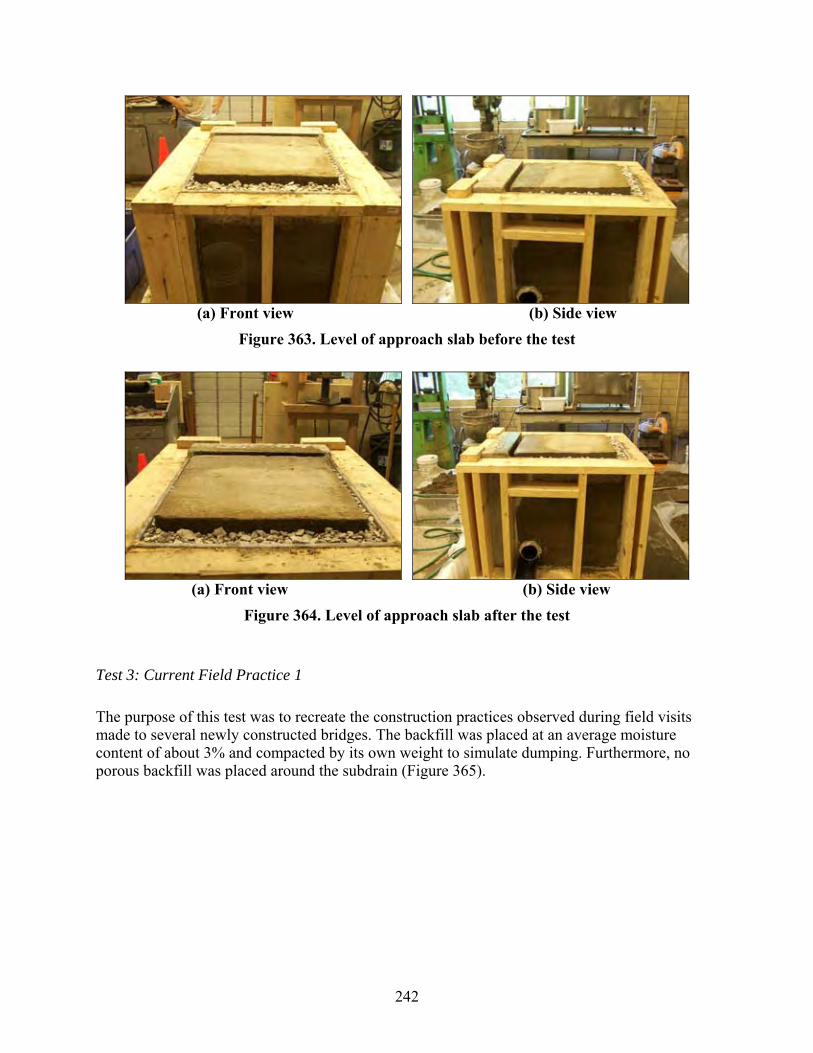
242
(a) Front view (b) Side view
Figure 363. Level of approach slab before the test
(a) Front view (b) Side view
Figure 364. Level of approach slab after the test
Test 3: Current Field Practice 1
The purpose of this test was to recreate the construction practices observed during field visits made to several newly constructed bridges. The backfill was placed at an average moisture content of about 3% and compacted by its own weight to simulate dumping. Furthermore, no porous backfill was placed around the subdrain (Figure 365).
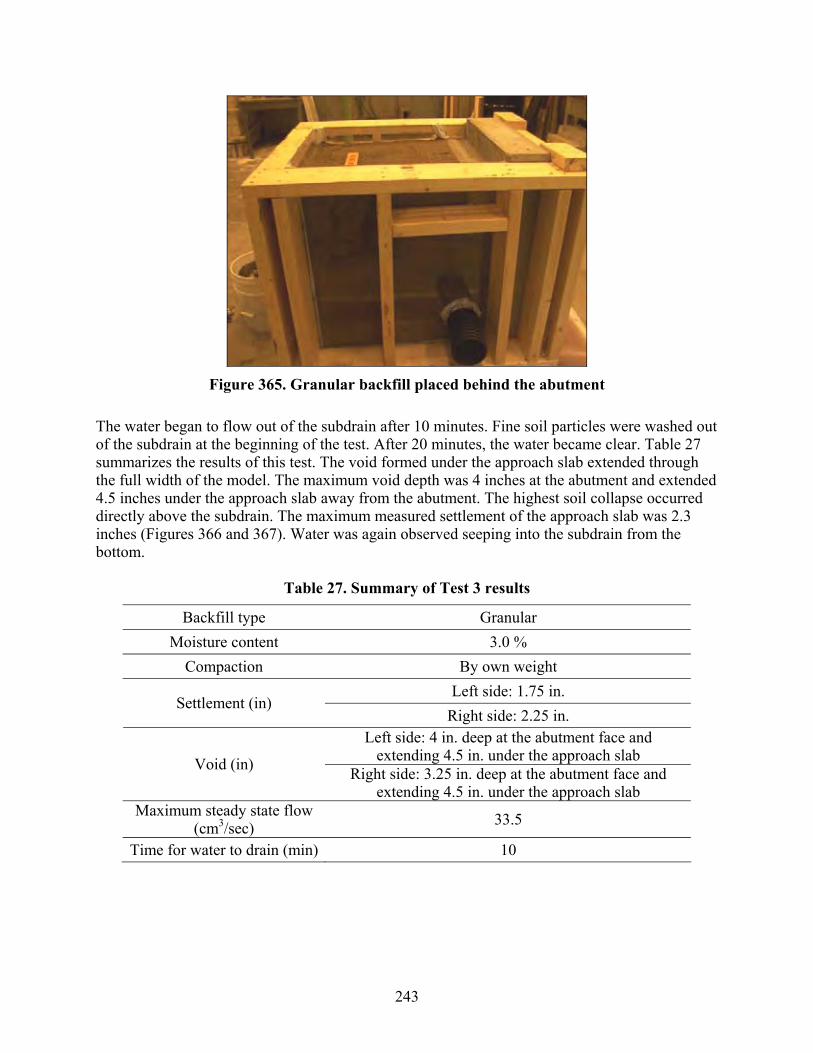
243
Figure 365. Granular backfill placed behind the abutment
The water began to flow out of the subdrain after 10 minutes. Fine soil particles were washed out of the subdrain at the beginning of the test. After 20 minutes, the water became clear. Table 27 summarizes the results of this test. The void formed under the approach slab extended through the full width of the model. The maximum void depth was 4 inches at the abutment and extended 4.5 inches under the approach slab away from the abutment. The highest soil collapse occurred directly above the subdrain. The maximum measured settlement of the approach slab was 2.3 inches (Figures 366 and 367). Water was again observed seeping into the subdrain from the bottom.
Table 27. Summary of Test 3 results
Backfill type Granular Moisture content 3.0 %
Compaction By own weight Left side: 1.75 in.
Settlement (in) Right side: 2.25 in.
Left side: 4 in. deep at the abutment face and extending 4.5 in. under the approach slab Void (in) Right side: 3.25 in. deep at the abutment face and extending 4.5 in. under the approach slab
Maximum steady state flow (cm3/sec) 33.5
Time for water to drain (min) 10

244
(a) Front view (b) Side view
Figure 366. Level of bridge approach before the test
(a) Front view (b) Side view
Figure 367. Level of approach slab after the test
Test 4: Current Field Practice 2
The purpose of this test was to simulate field practice observed at two different newly constructed bridges. In both cases, porous backfill was used around the subdrain, but the granular backfill was placed at the bulking moisture content. The porous backfill was placed to a height of 1 inch above the drainage pipe and extended 6.5 inches away from the abutment (Figure 368). Granular backfill was placed at a moisture content of 5.5 %. The backfill material was compacted by its own weight to simulate dumping the backfill behind the abutment.
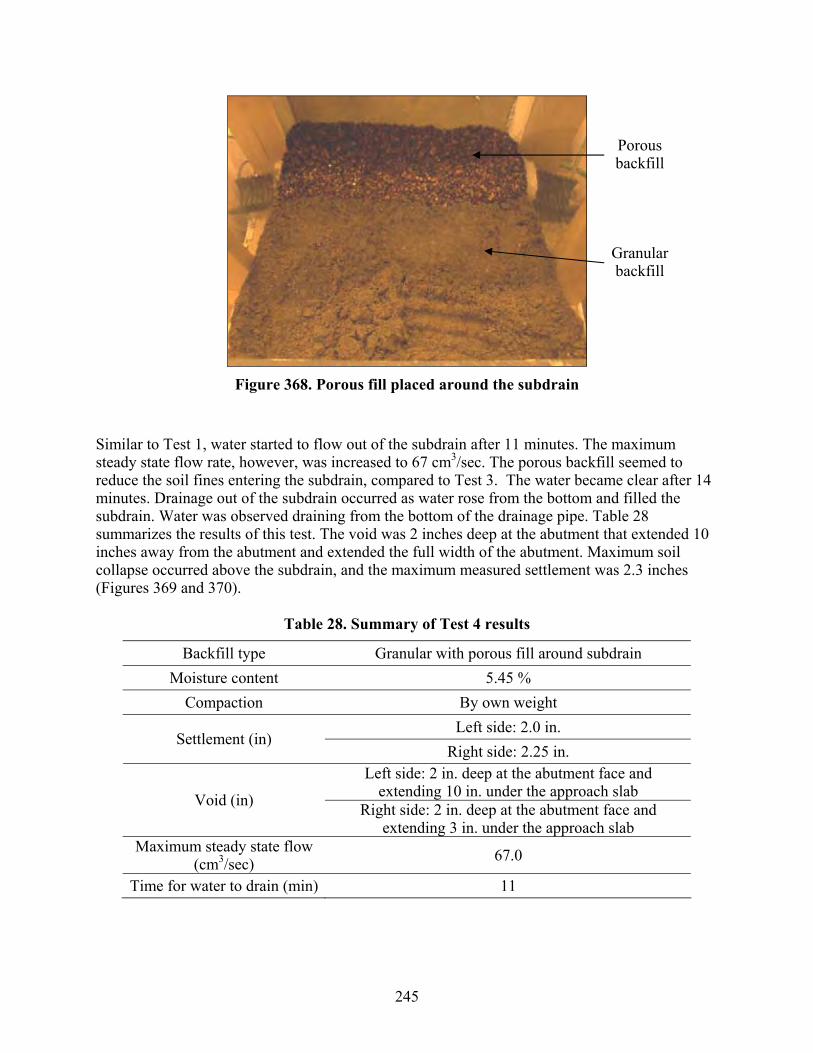
245
Figure 368. Porous fill placed around the subdrain
Similar to Test 1, water started to flow out of the subdrain after 11 minutes. The maximum steady state flow rate, however, was increased to 67 cm3/sec. The porous backfill seemed to reduce the soil fines entering the subdrain, compared to Test 3. The water became clear after 14 minutes. Drainage out of the subdrain occurred as water rose from the bottom and filled the subdrain. Water was observed draining from the bottom of the drainage pipe. Table 28 summarizes the results of this test. The void was 2 inches deep at the abutment that extended 10 inches away from the abutment and extended the full width of the abutment. Maximum soil collapse occurred above the subdrain, and the maximum measured settlement was 2.3 inches (Figures 369 and 370).
Table 28. Summary of Test 4 results
Backfill type Granular with porous fill around subdrain Moisture content 5.45 %
Compaction By own weight Left side: 2.0 in.
Settlement (in) Right side: 2.25 in.
Left side: 2 in. deep at the abutment face and extending 10 in. under the approach slab Void (in) Right side: 2 in. deep at the abutment face and extending 3 in. under the approach slab
Maximum steady state flow (cm3/sec) 67.0
Time for water to drain (min) 11
Porous backfill
Granular backfill
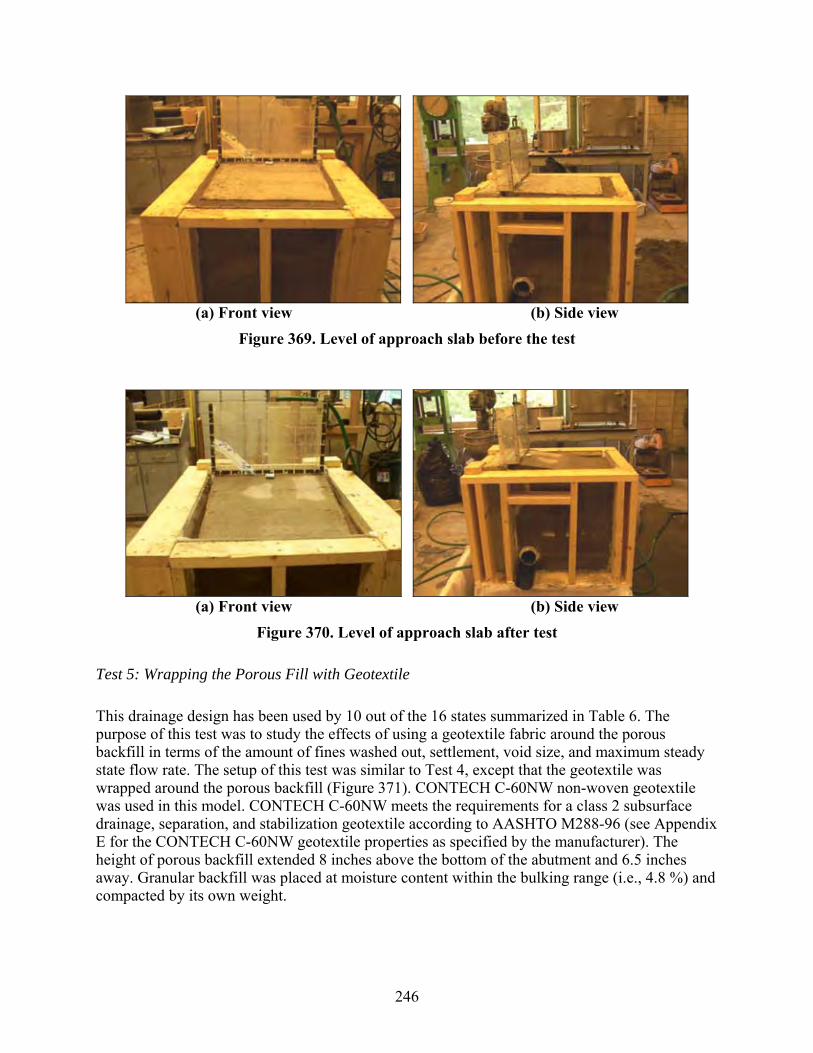
246
(a) Front view (b) Side view
Figure 369. Level of approach slab before the test
(a) Front view (b) Side view
Figure 370. Level of approach slab after test
Test 5: Wrapping the Porous Fill with Geotextile
This drainage design has been used by 10 out of the 16 states summarized in Table 6. The purpose of this test was to study the effects of using a geotextile fabric around the porous backfill in terms of the amount of fines washed out, settlement, void size, and maximum steady state flow rate. The setup of this test was similar to Test 4, except that the geotextile was wrapped around the porous backfill (Figure 371). CONTECH C-60NW non-woven geotextile was used in this model. CONTECH C-60NW meets the requirements for a class 2 subsurface drainage, separation, and stabilization geotextile according to AASHTO M288-96 (see Appendix E for the CONTECH C-60NW geotextile properties as specified by the manufacturer). The height of porous backfill extended 8 inches above the bottom of the abutment and 6.5 inches away. Granular backfill was placed at moisture content within the bulking range (i.e., 4.8 %) and compacted by its own weight.
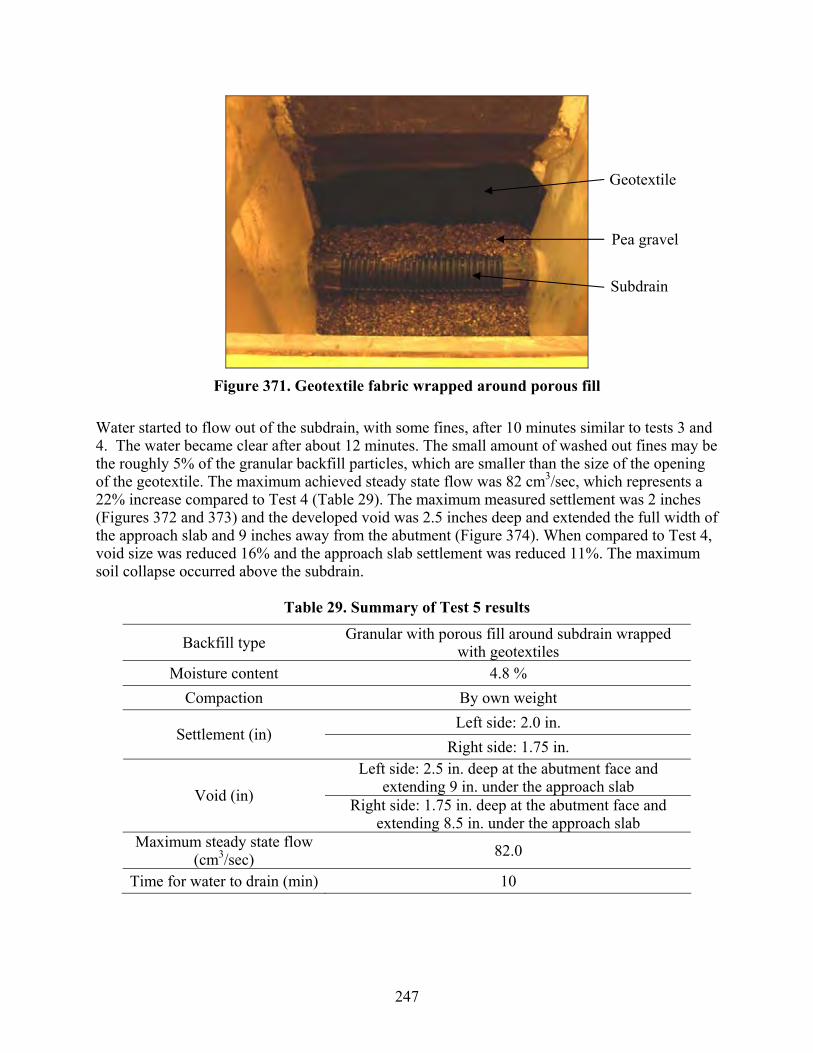
247
Figure 371. Geotextile fabric wrapped around porous fill
Water started to flow out of the subdrain, with some fines, after 10 minutes similar to tests 3 and 4. The water became clear after about 12 minutes. The small amount of washed out fines may be the roughly 5% of the granular backfill particles, which are smaller than the size of the opening of the geotextile. The maximum achieved steady state flow was 82 cm3/sec, which represents a 22% increase compared to Test 4 (Table 29). The maximum measured settlement was 2 inches (Figures 372 and 373) and the developed void was 2.5 inches deep and extended the full width of the approach slab and 9 inches away from the abutment (Figure 374). When compared to Test 4, void size was reduced 16% and the approach slab settlement was reduced 11%. The maximum soil collapse occurred above the subdrain.
Table 29. Summary of Test 5 results
Backfill type Granular with porous fill around subdrain wrapped with geotextiles
Moisture content 4.8 % Compaction By own weight
Left side: 2.0 in. Settlement (in)
Right side: 1.75 in. Left side: 2.5 in. deep at the abutment face and
extending 9 in. under the approach slab Void (in) Right side: 1.75 in. deep at the abutment face and extending 8.5 in. under the approach slab
Maximum steady state flow (cm3/sec) 82.0
Time for water to drain (min) 10
Subdrain
Pea gravel
Geotextile
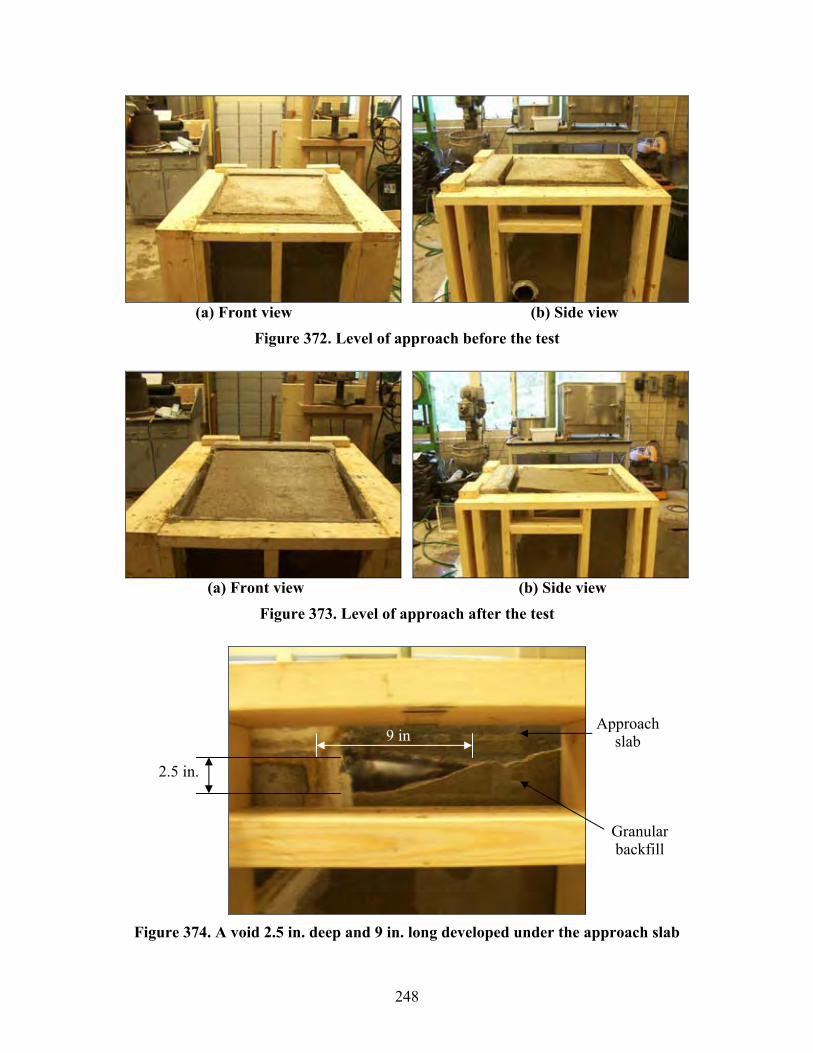
248
(a) Front view (b) Side view
Figure 372. Level of approach before the test
(a) Front view (b) Side view
Figure 373. Level of approach after the test
Figure 374. A void 2.5 in. deep and 9 in. long developed under the approach slab
9 in.
2.5 in.
Approach slab
Granular backfill
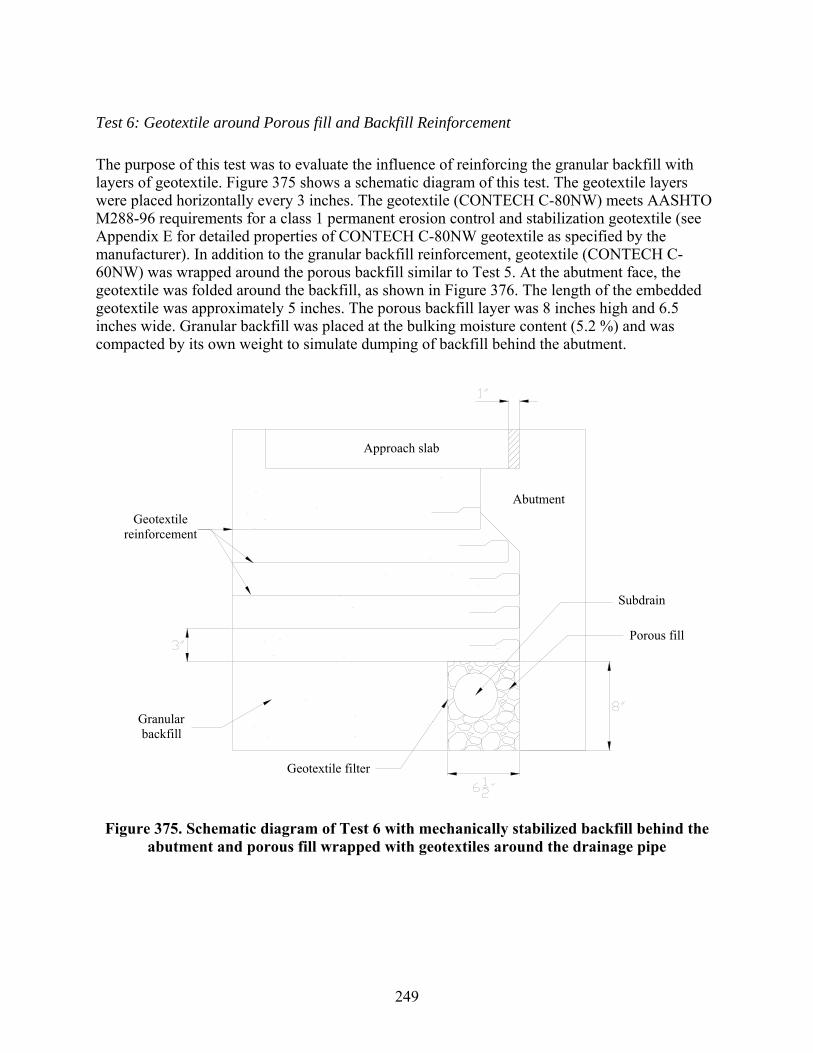
249
Test 6: Geotextile around Porous fill and Backfill Reinforcement
The purpose of this test was to evaluate the influence of reinforcing the granular backfill with layers of geotextile. Figure 375 shows a schematic diagram of this test. The geotextile layers were placed horizontally every 3 inches. The geotextile (CONTECH C-80NW) meets AASHTO M288-96 requirements for a class 1 permanent erosion control and stabilization geotextile (see Appendix E for detailed properties of CONTECH C-80NW geotextile as specified by the manufacturer). In addition to the granular backfill reinforcement, geotextile (CONTECH C-60NW) was wrapped around the porous backfill similar to Test 5. At the abutment face, the geotextile was folded around the backfill, as shown in Figure 376. The length of the embedded geotextile was approximately 5 inches. The porous backfill layer was 8 inches high and 6.5 inches wide. Granular backfill was placed at the bulking moisture content (5.2 %) and was compacted by its own weight to simulate dumping of backfill behind the abutment.
Porous fill
Subdrain
Approach slab
Granular backfill
Geotextile reinforcement
Geotextile filter
Abutment
Figure 375. Schematic diagram of Test 6 with mechanically stabilized backfill behind the abutment and porous fill wrapped with geotextiles around the drainage pipe
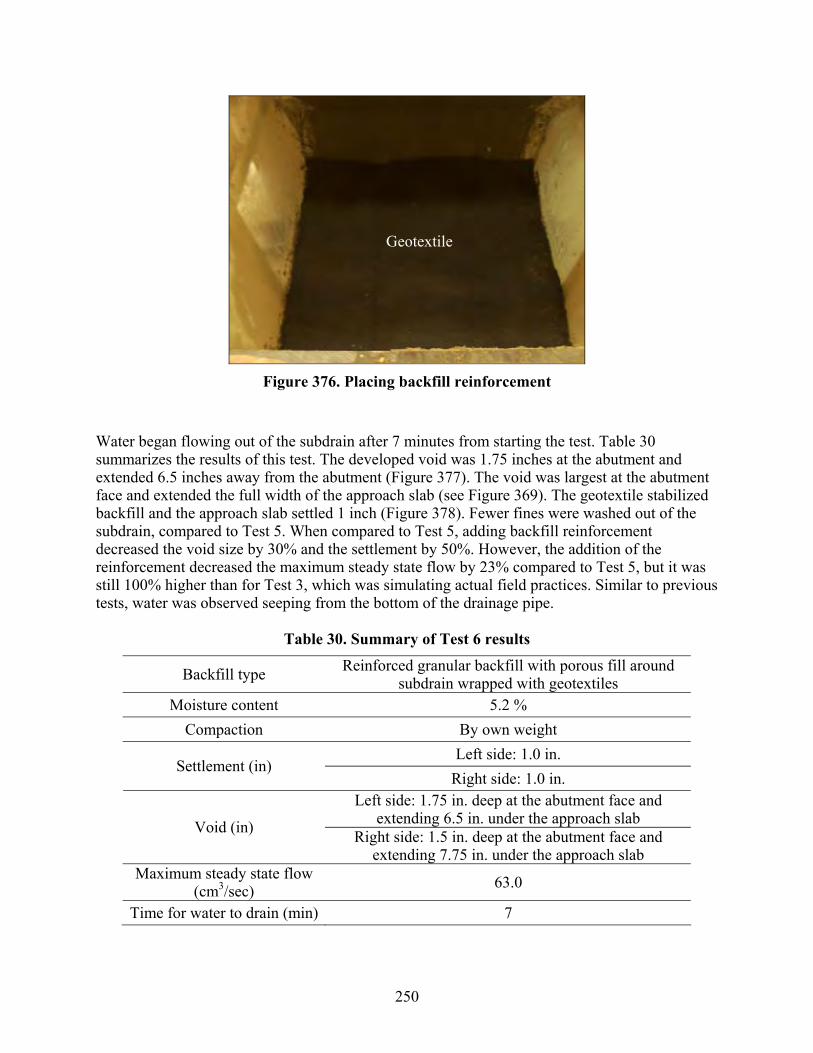
250
Figure 376. Placing backfill reinforcement
Water began flowing out of the subdrain after 7 minutes from starting the test. Table 30 summarizes the results of this test. The developed void was 1.75 inches at the abutment and extended 6.5 inches away from the abutment (Figure 377). The void was largest at the abutment face and extended the full width of the approach slab (see Figure 369). The geotextile stabilized backfill and the approach slab settled 1 inch (Figure 378). Fewer fines were washed out of the subdrain, compared to Test 5. When compared to Test 5, adding backfill reinforcement decreased the void size by 30% and the settlement by 50%. However, the addition of the reinforcement decreased the maximum steady state flow by 23% compared to Test 5, but it was still 100% higher than for Test 3, which was simulating actual field practices. Similar to previous tests, water was observed seeping from the bottom of the drainage pipe.
Table 30. Summary of Test 6 results
Backfill type Reinforced granular backfill with porous fill around subdrain wrapped with geotextiles
Moisture content 5.2 % Compaction By own weight
Left side: 1.0 in. Settlement (in)
Right side: 1.0 in. Left side: 1.75 in. deep at the abutment face and
extending 6.5 in. under the approach slab Void (in) Right side: 1.5 in. deep at the abutment face and extending 7.75 in. under the approach slab
Maximum steady state flow (cm3/sec) 63.0
Time for water to drain (min) 7
Geotextile
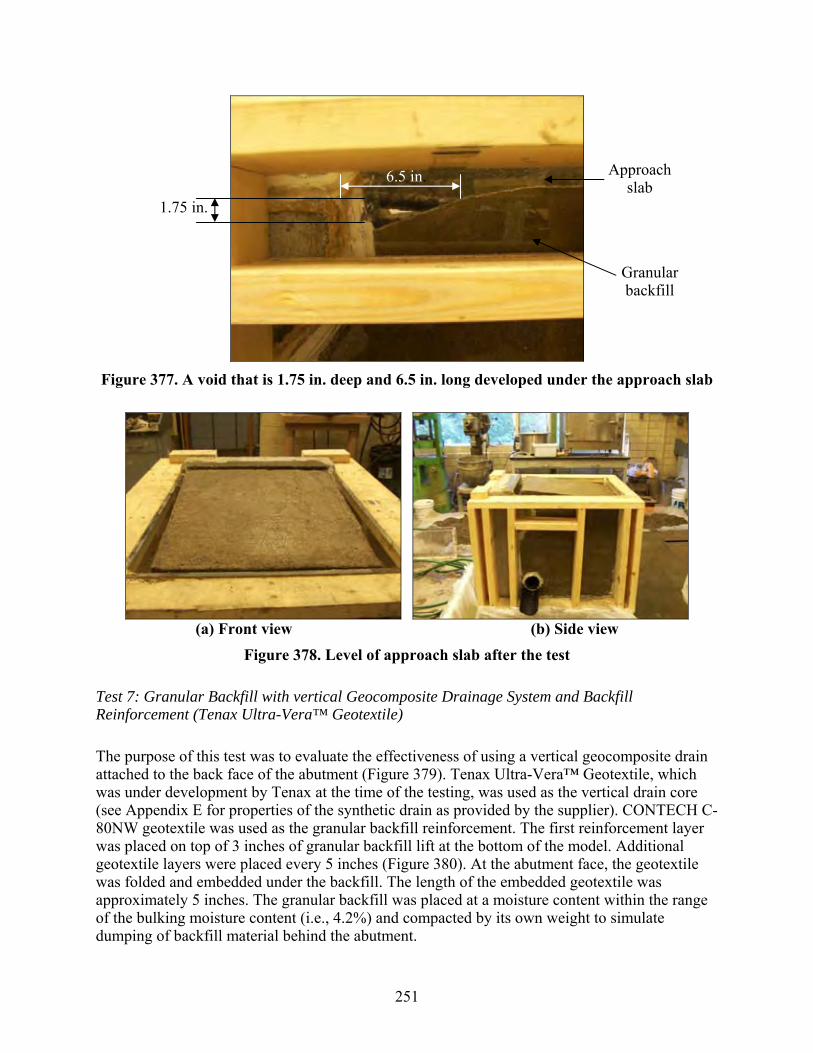
251
Figure 377. A void that is 1.75 in. deep and 6.5 in. long developed under the approach slab
(a) Front view (b) Side view
Figure 378. Level of approach slab after the test
Test 7: Granular Backfill with vertical Geocomposite Drainage System and Backfill Reinforcement (Tenax Ultra-Vera™ Geotextile)
The purpose of this test was to evaluate the effectiveness of using a vertical geocomposite drain attached to the back face of the abutment (Figure 379). Tenax Ultra-Vera™ Geotextile, which was under development by Tenax at the time of the testing, was used as the vertical drain core (see Appendix E for properties of the synthetic drain as provided by the supplier). CONTECH C-80NW geotextile was used as the granular backfill reinforcement. The first reinforcement layer was placed on top of 3 inches of granular backfill lift at the bottom of the model. Additional geotextile layers were placed every 5 inches (Figure 380). At the abutment face, the geotextile was folded and embedded under the backfill. The length of the embedded geotextile was approximately 5 inches. The granular backfill was placed at a moisture content within the range of the bulking moisture content (i.e., 4.2%) and compacted by its own weight to simulate dumping of backfill material behind the abutment.
6.5 in.
1.75 in.
Approach slab
Granular backfill
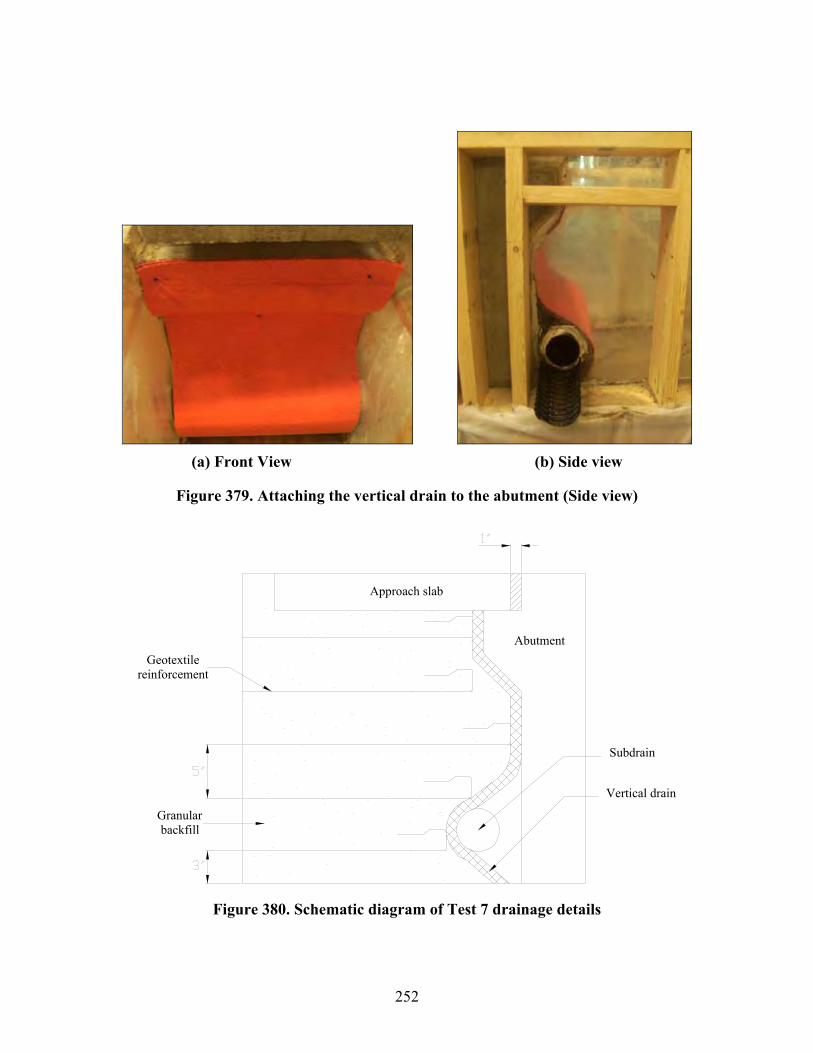
252
(a) Front View (b) Side view
Figure 379. Attaching the vertical drain to the abutment (Side view)
AbutmentGeotextile
reinforcement
Granular backfill
Approach slab
Subdrain
Vertical drain
Figure 380. Schematic diagram of Test 7 drainage details
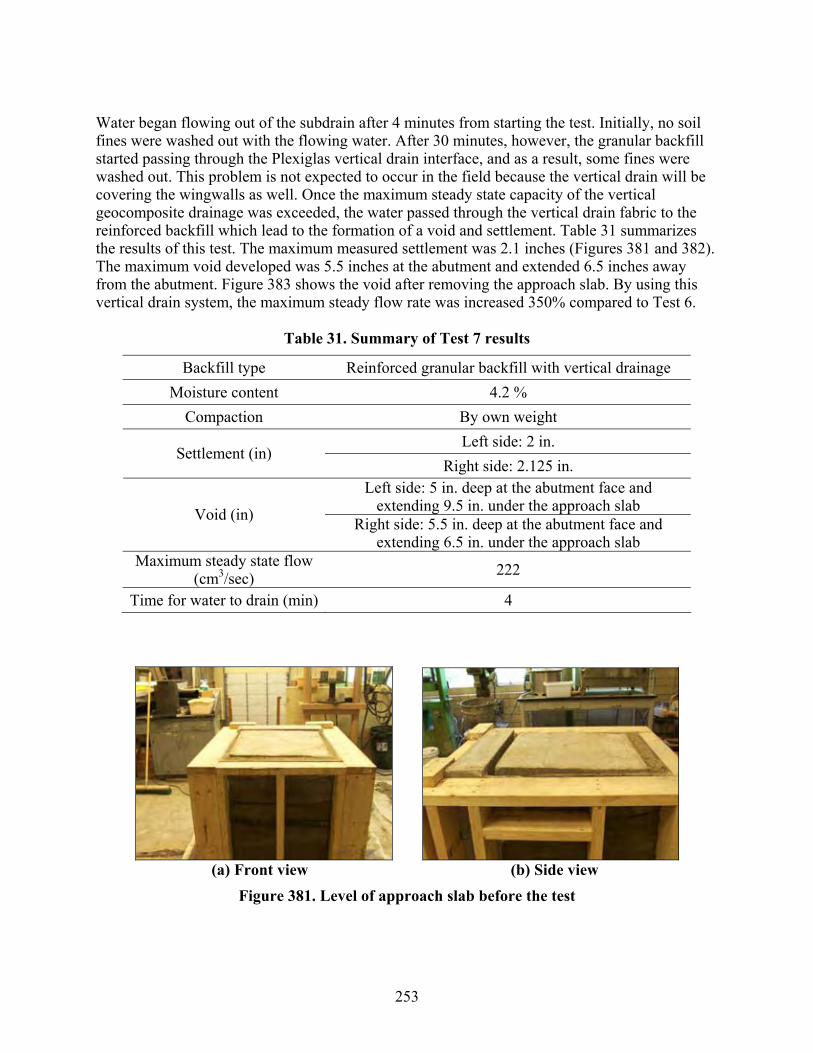
253
Water began flowing out of the subdrain after 4 minutes from starting the test. Initially, no soil fines were washed out with the flowing water. After 30 minutes, however, the granular backfill started passing through the Plexiglas vertical drain interface, and as a result, some fines were washed out. This problem is not expected to occur in the field because the vertical drain will be covering the wingwalls as well. Once the maximum steady state capacity of the vertical geocomposite drainage was exceeded, the water passed through the vertical drain fabric to the reinforced backfill which lead to the formation of a void and settlement. Table 31 summarizes the results of this test. The maximum measured settlement was 2.1 inches (Figures 381 and 382). The maximum void developed was 5.5 inches at the abutment and extended 6.5 inches away from the abutment. Figure 383 shows the void after removing the approach slab. By using this vertical drain system, the maximum steady flow rate was increased 350% compared to Test 6.
Table 31. Summary of Test 7 results
Backfill type Reinforced granular backfill with vertical drainage Moisture content 4.2 %
Compaction By own weight Left side: 2 in.
Settlement (in) Right side: 2.125 in.
Left side: 5 in. deep at the abutment face and extending 9.5 in. under the approach slab Void (in) Right side: 5.5 in. deep at the abutment face and extending 6.5 in. under the approach slab
Maximum steady state flow (cm3/sec) 222
Time for water to drain (min) 4
(a) Front view (b) Side view
Figure 381. Level of approach slab before the test

254
(a) Front view (b) Side view
Figure 382. Level of approach slab after the test
Figure 383. Void developed under the approach slab
Test 8: Vertical Geocomposite Drainage System with Backfill Reinforcement (STRIPDRAIN 75)
The purpose of this test was to evaluate the performance of a vertical drainage system (STRIPDRAIN 75). According to the manufacturer, granular, well-graded backfill materials are the most suitable for this type of drainage system. The geocomposite drain consists of a HDPE polymer core that is ¾ in. thick and laminated with a non-woven, needle-punched geotextile (see Appendix E for detailed specifications provided by the supplier). The setup of this test was similar to Test 7 (Figure 384). Granular backfill was placed at moisture content within the bulking moisture range (i.e., 3.7%) and compacted by its own weight to simulate dumping of backfill material behind the abutment.

255
Figure 384. Attaching the geocomposite drain to the abutment
Water began flowing out of the subdrain after 1 minute from starting the test. No fines were washed out during the test. Similar to Test 7, once the maximum steady state flow (383 cm3/sec) of the geocomposite drain was exceeded, water started to overflow saturating the backfill, and as a result, settlement and void development were observed. The maximum approach slab settlement was 2.5 inches (Table 32), which is similar to the settlement observed in Test 7 (Figures 385 and 386). The void was 1.5 inches deep at the abutment and extended 4 inches away from the abutment. The void extended to the full width of the approach slab (Figure 387). The maximum steady state flow was 72% higher than the maximum steady state of the product used in Test 7, and the void was approximately 70% smaller. Similar to other tests, water was observed draining from the bottom of the drainage pipe.
Table 32. Summary of Test 8 results
Backfill type Reinforced granular backfill Moisture content 3.7 %
Compaction By own weight Left side: 2.25 in.
Settlement (in) Right side: 2.5 in.
Left side: 1.5 in. deep at the abutment face and extending 4 in. under the approach slab Void (in) Right side: 1.5 in. deep at the abutment face and
extending 4.5 in. under the approach slab Maximum steady state flow
(cm3/sec) 383
Time for water to drain (min) 1

256
(a) Front view (b) Side view
Figure 385. Level of approach slab before the test
(a) Front view (b) Side view
Figure 386. Level of approach slab after the test
Figure 387. Void developed under the approach slab
4 in.
1.5 in.
Approach slab
Granular backfill
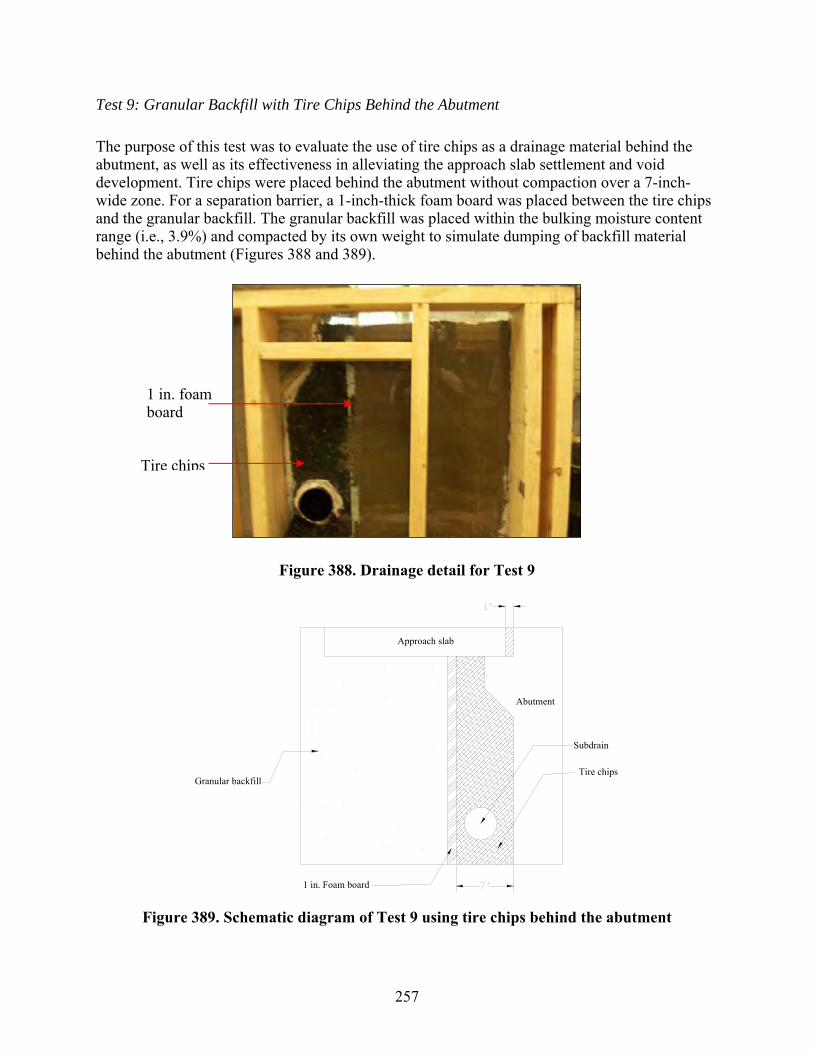
257
Test 9: Granular Backfill with Tire Chips Behind the Abutment
The purpose of this test was to evaluate the use of tire chips as a drainage material behind the abutment, as well as its effectiveness in alleviating the approach slab settlement and void development. Tire chips were placed behind the abutment without compaction over a 7-inch-wide zone. For a separation barrier, a 1-inch-thick foam board was placed between the tire chips and the granular backfill. The granular backfill was placed within the bulking moisture content range (i.e., 3.9%) and compacted by its own weight to simulate dumping of backfill material behind the abutment (Figures 388 and 389).
Figure 388. Drainage detail for Test 9
1 in. Foam board
Abutment
Granular backfill
Approach slab
Subdrain
Tire chips
Figure 389. Schematic diagram of Test 9 using tire chips behind the abutment
1 in. foam board
Tire chips
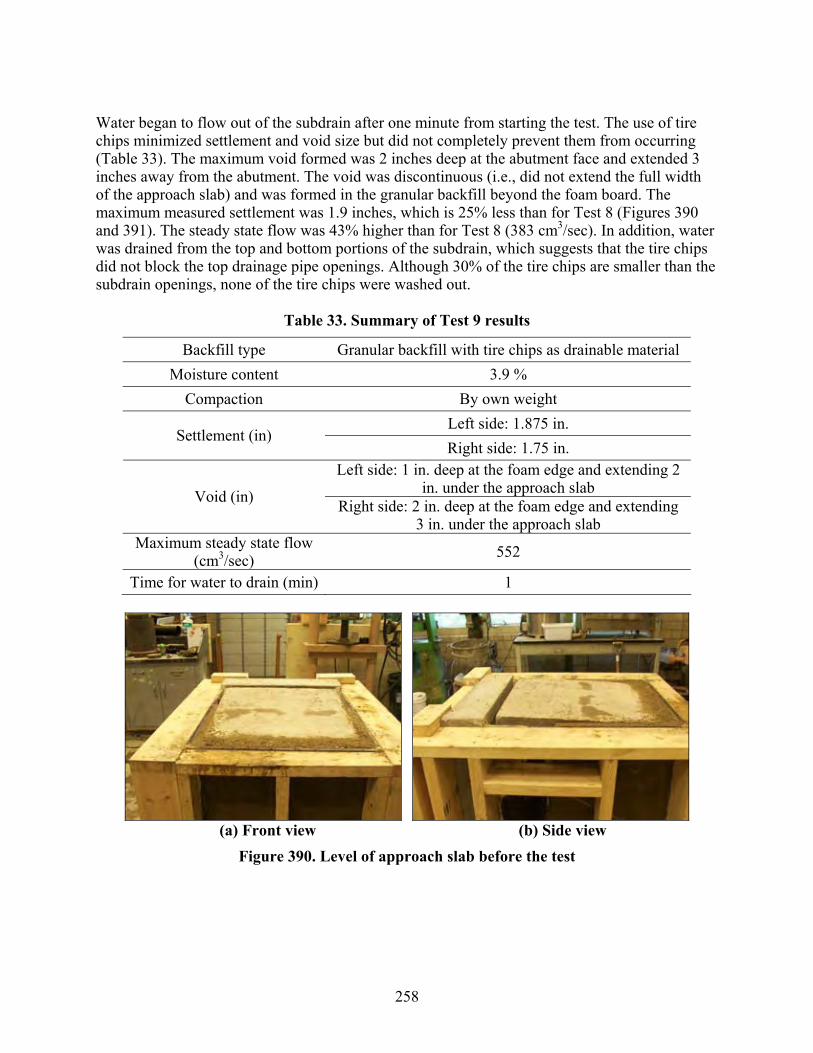
258
Water began to flow out of the subdrain after one minute from starting the test. The use of tire chips minimized settlement and void size but did not completely prevent them from occurring (Table 33). The maximum void formed was 2 inches deep at the abutment face and extended 3 inches away from the abutment. The void was discontinuous (i.e., did not extend the full width of the approach slab) and was formed in the granular backfill beyond the foam board. The maximum measured settlement was 1.9 inches, which is 25% less than for Test 8 (Figures 390 and 391). The steady state flow was 43% higher than for Test 8 (383 cm3/sec). In addition, water was drained from the top and bottom portions of the subdrain, which suggests that the tire chips did not block the top drainage pipe openings. Although 30% of the tire chips are smaller than the subdrain openings, none of the tire chips were washed out.
Table 33. Summary of Test 9 results
Backfill type Granular backfill with tire chips as drainable material Moisture content 3.9 %
Compaction By own weight Left side: 1.875 in.
Settlement (in) Right side: 1.75 in.
Left side: 1 in. deep at the foam edge and extending 2 in. under the approach slab Void (in) Right side: 2 in. deep at the foam edge and extending
3 in. under the approach slab Maximum steady state flow
(cm3/sec) 552
Time for water to drain (min) 1
(a) Front view (b) Side view
Figure 390. Level of approach slab before the test

259
(b) Front view (b) Side view
Figure 391. Level of approach slab after the test
Test 10: Using Tire Chips behind the Abutment with Soil Reinforcement
This test evaluated the effects of combining tire chips behind the abutment with granular backfill reinforced with geosynthetics on void size, approach slab settlement, and maximum steady state flow. Tire chips were placed behind the abutment without compaction over a 7-inch-wide zone with a 1-inch foam board used to separate the granular backfill from the tire chips (i.e., similar to Test 9). The first reinforcing geotextile layer was placed 3 inches from the bottom of the model. The subsequent layers were placed every 5 inches (Figures 392 and 393). The granular backfill was placed within the bulking moisture content range (i.e., 4.0%) and compacted by its own weight to simulate dumping of backfill material behind the abutment. The geotextile reinforcement was folded around the backfill at the foam board. The length of the folded geotextile (CONTECH C-80NW, see Appendix E for specifications) was approximately 5 in.
Geotextile reinforcement
1" Foam board
Abutment
Granular backfill
Approach slab
Subdrain
Tire chips
Figure 392. Using tire chips with soil reinforcement
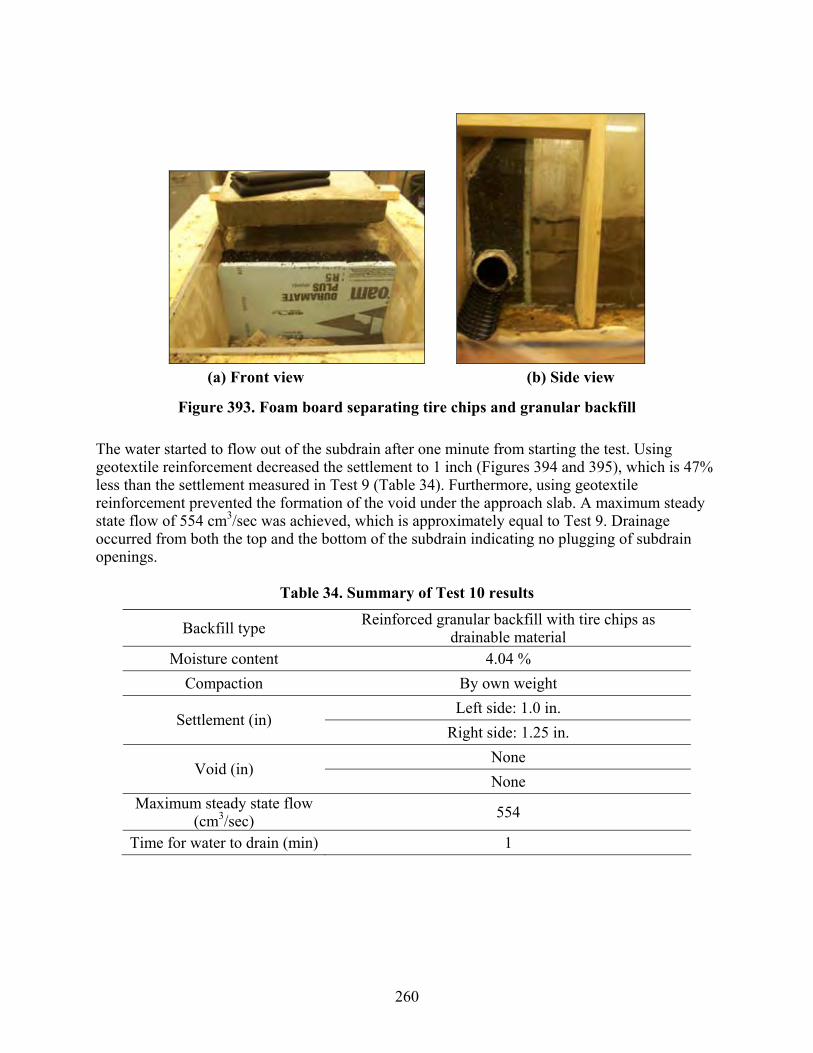
260
(a) Front view (b) Side view
Figure 393. Foam board separating tire chips and granular backfill
The water started to flow out of the subdrain after one minute from starting the test. Using geotextile reinforcement decreased the settlement to 1 inch (Figures 394 and 395), which is 47% less than the settlement measured in Test 9 (Table 34). Furthermore, using geotextile reinforcement prevented the formation of the void under the approach slab. A maximum steady state flow of 554 cm3/sec was achieved, which is approximately equal to Test 9. Drainage occurred from both the top and the bottom of the subdrain indicating no plugging of subdrain openings.
Table 34. Summary of Test 10 results
Backfill type Reinforced granular backfill with tire chips as drainable material
Moisture content 4.04 % Compaction By own weight
Left side: 1.0 in. Settlement (in)
Right side: 1.25 in. None
Void (in) None
Maximum steady state flow (cm3/sec) 554
Time for water to drain (min) 1

261
(a) Front view (b) Side view
Figure 394. Level of approach slab before the test
(a) Front view (b) Side view
Figure 395. Level of approach slab after the test
Test 11: Porous Backfill
The purpose of this test was to evaluate the use of porous backfill as a substitute for granular backfill behind the bridge abutment. This drainage detail was evaluated based on the good performance of porous fill (pea gravel) in the collapse index test. The pea gravel was placed at a moisture content of 4.6% and compacted by its own weight (Figures 396 and 397).
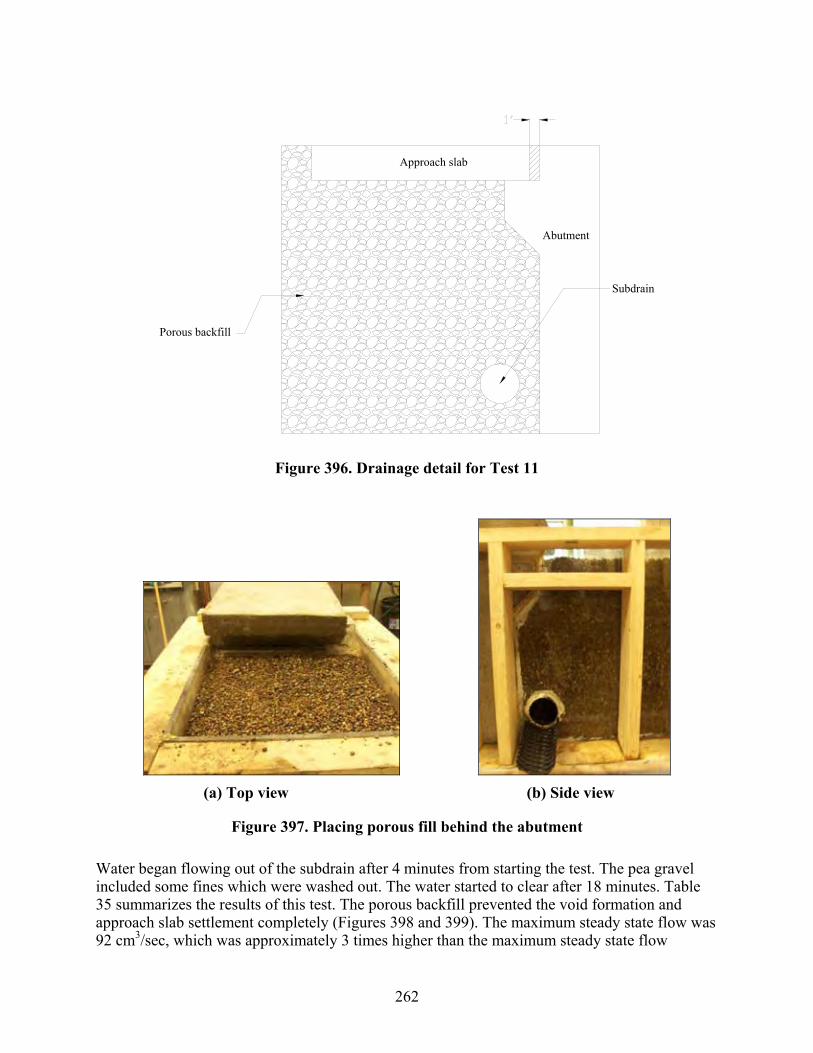
262
Abutment
Porous backfill
Approach slab
Subdrain
Figure 396. Drainage detail for Test 11
(a) Top view (b) Side view
Figure 397. Placing porous fill behind the abutment
Water began flowing out of the subdrain after 4 minutes from starting the test. The pea gravel included some fines which were washed out. The water started to clear after 18 minutes. Table 35 summarizes the results of this test. The porous backfill prevented the void formation and approach slab settlement completely (Figures 398 and 399). The maximum steady state flow was 92 cm3/sec, which was approximately 3 times higher than the maximum steady state flow
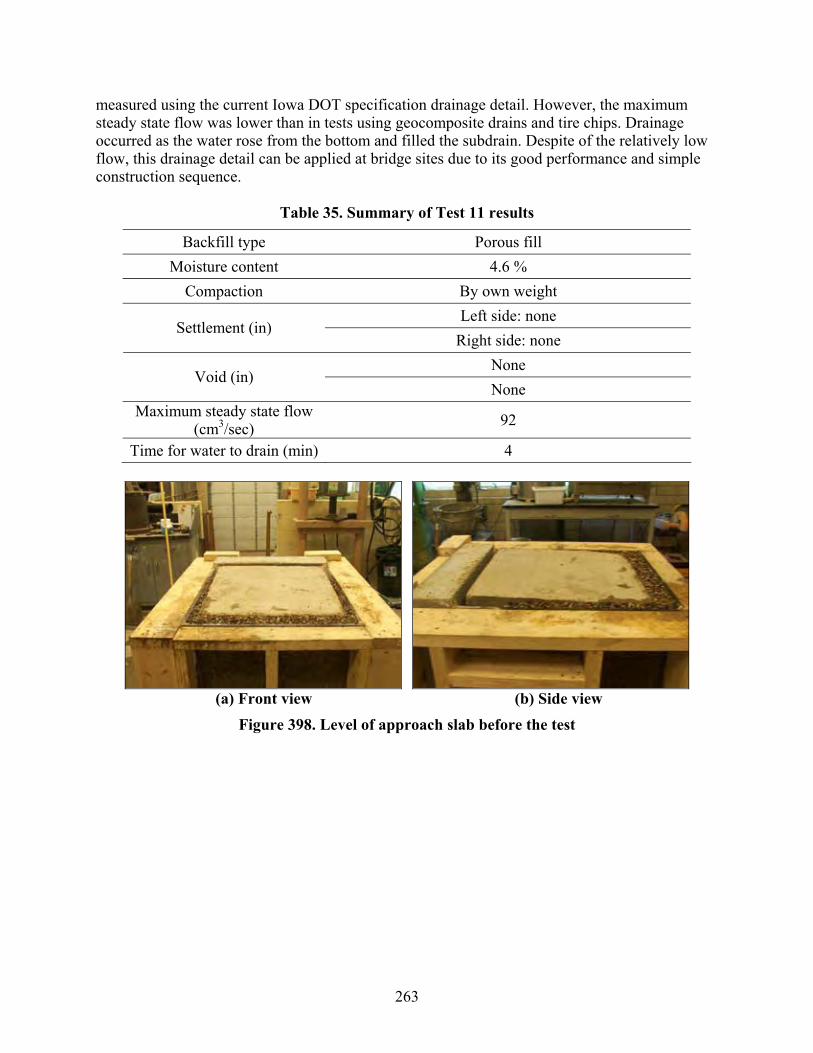
263
measured using the current Iowa DOT specification drainage detail. However, the maximum steady state flow was lower than in tests using geocomposite drains and tire chips. Drainage occurred as the water rose from the bottom and filled the subdrain. Despite of the relatively low flow, this drainage detail can be applied at bridge sites due to its good performance and simple construction sequence.
Table 35. Summary of Test 11 results
Backfill type Porous fill Moisture content 4.6 %
Compaction By own weight Left side: none
Settlement (in) Right side: none
None Void (in)
None Maximum steady state flow
(cm3/sec) 92
Time for water to drain (min) 4
(a) Front view (b) Side view
Figure 398. Level of approach slab before the test
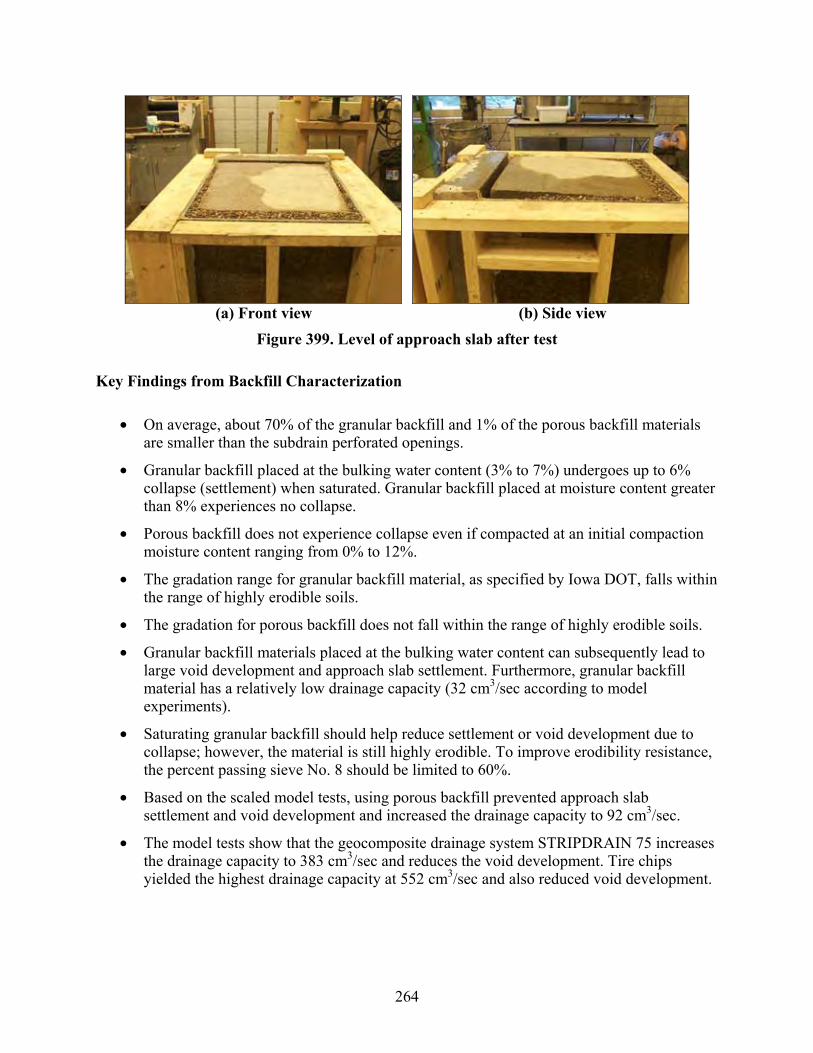
264
(a) Front view (b) Side view
Figure 399. Level of approach slab after test
Key Findings from Backfill Characterization
• On average, about 70% of the granular backfill and 1% of the porous backfill materials are smaller than the subdrain perforated openings.
• Granular backfill placed at the bulking water content (3% to 7%) undergoes up to 6% collapse (settlement) when saturated. Granular backfill placed at moisture content greater than 8% experiences no collapse.
• Porous backfill does not experience collapse even if compacted at an initial compaction moisture content ranging from 0% to 12%.
• The gradation range for granular backfill material, as specified by Iowa DOT, falls within the range of highly erodible soils.
• The gradation for porous backfill does not fall within the range of highly erodible soils.
• Granular backfill materials placed at the bulking water content can subsequently lead to large void development and approach slab settlement. Furthermore, granular backfill material has a relatively low drainage capacity (32 cm3/sec according to model experiments).
• Saturating granular backfill should help reduce settlement or void development due to collapse; however, the material is still highly erodible. To improve erodibility resistance, the percent passing sieve No. 8 should be limited to 60%.
• Based on the scaled model tests, using porous backfill prevented approach slab settlement and void development and increased the drainage capacity to 92 cm3/sec.
• The model tests show that the geocomposite drainage system STRIPDRAIN 75 increases the drainage capacity to 383 cm3/sec and reduces the void development. Tire chips yielded the highest drainage capacity at 552 cm3/sec and also reduced void development.
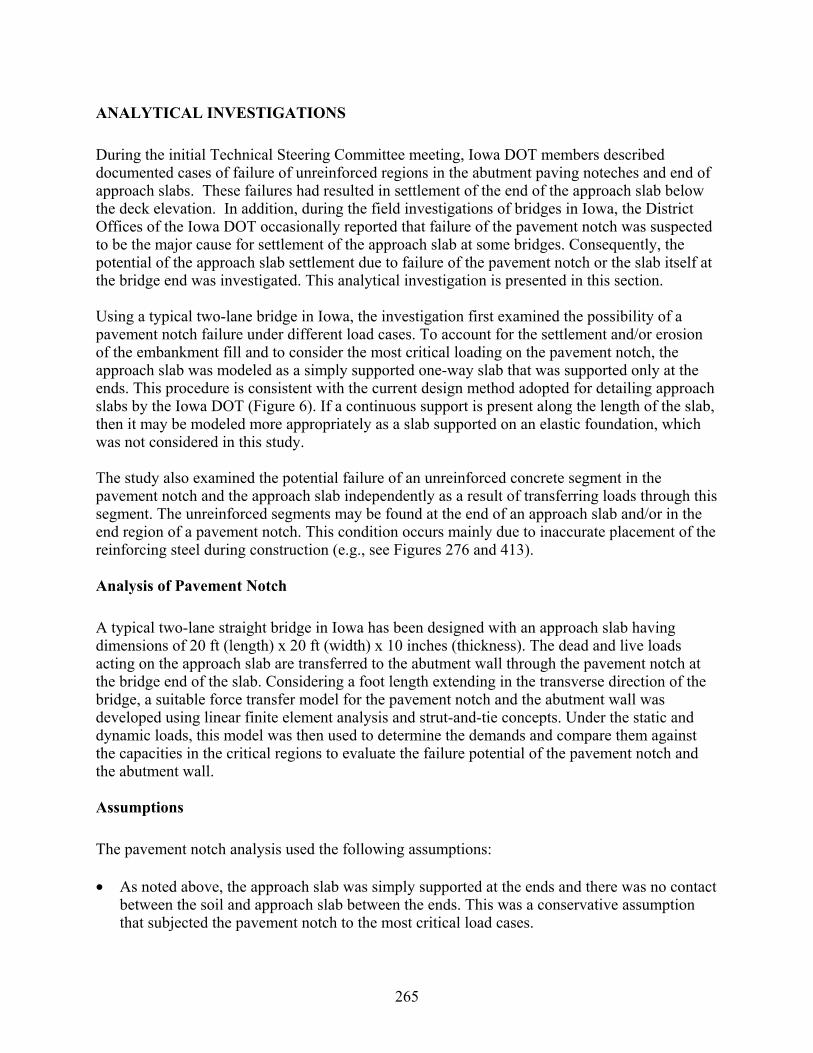
265
ANALYTICAL INVESTIGATIONS
During the initial Technical Steering Committee meeting, Iowa DOT members described documented cases of failure of unreinforced regions in the abutment paving noteches and end of approach slabs. These failures had resulted in settlement of the end of the approach slab below the deck elevation. In addition, during the field investigations of bridges in Iowa, the District Offices of the Iowa DOT occasionally reported that failure of the pavement notch was suspected to be the major cause for settlement of the approach slab at some bridges. Consequently, the potential of the approach slab settlement due to failure of the pavement notch or the slab itself at the bridge end was investigated. This analytical investigation is presented in this section. Using a typical two-lane bridge in Iowa, the investigation first examined the possibility of a pavement notch failure under different load cases. To account for the settlement and/or erosion of the embankment fill and to consider the most critical loading on the pavement notch, the approach slab was modeled as a simply supported one-way slab that was supported only at the ends. This procedure is consistent with the current design method adopted for detailing approach slabs by the Iowa DOT (Figure 6). If a continuous support is present along the length of the slab, then it may be modeled more appropriately as a slab supported on an elastic foundation, which was not considered in this study. The study also examined the potential failure of an unreinforced concrete segment in the pavement notch and the approach slab independently as a result of transferring loads through this segment. The unreinforced segments may be found at the end of an approach slab and/or in the end region of a pavement notch. This condition occurs mainly due to inaccurate placement of the reinforcing steel during construction (e.g., see Figures 276 and 413). Analysis of Pavement Notch
A typical two-lane straight bridge in Iowa has been designed with an approach slab having dimensions of 20 ft (length) x 20 ft (width) x 10 inches (thickness). The dead and live loads acting on the approach slab are transferred to the abutment wall through the pavement notch at the bridge end of the slab. Considering a foot length extending in the transverse direction of the bridge, a suitable force transfer model for the pavement notch and the abutment wall was developed using linear finite element analysis and strut-and-tie concepts. Under the static and dynamic loads, this model was then used to determine the demands and compare them against the capacities in the critical regions to evaluate the failure potential of the pavement notch and the abutment wall. Assumptions
The pavement notch analysis used the following assumptions: • As noted above, the approach slab was simply supported at the ends and there was no contact
between the soil and approach slab between the ends. This was a conservative assumption that subjected the pavement notch to the most critical load cases.
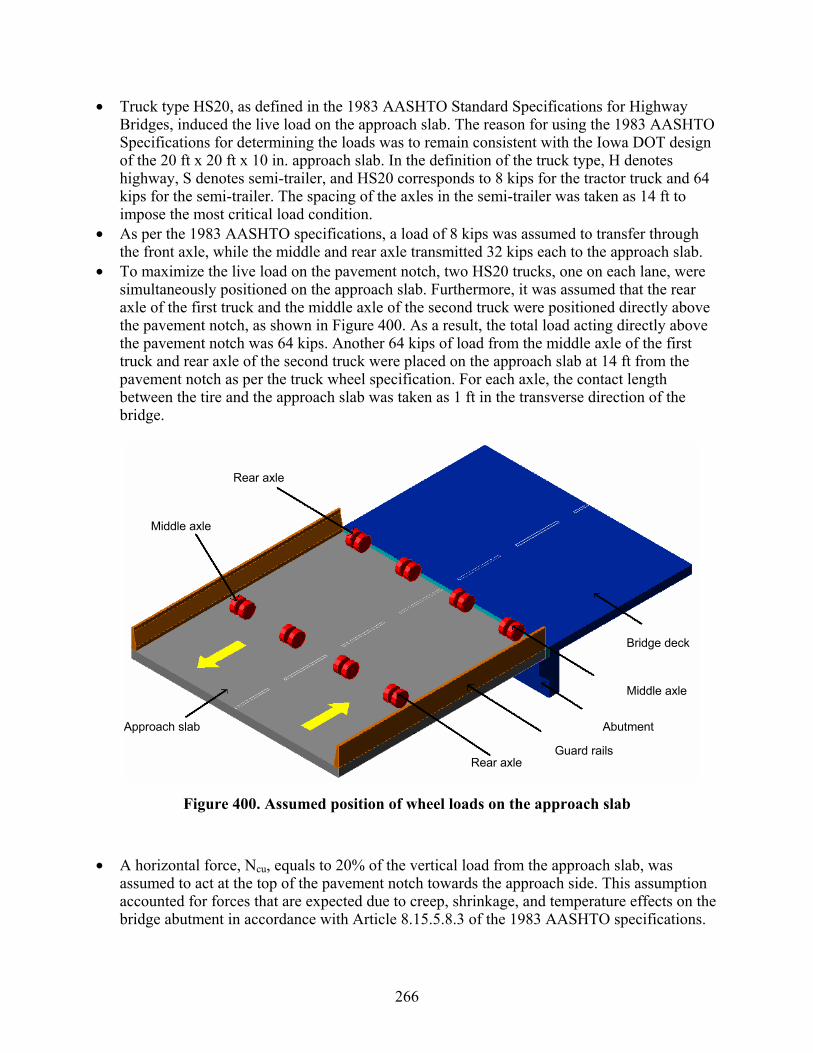
266
• Truck type HS20, as defined in the 1983 AASHTO Standard Specifications for Highway Bridges, induced the live load on the approach slab. The reason for using the 1983 AASHTO Specifications for determining the loads was to remain consistent with the Iowa DOT design of the 20 ft x 20 ft x 10 in. approach slab. In the definition of the truck type, H denotes highway, S denotes semi-trailer, and HS20 corresponds to 8 kips for the tractor truck and 64 kips for the semi-trailer. The spacing of the axles in the semi-trailer was taken as 14 ft to impose the most critical load condition.
• As per the 1983 AASHTO specifications, a load of 8 kips was assumed to transfer through the front axle, while the middle and rear axle transmitted 32 kips each to the approach slab.
• To maximize the live load on the pavement notch, two HS20 trucks, one on each lane, were simultaneously positioned on the approach slab. Furthermore, it was assumed that the rear axle of the first truck and the middle axle of the second truck were positioned directly above the pavement notch, as shown in Figure 400. As a result, the total load acting directly above the pavement notch was 64 kips. Another 64 kips of load from the middle axle of the first truck and rear axle of the second truck were placed on the approach slab at 14 ft from the pavement notch as per the truck wheel specification. For each axle, the contact length between the tire and the approach slab was taken as 1 ft in the transverse direction of the bridge.
Figure 400. Assumed position of wheel loads on the approach slab
• A horizontal force, Ncu, equals to 20% of the vertical load from the approach slab, was
assumed to act at the top of the pavement notch towards the approach side. This assumption accounted for forces that are expected due to creep, shrinkage, and temperature effects on the bridge abutment in accordance with Article 8.15.5.8.3 of the 1983 AASHTO specifications.
Rear axle
Middle axle
Approach slab
Rear axleGuard rails
Abutment
Middle axle
Bridge deck

267
• In addition to the self weight, the approach slab included an added dead load, which modeled the future wearing surface. The weight of future wearing surface was taken as 20 psf, as suggested by designers of the Office of Bridges and Structures at the Iowa DOT.
• A cross-sectional area of 3 ft2 was assumed for the guardrails on both sides of the approach slab. The unit weight of the guardrail was taken as 0.2 kips per ft3, according to Article 3.3.6 of the 1983 AASHTO specifications.
• The dead loads described above were assumed to cause a uniformly distributed load on the entire length of the pavement notch.
• The compressive strength of concrete (fc’) was assumed to be 4.0 ksi, while the yield strength
of reinforcing steel (fy) was taken as 60 ksi. The self-weight of concrete was taken as 0.15 kips per ft3.
• The modulus of elasticity of concrete (Ec) was computed based on Article 8.7.1 of the 1983 AASHTO specifications. Accordingly, the modulus of elasticity (Ec) was taken as 57,000* )(' psif c .
• The modulus of rupture (fr) was taken as 7.5* )(' psif c , in accordance with Article 8.15.2.1 of the AASHTO specifications.
Typical Details of Abutment
Figure 401 shows dimensions and reinforcement details of a typical two-lane Iowa DOT bridge abutment that was used for the pavement notch analysis in this study. As shown in this figure, a ten-inch thick approach slab was supported on the pavement notch over a contact length of nine inches. In the notch and the abutment wall in Figure 401, four reinforcement types (A through D) are seen, all of which use #5 reinforcing bars. The minimum clear distance from the face of the concrete to all reinforcing bars is 2 inches. Due to the small bar size, the distance from the center of the main reinforcing bar to the face of concrete was taken as 2 inches in the analytical models.
268
Approach slab Expansion Joint - 1"
Primary pavement notch reinforcement (A)
Abutment reinforcement - Vertical (B)
Pavement notch reinforcement - framing part (C)
Abutment reinforcement - Horizontal (D)
Figure 401. Abutment dimensions and reinforcement details used for a typical two-lane
non-integral bridge in Iowa
The dimensions of the abutment, pavement notch and approach slab shown in Figure 401 represent those typically used for non-integral bridges in Iowa. This bridge type was commonly used in that past and provides the most critical force conditions in the notch and the abutment wall. Today, most bridges in Iowa are designed as integral bridges with 36-in. wide abutment walls. Furthermore, during the course of the study presented in this report, the Iowa DOT introduced new design specifications for both non-integral and integral bridges. In the new specifications, the width of the pavement notch has been increased to 15 inches for both bridge types. Because of the focus of study on existing bridges, the abutment dimensions shown in Figure 401 were used in the analysis results presented below. However, the failure potential of the pavement notch in bridges designed to the new specifications is also commented at the appropriate places. Model Formulation
Overview
Discontinuities caused by abrupt changes in geometry or concentrated loads may result in what is termed “disturbed” or “D”-regions in structural members. In D-regions, the flow of stresses is disturbed around the discontinuities. Any regions that may not be modeled as “beam” or “B”-
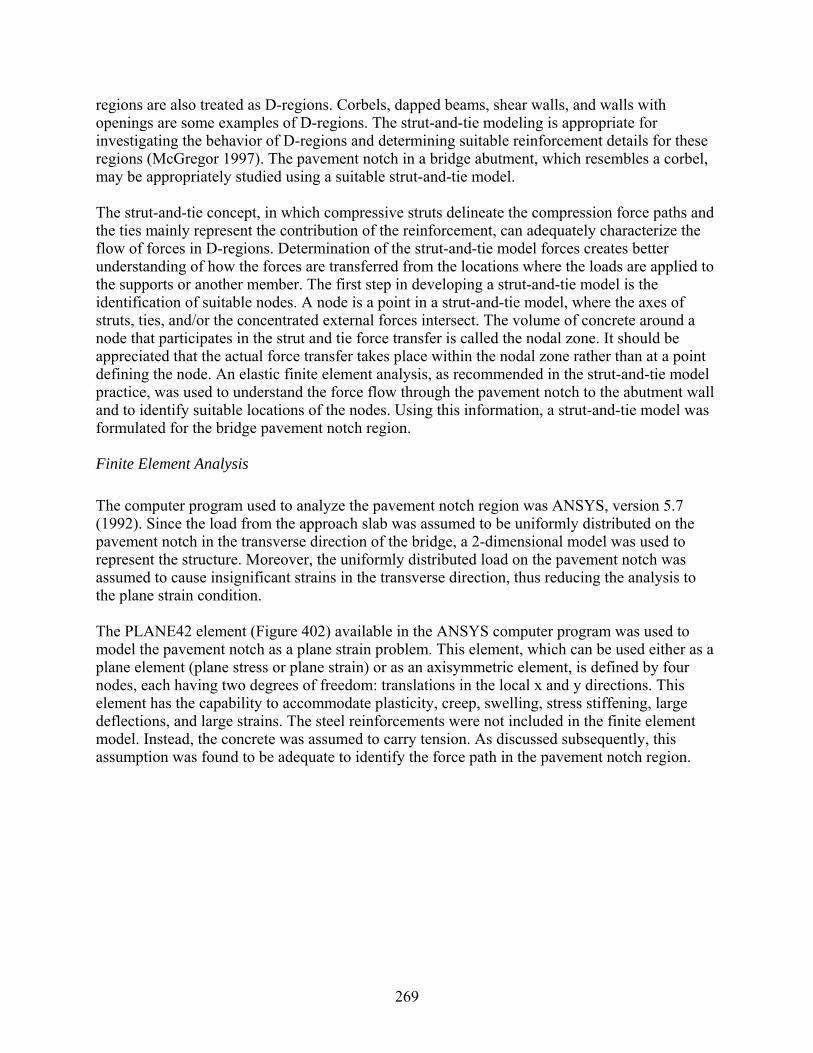
269
regions are also treated as D-regions. Corbels, dapped beams, shear walls, and walls with openings are some examples of D-regions. The strut-and-tie modeling is appropriate for investigating the behavior of D-regions and determining suitable reinforcement details for these regions (McGregor 1997). The pavement notch in a bridge abutment, which resembles a corbel, may be appropriately studied using a suitable strut-and-tie model. The strut-and-tie concept, in which compressive struts delineate the compression force paths and the ties mainly represent the contribution of the reinforcement, can adequately characterize the flow of forces in D-regions. Determination of the strut-and-tie model forces creates better understanding of how the forces are transferred from the locations where the loads are applied to the supports or another member. The first step in developing a strut-and-tie model is the identification of suitable nodes. A node is a point in a strut-and-tie model, where the axes of struts, ties, and/or the concentrated external forces intersect. The volume of concrete around a node that participates in the strut and tie force transfer is called the nodal zone. It should be appreciated that the actual force transfer takes place within the nodal zone rather than at a point defining the node. An elastic finite element analysis, as recommended in the strut-and-tie model practice, was used to understand the force flow through the pavement notch to the abutment wall and to identify suitable locations of the nodes. Using this information, a strut-and-tie model was formulated for the bridge pavement notch region. Finite Element Analysis
The computer program used to analyze the pavement notch region was ANSYS, version 5.7 (1992). Since the load from the approach slab was assumed to be uniformly distributed on the pavement notch in the transverse direction of the bridge, a 2-dimensional model was used to represent the structure. Moreover, the uniformly distributed load on the pavement notch was assumed to cause insignificant strains in the transverse direction, thus reducing the analysis to the plane strain condition. The PLANE42 element (Figure 402) available in the ANSYS computer program was used to model the pavement notch as a plane strain problem. This element, which can be used either as a plane element (plane stress or plane strain) or as an axisymmetric element, is defined by four nodes, each having two degrees of freedom: translations in the local x and y directions. This element has the capability to accommodate plasticity, creep, swelling, stress stiffening, large deflections, and large strains. The steel reinforcements were not included in the finite element model. Instead, the concrete was assumed to carry tension. As discussed subsequently, this assumption was found to be adequate to identify the force path in the pavement notch region.
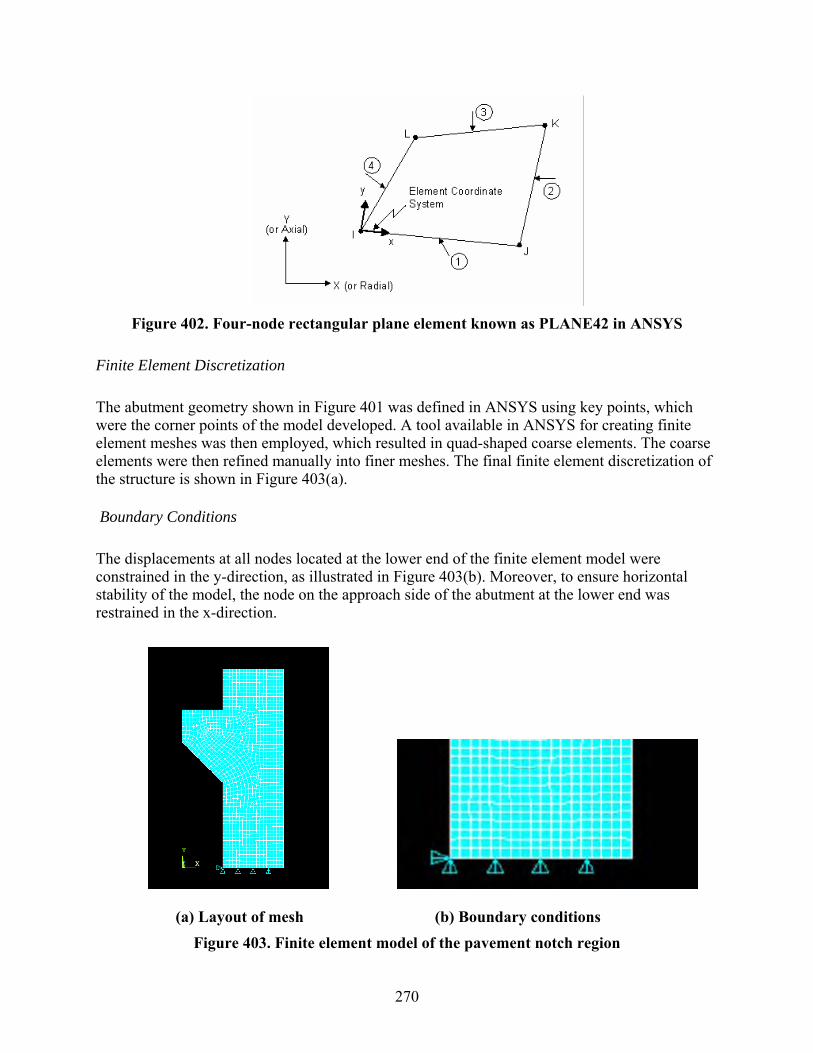
270
Figure 402. Four-node rectangular plane element known as PLANE42 in ANSYS
Finite Element Discretization
The abutment geometry shown in Figure 401 was defined in ANSYS using key points, which were the corner points of the model developed. A tool available in ANSYS for creating finite element meshes was then employed, which resulted in quad-shaped coarse elements. The coarse elements were then refined manually into finer meshes. The final finite element discretization of the structure is shown in Figure 403(a).
Boundary Conditions
The displacements at all nodes located at the lower end of the finite element model were constrained in the y-direction, as illustrated in Figure 403(b). Moreover, to ensure horizontal stability of the model, the node on the approach side of the abutment at the lower end was restrained in the x-direction.
(a) Layout of mesh (b) Boundary conditions Figure 403. Finite element model of the pavement notch region
271
Material Properties
Based on concrete compressive strength of 4.0 ksi, the modulus of elasticity and modulus of rupture of concrete were computed:
• Modulus of elasticity, Ec = 57,000* )(' psif c *10-3 = 3,605 ksi
• Modulus of rupture, fr = 7.5* )(' psif c = 474 psi The Poisson’s ratio of concrete, νc, was taken as 0.2. Load Cases
Two static and two dynamic load cases were identified to account for the extreme load conditions in the pavement notch analysis. In order to estimate the uniformly distributed live and dead loads per foot length acting on the pavement notch, the entire length of the bridge abutment in the transverse direction was used. For all load cases, as previously discussed, one of the axles transferring 32 kips was placed directly above the pavement notch and the other axle with the same load was positioned on the approach slab 14 ft from the notch (Figure 404). With the assumption that the approach slab is simply supported at the ends, the total loads on the pavement notch can be readily obtained using appropriate load factors. Except for the dynamic impact factor, the load factors specified in the ACI 318-02 building standards (ACI Committee 318, 2002) were used in the pavement notch analysis. This procedure was primarily motivated by the decision to use the standards for calculating the strut and tie capacities. The recommendations included for estimating the strut and tie capacities in ACI 318-02 are simpler and more recent than those available in the 1998 AASHTO specifications. Furthermore, it is noted that the conclusions of the investigation will not be different if the AASTHO load factors and strut-and-tie capacity calculations are followed. This investigation may be found elsewhere (Chetlur 2004). Calculations of the loads on the pavement notch based on the previously stated assumptions are as follows: Dead load on pavement notch Dead load due to approach slab = 0.5 * (20*20*0.833) * 0.15 = 25.0 kips Dead load due to future wearing surface on the approach slab = 0.5 * (20*20) * 0.02 = 4.0 kips Dead load due to guardrails = 0.5 * (3*20) * 0.2 = 6.0 kips Total factored dead load on the notch, WDL = 1.2 * (25.0 + 4.0 + 6.0) = 42.0 kips
Live load on pavement notch Live load due to axles directly above the notch = 2 * 32 = 64 kips Live load due to axles 14 ft away from the notch = 2 * 9.6 = 19.2 kips Total factored live load on the notch, WLL = 1.6 * (64 + 19.2) = 133.12 kips

272
The following load cases were considered for evaluating the potential failure of a typical pavement notch designed by the Iowa DOT. Static Load Case 1 (SLC1) The total factored load (WTOTAL), i.e., the sum of the factored dead load (WDL) and factored live load (WLL), was uniformly distributed over the entire length of the pavement notch (Figure 404(a)). The resulting uniformly distributed load (U.D.L.) was defined as
Total U.D.L. = 20
)( LLDL WW + = 8.76 kips / ft
Static Load Case 2 (SLC2) The dead load, which included the weight of the approach slab, future wearing surface, and guardrails, and the 32 kip live load due to the axles positioned at 14 ft away from the notch, were uniformly distributed over the entire length of the pavement notch, as shown in Figure 404(b). An additional live load acting on a 32-inch length of the notch was considered. This load was a result of a wheel load applied over a one-foot wide contact area between the wheel and the approach slab, as shown in Figure 405. Accordingly, a wheel load of 16 kip was uniformly distributed over a 32 in. (2 ft 8 in.) length of the notch and the corresponding total factored load was obtained as
Total U.D.L. = ⎥⎦⎤
⎢⎣⎡ ++
12/3216
202.19*6.1
20DLW
= 13.24 kips / ft
(a) Load case 1

273
(b) Load case 2 Figure 404. Static load cases
For the pavement notch analysis, Static Load Case 2 generally controlled by producing the most severe loading conditions. However, as detailed in the next section, Static Load Case 1 was found to be more critical for one of the direct shear failure modes by giving a smaller capacity to demand ratio. In addition to the critical static load cases, two dynamic load cases were included in the analysis as detailed below.
Figure 405. Dispersion of a wheel load through the approach slab
Dynamic Load Cases Two dynamic load cases were included, in which dynamic impact factors of 1.3 and 2.0 were applied to the factored live load that was estimated for the static load analysis. The dead load for the dynamic analysis was taken the same as that used for the static load case with a load factor of 1.2. Article 3.8 in the 1983 AASHTO Specification refers to the impact due to the live load that
274
is applied to the factored live load. For an approach slab with a 20 ft. span, the live load dynamic factor (I) was found to be 1.3. In addition, a dynamic factor of 2.0 was also used to include a worst case scenario of the impact on the pavement notch by the live load, as requested by the bridge designers at the Iowa DOT. Results
The finite element analysis plots showing the strain in the vertical direction, principal stresses, and the corresponding vector plot delineating the direction and magnitude of principal stresses are presented in Figures 406, 407 and 408, respectively. These figures illustrate the typical force flow path through the pavement notch to the abutment wall induced by SLC2 and the corresponding horizontal force (Ncu). Based on these plots, suitable nodes for the strut-and-tie model were identified. As previously noted, the steel reinforcements were not included in the finite element model and the concrete was assumed to carry tension. The resultant tensile force in the cross-section of the abutment wall was located assuming a linear stress variation with zero stress at the neutral axis position and the maximum stress at the location of the extreme tension fiber. The distance of the resultant tensile force from the extreme tension fiber in the abutment wall was found to be approximately at 2 inches. Recognizing the actual position of the steel reinforcement in the abutment wall, the tie was fixed at 2 in. from the edge of the concrete. The geometry of the strut-and-tie model developed for the pavement notch region is shown in Figure 409. The node C was fixed at 5.5 in. from the abutment wall, directly below the vertical point load from the slab. The tie CB was placed 2 in. from the top surface of the notch, considering one layer of horizontal steel reinforcement that is typically used in this location of the abutment. The horizontal tie DA was assumed to coincide with the horizontal line passing through the sloping end of the notch, with node D located 1.12 in. from the vertical interface between the pavement notch and abutment wall. Similarly, consistent with the finite element analysis results, ties AA’ and AB were placed 2 in. from the inside face of the abutment wall. The centerline of the strut DD’ was positioned at 1.12 in. from the concrete edge to represent the location of the resultant compression force. The 1.12 in. distance from the outside edge of the abutment wall chosen for locating node D and strut DD’ is smaller than that can be inferred from Figures 406 – 408. In the finite element analysis, cracking of concrete was not modeled whereas the distance of 1.12 in. for locating node D and strut DD’ was finalized by analyzing the cracked section at the base of the abutment wall. In this analysis, strain in the reinforcement was determined based on the demands reported in Table 36.
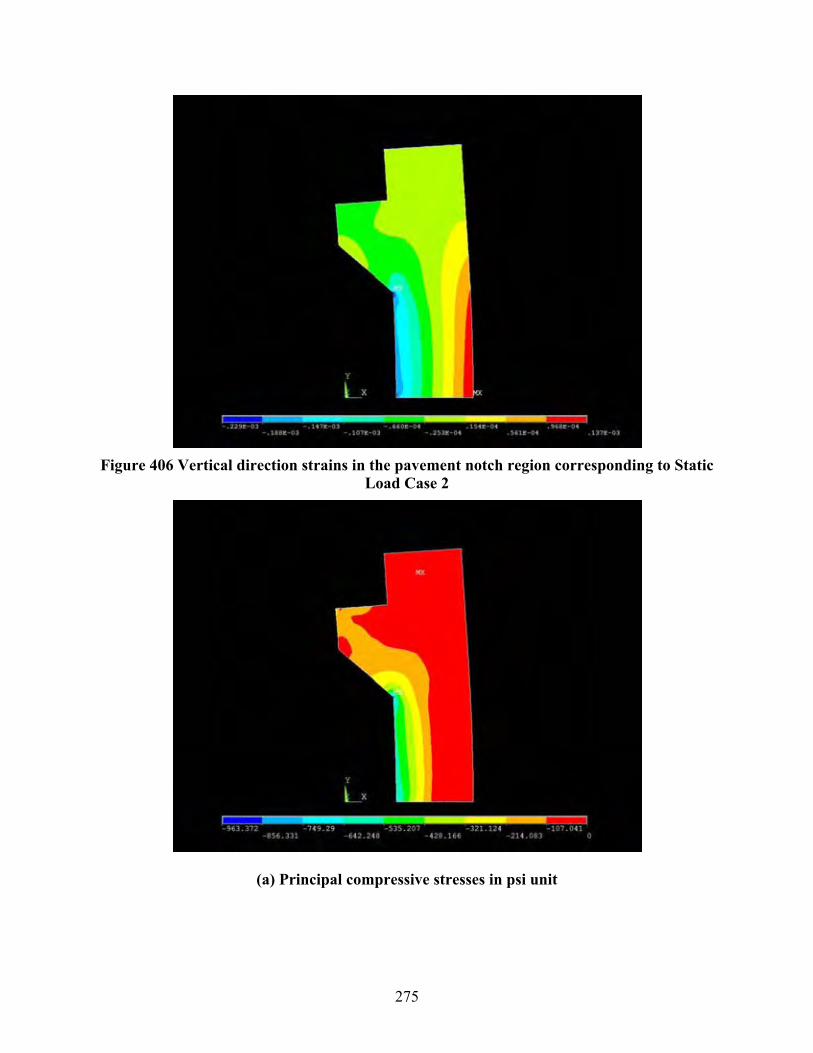
275
Figure 406 Vertical direction strains in the pavement notch region corresponding to Static
Load Case 2
(a) Principal compressive stresses in psi unit

276
(b) Principal tensile stresses in psi unit Figure 407. Principal stresses in the pavement notch region corresponding to Static Load
Case 2
Figure 408. Vector plot showing the direction of the principal compressive and tensile stresses corresponding to Static Load Case 2

277
Strut-and-Tie Analysis
Following identification of the nodes, the Computer Aided Strut-and-Tie (CAST) program (2000) was used to perform the analysis of the strut-and-tie model representing the pavement notch region. In CAST, once the boundaries of the notch and abutment wall, as well as the node locations, are defined, the forces in struts and ties are solved for a given load condition. The concrete tension capacity is ignored in CAST, but the reinforcements are modeled as tension ties. Figure 409 and Table 36 list the calculated strut and tie forces for the loads corresponding to SLC2. The output from CAST is produced in Figure 410, which shows the strut and tie demands and stress ratios for the critical struts. The stress ratio of a strut is defined in CAST as the ratio of stress demand to the permissible stress limit. Hence, a stress ratio greater than one would indicate failure of that strut. For the CAST model in Figure 410, DD’ was the most critical strut and a width of 2.24 in. was accurately modeled for this strut. For the other struts (i.e., BD, and CD), smaller strut widths were used conservatively to keep the nodal boundaries within the geometry of the abutment and pavement notch modeled in Figure 410.
C
D A
B
D' A'
Figure 409. Geometry of the strut-and-tie model developed for the pavement notch region from the finite element analysis results
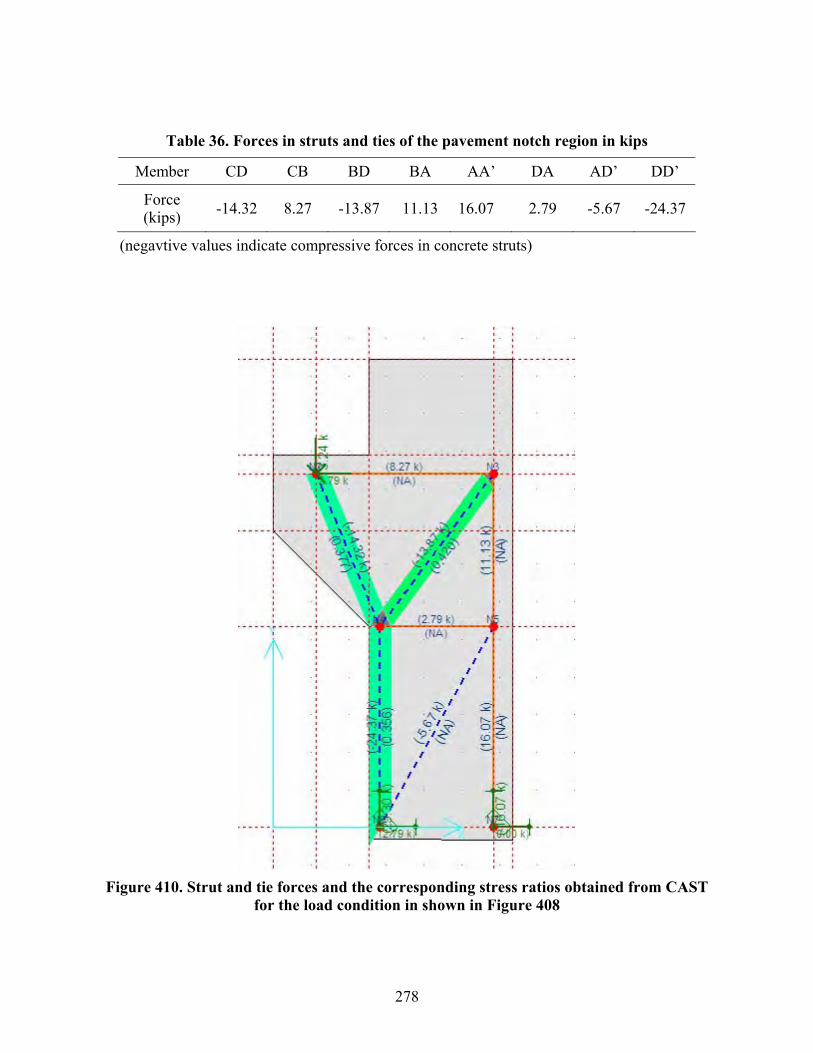
278
Table 36. Forces in struts and ties of the pavement notch region in kips
Member CD CB BD BA AA’ DA AD’ DD’
Force (kips) -14.32 8.27 -13.87 11.13 16.07 2.79 -5.67 -24.37
(negavtive values indicate compressive forces in concrete struts)
Figure 410. Strut and tie forces and the corresponding stress ratios obtained from CAST
for the load condition in shown in Figure 408

279
Examination of Failure Potential
Overview
In structural members with short shear spans such as the pavement notch, four different failure modes are possible (Portland Cement Association 2002). Description of these failure modes for the pavement notch and the corresponding checks on the failure potential using the strut-and-tie analysis results are presented below.
Mode 1: Direct shear failure at the vertical interface between the abutment wall and the notch or in the notch away from the interface. Mode 2: Yielding of the tension ties Mode 3: Crushing of concrete in struts Mode 4: Localized bearing failure under the loaded area
Mode 1: Direct Shear Failure
A direct shear failure in the pavement notch occurs in two different manners. Case 1 The entire pavement notch was considered to experience shear failure at the notch-to-abutment wall interface, as shown in Figure 411, under a uniformly distributed vertical load on the notch resulting from the dead and live loads. The failure check was performed considering a one-foot-wide segment of the notch in the transverse direction using SLC1. As detailed in Figure 411, shear failure due to SLC2 involves at least two shear planes, which makes this load case less critical when compared to SLC1. Case 2 In this failure case, it was assumed that the approach slab was supported over a reduced width on the notch, as shown in Figure 412. This condition can be attributed to poor construction practice, thermal effects, or a combination thereof (see an example of this condition in Figure 276 – HW65 bridge). The width of the failure segment was conservatively taken as 2 in. from the free edge of the pavement notch. This small segment of the notch was assumed to have no steel reinforcement. Because the shear plane runs in the direction of the bridge is very small, SLC2 governs this failure case by producing a lower capacity to demand ratio.
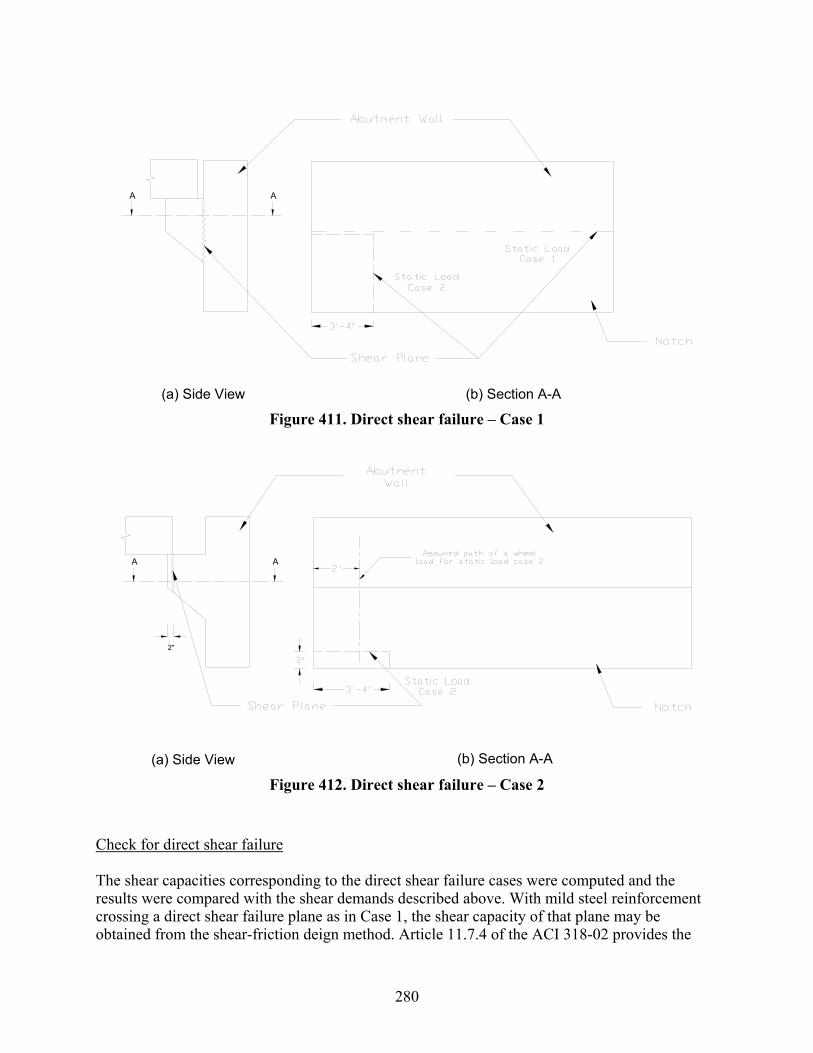
280
A A
(b) Section A-A(a) Side View Figure 411. Direct shear failure – Case 1
A A
(b) Section A-A(a) Side View
2"
Figure 412. Direct shear failure – Case 2
Check for direct shear failure The shear capacities corresponding to the direct shear failure cases were computed and the results were compared with the shear demands described above. With mild steel reinforcement crossing a direct shear failure plane as in Case 1, the shear capacity of that plane may be obtained from the shear-friction deign method. Article 11.7.4 of the ACI 318-02 provides the
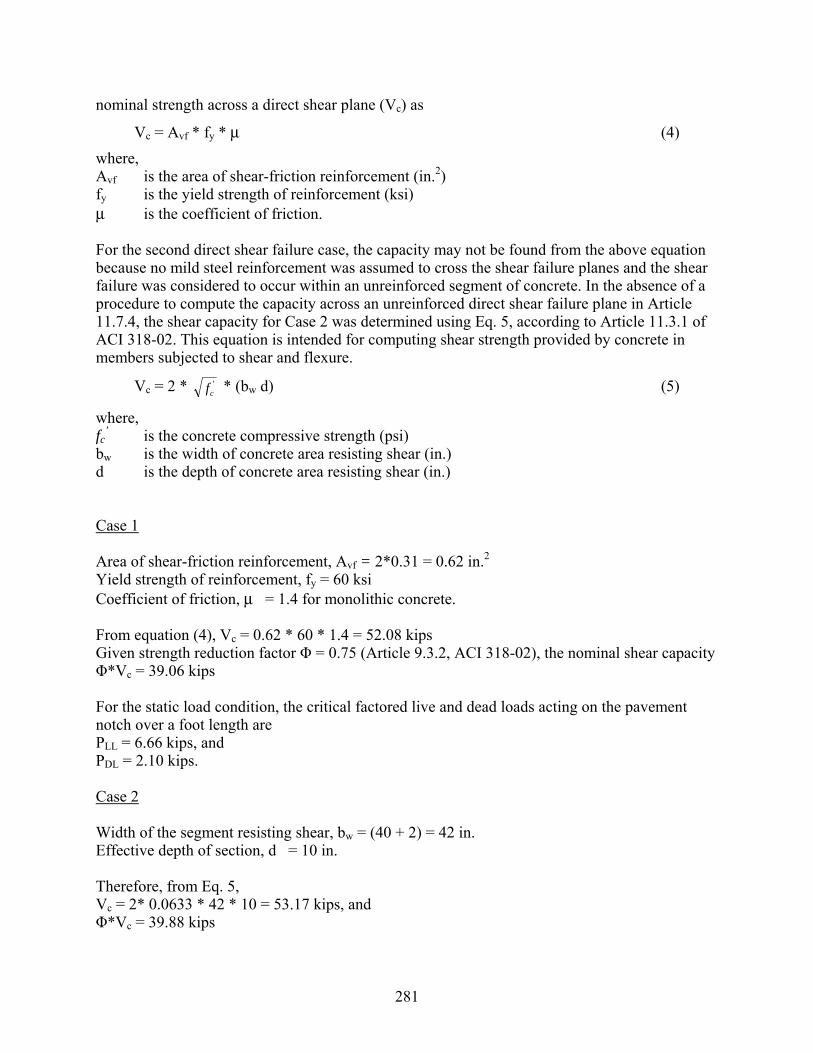
281
nominal strength across a direct shear plane (Vc) as
Vc = Avf * fy * µ (4) where, Avf is the area of shear-friction reinforcement (in.2) fy is the yield strength of reinforcement (ksi) µ is the coefficient of friction. For the second direct shear failure case, the capacity may not be found from the above equation because no mild steel reinforcement was assumed to cross the shear failure planes and the shear failure was considered to occur within an unreinforced segment of concrete. In the absence of a procedure to compute the capacity across an unreinforced direct shear failure plane in Article 11.7.4, the shear capacity for Case 2 was determined using Eq. 5, according to Article 11.3.1 of ACI 318-02. This equation is intended for computing shear strength provided by concrete in members subjected to shear and flexure.
Vc = 2 * 'cf * (bw d) (5)
where, fc
’ is the concrete compressive strength (psi) bw is the width of concrete area resisting shear (in.) d is the depth of concrete area resisting shear (in.) Case 1 Area of shear-friction reinforcement, Avf = 2*0.31 = 0.62 in.2 Yield strength of reinforcement, fy = 60 ksi Coefficient of friction, µ = 1.4 for monolithic concrete. From equation (4), Vc = 0.62 * 60 * 1.4 = 52.08 kips Given strength reduction factor Φ = 0.75 (Article 9.3.2, ACI 318-02), the nominal shear capacity Φ*Vc = 39.06 kips For the static load condition, the critical factored live and dead loads acting on the pavement notch over a foot length are PLL = 6.66 kips, and PDL = 2.10 kips. Case 2 Width of the segment resisting shear, bw = (40 + 2) = 42 in. Effective depth of section, d = 10 in. Therefore, from Eq. 5, Vc = 2* 0.0633 * 42 * 10 = 53.17 kips, and Φ*Vc = 39.88 kips

282
For the static load condition, the critical factored live and dead loads, including a wheel load, acting on the pavement notch were obtained using the loads acting on the 3 ft - 4 in. segment identified in Figure 412. PLL = 5.12 + 1.6*16.00 = 30.72 kips, and PDL = 7.00 kips. From Table 37, it is evident that a direct shear failure would unlikely to occur for the worst case scenarios considered for the static load condition. When dynamic effects were included, the demands in the shear planes increased, causing shear failure of unreinforced segment in the pavement notch. This failure scenario is considered unlikely to develop in well-built bridges in which the transfer of loads through the unreinforced segment of concrete will not be permitted. As seen in Table 37, shear failure will not occur at the pavement notch-to-abutment wall interface even under the severe dynamic load condition. These conclusions will hold for the new dimensions and design specifications recently adopted by the Iowa DOT for the abutment and pavement notch in non-integral and integral bridges (e.g., see Figure 6). Note that the ¾ inch thick joint filler board lapped 4 inches onto the paving notch as seen in Figure 6 will prevent loads from being transferred to the front edge of the notch.
Table 37. Comparison of capacities and demands for the direct shear failure mode under
the critical static and dynamic load cases
Shear Demand (kips)
Dynamic Failure Mode Static (PDL+ PLL) (PDL+ 1.3*PLL) (PDL+ 2.0*PLL)
Nominal Shear Capacity Φ*Vc (kips)
Case 1 (SLC1) 8.76 10.76 15.42 39.06
Case 2 (SLC2) 37.72 46.94 68.44 39.88 Mode 2: Yielding of Tension Ties
The combination of the vertical load from the approach slab acting on the pavement notch and the horizontal load representing the effects of creep, shrinkage, and thermal movements caused direct tension in ties CB and DA and flexural tension in ties BA and AA’. Since #5 reinforcing bars spaced at 12 in. provided the resistance for all ties, the flexural ties were the most critical ties. However, for completeness, the demands in all ties were compared against the appropriate capacities for the static and dynamic load cases. For a #5 steel reinforcing bar (cross sectional area = 0.31 in.2) spaced at 12 in., the tie capacity was determined as per Article 9.3.2.6 of ACI 318-02. Using strength reduction factor Φ = 0.75 and yield strength fy = 60 ksi, the tie capacity was found to be 13.95 kips. Table 38 shows a comparison between the tie demands obtained for the critical static and dynamic load cases and the corresponding capacities for the pavement notch and the abutment wall. It is seen from Table 38 that yielding would be unlikely to occur under static and dynamic load cases in ties CB and DA. Thus, the use of #5 bars for these reinforcement ties will ensure
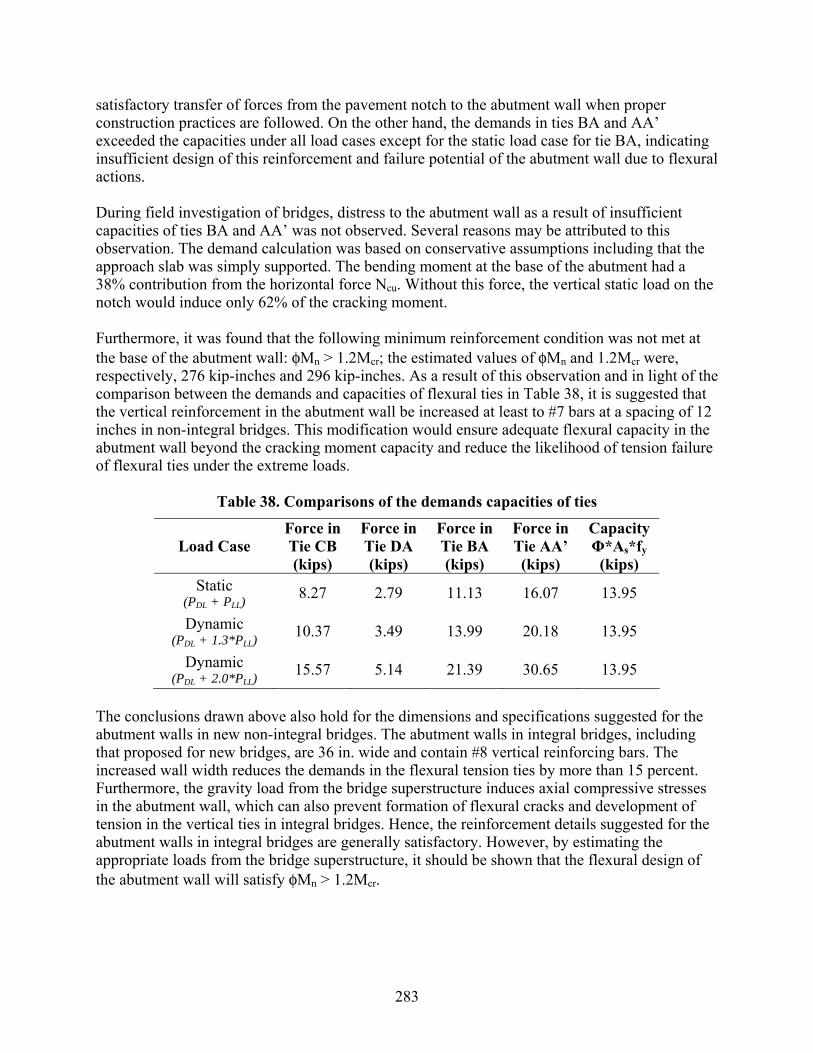
283
satisfactory transfer of forces from the pavement notch to the abutment wall when proper construction practices are followed. On the other hand, the demands in ties BA and AA’ exceeded the capacities under all load cases except for the static load case for tie BA, indicating insufficient design of this reinforcement and failure potential of the abutment wall due to flexural actions. During field investigation of bridges, distress to the abutment wall as a result of insufficient capacities of ties BA and AA’ was not observed. Several reasons may be attributed to this observation. The demand calculation was based on conservative assumptions including that the approach slab was simply supported. The bending moment at the base of the abutment had a 38% contribution from the horizontal force Ncu. Without this force, the vertical static load on the notch would induce only 62% of the cracking moment. Furthermore, it was found that the following minimum reinforcement condition was not met at the base of the abutment wall: φMn > 1.2Mcr; the estimated values of φMn and 1.2Mcr were, respectively, 276 kip-inches and 296 kip-inches. As a result of this observation and in light of the comparison between the demands and capacities of flexural ties in Table 38, it is suggested that the vertical reinforcement in the abutment wall be increased at least to #7 bars at a spacing of 12 inches in non-integral bridges. This modification would ensure adequate flexural capacity in the abutment wall beyond the cracking moment capacity and reduce the likelihood of tension failure of flexural ties under the extreme loads.
Table 38. Comparisons of the demands capacities of ties
Load Case Force in Tie CB (kips)
Force in Tie DA (kips)
Force in Tie BA (kips)
Force in Tie AA’ (kips)
Capacity Φ*As*fy
(kips) Static
(PDL + PLL) 8.27 2.79 11.13 16.07 13.95
Dynamic (PDL + 1.3*PLL) 10.37 3.49 13.99 20.18 13.95
Dynamic (PDL + 2.0*PLL) 15.57 5.14 21.39 30.65 13.95
The conclusions drawn above also hold for the dimensions and specifications suggested for the abutment walls in new non-integral bridges. The abutment walls in integral bridges, including that proposed for new bridges, are 36 in. wide and contain #8 vertical reinforcing bars. The increased wall width reduces the demands in the flexural tension ties by more than 15 percent. Furthermore, the gravity load from the bridge superstructure induces axial compressive stresses in the abutment wall, which can also prevent formation of flexural cracks and development of tension in the vertical ties in integral bridges. Hence, the reinforcement details suggested for the abutment walls in integral bridges are generally satisfactory. However, by estimating the appropriate loads from the bridge superstructure, it should be shown that the flexural design of the abutment wall will satisfy φMn > 1.2Mcr.
284
Mode 3: Crushing of Concrete in Struts
Crushing of concrete is a likely failure mode in disturbed region like the pavement notch because smaller concrete sections effectively transfer the compressive forces. Crushing of concrete in a strut can lead to brittle failure of the pavement notch; therefore, it is essential to check the concrete strut demands against the capacities. Table 39 compares the capacities of three struts, BD, CD, and DD’, with the demands corresponding to the critical static and two dynamic load cases. According to Article A.3.2 of ACI 318-02, the effective compressive strength of a concrete strut is given by
fcu = 0.85 * βs * fc
’ (6) where βs is a factor that accounts for the effect of cracking and confining reinforcement on the effective compressive strength of a concrete strut. Strut DD’ is expected to have a uniform width, and thus βs = 1. For the given reinforcement details, βs = 0.6 should be used for struts BD and CD because they are expected have bottle-shaped stress fields. For all struts fc
’ = 4 ksi. From equation (6), fcu = 0.85 * 4.0 = 3.4 ksi for strut DD’, and fcu = 0.85 * 0.6 * 4.0 = 2.04 ksi for struts BD and CD. Therefore, the nominal capacity of a concrete strut can be expressed as,
Fcu = fcu * (bw*d) (7)
where bw is the width of strut extending in the outer plane direction, and d is the depth of strut in the plane of loading perpendicular to the direction of the compressive force. The value of bw was 12 in., while d varied between struts. As represented in Figure 410, the strut depths for BD and CD were taken as 1.80 in. and 2.07 in., respectively, while the d value for strut DD’ was estimated to be 2.24 inches. With a strength reduction factor of 0.75, the capacities of the struts were computed using Eq. 7, and the values are reported in Table 39. From Table 39, it is apparent that the strut demands corresponding to all load cases are below the capacities, which confirms that crushing of concrete struts is unlikely to occur in the pavement notch or the abutment wall. However, it should be noted that poorly compacted concrete will have reduced compressive strength (fc
’), which will reduce the strut capacity and increase the likelihood of strut failure in the pavement notch region. Hence, good construction practices and inspections should be ensured when the abutments and pavement notches are built.
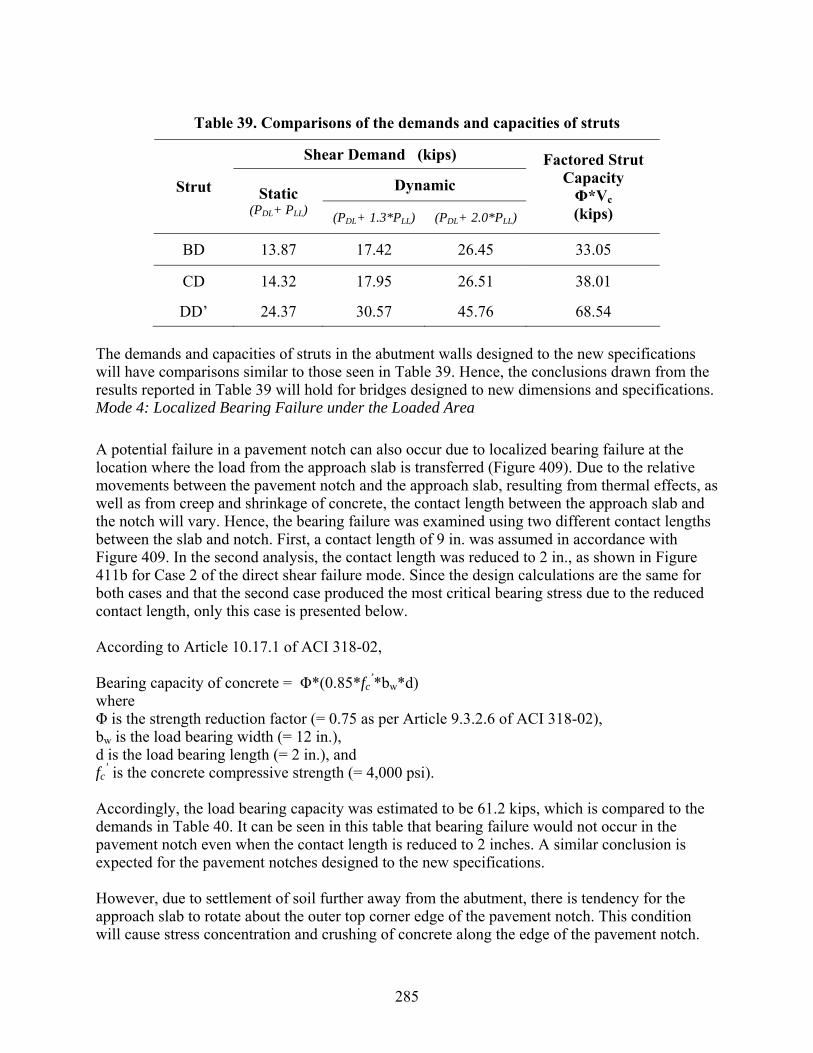
285
Table 39. Comparisons of the demands and capacities of struts
Shear Demand (kips)
Dynamic Strut Static (PDL+ PLL) (PDL+ 1.3*PLL) (PDL+ 2.0*PLL)
Factored Strut Capacity Φ*Vc (kips)
BD 13.87 17.42 26.45 33.05
CD 14.32 17.95 26.51 38.01
DD’ 24.37 30.57 45.76 68.54 The demands and capacities of struts in the abutment walls designed to the new specifications will have comparisons similar to those seen in Table 39. Hence, the conclusions drawn from the results reported in Table 39 will hold for bridges designed to new dimensions and specifications. Mode 4: Localized Bearing Failure under the Loaded Area
A potential failure in a pavement notch can also occur due to localized bearing failure at the location where the load from the approach slab is transferred (Figure 409). Due to the relative movements between the pavement notch and the approach slab, resulting from thermal effects, as well as from creep and shrinkage of concrete, the contact length between the approach slab and the notch will vary. Hence, the bearing failure was examined using two different contact lengths between the slab and notch. First, a contact length of 9 in. was assumed in accordance with Figure 409. In the second analysis, the contact length was reduced to 2 in., as shown in Figure 411b for Case 2 of the direct shear failure mode. Since the design calculations are the same for both cases and that the second case produced the most critical bearing stress due to the reduced contact length, only this case is presented below. According to Article 10.17.1 of ACI 318-02,
Bearing capacity of concrete = Φ*(0.85*fc
’*bw*d) where Φ is the strength reduction factor (= 0.75 as per Article 9.3.2.6 of ACI 318-02), bw is the load bearing width (= 12 in.), d is the load bearing length (= 2 in.), and fc
’ is the concrete compressive strength (= 4,000 psi). Accordingly, the load bearing capacity was estimated to be 61.2 kips, which is compared to the demands in Table 40. It can be seen in this table that bearing failure would not occur in the pavement notch even when the contact length is reduced to 2 inches. A similar conclusion is expected for the pavement notches designed to the new specifications. However, due to settlement of soil further away from the abutment, there is tendency for the approach slab to rotate about the outer top corner edge of the pavement notch. This condition will cause stress concentration and crushing of concrete along the edge of the pavement notch.
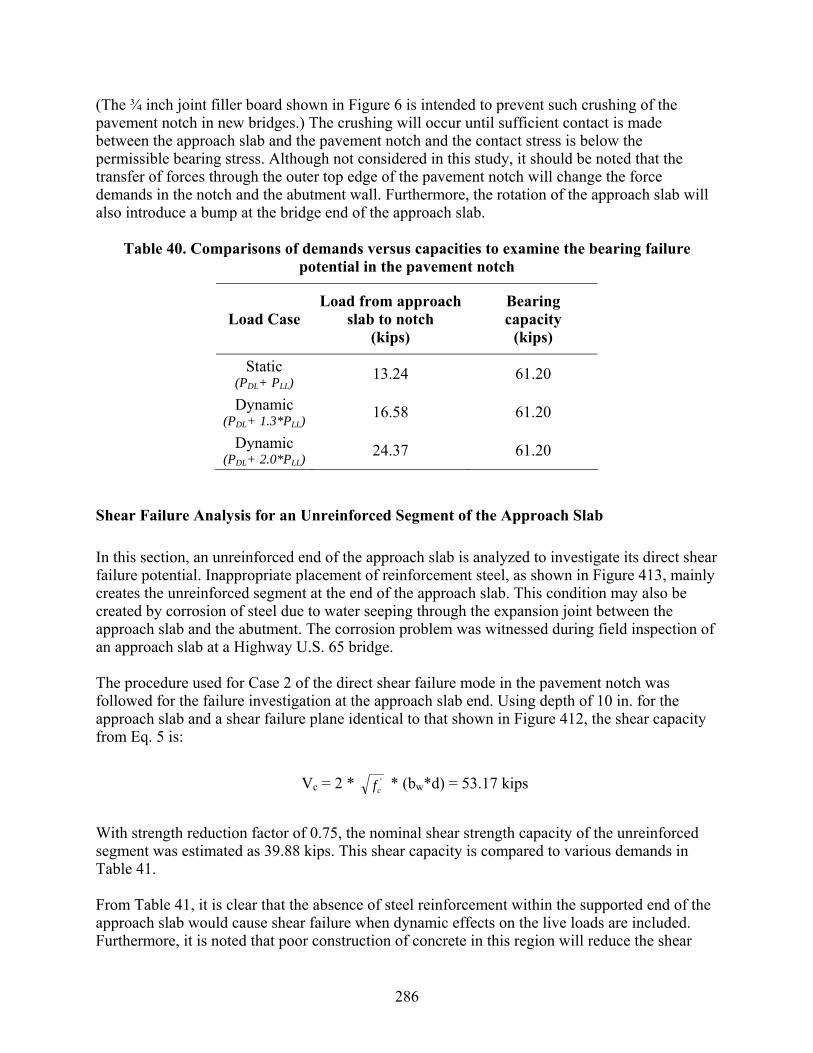
286
(The ¾ inch joint filler board shown in Figure 6 is intended to prevent such crushing of the pavement notch in new bridges.) The crushing will occur until sufficient contact is made between the approach slab and the pavement notch and the contact stress is below the permissible bearing stress. Although not considered in this study, it should be noted that the transfer of forces through the outer top edge of the pavement notch will change the force demands in the notch and the abutment wall. Furthermore, the rotation of the approach slab will also introduce a bump at the bridge end of the approach slab.
Table 40. Comparisons of demands versus capacities to examine the bearing failure potential in the pavement notch
Load Case Load from approach
slab to notch (kips)
Bearing capacity
(kips)
Static (PDL+ PLL) 13.24 61.20
Dynamic (PDL+ 1.3*PLL) 16.58 61.20
Dynamic (PDL+ 2.0*PLL) 24.37 61.20
Shear Failure Analysis for an Unreinforced Segment of the Approach Slab
In this section, an unreinforced end of the approach slab is analyzed to investigate its direct shear failure potential. Inappropriate placement of reinforcement steel, as shown in Figure 413, mainly creates the unreinforced segment at the end of the approach slab. This condition may also be created by corrosion of steel due to water seeping through the expansion joint between the approach slab and the abutment. The corrosion problem was witnessed during field inspection of an approach slab at a Highway U.S. 65 bridge. The procedure used for Case 2 of the direct shear failure mode in the pavement notch was followed for the failure investigation at the approach slab end. Using depth of 10 in. for the approach slab and a shear failure plane identical to that shown in Figure 412, the shear capacity from Eq. 5 is:
Vc = 2 * 'cf * (bw*d) = 53.17 kips
With strength reduction factor of 0.75, the nominal shear strength capacity of the unreinforced segment was estimated as 39.88 kips. This shear capacity is compared to various demands in Table 41. From Table 41, it is clear that the absence of steel reinforcement within the supported end of the approach slab would cause shear failure when dynamic effects on the live loads are included. Furthermore, it is noted that poor construction of concrete in this region will reduce the shear
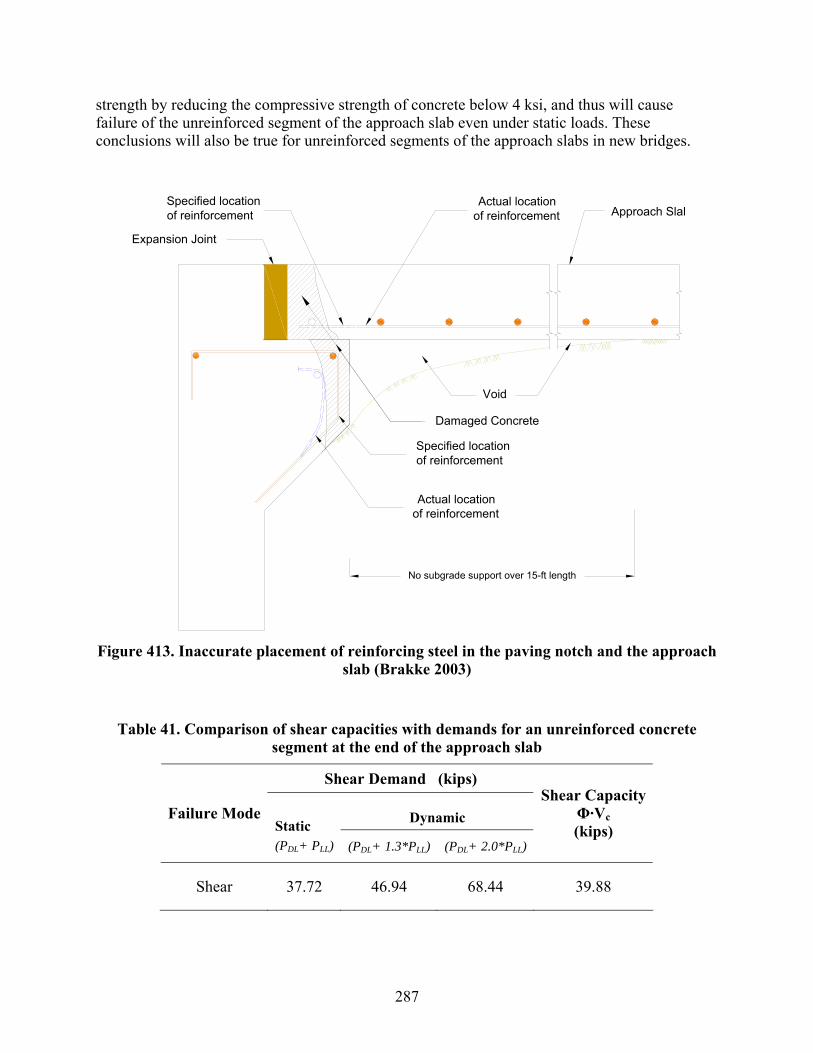
287
strength by reducing the compressive strength of concrete below 4 ksi, and thus will cause failure of the unreinforced segment of the approach slab even under static loads. These conclusions will also be true for unreinforced segments of the approach slabs in new bridges.
No subgrade support over 15-ft length
Void
Approach Slab
Damaged Concrete
Actual locationof reinforcement
Actual locationof reinforcement
Specified locationof reinforcement
Specified locationof reinforcement
Expansion Joint
Figure 413. Inaccurate placement of reinforcing steel in the paving notch and the approach
slab (Brakke 2003)
Table 41. Comparison of shear capacities with demands for an unreinforced concrete
segment at the end of the approach slab
Shear Demand (kips)
Dynamic Failure Mode Static (PDL+ PLL) (PDL+ 1.3*PLL) (PDL+ 2.0*PLL)
Shear Capacity Φ·Vc (kips)
Shear 37.72 46.94 68.44 39.88

288
Key Findings from Paving Notch Analysis
• Using the demands estimated from the strut and tie forces under the worst possible static and dynamic load cases, it was found that the steel reinforcement details used for pavement notch by the Iowa DOT are sufficient. However, the analysis revealed that the vertical reinforcement in the abutment walls of non-integral bridges may not be adequate. It is suggested that these #5 reinforcing bars be replaced with #7 reinforcing bars.
• The failure analysis of unreinforced concrete segments in a pavement notch and an approach slab indicated that shear failure of these segments are likely to occur when dynamic effects are included. Failure of these unreinforced segments should be possible under static loads when concrete strength is below 4 ksi.
• Although most findings of the analytical study suggested that the current reinforcement details for the pavement notch and the approach slab are adequate, it is emphasized that poor workmanship and/or use of poor quality concrete can lead to premature failure of the pavement notch and the approach slab. Hence, good inspection and quality control procedures should be followed during construction of the bridge abutments and approach slabs.
289
SUMMARY AND CONCLUSIONS
The primary conclusions, which were determined from this research, are summarized below. Relevant Research
Documentation of the practices of other states revealed:
• Out of 37 states where practices were investigated, 32% connect the bridge approach to either the bridge slab or the bridge abutment in case of integral abutments.
• Joint widths used in 12 of the 37 states vary from about 0.5 inches to 2 inches. The majority of exiting integral bridges in Iowa have a nominal 4-inch expansion joint. During the course of this study, Iowa DOT changed the expansion joint width to 2 inches.
• Iowa DOT uses two expansion joint materials—flexible foam and recycled tires. Other state DOTs use a rubber V-shaped gland to prevent water infiltration through the expansion joint. This rubber gland has an ability to accommodate large changes in the expansion joint width.
• Most states specify a range of 0% to 10% passing sieve No. 200 for backfill which coincides with Iowa DOT current specification, and a range of 20% to 60% passing sieve No. 4. Moreover, most state DOTs face difficulty obtaining the specified degree of compaction in the proximity of the bridge abutment.
• Wrapping backfill material with geotextile, or using a geocomposite vertical drain at the face of the abutment are alternative drainage details used by other state DOTs.
Field Investigation of Bridge Approaches
• Void development under the bridge approach is observed within one year of bridge construction, indicating insufficient backfill moisture control/compaction followed by soil collapse upon saturation.
• Flexible foam and recycled tire joint fillers do not seal the expansion joint. Measurements of an expansion joint at one bridge site show about 1 inch of total movement, much less than the 4 inch design width.
• Water management around the bridge is a major problem and was observed at most of the inspected bridges. Erosion, a result of poor water management and the use of erodible backfill material, leads to void development under the approach slab, faulting of the approach slab, failure of slope protection, and exposes the H-pile supporting the abutments, which leads to corrosion.
• Some bridges do not have a surface drain. The current Iowa DOT surface drain detail shown in Figure 94 is not effective. The surface drain observed at 5596.2S169 bridge (Figure 81) is effective and is believed to have helped in reducing erosion around the bridge abutment.

290
• Several abutment subdrains were observed to be either blocked with soil, dry indicating no water flow, or collapsed.
• Grouting does not appear to significantly prevent further settlement or loss of backfill material due to erosion.
• At several bridge sites asphalt overlays on the approach slabs show signs of distress and continued approach slab settlement.
• Obtaining elevation profiles of several bridge approaches revealed that compression of the embankment material or foundation is a problem. Most of the profiles obtained have higher slopes than 1/200, which is suggested by Wahls (1990) as an acceptable maximum gradient for bridge approaches.
New Bridge Construction
• Iowa DOT does not specify a suitable moisture content range for placing granular backfill material behind the abutment.
• Laboratory tests performed on granular backfill (classified as SP) reveal that the material has relatively good compactibility. However, measured moisture contents within the bulking moisture content range (3% – 7%) are inhibiting compaction.
• Compaction of granular backfill behind the abutment was not performed at most new bridge sites.
• Porous backfill was not used around the subdrain at most bridge sites. Furthermore, several of the abutment subdrains were observed to be plugged with soil during and after construction.
• Observation of paving notch region construction reveals poor quality of construction. Field observations include sloped top surface of the notch and inadequately consolidated concrete.
Maintenance Practices
• Backfill materials under poorly performing approach slabs are loose and undercompacted. Results from tests on newly placed backfill material suggest that the new material is not properly compacted.
• At one location, the approach slab pavement was observed resting on only 0.5 inch of the paving notch, which was a result of the front portion of the paving notch breaking off.
• Coring by Iowa DOT personnel through several approach slabs revealed that voids are highest near the bridge abutment and decrease with distance away from the abutment. The measured void sizes range from 0.5 inch to 12 inches.
• An investigation using the Iowa DOT snake camera at the subdrain outlets demonstrated that most of the investigated subdrains are not functioning properly. The subdrains were either dry with no evidence of water or blocked with soil fines and debris or had

291
collapsed.
• At two bridge sites it was shown that the URETEK method successfully lifted the approach slab. Further monitoring is required to verify long-term performance of this system.
• From the 26 approach slab elevation profiles collected on U.S. 65 near Des Moines, about 80% of the approach slab gradients are higher than 1/200, as suggested by Wahls (1990) as a maximum slope for bridge approaches, and about 20% of the approach slabs were sloping away from the bridge which can be attributed to compression of the embankment material or settlement of the foundation soil.
Characterizing Bridge Approach Settlement
• Maximum values of IRI were observed at the transition between the bridge and the approach slab and the approach slab and the roadway.
• IRI values at the bridge approach increased with time indicating bridge approach settlement.
• BI and maximum IRI values around the bridge can be used as criteria to initiate maintenance of the bridge approach.
• According to the newly developed rating system, several of the bridge approaches on US highway 65 near Des Moines needed maintenance or repair. Several of the approach slabs were repaired in 2004.
Backfill Characterization
• On average, about 70% of the granular backfill and 1% of the porous backfill materials are smaller than the subdrain perforated openings.
• Granular backfill placed at the bulking water content (3% to 7%) undergoes up to 6% collapse (settlement) when saturated. Granular backfill placed at moisture content greater than 8% experiences no collapse.
• Porous backfill does not experience collapse even if compacted at an initial compaction moisture content ranging from 0% to 12%.
• The gradation range for granular backfill material, as specified by Iowa DOT, falls within the range of highly erodible soils.
• The gradation for porous backfill does not fall within the range of highly erodible soils.
• Granular backfill materials placed at the bulking water content can subsequently lead to large void development and approach slab settlement. Furthermore, granular backfill material has a relatively low drainage capacity (32 cm3/sec according to model experiments).
• Saturating granular backfill should help reduce settlement or void development due to collapse; however, the material is still highly erodible. To improve erodibility resistance, the percent passing sieve No. 8 should be limited to 60%.
292
• Based on the scaled model tests, using porous backfill prevented approach slab settlement and void development and increased the drainage capacity to 92 cm3/sec.
• The model tests show that the geocomposite drainage system STRIPDRAIN 75 increases the drainage capacity to 383 cm3/sec and reduces the void development. Tire chips yielded the highest drainage capacity at 552 cm3/sec and also reduced void development.
Paving Notch Analysis
• Using the demands estimated from the strut and tie forces under the worst possible static and dynamic load cases, it was found that the steel reinforcement details used for pavement notch by the Iowa DOT are sufficient. However, the analysis revealed that the vertical reinforcement in the abutment walls of non-integral bridges may not be adequate. It is suggested that these #5 reinforcing bars be replaced with #7 reinforcing bars.
• The failure analysis of unreinforced concrete segments in a pavement notch and an approach slab indicated that shear failure of these segments are likely to occur when dynamic effects are included. Failure of these unreinforced segments should be possible under static loads when concrete strength is below 4 ksi.
• Although most findings of the analytical study suggested that the current reinforcement details for the pavement notch and the approach slab are adequate, it is emphasized that poor workmanship and/or use of poor quality concrete can lead to premature failure of the pavement notch and the approach slab. Hence, good inspection and quality control procedures should be followed during construction of the bridge abutments and approach slabs.
RECOMMENDATIONS
As a result of the research described in this report, the following changes are suggested for implementation on a pilot test basis:
1. Use a combination of porous backfill and geocomposite drainage systems behind the abutment to improve drainage capacity and reduce erosion around the abutment. Implement use of a surface drainage detail similar to that used at bridge no. 5596.2S156 in District 2 for new construction or retrofits. Several alternative design details are provided for these recommendations and can be implemented on new construction or rehabilitation of existing bridges.
2. To reduce erosion of granular backfill materials, adjust the limits for material passing the No. 8 sieve to less than 60%; and to reduce collapse susceptibility of granular backfill materials, set moisture control limits to between 8% and 12%.
3. For bridges with soft foundation or embankment soils, implement practices of improved embankment compaction with moisture control, foundation preloading, ground improvement, soil removal and replacement, or soil reinforcement that reduce time-dependent post construction settlements and possibly lateral squeeze.
4. Connect the approach slab to the abutment or the deck of the bridge, and eliminate the
293
expansion joint at the bridge end of the approach slab. Support the far end of the approach slab on a sleeper beam with a construction joint of 2 inches and provide an improved joint sealing system at the CF joint. A rubber V-shaped gland joint sealing system is recommended on a pilot test basis. Replace the #5 vertical reinforcing bars in the abutment wall with #7 reinforcing bars in future non-integral bridges.
The above recommendations could be combined with one of the following proposed drainage details (Figures 416 to 419):
1. Use porous backfill behind the abutment in lieu of granular backfill (Figure 416). This design option is simple to construct, increases the drainage capacity, and prevents settlement and void formation from collapse.
2. Use the current Iowa DOT design approach and materials, but add geotextiles reinforcing layers to the granular backfill (Figure 417). Based on the model tests conducted in this study, this design reduces the void size and differential settlement.
3. Use a geocomposite vertical drainage system behind the abutment (Figure 418). This drainage option has a simple construction sequence, increases the drainage capacity, and helps to reduce the void size and differential settlement. This drainage option could be combined with a square abutment face for easier installation.
4. Use a 1 to 2 ft. thick layer of tire chips behind the abutment as an elastic and drainage fill material (Figure 418). This design option provides an elastic zone behind the abutment which allows for lateral abutment movement with temperature changes. Furthermore, it has a very high drainage capacity. The tire chips should be protected with a geotextile filter fabric.
Full-scale implementation of these recommendations may require collaboration between Iowa DOT personnel and a basic policy change, not only in design, but also in planning, construction and administration.

294
IOW
A S
TATE
UN
IVER
SITY
BR
IDG
E A
PPR
OA
CH
SEC
TIO
N
BR
IDG
E D
ECK
SEA
LIN
G S
YST
EM
PRO
JECT
NU
MB
ERPR
OJE
CT
NA
ME
Silic
ofle
x 22
5 in
stal
led
with
Stri
pSe
al L
ocki
ng M
echa
nism
Type
M E
xtru
sion
Silic
ofle
x 22
5 in
stal
led
with
stee
l arm
orin
g
Silic
ofle
x 22
5 in
stal
led
with
Stri
pSe
al L
ocki
ng M
echa
nism
Type
A/E
Ext
rusi
on
Silic
ofle
x 22
5 in
stal
led
with
con
cret
e he
ader
m
ater
ial
Silic
ofle
x A
dhes
ive
Silic
ofle
x G
land
Figure 414. Proposed bridge joint sealing system

295
Figure 415. Proposed surface drainage detail
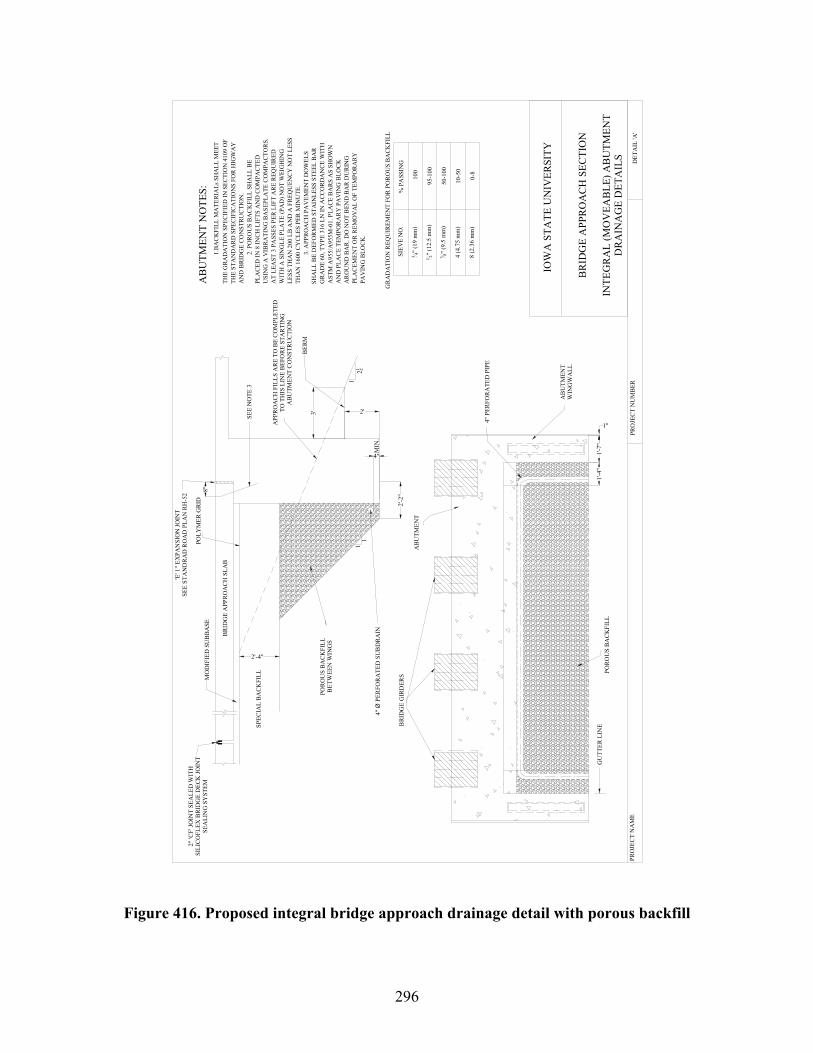
296
MO
DIF
IED
SU
BB
ASE
SEE
NO
TE 3
8"
'E' 1
" EX
PAN
SIO
N JO
INT
SEE
STA
ND
RA
D R
OA
D P
LAN
RH
-52
2" 'C
F' JO
INT
SEA
LED
WIT
H
SILI
CO
FLEX
BR
IDG
E D
ECK
JOIN
T SE
ALI
NG
SY
STEM
4" P
ERFO
RA
TED
PIP
E
1"
1'-7
"1'
-4"
AB
UTM
ENT
AB
UTM
ENT
WIN
GW
ALL
POR
OU
S B
AC
KFI
LLG
UTT
ER L
INEB
RID
GE
GIR
DER
S
0-8
8 (2
.36
mm
)
4 (4
.75
mm
)10
-50
3 8" (9
.5 m
m)
50-1
00
1 2" (1
2.5
mm
)95
-100
34"
(19
mm
)
GR
AD
ATI
ON
REQ
UIR
EMEN
T FO
R P
OR
OU
S B
AC
KFI
LL
SIEV
E N
O.
% P
ASS
ING
100
BER
M
2'-2
"
AB
UTM
ENT
NO
TES:
1.B
AC
KFI
LL M
ATE
RIA
Ls S
HA
LL M
EET
THE
GR
AD
ATI
ON
SPE
CIF
IED
IN S
ECTI
ON
410
9 O
F TH
E ST
AN
DA
RD
SPE
CIF
ICA
TIO
NS
FOR
HIG
WA
Y
AN
D B
RID
GE
CON
STRU
CTI
ON
.2.
PO
RO
US
BA
CK
FILL
SH
ALL
BE
PLA
CED
IN 8
INC
H L
IFTS
AN
D C
OM
PAC
TED
U
SIN
G A
VIB
RA
TIN
G B
ASE
PLA
TE C
OM
PAC
TOR
S.
AT
LEA
ST 3
PA
SSES
PER
LIF
T A
RE R
EQU
IRED
W
ITH
A S
ING
LE P
LATE
(PA
D) N
OT
WEI
GH
ING
LE
SS T
HA
N 2
00 L
B A
ND
A F
REQ
UEN
CY
NO
T LE
SS
THA
N 1
600
CY
CLE
S PE
R M
INU
TE.
3. A
PPR
OA
CH
PA
VEM
ENT
DO
WEL
S SH
ALL
BE
DEF
OR
MED
STA
INLE
SS S
TEEL
BA
R
GR
AD
E 60
, TY
PE 3
16 L
N IN
ACC
OR
DA
NCE
WIT
H
AST
M A
955/
A95
5M-0
1. P
LAC
E B
AR
S A
S SH
OW
N
AN
D P
LAC
E TE
MPO
RA
RY
PA
VIN
G B
LOC
K
AR
OU
ND
BA
R. D
O N
OT
BEN
D B
AR
DU
RIN
G
PLA
CEM
ENT
OR
REM
OV
AL
OF
TEM
POR
AR
Y
PAV
ING
BLO
CK
.
PRO
JEC
T N
AM
EPR
OJE
CT
NU
MB
ERD
ETA
IL 'A
'
BR
IDG
E A
PPR
OA
CH
SEC
TIO
N
INTE
GR
AL
(MO
VEA
BLE
) AB
UTM
ENT
DR
AIN
AG
E D
ETA
ILS
IOW
A S
TATE
UN
IVER
SITY
BR
IDG
E A
PPR
OA
CH
SLA
B
4"
POLY
MER
GRI
D
MIN
.
11
21 2
1
APP
RO
AC
H F
ILLS
AR
E TO
BE
CO
MPL
ETED
TO T
HIS
LIN
E B
EFO
RE
STA
RTI
NG
AB
UTM
ENT
CO
NST
RU
CTI
ON
3' 2'
POR
OU
S B
AC
KFI
LL
BET
WEE
N W
ING
S
4"
Ø P
ERFO
RA
TED
SU
BD
RA
IN
SPEC
IAL
BA
CK
FILL
2'-4"
Figure 416. Proposed integral bridge approach drainage detail with porous backfill
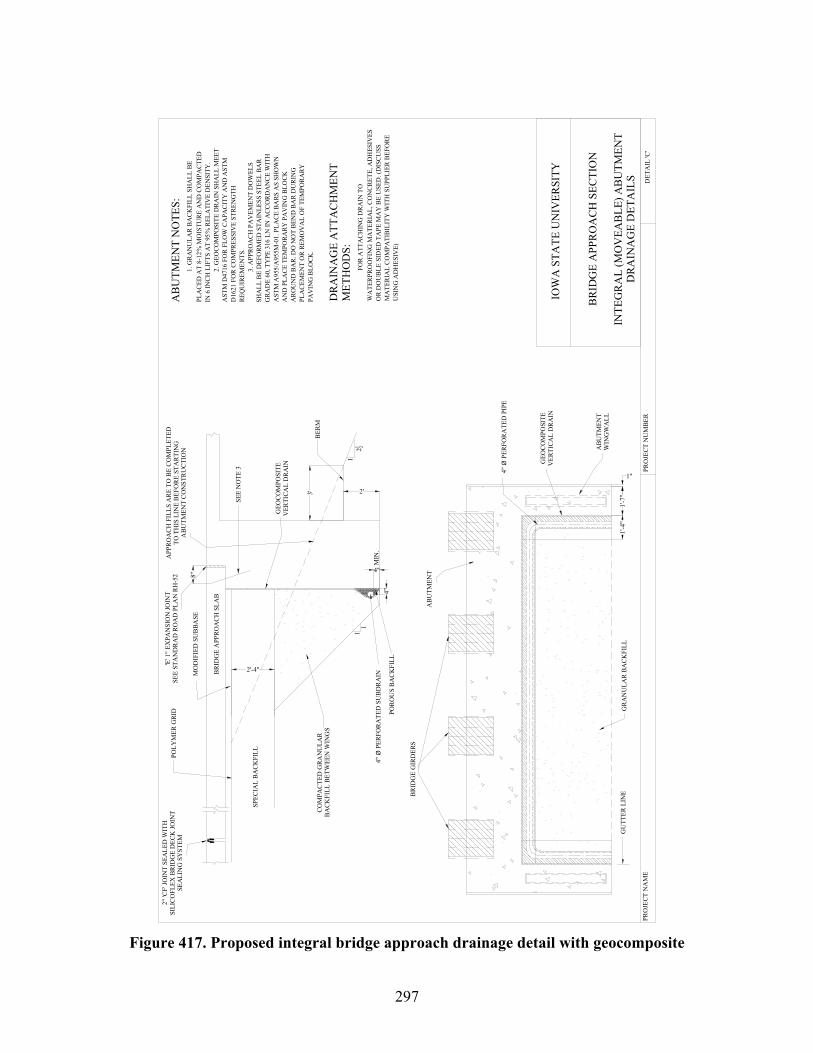
297
POR
OU
S B
AC
KFI
LL
SEE
NO
TE 3
8"
2" 'C
F' JO
INT
SEA
LED
WIT
H
SILI
CO
FLEX
BR
IDG
E D
ECK
JOIN
T SE
ALI
NG
SY
STEM
POLY
MER
GRI
D
GEO
CO
MPO
SITE
V
ERTI
CAL
DR
AIN
BR
IDG
E G
IRD
ERS
GU
TTER
LIN
EG
RA
NU
LAR
BA
CK
FILL
ABU
TMEN
T W
ING
WA
LL
AB
UTM
ENT
1'-4
"1'
-7"
1"
4" Ø
PER
FOR
ATE
D P
IPE
'E' 1
" EX
PAN
SIO
N JO
INT
SEE
STA
ND
RA
D R
OA
D P
LAN
RH
-52
4"
DR
AIN
AG
E A
TTA
CH
MEN
T M
ETH
OD
S:FO
R A
TTA
CH
ING
DR
AIN
TO
W
ATE
RPR
OO
FIN
G M
ATE
RIA
L, C
ON
CRE
TE, A
DH
ESIV
ES
OR
DO
UB
LE S
IDED
TA
PE M
AY
BE
USE
D. (
DIS
CU
SS
MA
TER
IAL
CO
MPA
TIB
ILIT
Y W
ITH
SU
PPLI
ER B
EFO
RE
USI
NG
AD
HES
IVE)
DET
AIL
'C'
IOW
A S
TATE
UN
IVER
SITY
BR
IDG
E A
PPR
OA
CH
SEC
TIO
N
INTE
GR
AL
(MO
VEA
BLE
) AB
UTM
ENT
DR
AIN
AG
E D
ETA
ILS
PRO
JECT
NU
MBE
RPR
OJE
CT N
AM
E
AB
UTM
ENT
NO
TES:
1. G
RA
NU
LAR
BA
CK
FILL
SH
ALL
BE
PLA
CED
AT
8-12
% M
OIS
TUR
E A
ND
CO
MPA
CTE
D
IN 6
INC
H L
IFTS
AT
95%
REL
ATI
VE
DEN
SITY
.2.
GEO
CO
MPO
SITE
DRA
IN S
HA
LL M
EET
AST
M D
4716
FO
R F
LOW
CA
PAC
ITY
AN
D A
STM
D
1621
FO
R C
OM
PRES
SIV
E ST
REN
GTH
RE
QU
IREM
ENTS
.3.
APP
RO
AC
H P
AV
EMEN
T D
OW
ELS
SHA
LL B
E D
EFO
RMED
STA
INLE
SS S
TEEL
BA
R G
RAD
E 60
, TY
PE 3
16 L
N IN
AC
CO
RDA
NC
E W
ITH
A
STM
A95
5/A
955M
-01.
PLA
CE
BARS
AS
SHO
WN
A
ND
PLA
CE
TEM
POR
ARY
PA
VIN
G B
LOCK
A
RO
UN
D B
AR
. DO
NO
T B
END
BA
R D
UR
ING
PL
AC
EMEN
T O
R R
EMO
VA
L O
F TE
MPO
RA
RY
PAV
ING
BLO
CK.
4"
GEO
CO
MPO
SITE
V
ERTI
CAL
DR
AIN
BER
M
BR
IDG
E A
PPR
OA
CH
SLA
B
MO
DIF
IED
SU
BBA
SE
MIN
.
11
21 2
1
APP
RO
AC
H F
ILLS
AR
E TO
BE
CO
MPL
ETED
TO T
HIS
LIN
E BE
FOR
E ST
AR
TIN
GA
BUTM
ENT
CO
NST
RU
CTI
ON
3' 2'
CO
MPA
CTE
D G
RAN
ULA
R
BA
CK
FILL
BET
WEE
N W
ING
S
4"
Ø P
ERFO
RA
TED
SU
BD
RA
IN
SPEC
IAL
BA
CK
FILL
2'-4"
Figure 417. Proposed integral bridge approach drainage detail with geocomposite
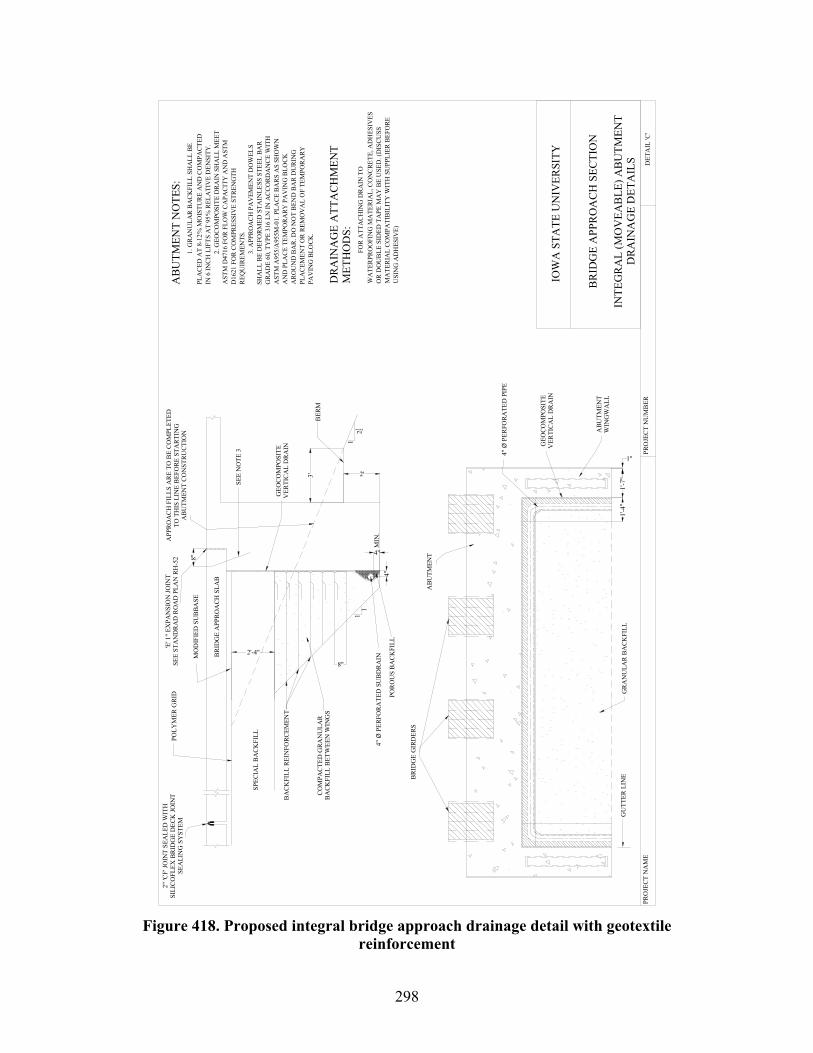
298
BA
CK
FILL
REI
NFO
RCEM
ENT
8"
POR
OU
S B
AC
KFI
LL
SEE
NO
TE 3
8"
2" 'C
F' JO
INT
SEA
LED
WIT
H
SILI
CO
FLEX
BR
IDG
E D
ECK
JOIN
T SE
ALI
NG
SY
STEM
POLY
MER
GRI
D
GEO
CO
MPO
SITE
V
ERTI
CA
L D
RA
IN
BR
IDG
E G
IRD
ERS
GU
TTER
LIN
EG
RA
NU
LAR
BA
CK
FILL
ABU
TMEN
T W
ING
WA
LL
ABU
TMEN
T
1'-4
"1'
-7"
1"
4" Ø
PER
FORA
TED
PIP
E
'E' 1
" EX
PAN
SIO
N JO
INT
SEE
STA
ND
RA
D R
OA
D P
LAN
RH
-52
4"
DR
AIN
AG
E A
TTA
CH
MEN
T M
ETH
OD
S:FO
R A
TTA
CH
ING
DR
AIN
TO
W
ATE
RPR
OO
FIN
G M
ATE
RIA
L, C
ON
CRE
TE, A
DH
ESIV
ES
OR
DO
UB
LE S
IDED
TA
PE M
AY
BE
USE
D. (
DIS
CU
SS
MA
TER
IAL
CO
MPA
TIB
ILIT
Y W
ITH
SU
PPLI
ER B
EFO
RE
USI
NG
AD
HES
IVE)
DET
AIL
'C'
IOW
A S
TATE
UN
IVER
SITY
BR
IDG
E A
PPR
OA
CH
SEC
TIO
N
INTE
GR
AL
(MO
VEA
BLE
) AB
UTM
ENT
DR
AIN
AG
E D
ETA
ILS
PRO
JEC
T N
UM
BER
PRO
JECT
NA
ME
AB
UTM
ENT
NO
TES:
1. G
RA
NU
LAR
BA
CK
FILL
SH
ALL
BE
PLA
CED
AT
8-12
% M
OIS
TUR
E A
ND
CO
MPA
CTED
IN
6 IN
CH
LIF
TS A
T 95
% R
ELA
TIV
E D
ENSI
TY.
2. G
EOC
OM
POSI
TE D
RAIN
SH
ALL
MEE
T A
STM
D47
16 F
OR
FLO
W C
APA
CIT
Y A
ND
AST
M
D16
21 F
OR
CO
MPR
ESSI
VE
STRE
NG
TH
REQ
UIR
EMEN
TS.
3. A
PPR
OA
CH
PA
VEM
ENT
DO
WEL
S SH
ALL
BE
DEF
ORM
ED S
TAIN
LESS
STE
EL B
AR
GRA
DE
60, T
YPE
316
LN
IN A
CC
ORD
AN
CE
WIT
H
AST
M A
955/
A95
5M-0
1. P
LACE
BA
RS
AS
SHO
WN
A
ND
PLA
CE
TEM
POR
ARY
PA
VIN
G B
LOCK
A
RO
UN
D B
AR
. DO
NO
T B
END
BA
R D
UR
ING
PL
AC
EMEN
T O
R R
EMO
VA
L O
F TE
MPO
RA
RY
PAV
ING
BLO
CK.
4"
GEO
CO
MPO
SITE
V
ERTI
CA
L D
RA
IN
BER
M
BR
IDG
E A
PPR
OA
CH S
LAB
MO
DIF
IED
SU
BBA
SE
MIN
.
11
21 2
1
APP
ROA
CH
FIL
LS A
RE
TO B
E CO
MPL
ETED
TO T
HIS
LIN
E B
EFO
RE S
TART
ING
AB
UTM
ENT
CO
NST
RUCT
ION
3' 2'
CO
MPA
CTE
D G
RAN
ULA
R
BA
CK
FILL
BET
WEE
N W
ING
S
4"
Ø P
ERFO
RA
TED
SU
BD
RA
IN
SPEC
IAL
BA
CK
FILL
2'-4"
Figure 418. Proposed integral bridge approach drainage detail with geotextile
reinforcement
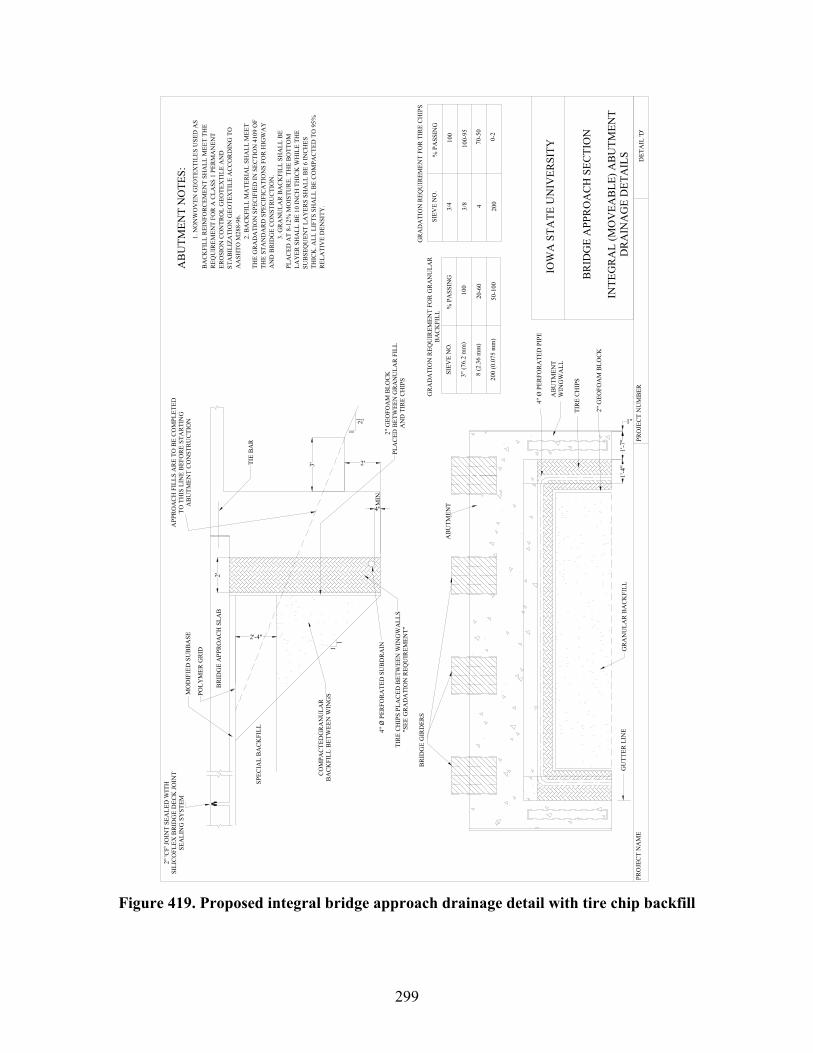
299
2'
TIE
BA
R
2" 'C
F' JO
INT
SEA
LED
WIT
H
SILI
CO
FLEX
BR
IDG
E D
ECK
JOIN
T SE
ALI
NG
SY
STEM
MO
DIF
IED
SU
BB
ASE
200
(0.0
75 m
m)
50-1
00
8 (2
.36
mm
)20
-60
3" (7
6.2
mm
)
GR
AD
ATI
ON
REQ
UIR
EMEN
T FO
R G
RA
NU
LAR
B
AC
KFI
LL
SIEV
E N
O.
% P
ASS
ING
100
4" Ø
PER
FOR
ATE
D P
IPE
2" G
EOFO
AM
BLO
CK
BR
IDG
E G
IRD
ERS
1"
1'-7
"1'
-4"
AB
UTM
ENT
AB
UTM
ENT
WIN
GW
ALL
GR
AN
ULA
R B
AC
KFI
LLG
UTT
ER L
INE
TIR
E C
HIP
S
20043/8
3/4
0-2
70-5
0
100-
95
100
% P
ASS
ING
SIEV
E N
O.
GR
AD
ATI
ON
REQ
UIR
EMEN
T FO
R T
IRE
CH
IPS
PRO
JEC
T N
AM
EPR
OJE
CT
NU
MB
ERD
ETA
IL 'D
'
BR
IDG
E A
PPR
OA
CH
SEC
TIO
N
INTE
GR
AL
(MO
VEA
BLE
) AB
UTM
ENT
DR
AIN
AG
E D
ETA
ILS
IOW
A S
TATE
UN
IVER
SITY
AB
UTM
ENT
NO
TES:
1. N
ON
WO
VEN
GEO
TEX
TILE
S U
SED
AS
BA
CK
FILL
REI
NFO
RC
EMEN
T SH
ALL
MEE
T TH
E R
EQU
IREM
ENT
FOR
A C
LASS
1 P
ERM
AN
ENT
ERO
SIO
N C
ON
TRO
L G
EOTE
XTI
LE A
ND
ST
AB
ILIZ
ATI
ON
GEO
TEX
TILE
AC
CO
RD
ING
TO
A
ASH
TO M
288-
96.
2. B
AC
KFI
LL M
ATE
RIA
L SH
ALL
MEE
T TH
E G
RA
DA
TIO
N S
PEC
IFIE
D IN
SEC
TIO
N 4
109
OF
THE
STA
ND
AR
D S
PEC
IFIC
ATI
ON
S FO
R H
IGW
AY
A
ND
BR
IDG
E C
ON
STR
UC
TIO
N.
3. G
RA
NU
LAR
BA
CK
FILL
SH
ALL
BE
PLA
CED
AT
8-12
% M
OIS
TUR
E. T
HE
BO
TTO
M
LAY
ER S
HA
LL B
E 10
INC
H T
HIC
K W
HIL
E TH
E SU
BSE
QU
ENT
LAY
ERS
SHA
LL B
E 6
INC
HES
TH
ICK
. ALL
LIF
TS S
HA
LL B
E C
OM
PAC
TED
TO
95%
R
ELA
TIV
E D
ENSI
TY.
2" G
EOFO
AM
BLO
CK
PLA
CED
BET
WEE
N G
RA
NU
LAR
FIL
L
AN
D T
IRE
CH
IPS
TIR
E C
HIP
S PL
AC
ED B
ETW
EEN
WIN
GW
ALL
S "S
EE G
RA
DA
TIO
N R
EQU
IREM
ENT"
BR
IDG
E A
PPR
OA
CH
SLA
B
4"
POLY
MER
GR
ID
MIN
.
11
21 2
1
APP
RO
AC
H F
ILLS
AR
E TO
BE
CO
MPL
ETED
TO T
HIS
LIN
E B
EFO
RE
STA
RTI
NG
AB
UTM
ENT
CO
NST
RU
CTI
ON
3' 2'
CO
MPA
CTE
DG
RA
NU
LAR
B
AC
KFI
LL B
ETW
EEN
WIN
GS
4"
Ø P
ERFO
RA
TED
SU
BD
RA
IN
SPEC
IAL
BA
CK
FILL
2'-4"
Figure 419. Proposed integral bridge approach drainage detail with tire chip backfill

300
REFERENCES
Abu-Hejleh, N, Wang, T, and Zornberg, J. G. (2000). “Performance of Geosynthetic-Reinforced Walls Supporting Bridge and Approaching Roadway Structure”. GeoDenver 200 Congress, Denver, Co. PP 218-243. ACI Committee 318. (2002). Building Code Requirements for Structural Concrete, (ACI 318-02). American Concrete Institute, Detroit. American Association of State Highway and Transportation Officials. (1983). AASHTO Standard Specifications for Highway Bridges, 13th Ed. AASHTO, Washington, D.C. ANSYS. (1992). Reference Manual, Version 5.7. Swanson Analysis Systems, Inc. Houston, PA. Ardani, A. (1987). “Bridge Approach Settlement”, Report No. CDOT-DTP-R-87-06, Colorado Department of Highways, Denver, Co. Arsoy, S., Barker, R.M. and Duncan, J.M. (1999). “The behavior of Integral Abutment Bridges (Final Report)”. Virginia Transportation Research Council, Report No. FHWA/VTRC00-CR3. Arsoy, S., Duncan, J.M. and Barker, R.M. (2002). Performance of Piles Supporting Integral Bridges. Transportation Research Record 1808, Washington, D.C. ASTM D 2434-68, 2000. Standard Test Method for Permeability of Granular Soils (Constant Head). American Standard Testing Methods. ASTM D2487, 2000. Standard Test Method for Classification of Soils for Engineering Purposes. American Standard Testing Methods. ASTM D4253, 2000. Maximum Index Density of Soils Using a Vibratory Table. American Standard Testing Methods. ASTM D6951, 2003. Standard Test Method for Use of the Dynamic Cone Penetrometer in Shallow Pavement Applications. American Standard Testing Methods. Bozozuk, M. (1978).Bridge Foundation move. Transportation Research Record 678, Washington, D.C. Bozozuk, M. and Lo, K.Y (1976). Settlement analysis of the Gloucester Test Fill, Canadian Geotechnical Journal, Vol. 13, No. 4. Brakke, B. (2003). Personal Communication. Department of Transportation, Ames, Iowa. Briaud, J.L., James, R.W., and Hoffman, S.B. (1997). NCHRP synthesis 234: settlement of Bridge Approaches (the bump at the end of the bridge), Transportation Research Board, National Research Council, Washington, D.C. 71 pp.

301
CAST - Computer Aided Strut-and-Tie. (2000). Strut-and-Tie Resource Web Site (http://cee.uiuc.edu/kuchma/strut_and_tie/). University of Illinois, Urbana-Champaign. Cheny, R., and Chassie, R. (1982). “Soil and Foundation Workshop Manual”. Federal Highway Administration, Washington, D.C. PP 113-115. Chetlur S. (2004) Failure Investigation of the Pavement Notch in Iowa Bridges. MS Research Report, Department of Civil, Construction and Environmental Engineering, Ames, IA. Clarke, S. N, Deatherage, J. H., GoodPasture, D. W., and Burdette, E. (1998). Influence of Bridge approach, surface Condition, and Velocity on impact Factors for Fatigue-Prone Details. Transportation Research Record 1624, Washington D.C. PP 166-179. Das, B.M. (1998). Principles of Geotechnical Engineering, 4th Edition PWS Publishing Company, Boston 697pp. Das, S. C. Bakeer, R. Zhong, J. Schutt, M. (1999). “Assessment of Mitigation Embankment Settlement with Pile Supported Approach Slabs”. Louisiana Transportation and Research Center. DiMillio, A.F. (1982). “Performance of Highway Bridge Abutments Supported by Spread Footings on Compacted Fill”. Final Report No. FHWA/RD-81/184, Federal Highway Administration, Washington, D.C. Dunn, K. H. Anderson, G.H. Rodes, T.H., and Zieher, J.J. (1983). “ Performance Evaluation of Bridge Approaches”. Wisconsin Department of Transportation. Edgar, T. V., Puckett, J. A., and D’Spain, R. B. (1989). Effect of Geotextile on Lateral Pressure and Deformation in Highway Embankments. Geotextiles and Geomembranes, Vol. 8, No. 4, PP 275-306. Edgar, T.V., Puckett, J.A and D’Spain, R.B. (1988). “Lateral Load Reduction on Bridge Abutment Walls”. University of Wyoming. Girton, D.D, Hawkinson, T.R and Greimann, L.F. (1991). Validation of Design Recommendations for Integral-Abutment Piles. Journal of Structural Engineering, Vol. 117, No. 7. Greimann, l. F., Abendroth, R.E., Johnson, D.E. and Ebner, P.B. (1987). Pile Design and Tests for Integral Abutment Bridges, Iowa State University. Greimann, L.F., Wolde-Tinsae, A.M. and Yang, P.S. (1983) Skewed bridges with integral abutments, Transportation Research Record, 903. Greimann, l. F., Yang, Pe-Shen, Wolde-Tinsae, and made M. (1986). Nonlinear Analysis of Integral Abutment Bridges. Journal of Structural Engineering, Vol. 112, No. 10, PP 2263-2280. Grover, R. A. (1978). Movement of Bridge Abutments and Settlements of Approach Pavements in Ohio. Transportation Research Record 678, Washington ,D.C.

302
Hilf, J. W. (1991). "Compacted Fill." Foundation Engineering Handbook, Fang, H.-Y., ed., 2nd Edition, Van Nostrand Reinhold. Holtz, R. (1982). Treatment of Problem Foundation for Highway Embankments. Transportation Research Board, Washington, D.C. Hopkins, T.C. (1973). “Settlement of Highway Bridge Approaches and Embankment Foundation”. Kentucky Department of Transportation. Hopkins, T.C. (1985). “Long-Term Movements of Highway Bridge Approach Embankments and Pavements”. University of Kentucky, Transportation Research Program. Hopkins, T.C. and Scott, G.D. (1970). Estimated and Observed Settlements of Bridge Approaches. Highway Research Record 302, Washington D.C. Hoppe, E.J (1999). “Guidelines for the Use, Design, and Construction of Bridge Approach Slabs”. Virginia Transportation Research Council, VTRC00-R4. Hoppe, E.J. and Gomez, J.P (1996). “Field Study of an Integral Backfill Bridge”. Virginia Transportation Research council, VTRC 97-R7. Horvath, J. (2000). “Integral Abutment Bridges: Problem and Innovative Solutions Using EPS Geofoam and other Geosynthetics”. Manhattan College Research Report No. CE/GE-00-2 Horvath, J. S. (1991). Using Geosynthetics to Reduce Surcharge-Induced Stresses on Rigid Earth Retaining Structures. Transportation Research Record 1330, PP 47-53. Iowa Department of Transportation (2004). www.dot.state.ia.us. Accessed January 2004. Kunin, J., and Alampalli, S. (2000). Integral Abutment Bridges: Current Practice in United States and Canada. ASCE Journal of Performance of Constructed Facilities, Vol. 14, No. 3, PP 104-111. Laguros, J. G., Zaman, M. M., and Mahmood, I. U. (1990a). “Evaluation of Causes of Excessive Settlements of Pavements Behind Bridge Abutments and their Remedies; Phase II. (Executive Summary)”. Oklahoma Department of Transportation, Report No. FHWA/OK 89 (07). Laguros, J. G., Zaman, M. M., and Mahmood, I. U. (1990b). “Evaluation of Causes of Excessive Settlements of Pavements Behind Bridge Abutments and their Remedies; Phase I”. University of Oklahoma. Lawver, A., French, C. and Shield, C.K. (2000). Field Performance of Integral Abutment Bridges. Transportation Research Record 1740, Washington D.C. Lin, k. Q., and Wong, I. H. (1999). Use of Deep Cement Mixing To Produce Settlement Bridge Approaches. Journal of Geotechnical and Geoenvironmental Engineering, Vol. 125, No. 4, PP 309-320. Long, J.H., Olson, S.M, and Stark, T.D. (1998). Differential Movement at Embankment/Bridge
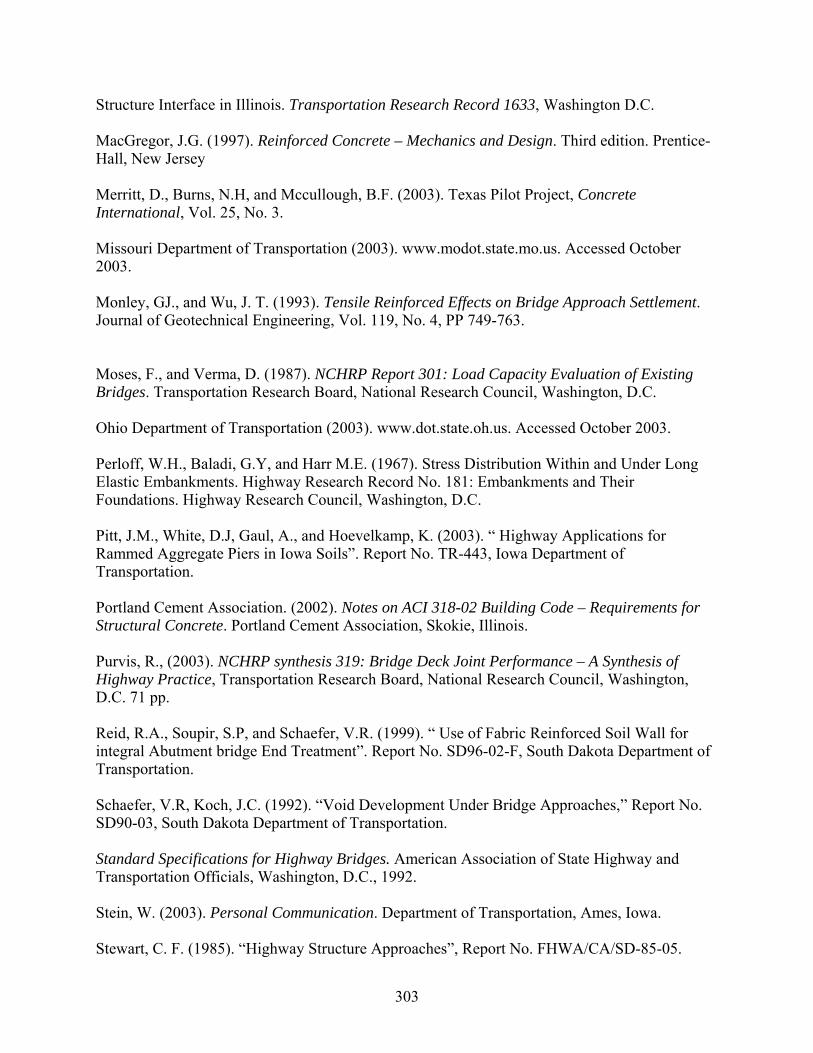
303
Structure Interface in Illinois. Transportation Research Record 1633, Washington D.C. MacGregor, J.G. (1997). Reinforced Concrete – Mechanics and Design. Third edition. Prentice-Hall, New Jersey Merritt, D., Burns, N.H, and Mccullough, B.F. (2003). Texas Pilot Project, Concrete International, Vol. 25, No. 3. Missouri Department of Transportation (2003). www.modot.state.mo.us. Accessed October 2003. Monley, GJ., and Wu, J. T. (1993). Tensile Reinforced Effects on Bridge Approach Settlement. Journal of Geotechnical Engineering, Vol. 119, No. 4, PP 749-763. Moses, F., and Verma, D. (1987). NCHRP Report 301: Load Capacity Evaluation of Existing Bridges. Transportation Research Board, National Research Council, Washington, D.C. Ohio Department of Transportation (2003). www.dot.state.oh.us. Accessed October 2003. Perloff, W.H., Baladi, G.Y, and Harr M.E. (1967). Stress Distribution Within and Under Long Elastic Embankments. Highway Research Record No. 181: Embankments and Their Foundations. Highway Research Council, Washington, D.C. Pitt, J.M., White, D.J, Gaul, A., and Hoevelkamp, K. (2003). “ Highway Applications for Rammed Aggregate Piers in Iowa Soils”. Report No. TR-443, Iowa Department of Transportation. Portland Cement Association. (2002). Notes on ACI 318-02 Building Code – Requirements for Structural Concrete. Portland Cement Association, Skokie, Illinois. Purvis, R., (2003). NCHRP synthesis 319: Bridge Deck Joint Performance – A Synthesis of Highway Practice, Transportation Research Board, National Research Council, Washington, D.C. 71 pp. Reid, R.A., Soupir, S.P, and Schaefer, V.R. (1999). “ Use of Fabric Reinforced Soil Wall for integral Abutment bridge End Treatment”. Report No. SD96-02-F, South Dakota Department of Transportation. Schaefer, V.R, Koch, J.C. (1992). “Void Development Under Bridge Approaches,” Report No. SD90-03, South Dakota Department of Transportation. Standard Specifications for Highway Bridges. American Association of State Highway and Transportation Officials, Washington, D.C., 1992. Stein, W. (2003). Personal Communication. Department of Transportation, Ames, Iowa. Stewart, C. F. (1985). “Highway Structure Approaches”, Report No. FHWA/CA/SD-85-05.
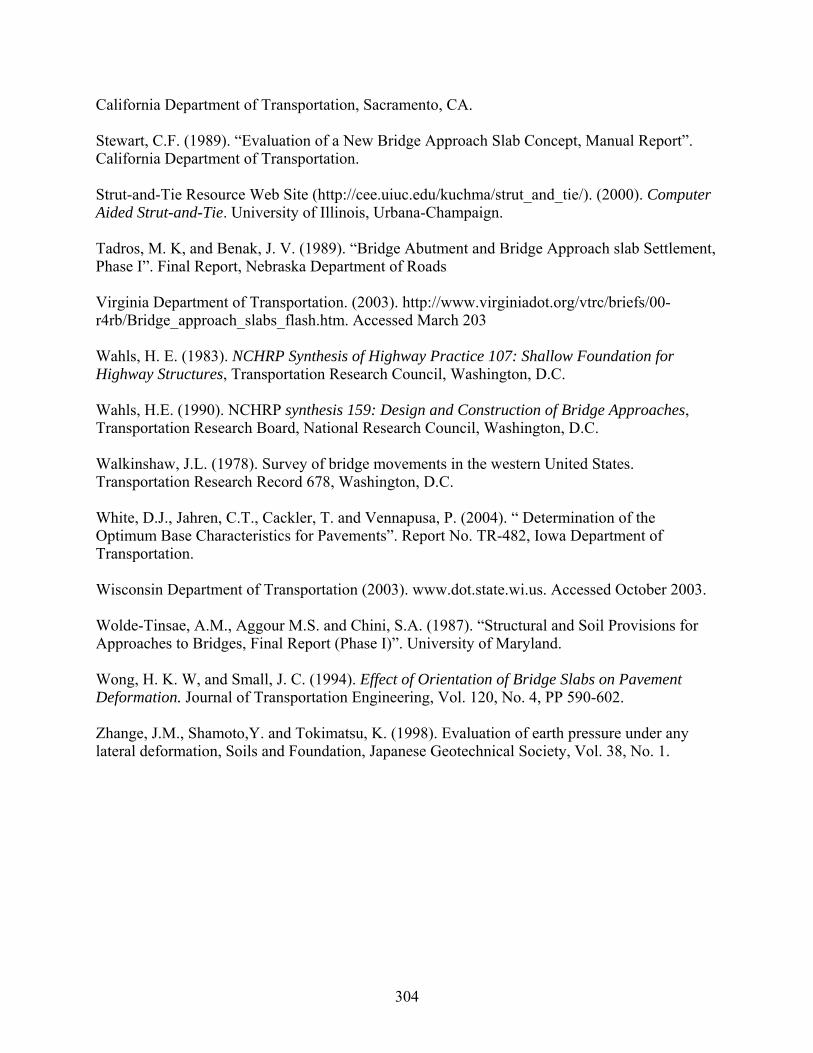
304
California Department of Transportation, Sacramento, CA. Stewart, C.F. (1989). “Evaluation of a New Bridge Approach Slab Concept, Manual Report”. California Department of Transportation. Strut-and-Tie Resource Web Site (http://cee.uiuc.edu/kuchma/strut_and_tie/). (2000). Computer Aided Strut-and-Tie. University of Illinois, Urbana-Champaign. Tadros, M. K, and Benak, J. V. (1989). “Bridge Abutment and Bridge Approach slab Settlement, Phase I”. Final Report, Nebraska Department of Roads Virginia Department of Transportation. (2003). http://www.virginiadot.org/vtrc/briefs/00-r4rb/Bridge_approach_slabs_flash.htm. Accessed March 203 Wahls, H. E. (1983). NCHRP Synthesis of Highway Practice 107: Shallow Foundation for Highway Structures, Transportation Research Council, Washington, D.C. Wahls, H.E. (1990). NCHRP synthesis 159: Design and Construction of Bridge Approaches, Transportation Research Board, National Research Council, Washington, D.C. Walkinshaw, J.L. (1978). Survey of bridge movements in the western United States. Transportation Research Record 678, Washington, D.C. White, D.J., Jahren, C.T., Cackler, T. and Vennapusa, P. (2004). “ Determination of the Optimum Base Characteristics for Pavements”. Report No. TR-482, Iowa Department of Transportation. Wisconsin Department of Transportation (2003). www.dot.state.wi.us. Accessed October 2003. Wolde-Tinsae, A.M., Aggour M.S. and Chini, S.A. (1987). “Structural and Soil Provisions for Approaches to Bridges, Final Report (Phase I)”. University of Maryland. Wong, H. K. W, and Small, J. C. (1994). Effect of Orientation of Bridge Slabs on Pavement Deformation. Journal of Transportation Engineering, Vol. 120, No. 4, PP 590-602. Zhange, J.M., Shamoto,Y. and Tokimatsu, K. (1998). Evaluation of earth pressure under any lateral deformation, Soils and Foundation, Japanese Geotechnical Society, Vol. 38, No. 1.
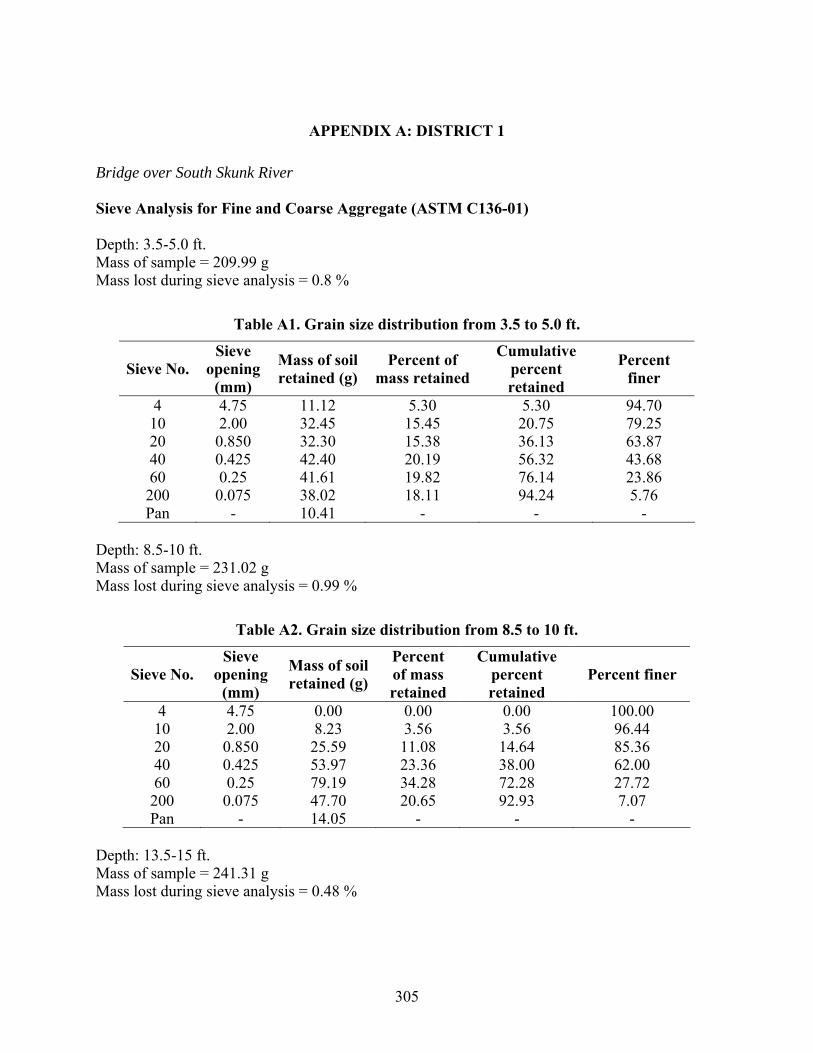
305
APPENDIX A: DISTRICT 1
Bridge over South Skunk River Sieve Analysis for Fine and Coarse Aggregate (ASTM C136-01) Depth: 3.5-5.0 ft. Mass of sample = 209.99 g Mass lost during sieve analysis = 0.8 %
Table A1. Grain size distribution from 3.5 to 5.0 ft.
Sieve No. Sieve
opening (mm)
Mass of soil retained (g)
Percent of mass retained
Cumulative percent retained
Percent finer
4 4.75 11.12 5.30 5.30 94.70 10 2.00 32.45 15.45 20.75 79.25 20 0.850 32.30 15.38 36.13 63.87 40 0.425 42.40 20.19 56.32 43.68 60 0.25 41.61 19.82 76.14 23.86 200 0.075 38.02 18.11 94.24 5.76 Pan - 10.41 - - -
Depth: 8.5-10 ft. Mass of sample = 231.02 g Mass lost during sieve analysis = 0.99 %
Table A2. Grain size distribution from 8.5 to 10 ft.
Sieve No. Sieve
opening (mm)
Mass of soil retained (g)
Percent of mass retained
Cumulative percent retained
Percent finer
4 4.75 0.00 0.00 0.00 100.00 10 2.00 8.23 3.56 3.56 96.44 20 0.850 25.59 11.08 14.64 85.36 40 0.425 53.97 23.36 38.00 62.00 60 0.25 79.19 34.28 72.28 27.72 200 0.075 47.70 20.65 92.93 7.07 Pan - 14.05 - - -
Depth: 13.5-15 ft. Mass of sample = 241.31 g Mass lost during sieve analysis = 0.48 %

306
Table A3. Grain size distribution from 13.5 to 15 ft.
Sieve No. Sieve
opening (mm)
Mass of soil retained (g)
Percent of mass
retained
Cumulative percent retained
Percent finer
4 4.75 2.15 0.89 0.89 99.11 10 2.00 2.93 1.21 2.11 97.89 20 0.850 19.33 8.01 10.12 89.88 40 0.425 72.28 29.95 40.07 59.93 60 0.25 80.04 33.17 73.24 26.76 200 0.075 49.21 20.39 93.63 6.37 Pan - 14.22 - - -
Depth: 33.5-35.0 ft. Mass of sample = 242.83 g Mass lost during sieve analysis = 0.40 %
Table A4. Grain size distribution from 33.5 to 35 ft.
Sieve No. Sieve
opening (mm)
Mass of soil retained (g)
Percent of mass
retained
Cumulative percent retained
Percent finer
4 4.75 25.20 10.38 10.38 89.62 10 2.00 33.38 13.75 24.12 75.88 20 0.850 47.90 19.73 43.85 56.15 40 0.425 74.17 30.54 74.39 25.61 60 0.25 36.98 15.23 89.62 10.38 200 0.075 18.03 7.42 97.05 2.95 Pan - 6.20 - - -
Depth: 38.5-40 ft. Mass of sample = 78.4 g Mass lost during sieve analysis = 0.75%
Table A5. Grain size distribution from 38.5 to 40 ft.
Sieve No. Sieve
opening (mm)
Mass of soil retained (g)
Percent of mass
retained
Cumulative percent retained
Percent finer
4 4.75 44.98 57.37 57.37 42.63 10 2.00 19.70 25.13 82.50 17.50 20 0.850 10.39 13.25 95.75 4.25 40 0.425 1.50 1.91 97.67 2.33 60 0.25 0.67 0.85 98.52 1.48 200 0.075 0.40 0.51 99.03 0.97 Pan - 0.17 - - -

307
Depth: 43.5-45 ft. Mass of sample = 168.2 g Mass lost during sieve analysis = 0.17 %
Table A6. Grain size distribution from 43.5 to 45 ft.
Sieve No. Sieve
opening (mm)
Mass of soil retained (g)
Percent of mass
retained
Cumulative percent retained
Percent finer
4 4.75 16.25 9.66 9.66 90.34 10 2.00 40.15 23.87 33.53 66.47 20 0.850 61.76 36.72 70.25 29.75 40 0.425 25.22 14.99 85.24 14.76 60 0.25 15.13 9.00 94.24 5.76 200 0.075 8.90 5.29 99.53 0.47 Pan - 0.51 - - -
Water Content Determination (ASTM D2216)
Table A7. Variation of moisture content with depth
Depth (ft) Mass of can (g) 17.12 Mass of can + wet soil (g) 267.44
Mass of can + dry soil (g) 233.58Mass of moisture (g) 33.86 Mass of dry soil (g) 216.46
3.5 - 5
Moisture content (%) 15.64 Mass of can (g) 17.20 Mass of can + wet soil (g) 290.16
Mass of can + dry soil (g) 259.40Mass of moisture (g) 30.76 Mass of dry soil (g) 242.20
8.5 - 10
Moisture content (%) 12.70 Mass of can (g) 16.10 Mass of can + wet soil (g) 278.87
Mass of can + dry soil (g) 248.56Mass of moisture (g) 30.31 Mass of dry soil (g) 232.46
13.5 - 15.0
Moisture content (%) 13.03
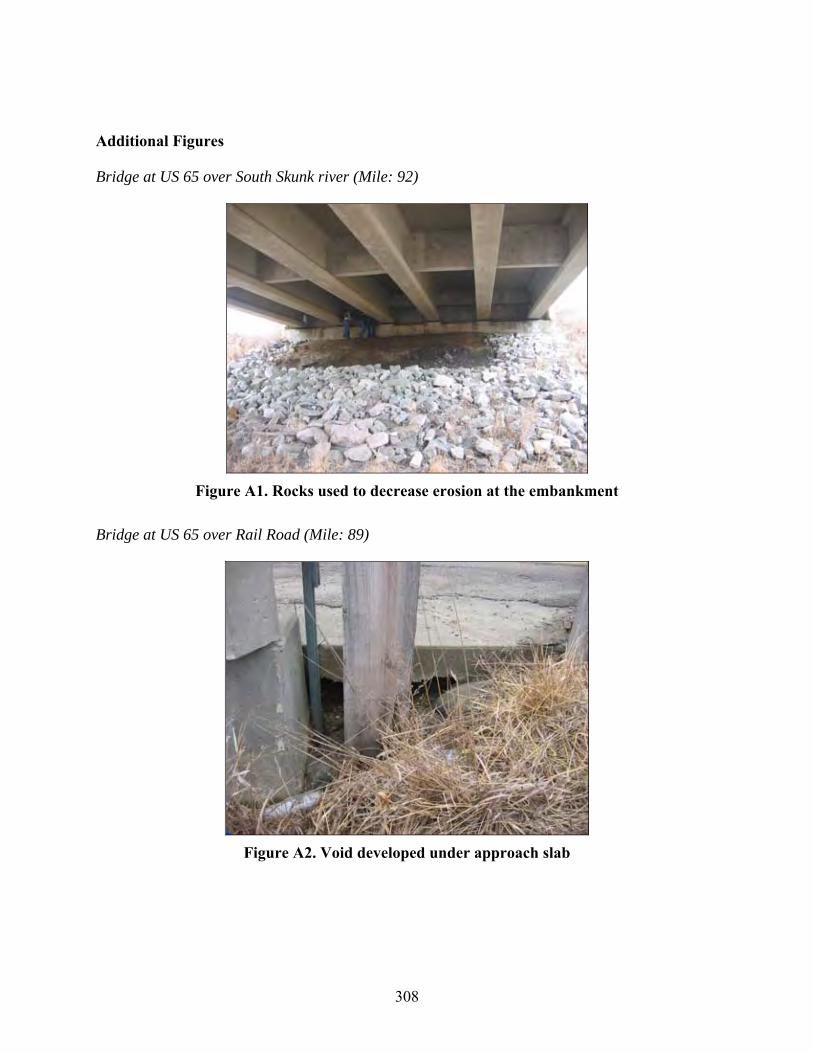
308
Additional Figures Bridge at US 65 over South Skunk river (Mile: 92)
Figure A1. Rocks used to decrease erosion at the embankment
Bridge at US 65 over Rail Road (Mile: 89)
Figure A2. Void developed under approach slab
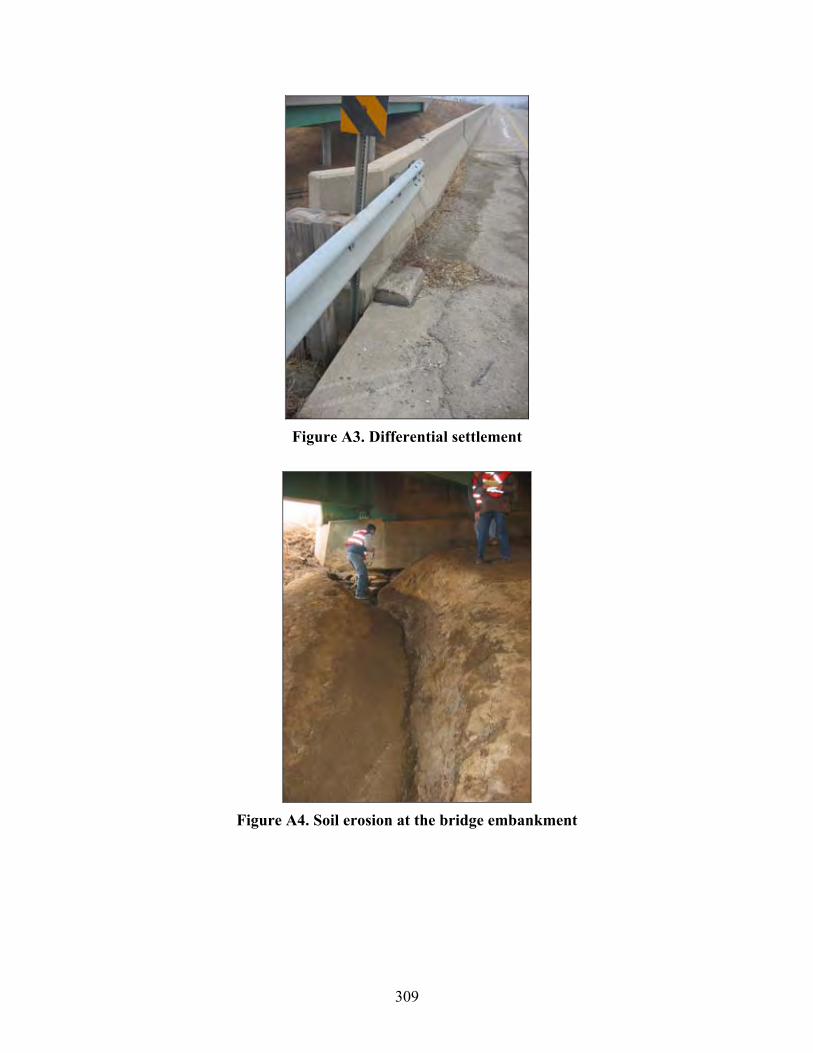
309
Figure A3. Differential settlement
Figure A4. Soil erosion at the bridge embankment

310
Bridge at US 65 over 163
Figure A5. Cracks near the expansion joint
Bridge at US 65 over Pleasant Hill Road
Figure A6. Void developed under the approach slab
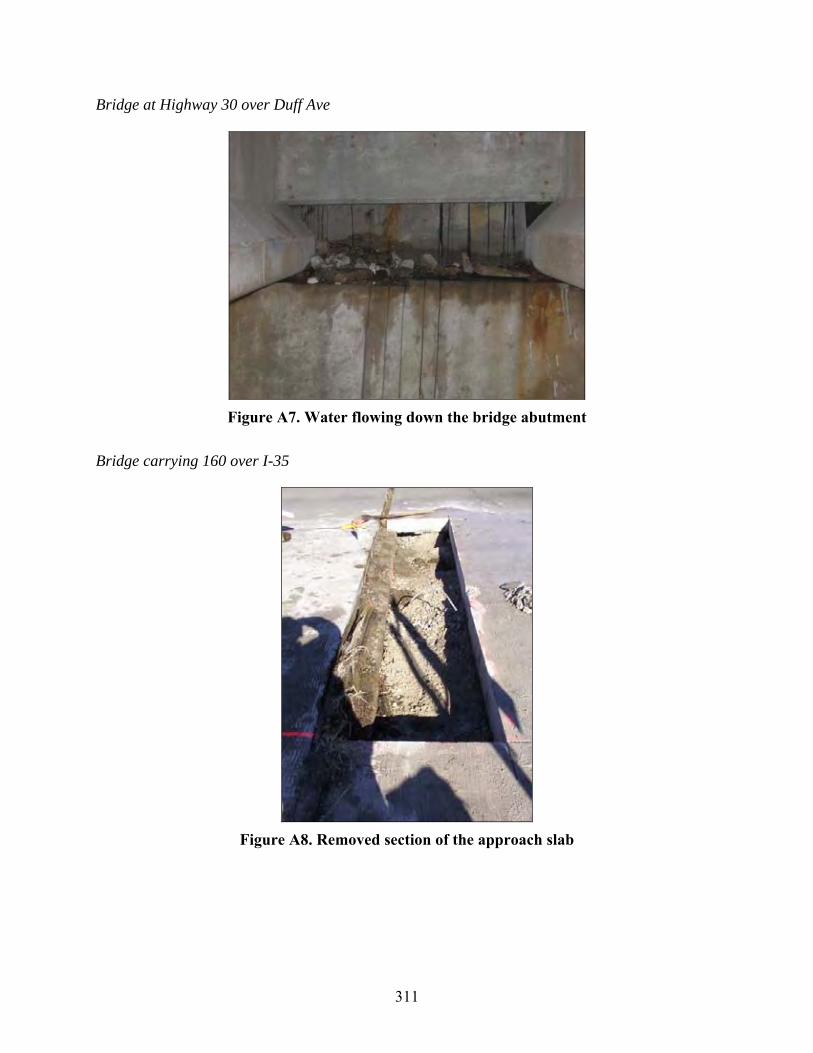
311
Bridge at Highway 30 over Duff Ave
Figure A7. Water flowing down the bridge abutment
Bridge carrying 160 over I-35
Figure A8. Removed section of the approach slab
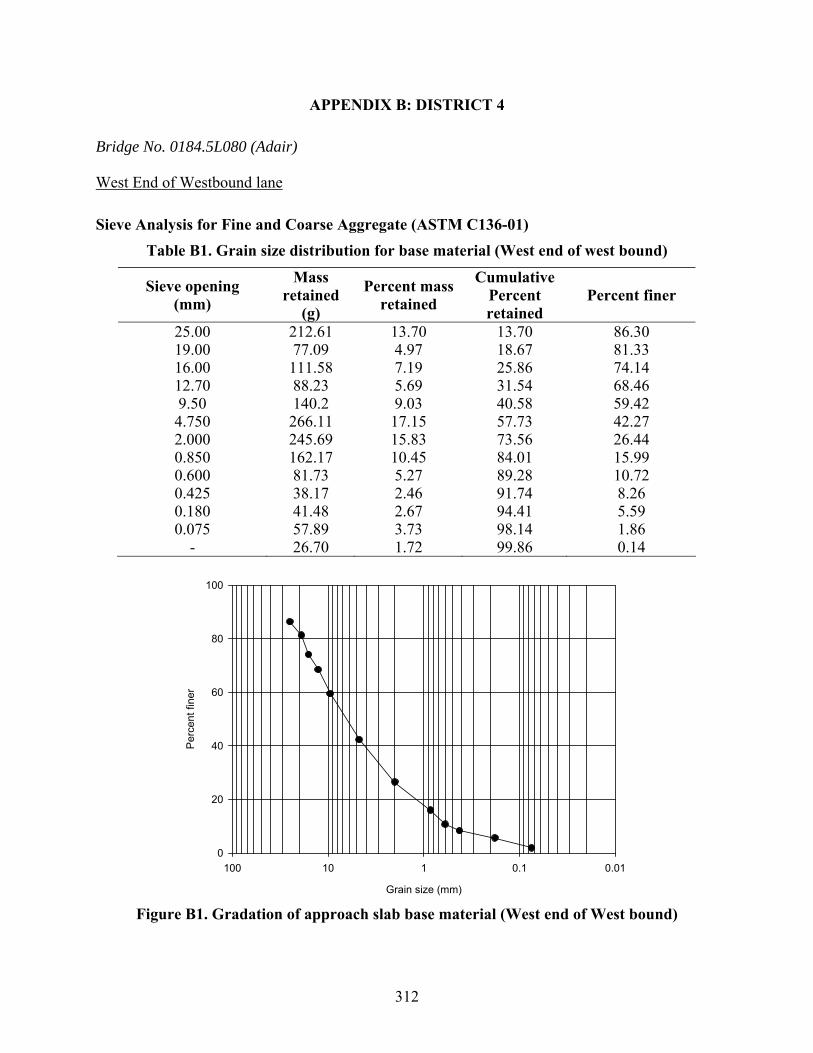
312
APPENDIX B: DISTRICT 4
Bridge No. 0184.5L080 (Adair) West End of Westbound lane
Sieve Analysis for Fine and Coarse Aggregate (ASTM C136-01) Table B1. Grain size distribution for base material (West end of west bound)
Sieve opening (mm)
Mass retained
(g)
Percent mass retained
Cumulative Percent retained
Percent finer
25.00 212.61 13.70 13.70 86.30 19.00 77.09 4.97 18.67 81.33 16.00 111.58 7.19 25.86 74.14 12.70 88.23 5.69 31.54 68.46 9.50 140.2 9.03 40.58 59.42 4.750 266.11 17.15 57.73 42.27 2.000 245.69 15.83 73.56 26.44 0.850 162.17 10.45 84.01 15.99 0.600 81.73 5.27 89.28 10.72 0.425 38.17 2.46 91.74 8.26 0.180 41.48 2.67 94.41 5.59 0.075 57.89 3.73 98.14 1.86
- 26.70 1.72 99.86 0.14
Grain size (mm)
0.010.1110100
Per
cent
fine
r
0
20
40
60
80
100
Figure B1. Gradation of approach slab base material (West end of West bound)
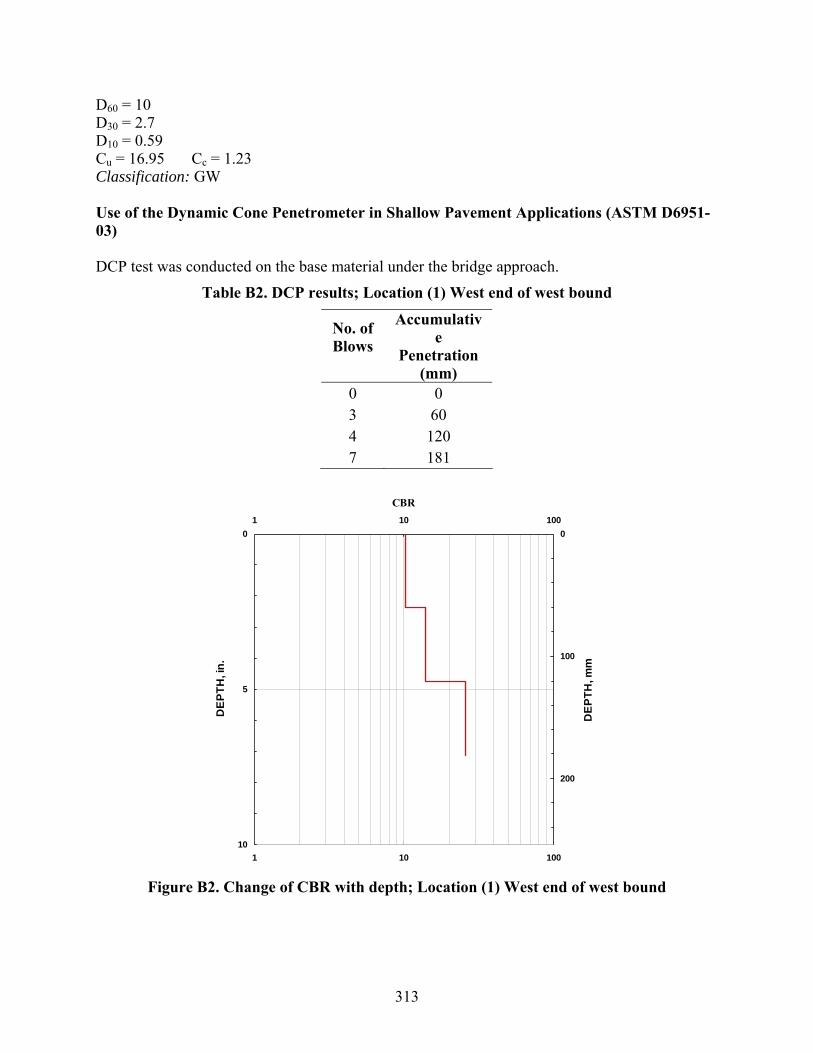
313
D60 = 10 D30 = 2.7 D10 = 0.59 Cu = 16.95 Cc = 1.23 Classification: GW Use of the Dynamic Cone Penetrometer in Shallow Pavement Applications (ASTM D6951-03) DCP test was conducted on the base material under the bridge approach.
Table B2. DCP results; Location (1) West end of west bound
No. of Blows
Accumulative
Penetration (mm)
0 0 3 60 4 120 7 181
0
5
10
1 10 100
CBR
DEP
TH, i
n.
0
100
200
1 10 100
DEP
TH, m
m
Figure B2. Change of CBR with depth; Location (1) West end of west bound

314
Table B3. DCP results; Location (2) West end of west bound
No. of Blows
Accumulative
Penetration (mm)
0 0 3 59 4 119 5 177
0
5
10
1 10 100
CBR
DEP
TH, i
n.
0
100
200
1 10 100
DEP
TH, m
m
Figure B3. Change of CBR with depth; Location (2) West end of west bound
Table B4. DCP results; Location (3) West end of west bound
No. of Blows
Accumulative
Penetration (mm)
0 0 3 55 4 115 10 165
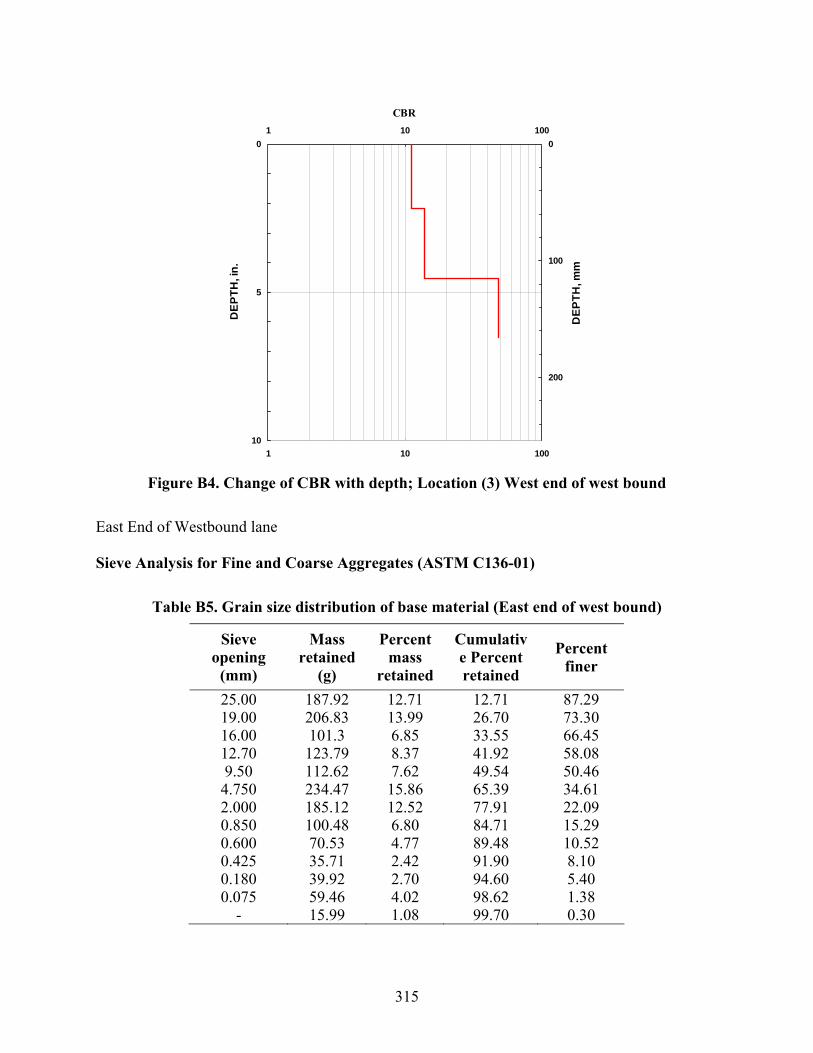
315
0
5
10
1 10 100
CBR
DEP
TH, i
n.
0
100
200
1 10 100
DEP
TH, m
m
Figure B4. Change of CBR with depth; Location (3) West end of west bound
East End of Westbound lane Sieve Analysis for Fine and Coarse Aggregates (ASTM C136-01)
Table B5. Grain size distribution of base material (East end of west bound)
Sieve opening
(mm)
Mass retained
(g)
Percent mass
retained
Cumulative Percent retained
Percent finer
25.00 187.92 12.71 12.71 87.29 19.00 206.83 13.99 26.70 73.30 16.00 101.3 6.85 33.55 66.45 12.70 123.79 8.37 41.92 58.08 9.50 112.62 7.62 49.54 50.46 4.750 234.47 15.86 65.39 34.61 2.000 185.12 12.52 77.91 22.09 0.850 100.48 6.80 84.71 15.29 0.600 70.53 4.77 89.48 10.52 0.425 35.71 2.42 91.90 8.10 0.180 39.92 2.70 94.60 5.40 0.075 59.46 4.02 98.62 1.38
- 15.99 1.08 99.70 0.30

316
Grain size (mm)
0.010.1110100
Perc
ent f
iner
0
20
40
60
80
100
Figure B5. Grain size distribution of base material (East end of west bound)
D60 = 10.4 D30 = 3.5 D10 = 0.58 Cu = 17.9 Cc = 2.03 Classification: GW Use of the Dynamic Cone Penetrometer in Shallow Pavement Applications (ASTM D6951-03)
Table B6. DCP results; Location (1) East end of west bound
No. of Blows
AccumulativePenetration
(mm) 0 0 2 62 5 116 7 175
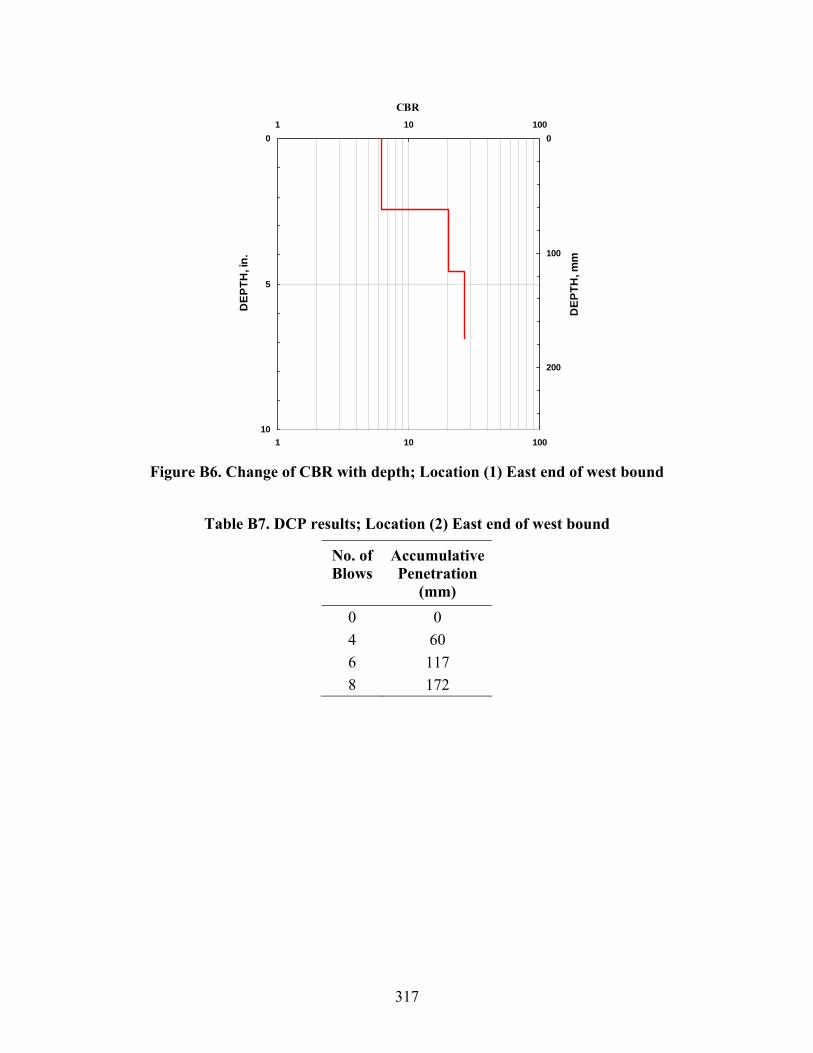
317
0
5
10
1 10 100
CBR
DEP
TH, i
n.
0
100
200
1 10 100
DEP
TH, m
m
Figure B6. Change of CBR with depth; Location (1) East end of west bound
Table B7. DCP results; Location (2) East end of west bound
No. of Blows
AccumulativePenetration
(mm) 0 0 4 60 6 117 8 172
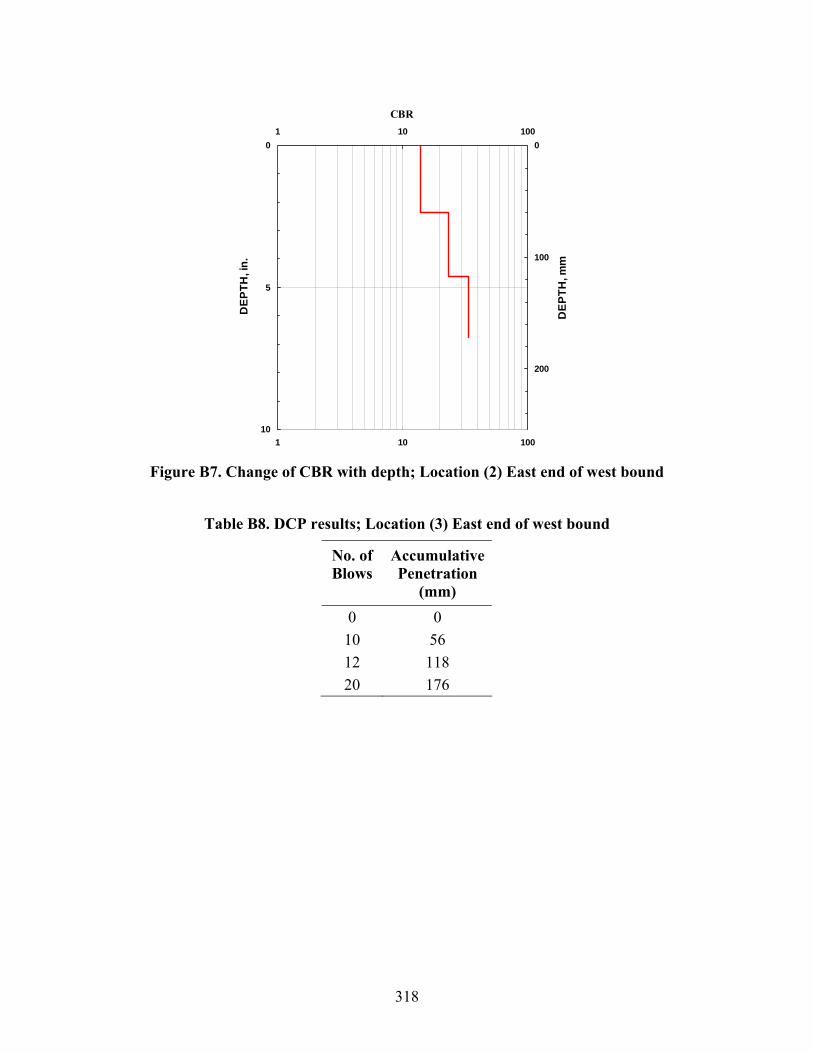
318
0
5
10
1 10 100
CBR
DEP
TH, i
n.
0
100
200
1 10 100
DEP
TH, m
m
Figure B7. Change of CBR with depth; Location (2) East end of west bound
Table B8. DCP results; Location (3) East end of west bound
No. of Blows
AccumulativePenetration
(mm) 0 0 10 56 12 118 20 176
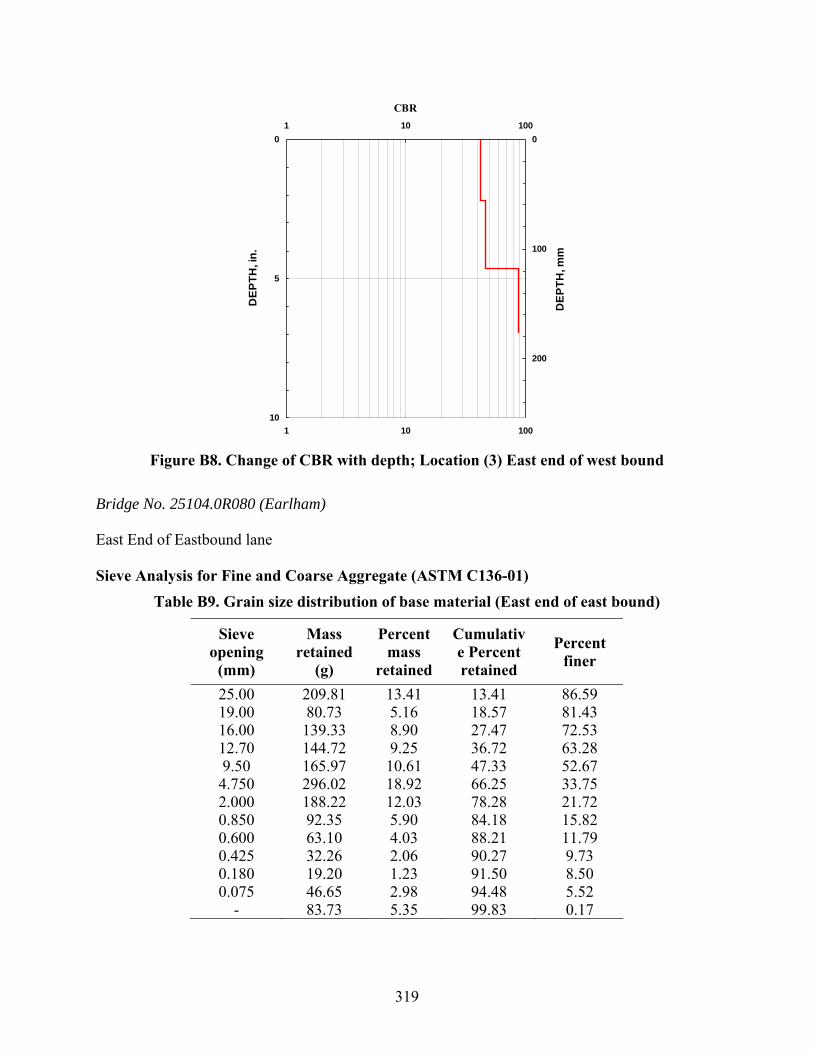
319
0
5
10
1 10 100
CBR
DEP
TH, i
n.
0
100
200
1 10 100
DEP
TH, m
m
Figure B8. Change of CBR with depth; Location (3) East end of west bound
Bridge No. 25104.0R080 (Earlham) East End of Eastbound lane Sieve Analysis for Fine and Coarse Aggregate (ASTM C136-01)
Table B9. Grain size distribution of base material (East end of east bound)
Sieve opening
(mm)
Mass retained
(g)
Percent mass
retained
Cumulative Percent retained
Percent finer
25.00 209.81 13.41 13.41 86.59 19.00 80.73 5.16 18.57 81.43 16.00 139.33 8.90 27.47 72.53 12.70 144.72 9.25 36.72 63.28 9.50 165.97 10.61 47.33 52.67 4.750 296.02 18.92 66.25 33.75 2.000 188.22 12.03 78.28 21.72 0.850 92.35 5.90 84.18 15.82 0.600 63.10 4.03 88.21 11.79 0.425 32.26 2.06 90.27 9.73 0.180 19.20 1.23 91.50 8.50 0.075 46.65 2.98 94.48 5.52
- 83.73 5.35 99.83 0.17
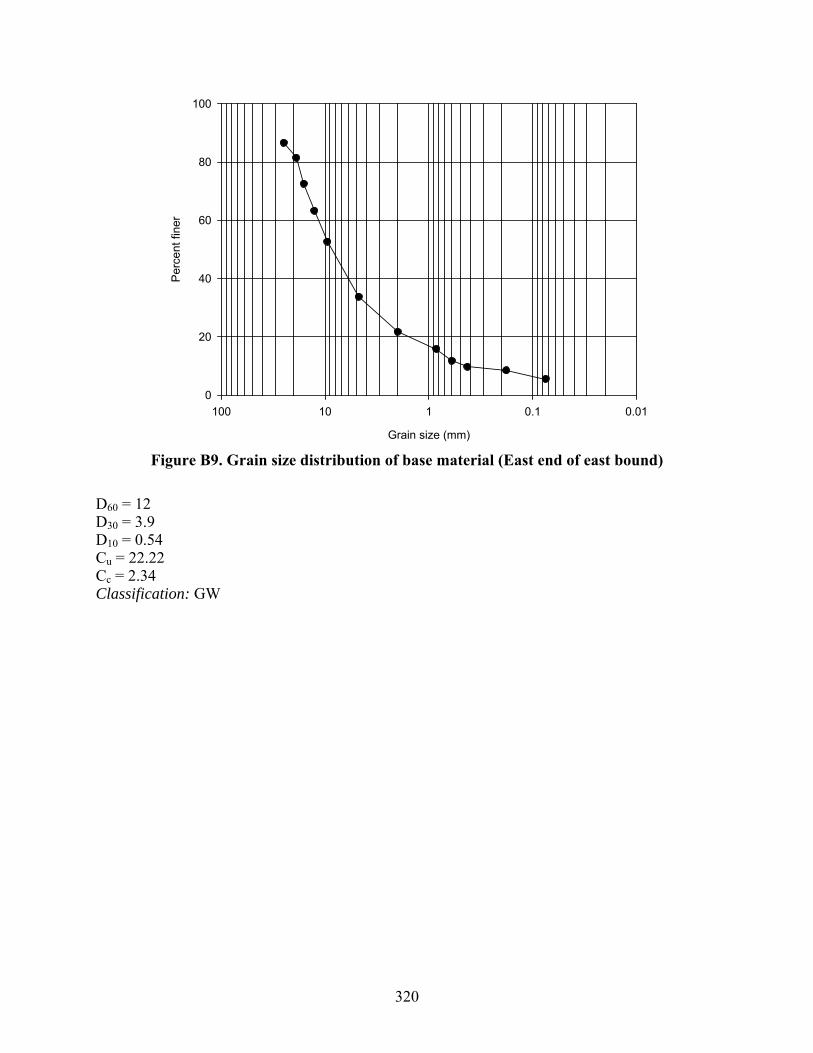
320
Grain size (mm)
0.010.1110100
Per
cent
fine
r
0
20
40
60
80
100
Figure B9. Grain size distribution of base material (East end of east bound)
D60 = 12 D30 = 3.9 D10 = 0.54 Cu = 22.22 Cc = 2.34 Classification: GW

321
APPENDIX C: BRIDGES UNDER CONSTRUCTION
35th St. Bridge North end of SBL
Sieve Analysis for Fine and Coarse Aggregates (ASTM C136-01) Table C1. Grain size distribution of granular backfill; Bridge on 35th St. over I-235 (North
end of south bound)
Sieve opening
(mm)
Mass retained
(g)
Percent mass
retained
Cumulative Percent retained
Percent finer
4.750 81.80 5.20 5.20 94.80 2.000 213.20 13.55 18.75 81.25 0.850 343.70 21.85 40.60 59.40 0.425 596.00 37.89 78.49 21.51 0.250 275.50 17.51 96.00 4.00 0.075 50.00 3.18 99.18 0.82
- 7.00 0.44 99.62 0.38 D60 = 0.9 D10 = 0.3 R200 = 99.45 R4/R200 = 0.07 Cu = 3 Cc = 1.12 Classification: SP Maximum Index Density and Unit Weight of Soils using a Vibratory Table (ASTM D4253-00) Table C2. Dry density – Moisture content relationship of granular backfill; Bridge on 35th
St. over I-235 (North end of south bound)
w (%) 0 2 4 6 8 10 12 14 Wt. of mold
+ soil (g) 7855.9 7435.5 7230.5 7267.7 7297.2 7454.7 7553.2 7788.7
Wt. of soil (g) 4149.3 3728.9 3523.9 3561.1 3590.6 3748.1 3846.6 4082.1
Height dropped
(cm) 3.30 4.38 5.03 5.00 5.15 5.18 5.18 4.95
Volume (cm3) 2155.9 1964.9 1850 1855.4 1828 1823.5 1823.6 1864.2
γmax (pcf) 120.2 118.5 118.9 119.8 122.6 128.3 131.7 136.7 γdmax (pcf) 120.2 116.2 114.3 113 113.5 116.7 117.6 119.9
γdmin (pcf) = 91.53

322
Specific Gravity Test (Helium Pycnometer) Table C3. Results of Helium Pycnometer test on granular backfill; Bridge on 35th St. over
I-235 (North end of south bound)
Sample mass (g) Pressure 1 (psi) Pressure 2 (psi) Vp (cc) Specific gravity Gs
(g/cc)
37.592 17.067 6.732 14.001 2.685 Compactibility calculation
emax = 1min
−⎥⎦
⎤⎢⎣
⎡γ
γ wsG = 0.868
emin = 1max
−⎥⎦
⎤⎢⎣
⎡γ
γ wsG= 0.423
Compactibility, F = min
minmax
eee −
= 1.052
South End of SBL
Sieve Analysis of Fine and Coarse Aggregates (ASTM C136-01) Table C4. Grain size distribution of granular backfill; Bridge on 35th St. over I-235 (South
end of south bound)
Sieve opening
(mm)
Mass retained
(g)
Percent mass
retained
Cumulative Percent retained
Percent finer
25 0 0 0 100 19 0 0 0 100
12.7 4.6 0.28 0.28 99.72 9.5 214.8 12.91 13.18 86.82
4.750 1334.50 80.18 93.37 6.63 2.000 100.10 6.01 99.38 0.62 0.850 3.80 0.23 99.61 0.39 0.425 3.30 0.20 99.81 0.19 0.250 1.40 0.08 99.89 0.11 0.075 1.00 0.06 99.95 0.05
- 0.30 0.02 99.97 0.03 D60 = 7.7 D30 = 6

323
D10 = 5 R200 = 99.95 P200 = 6.63 Cu = 1.54 Cc = 0.94 Classification: GP Maximum Index Density and Unity Weight of Soils using a Vibratory Table (ASTM D4253-00)
Table C5. Dry unit weight – moisture content relationship for Porous backfill; Bridge on 35th St. over I-235 (South end of south bound)
w (%) 0 2 4 6 8
Wt. of mold + soil (g) 7975.70 7933.50 8047.00 8068.30 8055.90
Wt. of soil (g) 4269.10 4226.90 4340.40 4361.70 4349.30
Height dropped (cm) 0.95 1.02 0.96 1.28 0.98
Volume (cm3) 2657.78 2645.01 2655.96 2597.58 2652.31
γmax, pcf 100.28 99.76 102.02 104.83 102.37 γdmax, pcf 100.28 97.81 98.10 98.89 94.79
γdmin, (pcf) = 94.17 γdmax, (pcf) = 100.28
Specific Gravity Test (Helium Pycnometer) Table C6. Results of Helium Pycnometer Test for Porous backfill; Bridge on 35th St. over I-
235 (South end of south bound)
Sample mass (g)
Pressure 1 (psi)
Pressure 2 (psi) Vp (cc)
Specific gravity Gs
(g/cc) 38.475 17.062 6.731 14.034 2.74
Compactibility calculation
emax = 1min
−⎥⎦
⎤⎢⎣
⎡γ
γ wsG = 0.816

324
emin = 1max
−⎥⎦
⎤⎢⎣
⎡γ
γ wsG= 0.705
Compactibility, F = min
minmax
eee −
= 0.157
Water Content Determination (ASTM D2216)
Table C7. Field moisture content for both bound; Bridge on 35th St. over I-235
SBL NBL
Wt. of can (g) 18.23 18.38
Wt. of can + wet soil (g) 73.47 85.92
Wt. of can + dry soil (g) 71.27 84.67
Wt. of water (g) 2.2 1.25
Wt. of dry soil (g) 53.04 66.29 w % 4.15 1.89
Air Permeability Test
Hydraulic conductivity K (cm/s) =))}1()1()100266.1)10132508.249(({
)10132508.249(277.65.122
ee SSEPGPQ
−−×−++
Ο
P = P1-Po = measured pressure – initial pressure
Se = r
r
SSS
−−
1
Table C8. Air permeability test results
Location Po (in. of water)
P1 (in. of water)
P (in. of water)
Q (ft3/hr)
L (in.)
S %
Sr Go Se K (cm/sec)
1 0.0025 0.035 0.0325 180 12 34 5 4.7 0.305 25.3 2 0.0025 0.0275 0.025 180 12 34 5 4.7 0.305 28.4 3 0.01 0.05 0.04 180 12 34 5 4.7 0.305 21.86
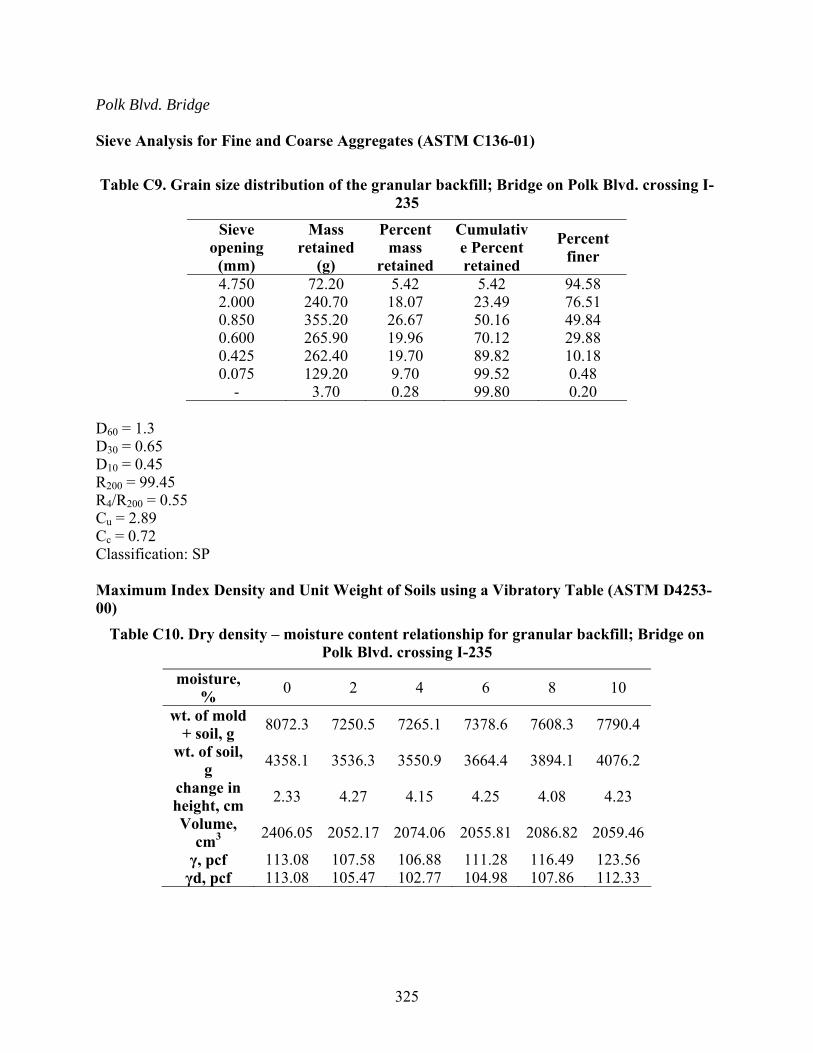
325
Polk Blvd. Bridge Sieve Analysis for Fine and Coarse Aggregates (ASTM C136-01) Table C9. Grain size distribution of the granular backfill; Bridge on Polk Blvd. crossing I-
235
Sieve opening
(mm)
Mass retained
(g)
Percent mass
retained
Cumulative Percent retained
Percent finer
4.750 72.20 5.42 5.42 94.58 2.000 240.70 18.07 23.49 76.51 0.850 355.20 26.67 50.16 49.84 0.600 265.90 19.96 70.12 29.88 0.425 262.40 19.70 89.82 10.18 0.075 129.20 9.70 99.52 0.48
- 3.70 0.28 99.80 0.20 D60 = 1.3 D30 = 0.65 D10 = 0.45 R200 = 99.45 R4/R200 = 0.55 Cu = 2.89 Cc = 0.72 Classification: SP Maximum Index Density and Unit Weight of Soils using a Vibratory Table (ASTM D4253-00)
Table C10. Dry density – moisture content relationship for granular backfill; Bridge on Polk Blvd. crossing I-235
moisture, % 0 2 4 6 8 10
wt. of mold + soil, g 8072.3 7250.5 7265.1 7378.6 7608.3 7790.4
wt. of soil, g 4358.1 3536.3 3550.9 3664.4 3894.1 4076.2
change in height, cm 2.33 4.27 4.15 4.25 4.08 4.23
Volume, cm3 2406.05 2052.17 2074.06 2055.81 2086.82 2059.46
γ, pcf 113.08 107.58 106.88 111.28 116.49 123.56 γd, pcf 113.08 105.47 102.77 104.98 107.86 112.33
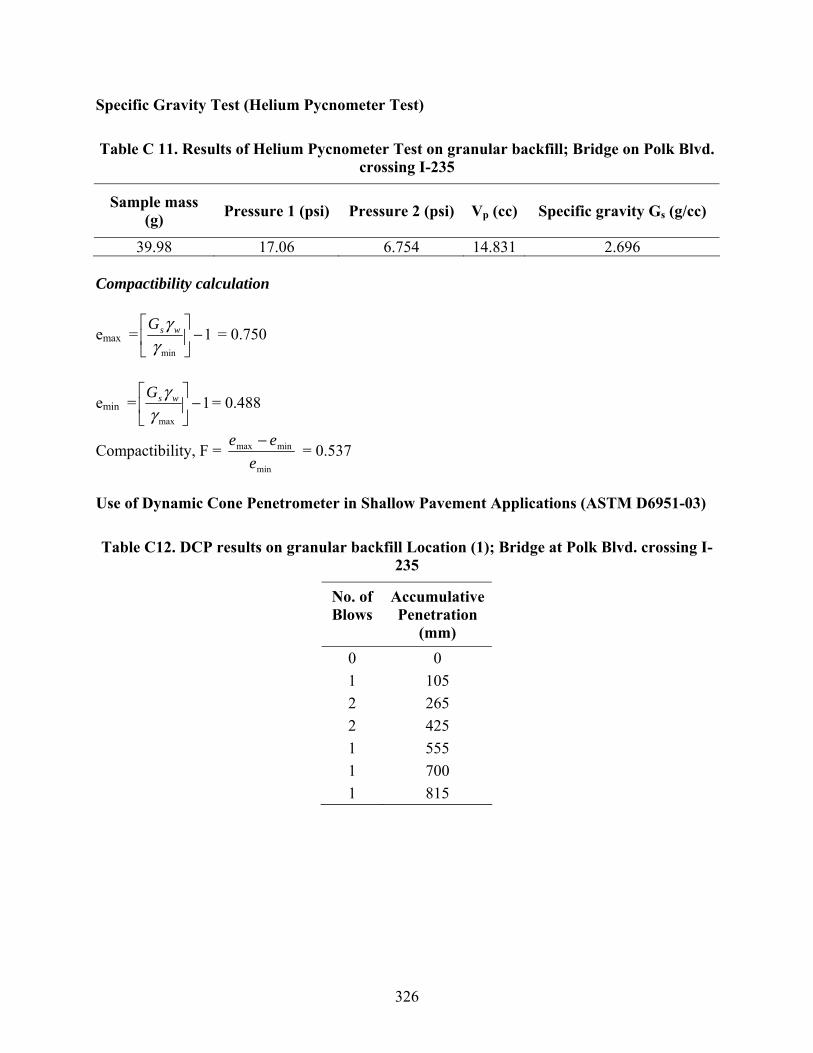
326
Specific Gravity Test (Helium Pycnometer Test) Table C 11. Results of Helium Pycnometer Test on granular backfill; Bridge on Polk Blvd.
crossing I-235
Sample mass (g) Pressure 1 (psi) Pressure 2 (psi) Vp (cc) Specific gravity Gs (g/cc)
39.98 17.06 6.754 14.831 2.696 Compactibility calculation
emax = 1min
−⎥⎦
⎤⎢⎣
⎡γ
γ wsG = 0.750
emin = 1max
−⎥⎦
⎤⎢⎣
⎡γ
γ wsG= 0.488
Compactibility, F = min
minmax
eee −
= 0.537
Use of Dynamic Cone Penetrometer in Shallow Pavement Applications (ASTM D6951-03) Table C12. DCP results on granular backfill Location (1); Bridge at Polk Blvd. crossing I-
235
No. of Blows
AccumulativePenetration
(mm) 0 0 1 105 2 265 2 425 1 555 1 700 1 815
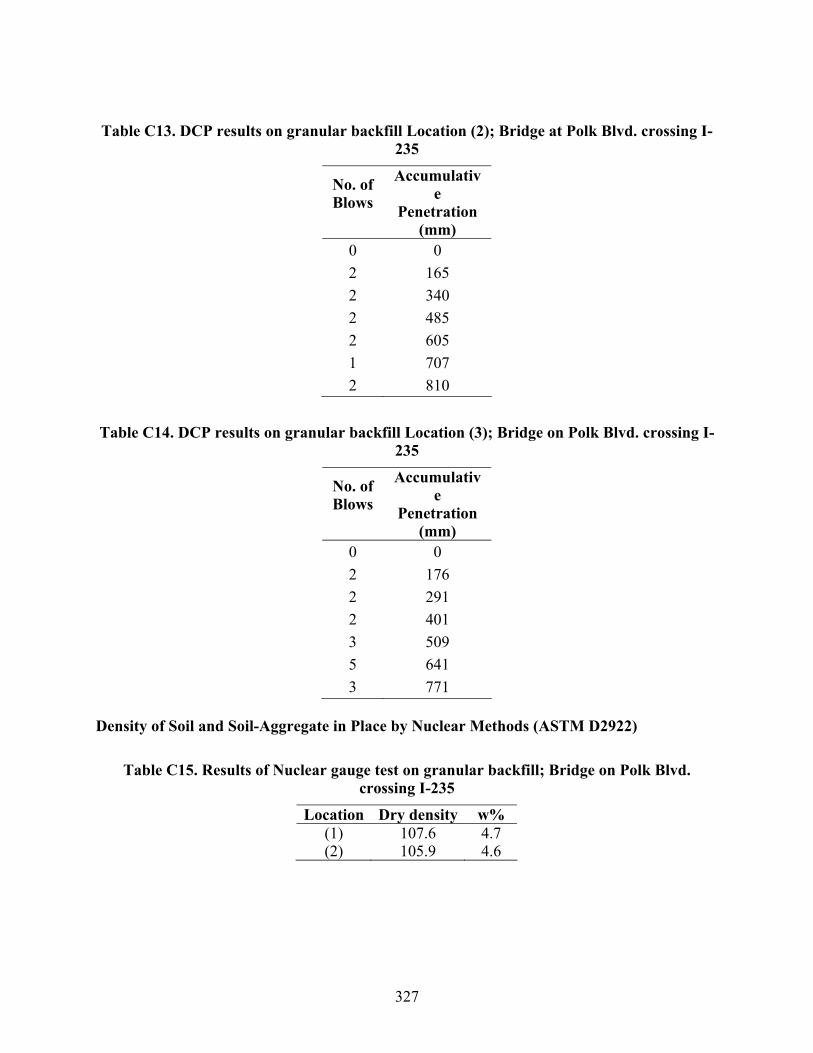
327
Table C13. DCP results on granular backfill Location (2); Bridge at Polk Blvd. crossing I-
235
No. of Blows
Accumulative
Penetration (mm)
0 0 2 165 2 340 2 485 2 605 1 707 2 810
Table C14. DCP results on granular backfill Location (3); Bridge on Polk Blvd. crossing I-
235
No. of Blows
Accumulative
Penetration (mm)
0 0 2 176 2 291 2 401 3 509 5 641 3 771
Density of Soil and Soil-Aggregate in Place by Nuclear Methods (ASTM D2922)
Table C15. Results of Nuclear gauge test on granular backfill; Bridge on Polk Blvd. crossing I-235
Location Dry density w% (1) 107.6 4.7 (2) 105.9 4.6

328
19th St. Bridge Sieve Analysis for Fine and Coarse Aggregates (ASTM C136-01)
Table C16. Grain size distribution for granular backfill; Bridge on 19th St. crossing I-235
Sieve opening
(mm)
Mass retained
(g)
Percent mass
retained
Cumulative Percent retained
Percent finer
9.52 70.80 5.04 5.04 94.96 4.750 87.30 6.22 11.26 88.74 2.000 141.10 10.05 21.31 78.69 0.850 240.50 17.13 38.44 61.56 0.600 433.20 30.86 69.30 30.70 0.425 315.40 22.47 91.77 8.23 0.075 107.60 7.66 99.43 0.57
- 0.90 0.06 99.49 0.51 D60 = 0.85 D30 = 0.61 D10 = 0.47 R200 = 99.43 P4 = 88.74 Cu = 1.81 Cc = 0.93 Classification: Poorly graded sand. SP Maximum Index Density and Unit Weight of Soils using a Vibratory Table (ASTM D4253-00) Table C17. Dry density- moisture content relationship for granular backfill; Bridge on 19th
St. crossing I-235
w (%) 0 2 4 6 8 10 12 14 Wt. of mold
+ soil (g) 7845.9 7422.5 7219.5 7255.2 7284.3 7444.2 7651.2 7755.3
t. of soil (g) 4139.3 3715.9 3512.9 3548.6 3577.7 3737.6 3944.6 4048.7 Height
dropped (cm)
3.24 4.39 4.99 5.00 5.12 5.13 5.15 4.88
Volume (cm3) 2240.1 2030.3 1920.8 1919 1897.1 1895.3 1891.6 1940.9
γmax, pcf 115.4 114.3 114.2 115.4 117.7 123.1 130.2 130.2 γdmax, pcf 115.4 112 109.8 108.9 109 111.9 116.2 114.2
γdmax, pcf = 115.36 γdmin, pcf = 91.31
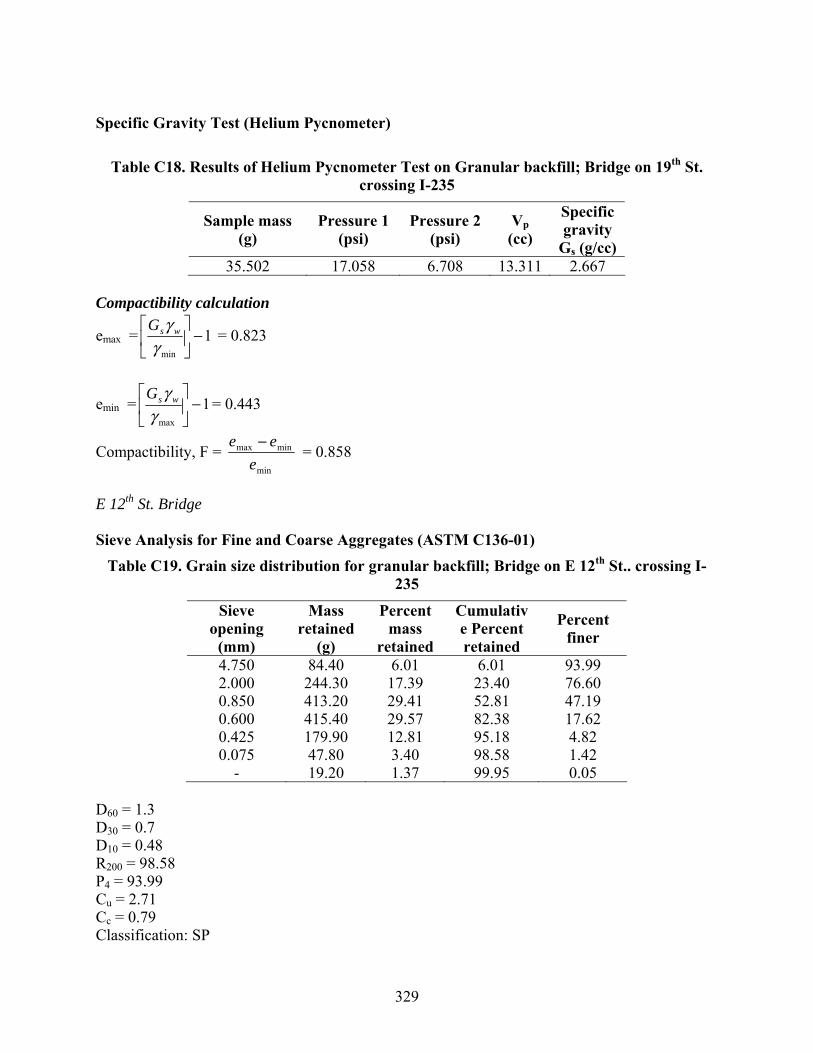
329
Specific Gravity Test (Helium Pycnometer)
Table C18. Results of Helium Pycnometer Test on Granular backfill; Bridge on 19th St. crossing I-235
Sample mass (g)
Pressure 1 (psi)
Pressure 2 (psi)
Vp (cc)
Specific gravity
Gs (g/cc) 35.502 17.058 6.708 13.311 2.667
Compactibility calculation
emax = 1min
−⎥⎦
⎤⎢⎣
⎡γ
γ wsG = 0.823
emin = 1max
−⎥⎦
⎤⎢⎣
⎡γ
γ wsG= 0.443
Compactibility, F = min
minmax
eee −
= 0.858
E 12th St. Bridge Sieve Analysis for Fine and Coarse Aggregates (ASTM C136-01)
Table C19. Grain size distribution for granular backfill; Bridge on E 12th St.. crossing I-235
Sieve opening
(mm)
Mass retained
(g)
Percent mass
retained
Cumulative Percent retained
Percent finer
4.750 84.40 6.01 6.01 93.99 2.000 244.30 17.39 23.40 76.60 0.850 413.20 29.41 52.81 47.19 0.600 415.40 29.57 82.38 17.62 0.425 179.90 12.81 95.18 4.82 0.075 47.80 3.40 98.58 1.42
- 19.20 1.37 99.95 0.05 D60 = 1.3 D30 = 0.7 D10 = 0.48 R200 = 98.58 P4 = 93.99 Cu = 2.71 Cc = 0.79 Classification: SP

330
Maximum Index Density and Unity Weight of Soils using a Vibratory Table (ASTM D4253-00)
Table C20. Dry density-moisture content relationship for granular backfill; Bridge on E 12th St. crossing I-235
moisture, % 0 2 4 6 8 10 wt. of mold
+ soil, g 8064.2 7244.8 7267.9 7356.2 7610.3 7783.3
wt. of soil, g 4350 3530.6 3553.7 3642 3896.1 4069.1 change in height, cm 3.63 4.15 4.16 4.2 4.17 4.33
Volume, cm3 2168.9 2074.1 2072.2 2064.9 2070.4 2041.2
γ, pcf 125.2 106.3 107.1 110.1 117.5 124.5 γd, pcf 125.2 104.2 102.9 103.9 108.8 113.1
γdmin (pcf) = 95.96 γdmax (pcf) = 125.21 Specific Gravity Test (Helium Pycnometer)
Table C21. Results of Helium Pycnometer Test on granular backfill; Bridge on E 12th St. crossing I-235
Sample mass (g) Pressure 1 (psi) Pressure 2 (psi) Vp (cc)
Specific gravity Gs
(g/cc) 39.038 17.059 6.747 14.611 2.67
Compactibility calculation
emax = 1min
−⎥⎦
⎤⎢⎣
⎡γ
γ wsG = 0.736
emin = 1max
−⎥⎦
⎤⎢⎣
⎡γ
γ wsG= 0.331
Compactibility, F = min
minmax
eee −
= 1.227
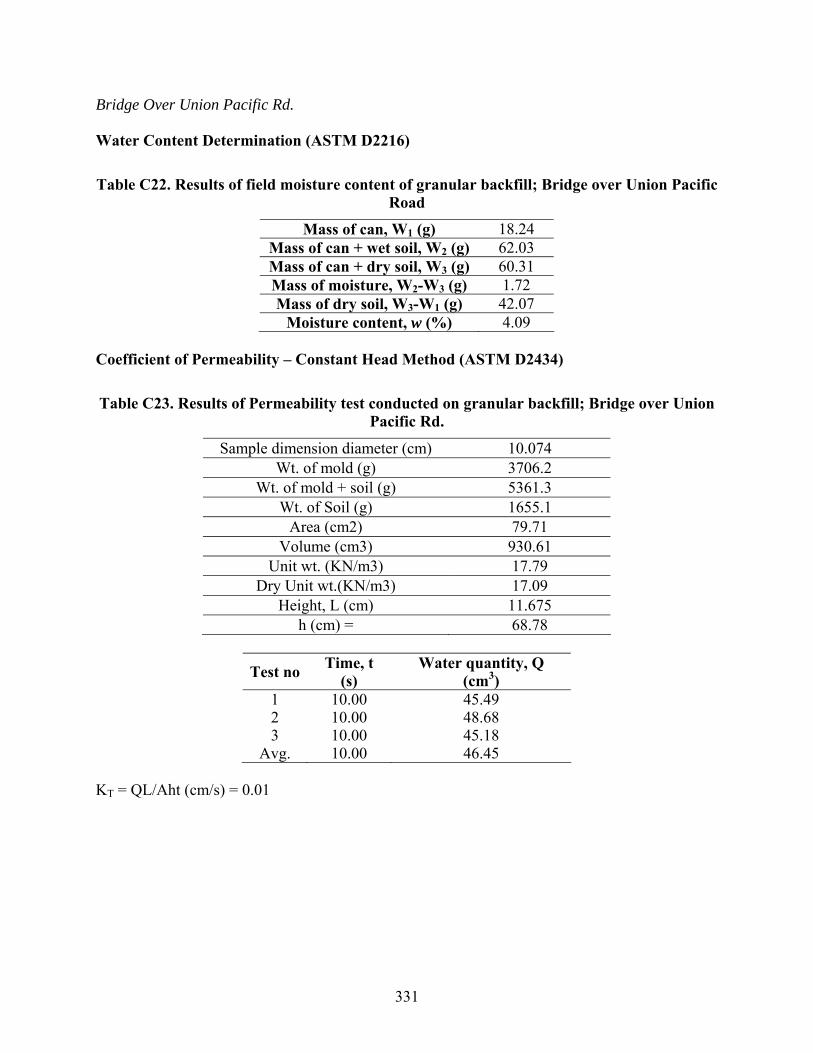
331
Bridge Over Union Pacific Rd. Water Content Determination (ASTM D2216) Table C22. Results of field moisture content of granular backfill; Bridge over Union Pacific
Road
Mass of can, W1 (g) 18.24 Mass of can + wet soil, W2 (g) 62.03 Mass of can + dry soil, W3 (g) 60.31 Mass of moisture, W2-W3 (g) 1.72 Mass of dry soil, W3-W1 (g) 42.07
Moisture content, w (%) 4.09 Coefficient of Permeability – Constant Head Method (ASTM D2434) Table C23. Results of Permeability test conducted on granular backfill; Bridge over Union
Pacific Rd.
Sample dimension diameter (cm) 10.074 Wt. of mold (g) 3706.2
Wt. of mold + soil (g) 5361.3 Wt. of Soil (g) 1655.1
Area (cm2) 79.71 Volume (cm3) 930.61
Unit wt. (KN/m3) 17.79 Dry Unit wt.(KN/m3) 17.09
Height, L (cm) 11.675 h (cm) = 68.78
Test no Time, t (s)
Water quantity, Q (cm3)
1 10.00 45.49 2 10.00 48.68 3 10.00 45.18
Avg. 10.00 46.45 KT = QL/Aht (cm/s) = 0.01

332
Sieve Analysis for Fine and Coarse Aggregates (ASTM C136-01)
Table C24. Grain size distribution for granular backfill; Bridge over Union Pacific Rd.
Sieve opening
(mm)
Mass of soil retained on each sieve
(g)
Percent of mass
retained on each sieve
Cumulative percent retained
Percent finer
4.750 4.39 0.83 0.83 99.17 2.000 79.94 15.09 15.91 84.09 0.850 146.62 27.67 43.58 56.42 0.425 185.75 35.05 78.64 21.36 0.250 84.23 15.90 94.53 5.47 0.075 25.67 4.84 99.38 0.62
- 3.20 0.60 99.98 0.02 Classification R200 = 99.38 > 50% R4/R200 = 0.83/99.38 = 0.00835 < 0.5 P200 = 0.62 < 5% D60 = 0.92, D30 = 0.52, D10 = 0.3 Cu = 3.167 < 6 Cc = 0.979 < 1 Soil classified as poorly graded sandy soil (SP) Bridge No. 57.6R030 Sieve Analysis for Fine and Coarse Aggregates (ASTM C136-01)
Table C 25. Grain size distribution for granular backfill; Bridge no. 57.6R030
Sieve opening
(mm)
Mass retained
(g)
Percent mass
retained
Cumulative Percent
retained
Percent finer
19.00 50.81 4.79 4.79 95.21 4.750 304.69 28.71 33.50 66.50 2.000 369.68 34.84 68.34 31.66 0.850 189.28 17.84 86.17 13.83 0.600 74.19 6.99 93.16 6.84 0.425 24.15 2.28 95.44 4.56 0.075 24.70 2.33 97.77 2.23
- 23.42 2.21 99.97 0.03
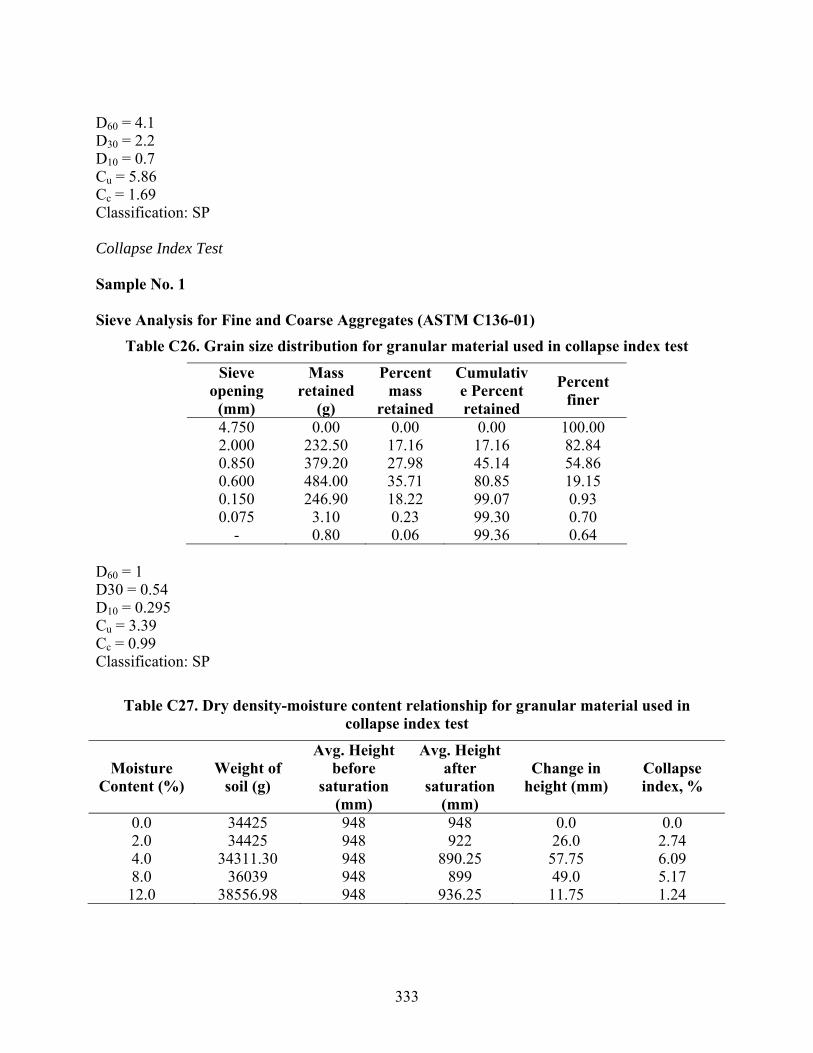
333
D60 = 4.1 D30 = 2.2 D10 = 0.7 Cu = 5.86 Cc = 1.69 Classification: SP Collapse Index Test Sample No. 1 Sieve Analysis for Fine and Coarse Aggregates (ASTM C136-01)
Table C26. Grain size distribution for granular material used in collapse index test
Sieve opening
(mm)
Mass retained
(g)
Percent mass
retained
Cumulative Percent retained
Percent finer
4.750 0.00 0.00 0.00 100.00 2.000 232.50 17.16 17.16 82.84 0.850 379.20 27.98 45.14 54.86 0.600 484.00 35.71 80.85 19.15 0.150 246.90 18.22 99.07 0.93 0.075 3.10 0.23 99.30 0.70
- 0.80 0.06 99.36 0.64 D60 = 1 D30 = 0.54 D10 = 0.295 Cu = 3.39 Cc = 0.99 Classification: SP
Table C27. Dry density-moisture content relationship for granular material used in collapse index test
Moisture Content (%)
Weight of soil (g)
Avg. Height before
saturation (mm)
Avg. Height after
saturation (mm)
Change in height (mm)
Collapse index, %
0.0 34425 948 948 0.0 0.0 2.0 34425 948 922 26.0 2.74 4.0 34311.30 948 890.25 57.75 6.09 8.0 36039 948 899 49.0 5.17 12.0 38556.98 948 936.25 11.75 1.24

334
Sample No. 2 Sieve Analysis for Fine and Coarse Aggregates (ASTM C136-01)
Table C28. Grain size distribution for Porous material used in collapse index test
Sieve opening
(mm)
Mass retained
(g)
Percent mass
retained
Cumulative Percent retained
Percent finer
25 0 0 0 100 19 0 0 0 100
12.7 47.9 2.76 2.76 97.24 9.5 795.1 45.83 48.59 51.41
4.750 811.30 46.76 95.35 4.65 2.000 27.60 1.59 96.95 3.05 0.850 8.30 0.48 97.42 2.58 0.425 9.40 0.54 97.97 2.03 0.075 14.90 0.86 98.82 1.18
- 19.80 1.14 99.97 0.03 D60 = 10 D30 = 7.5 D10 = 5.6 R200 = 98.82 P4 = 4.65 Cu = 1.79 Cc = 1.00 Classification: GP Table C29. Dry density-moisture content relationship for porous fill used in collapse index
test
Moisture
Content (%)
Weight of soil
(g)
Avg. Height before
saturation (mm)
Avg. Height after
saturation (mm)
Change in height
(mm)
Collapse index, %
0 35424 948 948 0 0 2.0 34275 948 948 0 0 4.0 36398.30 948 948 0 0 8.0 36219 948 948 0 0 12.0 38936.98 948 948 0 0
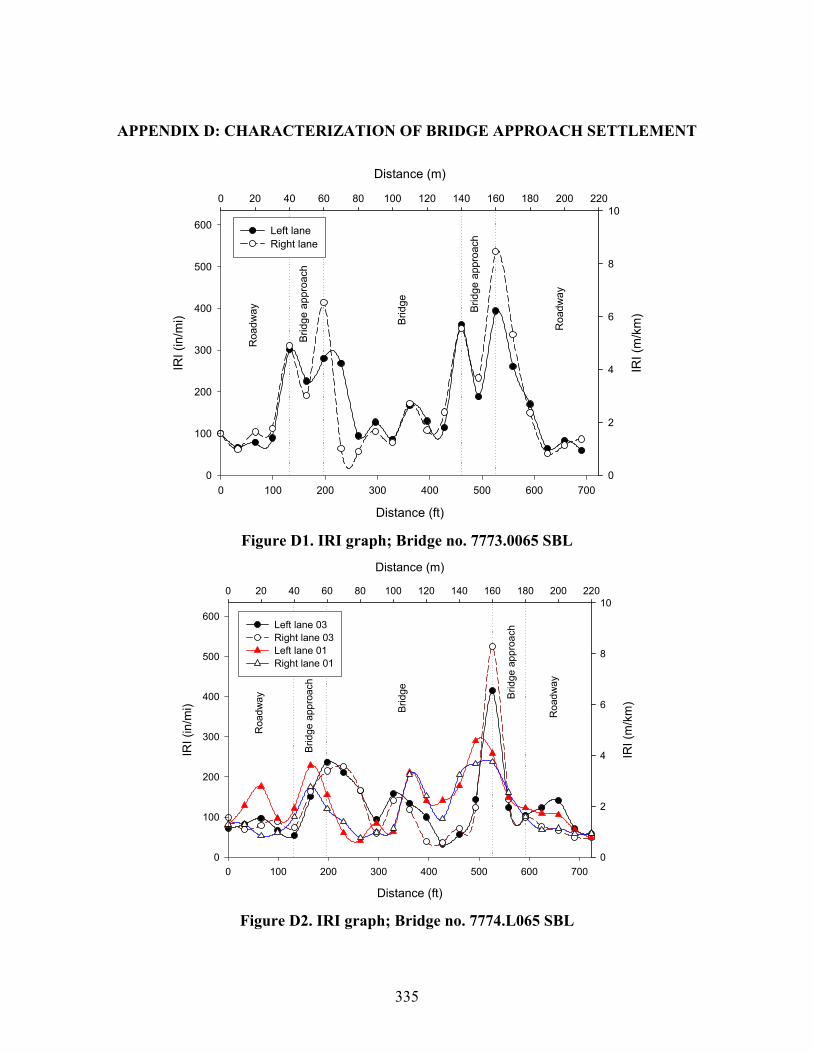
335
APPENDIX D: CHARACTERIZATION OF BRIDGE APPROACH SETTLEMENT
Distance (m)
0 20 40 60 80 100 120 140 160 180 200 220
IRI (
m/k
m)
0
2
4
6
8
10
Distance (ft)
0 100 200 300 400 500 600 700
IRI (
in/m
i)
0
100
200
300
400
500
600 Left lane Right lane
Roa
dway
Brid
ge
Brid
ge a
ppro
ach
Brid
ge a
ppro
ach
Roa
dway
Figure D1. IRI graph; Bridge no. 7773.0065 SBL
Distance (m)
0 20 40 60 80 100 120 140 160 180 200 220
IRI (
m/k
m)
0
2
4
6
8
10
Distance (ft)
0 100 200 300 400 500 600 700
IRI (
in/m
i)
0
100
200
300
400
500
600Left lane 03Right lane 03Left lane 01Right lane 01
Roa
dway
Brid
ge
Brid
ge a
ppro
ach
Brid
ge a
ppro
ach
Roa
dway
Figure D2. IRI graph; Bridge no. 7774.L065 SBL
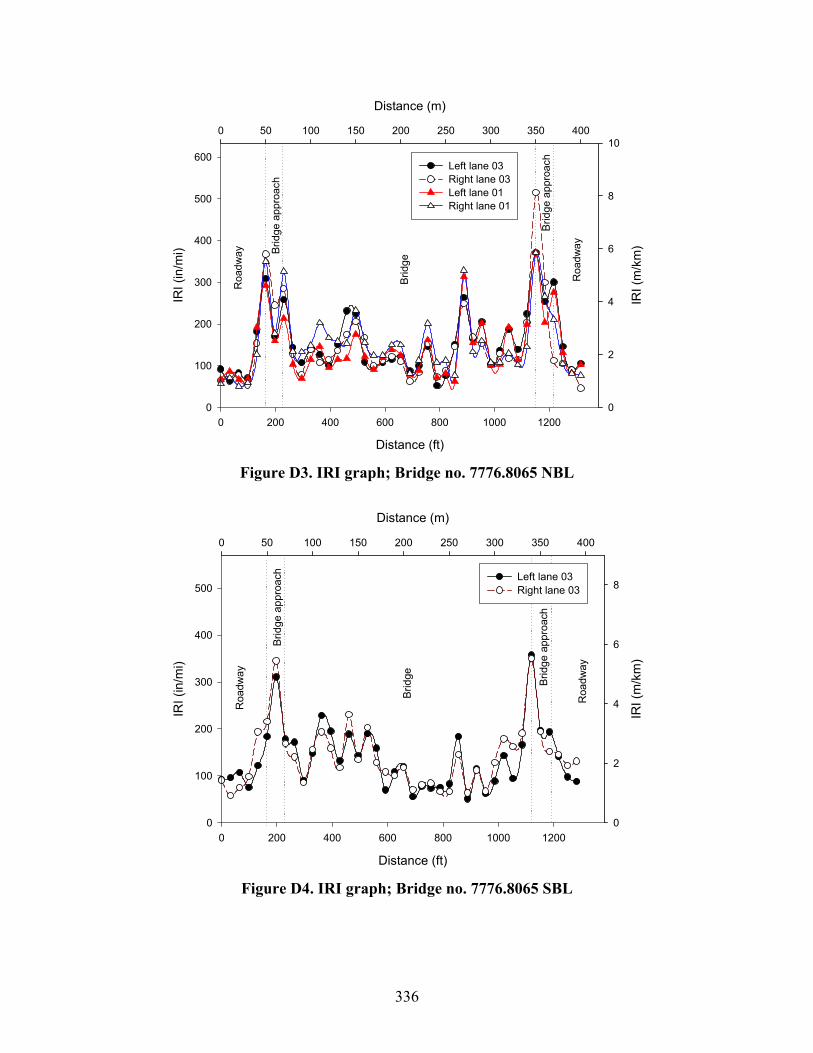
336
Distance (m)
0 50 100 150 200 250 300 350 400
IRI (
m/k
m)
0
2
4
6
8
10
Distance (ft)
0 200 400 600 800 1000 1200
IRI (
in/m
i)
0
100
200
300
400
500
600Left lane 03Right lane 03Left lane 01Right lane 01
Roa
dway
Brid
ge
Brid
ge a
ppro
ach
Brid
ge a
ppro
ach
Roa
dway
Figure D3. IRI graph; Bridge no. 7776.8065 NBL
Distance (m)
0 50 100 150 200 250 300 350 400
IRI (
m/k
m)
0
2
4
6
8
Distance (ft)
0 200 400 600 800 1000 1200
IRI (
in/m
i)
0
100
200
300
400
500Left lane 03Right lane 03
Roa
dway
Brid
ge
Brid
ge a
ppro
ach
Brid
ge a
ppro
ach
Roa
dway
Figure D4. IRI graph; Bridge no. 7776.8065 SBL
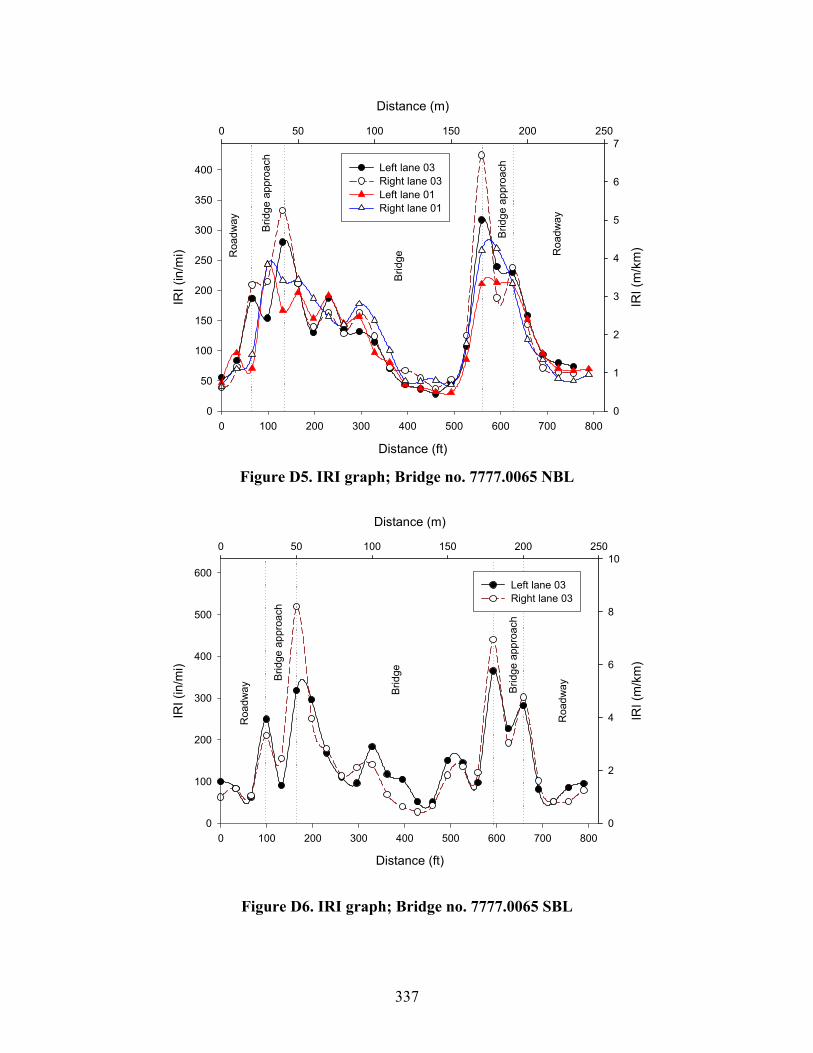
337
Distance (m)
0 50 100 150 200 250
IRI (
m/k
m)
0
1
2
3
4
5
6
7
Distance (ft)
0 100 200 300 400 500 600 700 800
IRI (
in/m
i)
0
50
100
150
200
250
300
350
400 Left lane 03Right lane 03Left lane 01Right lane 01
Roa
dway
Brid
ge
Brid
ge a
ppro
ach
Brid
ge a
ppro
ach
Roa
dway
Figure D5. IRI graph; Bridge no. 7777.0065 NBL
Distance (m)
0 50 100 150 200 250
IRI (
m/k
m)
0
2
4
6
8
10
Distance (ft)
0 100 200 300 400 500 600 700 800
IRI (
in/m
i)
0
100
200
300
400
500
600Left lane 03Right lane 03
Roa
dway Brid
geBrid
ge a
ppro
ach
Brid
ge a
ppro
ach
Roa
dway
Figure D6. IRI graph; Bridge no. 7777.0065 SBL

338
Distance (m)
0 50 100 150 200
IRI (
m/k
m)
0
1
2
3
4
5
6
7
Distance (ft)
0 100 200 300 400 500 600
IRI (
in/m
i)
0
100
200
300
400Left lane 03Right lane 03Left lane 01Right lane 01
Roa
dway
Brid
ge
Brid
ge a
ppro
ach
Brid
ge a
ppro
ach
Roa
dway
Figure D7. IRI graph; Bridge no. 7777.3065 SBL
Distance (m)
0 50 100 150 200
IRI (
m/k
m)
0
2
4
6
8
10
Distance (ft)
0 100 200 300 400 500 600
IRI (
in/m
i)
0
100
200
300
400
500
600 Left lane 03Right lane 03Left lane 01Right lane 01
Roa
dway
Brid
ge
Brid
ge a
ppro
ach
Brid
ge a
ppro
ach
Roa
dway
Figure D8. IRI graph; Bridge no. 7778.1065 NBL

339
Distance (m)
0 20 40 60 80 100 120 140 160 180 200 220
IRI (
m/k
m)
0
2
4
6
8
10
12
Distance (ft)
0 100 200 300 400 500 600 700
IRI (
in/m
i)
0
100
200
300
400
500
600
700 Left lane 03Right lane 03
Roa
dway
Brid
ge
Brid
ge a
ppro
ach
Brid
ge a
ppro
ach
Roa
dway
Figure D9.IRI graph; Bridge no. 7778.1065 SBL
Distance (m)
0 20 40 60 80 100 120 140 160
IRI (
m/k
m)
-2
0
2
4
6
8
Distance (ft)
0 100 200 300 400 500
IRI (
in/m
i)
-100
0
100
200
300
400
500Left lane 03Right lane 03Left lane 01Right lane 01
Roa
dway
Brid
ge
Brid
ge a
ppro
ach
Brid
ge a
ppro
ach
Roa
dway
Figure D10. IRI graph; Bridge no. 7779.0065 NBL
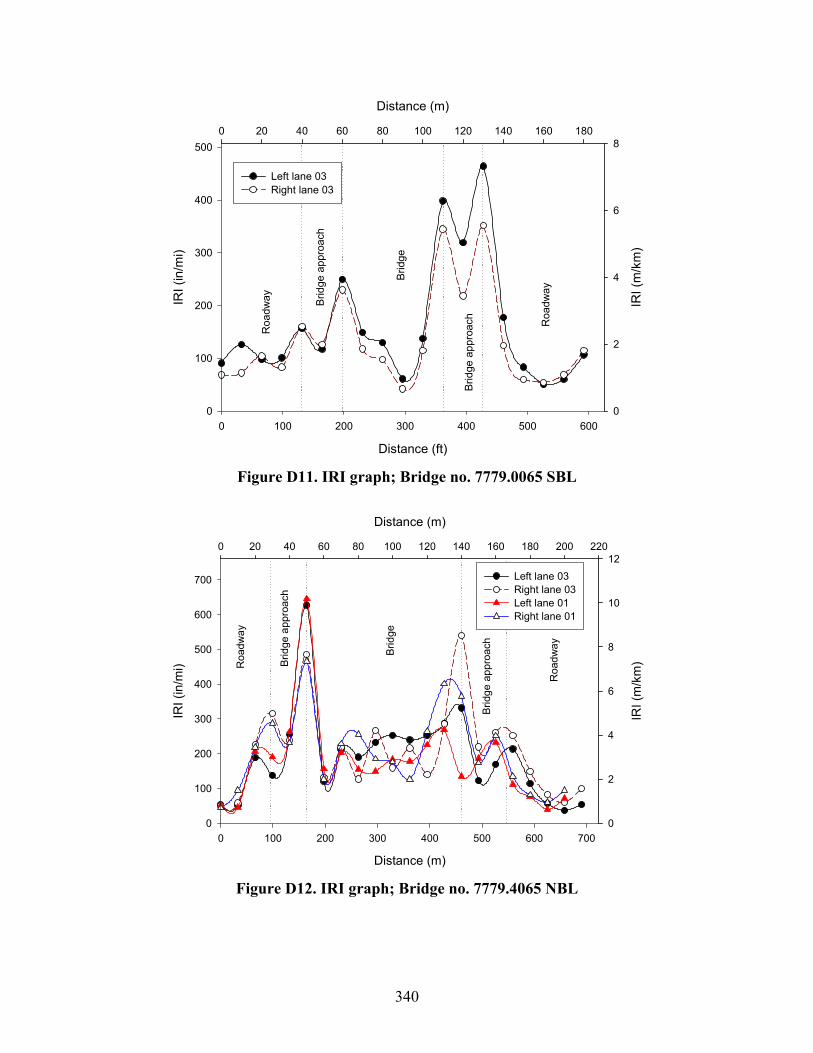
340
Distance (m)
0 20 40 60 80 100 120 140 160 180
IRI (
m/k
m)
0
2
4
6
8
Distance (ft)
0 100 200 300 400 500 600
IRI (
in/m
i)
0
100
200
300
400
500
Left lane 03Right lane 03
Roa
dway
Brid
ge
Brid
ge a
ppro
ach
Brid
ge a
ppro
ach
Roa
dway
Figure D11. IRI graph; Bridge no. 7779.0065 SBL
Distance (m)
0 20 40 60 80 100 120 140 160 180 200 220
IRI (
m/k
m)
0
2
4
6
8
10
12
Distance (m)
0 100 200 300 400 500 600 700
IRI (
in/m
i)
0
100
200
300
400
500
600
700 Left lane 03Right lane 03Left lane 01Right lane 01
Roa
dway
Brid
ge
Brid
ge a
ppro
ach
Brid
ge a
ppro
ach
Roa
dway
Figure D12. IRI graph; Bridge no. 7779.4065 NBL

341
Distance (m)
0 20 40 60 80 100 120 140 160 180 200 220
IRI (
m/k
m)
0
2
4
6
8
10
Distance (ft)
0 100 200 300 400 500 600 700
IRI (
in/m
i)
0
100
200
300
400
500
600Left lane 03Right lane 03
Roa
dway
Brid
ge
Brid
ge a
ppro
ach
Brid
ge a
ppro
ach
Roa
dway
Figure D13. IRI graph; Bridge no. 7779.4065 SBL
Distance (m)
0 20 40 60 80 100 120 140 160
IRI (
m/k
m)
0
1
2
3
4
5
6
7
8
9
Distance (ft)
0 100 200 300 400 500
IRI (
in/m
i)
0
100
200
300
400
500Left lane 03Right lane 03
Roa
dway
Brid
ge
Brid
ge a
ppro
ach
Brid
ge a
ppro
ach
Roa
dway
Figure D14. IRI graph; Bridge no. 7780.8 NBL

342
Distance (m)
0 20 40 60 80 100 120 140 160 180 200 220 240 260 280
IRI (
m/k
m)
0
2
4
6
8
10
12
14
Distance (ft)
0 100 200 300 400 500 600 700 800 900
IRI (
in/m
i)
0
100
200
300
400
500
600
700
800Left lane 03Right lane 03Left lane 01Right lane 01
Roa
dway
Brid
ge
Brid
ge a
ppro
ach
Brid
ge a
ppro
ach
Roa
dway
Figure D15. IRI graph; Bridge no. 7781.2065 NBL
Distance (m)
0 20 40 60 80 100 120 140 160 180 200 220 240 260 280
IRI (
m/k
m)
0
2
4
6
8
10
Distance (ft)
0 100 200 300 400 500 600 700 800 900
IRI (
in/m
i)
0
100
200
300
400
500
600 Left lane 03Right lane 03
Roa
dway
Brid
ge
Brid
ge a
ppro
ach
Brid
ge a
ppro
ach
Roa
dway
Figure D16. IRI graph; Bridge no. 7781.2065 SBL
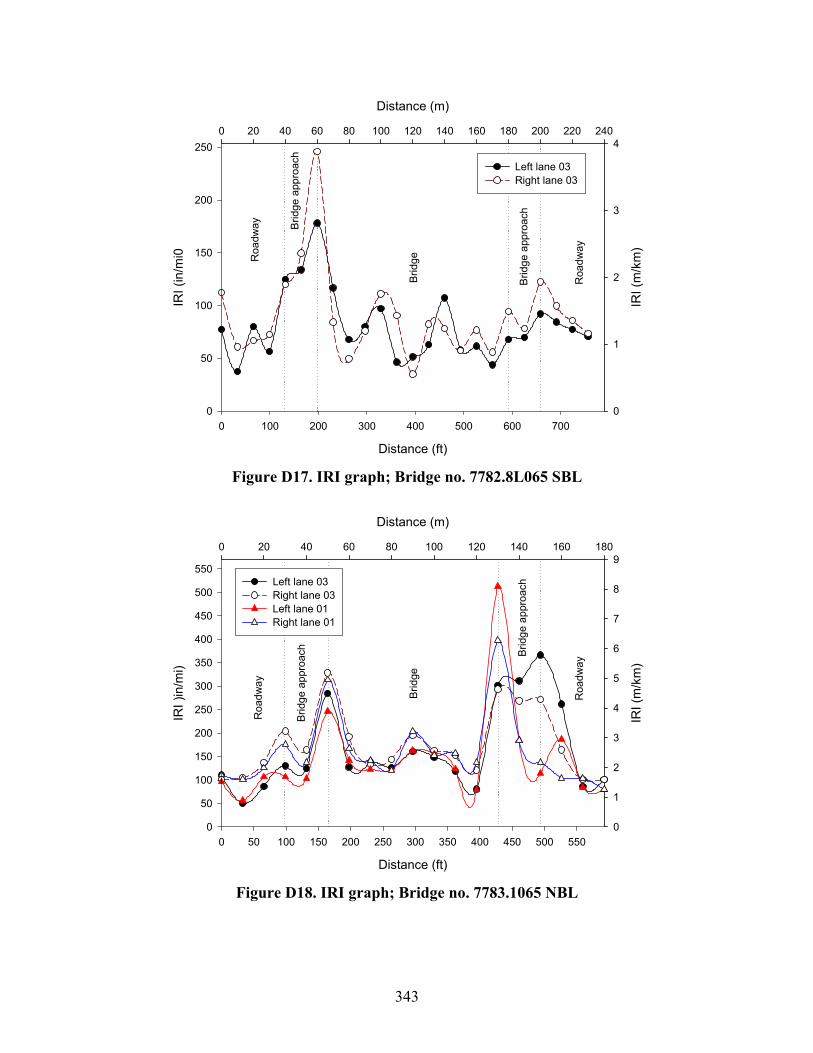
343
Roa
dway
Brid
ge
Brid
ge a
ppro
ach
Brid
ge a
ppro
ach
Roa
dway
Distance (m)
0 20 40 60 80 100 120 140 160 180 200 220 240
IRI (
m/k
m)
0
1
2
3
4
Distance (ft)
0 100 200 300 400 500 600 700
IRI (
in/m
i0
0
50
100
150
200
250
Left lane 03Right lane 03
Figure D17. IRI graph; Bridge no. 7782.8L065 SBL
Roa
dway
Brid
ge
Brid
ge a
ppro
ach Brid
ge a
ppro
ach
Roa
dway
Distance (m)
0 20 40 60 80 100 120 140 160 180
IRI (
m/k
m)
0
1
2
3
4
5
6
7
8
9
Distance (ft)
0 50 100 150 200 250 300 350 400 450 500 550
IRI )
in/m
i)
0
50
100
150
200
250
300
350
400
450
500
550Left lane 03Right lane 03Left lane 01Right lane 01
Figure D18. IRI graph; Bridge no. 7783.1065 NBL

344
Roa
dway
Brid
ge
Brid
ge a
ppro
ach
Brid
ge a
ppro
ach
Roa
dway
Distance (m)
0 20 40 60 80 100 120 140 160 180 200 220
IRI (
m/k
m)
0
1
2
3
4
5
6
Distance (ft)
0 100 200 300 400 500 600 700
IRI (
in/m
i)
0
50
100
150
200
250
300
350 Left lane 03Right lane 03
Figure D19. IRI graph; Bridge no. 7783.1065 SBL
Distance (m)
0 20 40 60 80 100 120
IRI (
m/k
m)
0
1
2
3
4
5
6
7
Distance (ft)
0 50 100 150 200 250 300 350
IRI (
in/m
i)
0
50
100
150
200
250
300
350
400 Left lane 03Right lane 03
Roa
dway
Brid
ge
Brid
ge a
ppro
ach
Figure D20. IRI graph; Bridge no. 9193.2R005 NBL

345
Table D1. Summary of bridge approach slopes
Slope Bridge no. NE/EE SE/WE Average
U.S. 65 over South Skunk River_NBL -0.0071 -0.0051 -0.0061
South Dakota over U.S. 30_NBL -0.009 -
3496.7L018_EBL -0.009 0.017 0.0040 3496.7L018_WBL -0.009 0.02 0.0055
5596.2S169 0.0033 -0.008 -0.0024 5598.2S169 0.006 -0.005 0.0005 7773.0R065 -0.018 -0.007 -0.0125
7776.8065_NBL 0.012 -0.019 -0.0035 7776.8065_SBL 0.01 -0.019 -0.0045 7777.0065_NBL -0.004 -0.018 -0.0110 7778.1065_NBL 0.013 -0.027 -0.0070 7778.1065_NBL 0.017 - 7779.4065_NBL -0.013 -0.001 -0.0070 7779.4065_SBL -0.015 -0.002 -0.0085 7780.8065_NBL 0.016 - 7781.2065_NBL -0.036 0.006 -0.0150 7781.2065_SBL -0.029 -0.001 -0.0150 7782.8065_SBL 0.009 -0.026 -0.0085 7783.1065_NBL -0.012 -0.009 -0.0105 7783.1065_SBL -0.009 -0.008 -0.0085

346
APPENDIX E: WATER MANAGEMENT BRIDGE APPROACH SIMULATION
MODEL
Table E1. CONTECH C-60NW Nonwoven Geotextile specifications
Minimum average roll values Property Test Method English Metric Physical Weight ASTM D4533 5.0 oz/sy 170 g/m2 Thickness ASTM D5199 60 mils 1.5 mm
Mechanical
Grab Tensile Strength ASTM D4632 160 lbs 712 N Grab Elongation ASTM D4632 50 % 50 % Puncture Strength ASTM D4833 85 lbs 378 N Mullen Burst ASTM D3786 280 psi 1930 kPa Trapezoidal Tear ASTM D4533 60 lbs 267 N
Hydraulic
Apparent Opening Size (AOS)
ASTM D4751 70 US Std Sieve 0.212 mm
Permittivity ASTM D4491 1.30 sec-1 1.30 sec-1 Permeability ASTM D4491 0.24 cm/sec 0.24 cm/sec Water Flow Rate ASTM D4491 110 gpm/ft2 4482 l/min/m2
Endurance
UV Resistance ASTM D4355 70 % 70 % (% retained after 500 hours)
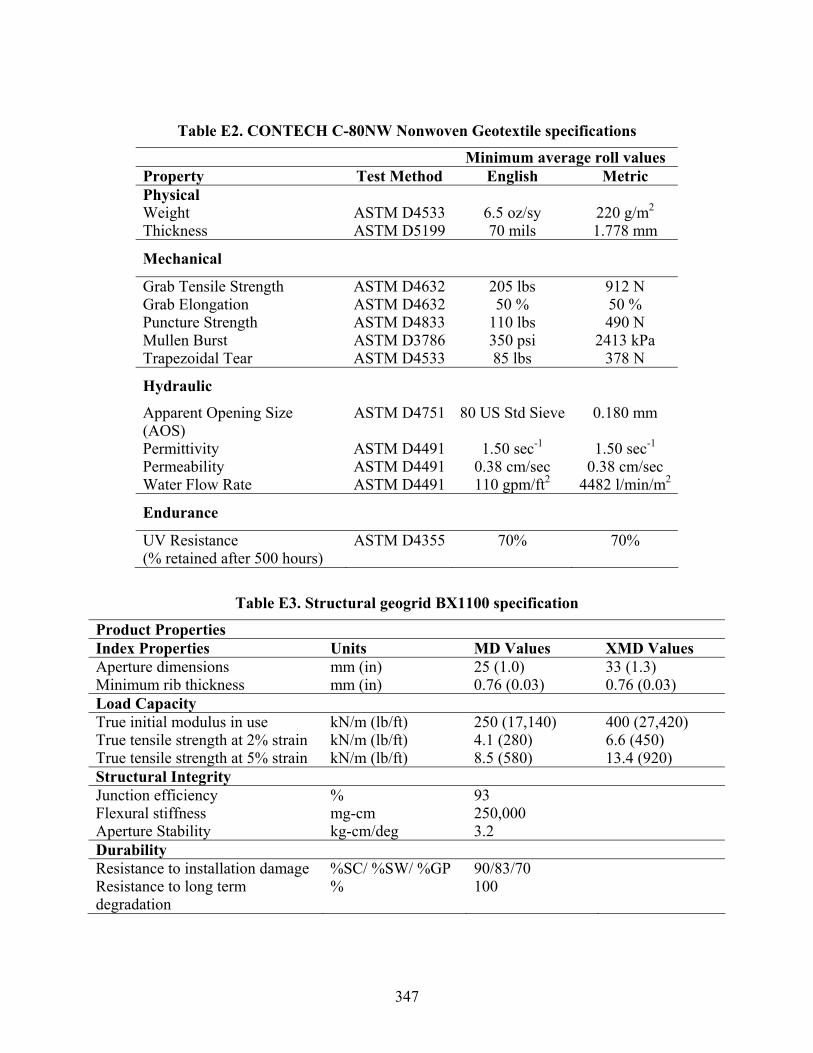
347
Table E2. CONTECH C-80NW Nonwoven Geotextile specifications
Minimum average roll values Property Test Method English Metric Physical Weight ASTM D4533 6.5 oz/sy 220 g/m2 Thickness ASTM D5199 70 mils 1.778 mm
Mechanical
Grab Tensile Strength ASTM D4632 205 lbs 912 N Grab Elongation ASTM D4632 50 % 50 % Puncture Strength ASTM D4833 110 lbs 490 N Mullen Burst ASTM D3786 350 psi 2413 kPa Trapezoidal Tear ASTM D4533 85 lbs 378 N
Hydraulic
Apparent Opening Size (AOS)
ASTM D4751 80 US Std Sieve 0.180 mm
Permittivity ASTM D4491 1.50 sec-1 1.50 sec-1 Permeability ASTM D4491 0.38 cm/sec 0.38 cm/sec Water Flow Rate ASTM D4491 110 gpm/ft2 4482 l/min/m2
Endurance
UV Resistance ASTM D4355 70% 70% (% retained after 500 hours)
Table E3. Structural geogrid BX1100 specification
Product Properties Index Properties Units MD Values XMD Values Aperture dimensions mm (in) 25 (1.0) 33 (1.3) Minimum rib thickness mm (in) 0.76 (0.03) 0.76 (0.03) Load Capacity True initial modulus in use kN/m (lb/ft) 250 (17,140) 400 (27,420) True tensile strength at 2% strain kN/m (lb/ft) 4.1 (280) 6.6 (450) True tensile strength at 5% strain kN/m (lb/ft) 8.5 (580) 13.4 (920) Structural Integrity Junction efficiency % 93 Flexural stiffness mg-cm 250,000 Aperture Stability kg-cm/deg 3.2 Durability Resistance to installation damage %SC/ %SW/ %GP 90/83/70 Resistance to long term degradation
% 100

348
Table E4. Tenax Ultra-Vera™ Geotextile specifications
Property Test Method Units Value Resin Density ASTM D1505 g/cm3 0.94 Melt Flow index ASTM D1238 1.0 Geocomposite Hydraulic properties Flow rate ASTM D4716 lpm/mm 10.8 Coefficient of permeability m/day 25,000 Reinforcement properties Tensile strength ASTM D4595 lb/ft (kN/m) 2500 (36.5) Number of load cycles before crack propagates
3000
Geonet core Thickness ASTM D5199 mils (mm) 300 (7.6) Creep reduction factor GRI-GC8 - 1.14 Carbon black content ASTM D4218 % 2.0-3.0 Nonwoven geotextile U.V. Resistance ASTM G 154 % 95 Color Orange Serviceability class AASHTO M-288 Class 1 Grab tensile ASTM D4632 lbs (N) 202 (900) Tear strength ASTM 4533 lbs (N) 79 (350) Puncture resistance ASTM 4833 lbs (N) 79 (350) CBR puncture resistance ASTM 6241 lbs (N) 449 (2000) AOS ASTM 4761 US Std. Sieve
(mm) 80 (0.18)
Permittivity ASTM 4491 Sec-1 0.5

349
Table E5. STRIPDRAIN 75 specifications
Property STRIPDRAIN 75 Test Method Core: Composition High density polyethylene Thickness 0.75 in. ASTM D5199 Compressive strength @ maximum 10% deflection
5,760 psf ASTM D1621
Flow capacity @ 10 psi, i = 1.0
12 gal./min./ft. width (minimum)
ASTM D4716
Fungus resistance No growth ASTM G21 Moisture absorption <0.05 % ASTM D570 Geotextile (minimum average roll values): Grab tensile strength 95 lbs. ASTM D4632 Grab elongation 50 % ASTM D4632 Trapezoidal tear 40 lbs. ASTM D4533 Mullen burst 180 lbs. ASTM D3786 Puncture 45 lbs. ASTM D4833 A.O.S. 70-100 ASTM D4751 Water flow rate 170 gal./min. per sq. foot. ASTM D4491 Coefficient of permeability 0.20 cm/sec ASTM D4491 Standard roll dimensions: Width 12”, 18”, 24”, 30”, and 36” Length 180’