Embed Size (px)
Citation preview

Identifying Gaps in
Canadian Healthcare:
Exploring Socioeconomic & Narrative Factors of
Medical Crowdfunding Campaigns
by Stacy Duan, Anthony Lee, Ross Michel, and Alysha van Duynhoven
Final Report
GEOG 455W – Spring 2018

Page 1 of 44
Table of Contents
1 – Introduction ............................................................................................................................................. 4
2 – Background ............................................................................................................................................. 5
3 – Literature Review .................................................................................................................................... 6
3.1 – Crowdfunding for Cancer ................................................................................................................ 6
3.2 – Previous Methods Used in Crowdfunding Studies .......................................................................... 7
3.3 – The Importance of Campaign Narratives on Crowdfunding Platforms ........................................... 8
3.4 – Geovisualization to Support Decision-Making and Hypothesis Generation ................................... 9
3.5 – Methods Chosen for this Study ........................................................................................................ 9
3.5.1 – Weighted Socioeconomic Data Conversion and Creation of Socioeconomic Quintiles ........... 9
3.5.2 – Exploratory Spatial Data Analysis ......................................................................................... 10
3.5.3 – Frequent Text Mining.............................................................................................................. 10
3.5.4 – Geovisualization to Support ESDA and Frequent Text Visualization ..................................... 11
3.5.5 – Objectives with Methods Selected ........................................................................................... 12
4 – Data ....................................................................................................................................................... 12
4.1 – Data Selection and Creation ........................................................................................................... 12
4.1.1 – Cancer-Related Crowdfunding Dataset Creation ................................................................... 12
4.1.2 – Administrative Boundaries ...................................................................................................... 13
4.1.3 – Socioeconomic Data ............................................................................................................... 14
4.2 – Data Pre-Processing and Transformation ...................................................................................... 14
4.2.1 – Processing Crowdfunding Data .............................................................................................. 14
4.2.2 – Adding Socioeconomic Data to FSA ....................................................................................... 14
5 – Methods................................................................................................................................................. 15
5.1 – Creation of Socioeconomic Quintiles ............................................................................................ 15
5.2 – Frequent Text Mining .................................................................................................................... 15
5.3 – Building a Geovisualization to Support ESDA and Frequent Text Visualization ......................... 17
6 – Results ................................................................................................................................................... 17
6.1 – Socioeconomic Variables ............................................................................................................... 18
6.2 – Text Mining ................................................................................................................................... 18
7 – Discussion ............................................................................................................................................. 18
7.1 – Interpretation of Obtained Results ................................................................................................. 18
7.1.1 – SES Quintiles and Campaign Instigators ................................................................................ 18
7.1.2 – Urban and Rural Divide ......................................................................................................... 19
7.1.3 – Terms Obtained from Frequent Text Mining .......................................................................... 20
Page 2 of 44
7.2 – Limitations of the Data .................................................................................................................. 20
7.2.1 – ADA to FSA Conversion Process ............................................................................................ 20
7.2.2 – Temporal Attributes of Campaign Data .................................................................................. 20
7.2.3 – Quality of Self-Reported Campaigner Information ................................................................. 21
7.2.4 – Other Limitations .................................................................................................................... 22
8 – Conclusion ............................................................................................................................................ 23
9 – References ............................................................................................................................................. 24
10 – Appendix ............................................................................................................................................. 28
10.1 – Related Links ............................................................................................................................... 28
10.2 – List of Figures .............................................................................................................................. 28
Figure 1 ............................................................................................................................................... 28
Figure 2 ............................................................................................................................................... 29
Figure 3 ............................................................................................................................................... 29
Figure 4 ............................................................................................................................................... 29
Figure 5 ............................................................................................................................................... 30
Figure 6 ............................................................................................................................................... 31
Figure 7 ............................................................................................................................................... 32
Figure 8 ............................................................................................................................................... 33
Figure 9 ............................................................................................................................................... 34
Figure 10 ............................................................................................................................................. 35
Figure 11 ............................................................................................................................................. 36
Figure 12 ............................................................................................................................................. 37
Figure 13 ............................................................................................................................................. 38
Figure 14 ............................................................................................................................................. 39
Figure 15 ............................................................................................................................................. 40
Figure 16 ............................................................................................................................................. 40
Figure 17 ............................................................................................................................................. 41
Figure 18 ............................................................................................................................................. 41
10.3 – List of Tables ............................................................................................................................... 42
Table 1 ................................................................................................................................................ 42
Table 2 ................................................................................................................................................ 42
Table 3 ................................................................................................................................................ 42
Table 4 ................................................................................................................................................ 43
Table 5 ................................................................................................................................................ 43
Table 6 ................................................................................................................................................ 44

Page 3 of 44
Acknowledgements
We would like to thank David Swanlund and Dr. Nadine Schuurman for their guidance throughout the
project. We are also grateful to Dr. Jeremy Snyder and Dr. Valorie Crooks for providing the project topic,
guidance, and feedback throughout the duration of this work. Lastly, we would like to acknowledge Dr.
Juhua Hu from the GeNA Lab, for her hard work in obtaining the medical crowdfunding dataset and for
answering our questions.
Disclaimer
This report was completed as part of a major final project for an undergraduate course, GEOG 455W, at
Simon Fraser University (for the Spring semester of 2018). The results of our project are not meant to
reflect the beliefs of any official organization or that of Simon Fraser University.

Page 4 of 44
1 – Introduction
Recent advances in social media technology have changed the way individuals and groups
fundraise. Social crowdfunding platforms have been developed to mediate online interactions between
campaigners and donors. Of the various crowdfunding platforms in existence, GoFundMe is the world’s
largest (GoFundMe, n.d.). Launched in 2010, GoFundMe has raised more than US$ 5 billion to date and
supports a community consisting of more than 50 million donors and users (GoFundMe, n.d.). According
to Sisler (2012) and Snyder, Mathers, and Crooks (2016), campaigns for medical purposes created on
GoFundMe comprise the largest proportion of campaigns on the platform. Crowdfunding platforms
provide “opportunities for anyone with Internet access to pitch an idea to their social network and beyond
and to gather funding to realize their work [or projects]” (Gerber, Hui, & Kuo, 2012, p. 1). Medical
crowdfunding campaigns utilize these digital infrastructures to leverage one’s social network and Internet
connection to raise funds for medically-related purposes (Gerber et al., 2012; Snyder et al., 2016). Several
factors preceding medical crowdfunding campaign creation include: “lack of insurance coverage for
medically essential or non-essential care, meeting needs related to actually obtaining medical care such as
travel costs and time off work, and obtaining funding for unproven interventions at home or abroad”
(Snyder et al., 2016, p. 27).
The use of crowdfunding platforms for medical purposes is expected to intesify (Snyder et al.,
2016; Young & Scheinberg, 2017). Crowdfunding provides an alternative approach to obtain funds for
medical purposes. However, this growing usage provokes various questions and incites a plethora of
ethical concerns (Snyder et al., 2016; Young & Scheinberg, 2017). Current literature on the subject matter
is scarce. Consequently, Snyder et al. (2016) made a call for further research to address: “Who benefits
the most from medical crowdfunding and how does medical crowdfunding affect access to medical care;
How does medical crowdfunding affect our understanding of the causes of inadequate access to medical
care; and How are campaigner and donor privacy affected by website design” (Snyder et al., 2016, p. 27).
Instigated by the GeNA Lab and Medical Crowdfunding Research Team at Simon Fraser University

Page 5 of 44
(SFU), further research in medical crowdfunding is underway (J. Snyder, personal communication,
January 18, 2018). This interdisciplinary group has developed a pilot dataset that contains information for
Canadian, cancer-related crowdfunding campaigns that were created on the GoFundMe platform (J.
Snyder, personal communication, January 18, 2018). The uniqueness of this dataset is that it contains
geographic information alongside campaigner information provided (J. Snyder, personal communication,
January 18, 2018). The medical crowdfunding campaigns possess enough postal code information to
permit linkage of campaign records to forward sortation areas (J. Snyder, personal communication,
January 18, 2018).
In this study, the inaugural medical crowdfunding dataset will be connected to a selection of
demographic information from the 2016 Canadian Census. This enables exploration of basic geo-
demographic trends using simple data analysis methods. These methods will include an exploratory
spatial data analysis involving the creation of quintiles for income, education, and home ownership
measures. Additionally, we will employ a frequent text mining algorithm to extract any correlations
between diction and success of campaigns, subsequently identifying if this correlation is geographical in
nature. The purpose of this work is to contribute a foundation to answer the first question posed by
Snyder et al. (2016) and to establish a framework to encourage further research and inquiries on the
subject of medical crowdfunding in Canada.
2 – Background
As mentioned previously, studies pertaining to medical crowdfunding are relatively scarce due to
the prematurity of the subject (Snyder et al., 2016). Many previous studies have been conducted with a
focus on the ethics of crowdfunding (Snyder, 2016; Snyder, Crooks, Mathers, & Chow-White, 2017), the
geography of crowdfunding (Agrawal, Catalini, & Goldfarb, 2011, 2015), or on crowdfunding in general
(Gerber et al., 2012). Gerber et al. (2012) found that donors are more inclined to contribute to
crowdfunding campaigns with intentions to initiate social interactions, seeking inclusion in online
communities. While this may be beneficial in a general crowdfunding context, Snyder (2016, p. 41) felt

Page 6 of 44
that medical crowdfunding campaigns should be treated as “indicators of health system shortcomings that
should be addressed in order to counter growing inequities.” The current unavailability of data has limited
exploration of geo-demographic aspects of medical crowdfunding and the characteristics of campaigners
(J. Snyder, personal communication, January 18, 2018). Lack of research in this subject area impedes
understanding on how “medical crowdfunding affects access to medical care” (Snyder et al., 2016, p. 27)
that could enable the identification of gaps and inequities within the Canadian healthcare system (Snyder,
2016).
The Medical Crowdfunding Research Team is working in conjunction with the GeNA Lab at
SFU to address the paucity of medical crowdfunding data. A dataset containing a snapshot of Canadian
cancer-related campaigns was retrieved from GoFundMe in May 2016 (J. Snyder, personal
communication, January 18, 2018). Other medically-related crowdfunding campaign datasets captured
across other time intervals and platforms are being created and processed at this time (J. Hu, personal
communication, February 23, 2018).
3 – Literature Review
3.1 – Crowdfunding for Cancer
Crowdfunding platforms are theorized to have begun in response to the global financial crisis in
2008 (Aitamurto, 2011). The GoFundMe platform was launched to support fundraising for the
“ceremonies in everyday life” such as funerals and weddings (Harvey, 2013). The platform has become
increasingly used for medical-related causes, which now constitute one of GoFundMe's largest categories
(Sisler, 2012). Medical crowdfunding helps individuals seek support outside the domain of the Canadian
healthcare system (Snyder, 2016). The increase in life expectancies and in the number of people afflicted
with cancer has overburdened healthcare systems globally (Snyder, Chow-White, Crooks, & Mathers,
2017; The Lancet Oncology, 2017). This onus on the Canadian healthcare system has been so drastic that
Canadians have been resorting to crowdfunding to obtain funding for “cancer-related care,” making it the

Page 7 of 44
prevailing motive of those seeking aid on these platforms across the country (Snyder, Chow-White, et al.,
2017, p. e240). However, this reliance on medical crowdfunding for cancer-related determinants only
serves as a temporary remedy for gaps in the healthcare system mentioned by Snyder (2016). There exist
ethical concerns pertaining to which groups will benefit most from crowdfunding. Groups incapable of
accessing or using crowdfunding platforms may be left at a disadvantage within the overburdened
healthcare system. As Snyder (2016, p. 39) explains, it “perpetuates systemic injustices.” While this
inequality should impel further research, Robinson et al. (2015) infer that the 'digital divide' is a
preventative barrier that restrains individuals from using crowdfunding platforms. Lack of social
networks, technological capabilities, or accessibility to certain technologies will impact an individual's
ability to conduct or succeed in medical crowdfunding initiatives (Robinson et al., 2015). Furthermore,
Romm (2015) claims that the distribution of care in medical crowdfunding campaigns are changing from
‘distribution based on medical necessity’ to ‘distribution based on deservedness’. Although medical
crowdfunding campaigns can greatly benefit some users, the proliferating use of these platforms has the
potential to exacerbate existing gaps in healthcare systems. By portraying patients as ‘victims of
misfortune’, the descriptions and persuasive narratives employed in self-authored crowdfunding
campaigns may draw attention away from the inadequacies of healthcare systems.
3.2 – Previous Methods Used in Crowdfunding Studies
According to Snyder and Crooks (personal communication, February 22, 2018), many large-scale
crowdfunding platforms release minimal geographic data for campaigners due to privacy concerns and to
keep data for their own benefit. As a result, many past studies conducted using crowdfunding datasets
have been inherently non-spatial. Lukkarinen, Teich, Wallenius, and Wallenius (2016) developed
regression models to better understand factors contributing to campaign success. Paulus and Roberts
(2017) conducted a narrative analysis to examine the wording campaigners employed to appeal to
potential donors. Finally, Aitamurto (2011) conducted a series of interview analyses to examine how
crowdfunding has impacted journalism as a professional field. The common theme between these and

Page 8 of 44
various other studies is that they are not geographic in nature and they are not focused on medical
crowdfunding. While Agrawal et al. (2015) and Agrawal et al. (2011) were able to incorporate geographic
components into their studies, their results were primarily quantitative rather than spatial. The methods
consisted mainly of empirical models and were limited to a smaller and categorically-limited
crowdfunding platform known as Sellaband (Agrawal et al., 2011, 2015).
3.3 – The Importance of Campaign Narratives on Crowdfunding Platforms
The GoFundMe platform sustains a crowdfunding model in which there is “no financial return to
the funders or backers” (Murphy, 2017, p. 11). Crowdfunding success for “patronage-based” platforms
relying on unreciprocated donations effectuates campaigner-sponsor interactions (Murphy, 2017).
Campaigners are equipped with a template enabling careful crafting of narratives to persuade sponsor
action. Narratives permit campaigners to relate to sponsors and instill “emotional resonance” by “tapping
into individuals most basic values, beliefs, and experiences” (Murphy, 2017, p. 16). Compelling text “can
change beliefs, attitudes, and behaviours” of sponsors, motivating them to financially contribute to a
cause (Murphy, 2017, p. 16). “Social media literacies are also critical to ensuring campaign success and
establishing deservingness” (Berliner & Kenworthy, 2017, p. 254).
The majority of successful crowdfunding campaigns use descriptions to persuade potential donors
that they are worthy of their donations (Majumdar & Bose, 2018). These descriptions, in the case of
medical crowdfunding, often include a back-story about the person in need accompanied by an
explanation of how the money will be spent. The narratives used within these descriptions are deeply
connected to the success of the campaign. Berliner and Kenworthy (2017) found that campaigns that
included enough contextual information without being overwhelmingly emotional were among the most
successful. These successful narratives also tended to project a sense of urgency whilst remaining
optimistic. Out of the one hundred and five cases in the Berliner study, zero portrayed the person in need
as weak or helpless. It was also found that the more successful campaigns stated their request for money
at the end of campaign descriptions. The ability to convey oneself as more deserving than other

Page 9 of 44
campaigners implies medical crowdfunding campaign text becomes an important tool for marketing one’s
cause (Berliner & Kenworthy, 2017). However, previous studies have not explored geographic patterns
emerging from successful campaign narratives that have motivated sponsor action.
3.4 – Geovisualization to Support Decision-Making and Hypothesis Generation
Geovisualization encompasses “visual exploration, analysis, synthesis, and presentation of
geospatial data” (Kraak, 2009, p. 468). Geovisualization techniques provide “a visual approach to
problem-solving” with the support of online and offline cartographic products (Kraak, 2009, p. 469).
Cartographic products such as Google Maps and Mapbox support expert and non-expert users in
displaying their spatially-referenced datasets and sharing this information with other users to interpret.
Combined with intuitive interfaces, geovisualizations incorporate interactivity to support “decision-
making and hypotheses generation” (Çöltekin, Bleisch, Andrienko, & Dykes, 2017, p. 117). Users from
varying backgrounds perceive visualizations in different ways, necessitating descriptive and informative
user interfaces and cartographic design (Çöltekin et al., 2017). Dimensionalities of datasets pose a
problem in geovisualization design, as information needs to be clearly conveyed to promote
understanding and to aid decision-making processes (Çöltekin et al., 2017).
3.5 – Methods Chosen for this Study
3.5.1 – Weighted Socioeconomic Data Conversion and Creation of Socioeconomic Quintiles
This study commences discussion pertaining to spatially-referenced medical crowdfunding
campaign data. Methods employed in this work will benefit from those contrived in other fields and were
selected based on the schema of available data. At the recommendation of Schuurman & Swanlund
(personal communication, February 19, 2018), our workflow establishes a linkage of the 2016 medical
crowdfunding dataset with forward sortation areas (FSAs, being areas with the same first three postal
codes values). Campaigns for each FSA are counted, and these frequencies are assigned to their
respective boundaries (see Figure 8). These FSAs are subsequently linked with aggregate dissemination
areas (ADAs) that feature census variables from the 2016 Canadian Census. These variables will consist

Page 10 of 44
of income, number of persons who have completed post-secondary education, and home ownership.
These were chosen based on personal communications with Schuurman, Crooks, & Snyder (personal
communication, February 22, 2018). Our selection was also informed by research conducted by Rogers
(1997) in which these variables were shown to be commonly associated with vulnerability with regards to
health and healthcare. To link these datasets, the variables will be weighted based on the percent of areal
overlap each ADA shares with each FSA. The resulting weighted attributes will then be divided into
quintiles using a method similar to the one conducted by Southern et al. (2002). Resulting quintiles will
then be visualized in an interactive cartographic display, enabling geographic comparisons to be made.
3.5.2 – Exploratory Spatial Data Analysis
The exploratory nature of our work permits the utilization of exploratory spatial data analysis
(ESDA). The genesis of the medical crowdfunding dataset provides an avenue to formulate questions and
to propose future research trajectories. ESDA facilitates the investigation of prior assumptions and guides
the identification of spatial patterns (Bailey & Gatrell, 1995; Haining, Wise, & Ma, 1998). Utilizing
graphic displays of spatially-referenced data enables generation of informed hypotheses and assists
selection of relevant statistical methods (Bailey & Gatrell, 1995). Through cartographic and tabular
representations, discovery of potential attribute correlations existing within the available dataset enables
more meaningful future analyses (Haining et al., 1998).
3.5.3 – Frequent Text Mining
Another method chosen was inspired by Cohen and Hersh (2005) mentioning that text mining
techniques have been increasingly used in health research to address the issue of information overload.
The online interpersonal dynamics supported by crowdfunding platforms amplify the importance of
fastidious discourse. The standardized interface provided by crowdfunding platforms bridge campaigner
and sponsor interactions generates a necessity to assess the discourse employed by successful
campaigners. The objective of frequent text mining is to detect interesting patterns arising in unstructured
corpora (Aggarwal, 2015). A multitude of frequent text mining algorithms have been developed to detect
textual patterns of statistical significance. The programming language ‘R’ will be used to perform

Page 11 of 44
frequent text extraction from on the medical crowdfunding dataset as there are many popular libraries
currently available for text mining. Using an existing text mining framework, an assessment of
statistically significant discourse will be performed to explore campaign narratives. The proposition for
extending this method includes a cartographic display of results to support exploration of spatial
distributions of frequent text patterns.
3.5.4 – Geovisualization to Support ESDA and Frequent Text Visualization
Geovisualization tools that support ESDA include interactive web mapping applications. These
tools allow users from all fields of expertise to explore both raw and aggregated datasets through using
interactive cartographic products. Mapbox is an open source "location data platform for mobile and web
applications" (https://www.mapbox.com/about/) that supports the creation of interactive web mapping
applications. The tool created for this work employs the Mapbox GL Javascript library "that uses WebGL
to render interactive maps" from a variety of data source types, including GeoJSON
(https://www.mapbox.com/mapbox-gl-js/api).
Previous work utilized Google Maps and open-source interface components to develop an
interactive tool for users to explore historic collections of newspapers in Texas, (Torget, Mihalcea,
Christensen, & McGhee, 2011). Using text search fields and sliders to support exploratory spatial data
analysis of the newspaper collection data, the developers also supported the assessment of language
patterns (Torget et al., 2011). Word counts were utilized in hopes “to expose revealing patterns by
discovering which words and phrases appear most frequently” (Torget et al., 2011, p. 25). As frequent
text mining has been selected as a conducive method to this application, the “Mapping Texts” word count
visualization lends well to the visualization of frequent terms emerging from the medical crowdfunding
dataset. However, this work will extend the “Mapping Texts” visualization construction by not only
displaying bar graph outputs, but also displaying the most frequent terms per FSA in a cartographic
output. Similarly, this work aims to not only create ‘word clouds’, but to develop an innovative,
interactive text visualization we have named with our liaisons a ‘geographic wordle.’

Page 12 of 44
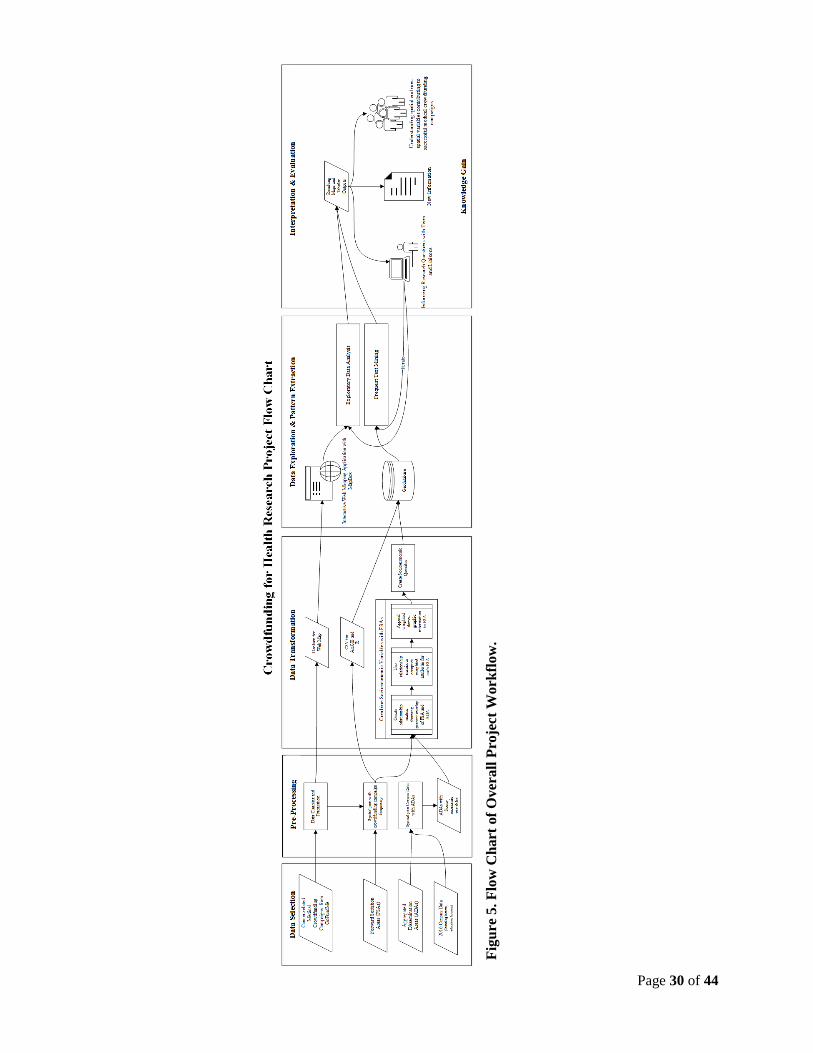
3.5.5 – Objectives with Methods Selected
The nature of this research necessitates the application of exploratory methods. Applying and
extending ESDA and frequent text mining methodology with the support of geovisualization techniques,
the aim of this contribution is to develop informed hypotheses, devise future research trajectories, and
link analysis methods to geographic data (see Figure 5 for the complete project workflow).
4 – Data
This study was enabled by automated data crawling agents and machine-learning techniques
utilized to construct a detailed medical crowdfunding dataset. A Knowledge Discovery in Databases
(KDD) process is applied to support exploration and analysis of variable correlations and spatial patterns
existing in this novel medical crowdfunding dataset. The KDD process model is interactive and iterative,
resulting in new knowledge obtained through the evaluation of emerging patterns (Bagga & Singh, 2011).
The goal of 'knowledge discovery' is met by selecting, pre-processing, and transforming data for the core
process of data mining (Bagga & Singh, 2011). The output of data mining algorithms are patterns, which
must be interpreted and evaluated for significance in the domain (Bagga & Singh, 2011).
4.1 – Data Selection and Creation
The datasets selected for this project include the following:
· Crowdfunding datasets including cancer-related campaigns from GoFundMe (2016)
· 2016 Census Profile for aggregate dissemination areas
· Aggregate dissemination area boundaries
· Forward sortation area boundaries
4.1.1 – Cancer-Related Crowdfunding Dataset Creation
The crowdfunding dataset containing cancer-related campaigns from May 2016 was created by an
automated web crawling algorithm developed by Dr. Juhua Hu from the GeNA Lab at SFU. The
GoFundMe platform is accessed via web browser, and the information is displayed using a graphical user

Page 13 of 44
interface (GUI) to constrain and guide user interactions (Preece, Sharp, & Rogers, 2015). While campaign
data is typically retrieved through user interaction, web crawling permits more efficient retrieval of
resources by downloading these web resources for knowledge discovery tasks (Aggarwal, 2015). Basic
web crawling algorithms are automated to fetch web page data “using the HTTP protocol” given a “seed
set of URLs” (Aggarwal, 2015, pp. 591-592). Unvisited URLs are iteratively added and subtracted from a
frontier list until a termination criterion has been met (Aggarwal, 2015). This particular algorithm was
devised to repeatedly query GoFundMe for each FSA until sufficient results were returned. The HTML of
resulting campaign pages were then downloaded in succession by the web crawling agent. Once the full
HTML files from each campaign were retrieved, the pages were then parsed to remove HTML tags.
Further cleaning and labeling using a machine learning algorithm aimed to learn missing information and
attributes of campaigns related to cancer. The final records were stored in a Redis database for access by
simple query for future analysis. The dataset used in this study contains 1788 records pertaining to
cancer-related campaigns created by Canadians.
4.1.2 – Administrative Boundaries
Aggregate dissemination areas (ADAs) are a new census product released by Statistics Canada as
part of the 2016 Canadian Census. Delineation of ADAs considers boundaries of previous census
products, including existing census divisions, census metropolitan areas, and census tracts (Statistics
Canada, 2016). Forward sortation areas (FSAs) are administrative boundaries determined by Canada Post
("Forward Sortation Area - Definition," 2015). They are alphanumerically represented by “the first three
characters in a Canadian postal code” ("Forward Sortation Area - Definition," 2015). The records
contained in the crowdfunding dataset described in section 4.1.1 have an FSA attribute. This geographic
data unit enables spatial questions to be explored that were not previously possible. Boundaries of ADAs
and FSAs were obtained from Statistics Canada (http://www12.statcan.gc.ca/census-
recensement/2011/geo/bound-limit/bound-limit-eng.cfm).

Page 14 of 44
4.1.3 – Socioeconomic Data
Socioeconomic status and its correlation with an individual's health or ability to obtain treatments
have been previously assessed at a FSA level (Alter, Naylor, Austin, & Tu, 1999; Goovaerts, 2012;
Kapral, Wang, Mamdani, & Tu, 2002). As mentioned in section 3.5, variables related to income,
education, and housing were chosen and obtained using the University of Toronto’s Canadian Census
Analyser at the ADA level (http://dc1.chass.utoronto.ca/census/index.html; see Table 1 for exact variables
obtained). Further data pre-processing and transformations were required in order to link socioeconomic
data to FSAs due to current data limitations.
4.2 – Data Pre-Processing and Transformation
4.2.1 – Processing Crowdfunding Data
The medical crowdfunding dataset had undergone significant cleaning prior to the start of this
project. Further processing was initiated to replace null values with synonymous integer values.
Quotations were also removed from campaign descriptions prior to exporting the records in a GeoJSON
format for use with Mapbox. Campaign records were geocoded based on city names provided by
campaigners. Further data preparation is needed to use this data with the frequent text mining method,
illustrated in section 5.2.
4.2.2 – Adding Socioeconomic Data to FSA
Currently, profile and boundary datasets for FSAs are unavailable for the Statistics Canada 2016
Census data (as of March 26, 2018). It was determined to compute the weighted average of
socioeconomic variables based on the percent of spatial overlap between ADAs and FSAs. To prepare for
this conversion, ADAs were spatially joined with data retrieved from the 2016 Census Profile. Each FSA
is also joined with respective campaign frequencies (see Figure 1 for the high-level description of
conversion procedure utilized to add socioeconomic data at ADA-level to FSA-level). Once the
relationship matrix has been generated from the function GenerateWeights, it can be retrieved and
Page 15 of 44
used to calculate weighted averages of socioeconomic variables contained in each intersecting ADA.
These weighted socioeconomic variables are appended to each respective FSA.
5 – Methods
5.1 – Creation of Socioeconomic Quintiles
Using ArcMap from the ArcGIS suite (version 10.5), quintiles were created using natural breaks.
Natural breaks were used after concluding with project liaisons that this method would be ideal in
highlighting distinct or statistically significant differences in the data (V. Crooks & N. Schuurman,
personal communication, March 15, 2018). The data was categorized as quintiles as we trusted that 5
classes would be sufficient to showcase differences while minimizing complexity of visual results. These
quintiles were used in cartographic representations to support ESDA tasks. Visual comparisons at
regional and provincial levels were then conducted with regards to income, education, and housing
ownership. The creation of these quintiles allowed project correspondents to examine the data for
geographic trends. These cartographic products enabled the significance of these socioeconomic variables
to be gauged for medical crowdfunding.
5.2 – Frequent Text Mining
To utilize the frequent text mining method, campaign titles and descriptions are used separately
from the other attributes contained in the cancer-related campaign dataset. Campaign titles and
descriptions are unstructured text fields contained in each crowdfunding record. These irregular fields
must be prepared for frequent text mining methods to yield meaningful results. Steps to prepare text
include: stop word removal, stemming, and punctuation mark removal (Aggarwal, 2015). ‘Stop words’
refer to “commonly occurring words that provide very little information about the actual content of the
document” (Aggarwal, 2015, p. 431). Omitting meaningless words is imperative to expose significant
words employed to encourage sponsor engagement. Stemming refers to the consolidation of word
variations (Aggarwal, 2015, p. 431). For instance, if a campaigner devises a title including the word
‘helping’, and another with the title including ‘help’, stemming enables the identification of these words
Page 16 of 44
based on their shared root (Aggarwal, 2015). Finally, punctuation marks and non-alphabetic characters
are removed, leaving an unordered ‘bag-of-words’ (Aggarwal, 2015).
'R' is an interpreted programming language developed for "statistical computing and graphics"
("What is R?," n.d.). The ‘tm’ package was selected to provide a "text mining framework" (Feinerer,
2013). To generate the frequency of terms, term-document matrices are used to capture relationships
between the frequency of terms and documents in which they occur. In the context of this application,
document objects refer to campaign records. For each campaign, term frequency will be computed and
stored in this relationship matrix. After the term-document matrix is generated, further operations can be
performed to detect patterns. The matrix structure enables the extraction of the most frequent terms,
cluster analysis, derivation of association rules, and other statistical operations.
To conduct the frequent text mining analyses, it was determined to extract frequent terms from
the campaign titles and descriptions separately. This is due to antecedent expectations of varying
language used in text fields provided for different purposes within the crowdfunding campaign templates.
Preliminary observations of campaign titles shows language to be largely irrelevant to explaining the
actual reason for requesting funds. Campaign descriptions include more detailed narratives
demonstrating the need of the campaigner and/or recipient of the funds. The following steps were
conducted on the campaign titles and descriptions separately: 1) create corpora of terms included in each
entry of the dataset, 2) remove stop-words, punctuation, whitespace, numbers, and common names from
the text, 3) create term-document matrix with the cleaned results, 4) remove sparse terms, and 5) extract
the frequently occurring words (see Figure 6). Results of running the frequent text mining procedure on
the campaign titles and descriptions were then combined with the FSAs. For each row in the resulting
matrix, we can extract which frequent terms appeared per campaign and how many times each of these
terms appeared. Since multiple campaigns can exist for each FSA, results were aggregated to generate a
dataset of frequent terms per FSA. The top 3 terms per FSA were extracted and appended to each FSA
entry. These results were geocoded using the Google Maps API and then stored in a GeoJSON format for

Page 17 of 44
display in the interactive web mapping tool. Users are able to view the most frequent term per FSA, and
upon clicking the text, they are able to view the top 3 terms for each FSA.
5.3 – Building a Geovisualization to Support ESDA and Frequent Text Visualization
An interactive 2D web mapping application was developed using the Mapbox GL Javascript API
to support ESDA tasks and frequent text visualization per FSA. Crowdfunding campaign markers were
depicted and afford interaction by clicking and through a searchable list accompanying the cartographic
representation (see Figure 7). Clicking and adjusting user interface components such as buttons, toggles,
and sliders propagate filtering of campaign location markers. Providing real-time feedback for user inputs
provides a workflow to interpret data quickly and reversibly as various exploration activities are
performed (Preece et al., 2015). Utilizing data layers generated from weighted socioeconomic data and
the frequent text mining method, users are supported in their “decision-making and hypothesis
generation” workflows (Çöltekin et al., 2017, p. 117). Examples of user sequences supported by the tool
developed are elaborated in Figures 2, 3, and 4.
6 – Results
The results of our project can be thoroughly examined through our web mapping tool
(https://alyshav.com/chrp/explore/; see Figure 7). Our results can be categorized as either exploratory or
analysis layers. The exploratory layers consist of the socioeconomic variables that have been linked with
FSAs. These include a layer of campaign counts per FSA, income, education, and housing (see Figures 8,
9, 10, & 11 for screen captures). The analysis layers consist of the text mining results. These layers
consist of ‘geographic wordles’ for the top three terms used in campaign titles and campaign descriptions
(see Figures 12, 13, & 14 for screen captures).
Page 18 of 44
6.1 – Socioeconomic Variables
In addition to the web map, a table was generated that showed the proportion of crowdfunding
campaigns that belonged in each quintile for each socioeconomic variable (see Tables 2, 3, 4, & 5). It is
important to note that only 176 FSAs out of the 1620 FSAs in Canada contained at least one
crowdfunding campaign, accounting for about 1.5 million people in terms of population or about 5% of
the national total (see Table 6). A separate table was also generated that shows the distribution of the
crowdfunding campaigns between each province and territory of Canada and the average value of each
socioeconomic variable within each of the administrative divisions (see Table 6). These tables resulted
from a manual process that involved examining the data using ArcGIS 10.5 and placing the information
into Microsoft Excel. These tables will assist in discovering the previously mentioned geographic trends
or help expose gaps within the Canadian healthcare system.
6.2 – Text Mining
Word clouds were created that denote the most frequent terms that can be observed within the
titles of each respective crowdfunding campaigns and for the description of the campaigns (see Figures 17
& 18). 'Geographic wordles' were also created in an attempt to discover geographic trends pertaining to
frequently used terms in campaign titles and descriptions (see Figures 12, 13, & 14). Lastly, bar graphs
were created to showcase the most frequent terms used in the campaign titles and campaign descriptions
(see Figures 15 & 16).
7 – Discussion
7.1 – Interpretation of Obtained Results
7.1.1 – SES Quintiles and Campaign Instigators
It was expected that the average income of crowdfunding campaigners that use GoFundMe for
cancer-related purposes would lie within middle to high levels. This expectation aligned with our results,
as approximately 65.49% of campaigns are located in FSAs within the 3 highest quintiles within the

Page 19 of 44
income category (see Table 3). We also expected that those who resorted to crowdfunding for cancer-
related purposes would consist of groups who have obtained post-secondary education and those who rent
housing rather than own. These expectations were made based on assumptions and previous work
assessing types of individuals that have greater numbers of social networks, higher technological abilities,
and greater accessibility to crowdfunding platforms (J. Snyder & V. Crooks, personal communication,
January 25, 2018). Our results corresponded with these predictions, with education values tending toward
the larger quintiles and housing ownership values being larger in the middle quintile (see Tables 4 & 5).
However, we cannot assume whether these variables directly influence one’s choice to crowdfund for
medical purposes as they could simply a function of population.
7.1.2 – Urban and Rural Divide
We also forecasted distinct differences in results between urban and rural areas (J. Snyder & V.
Crooks, personal communication, January 25, 2018). It was speculated that rural areas would have less
crowdfunding campaigns for a variety of reasons. Reasons included assumptions of smaller social support
networks, lower education levels, and lesser access to technology (J. Snyder & V. Crooks, personal
communication, January 25, 2018). Due to the large aggregations of FSAs, it was difficult to determine
whether there was a clear urban and rural divide. Upon examination of our visual results (see Figures 7 &
8), it is evident that the frequency of campaigns was typically greater closer to city centres. It can be said
that our results are inconclusive as to whether or not it demonstrates a clear urban or rural divide. While
the results show that campaigns are more prevalent in Ontario and British Columbia and less so in the
maritime and territories, we cannot confirm if this is due to respective variations in the population.
However, it is worth noting that there is a distinctive increase in crowdfunding campaign density in the
prairies, particularly in Alberta and Saskatchewan. Results for Nunavut show that it has virtually no
population which causes it to have skewed SES variables (see Table 6). This is due to our chosen
methodology which can be considered as a systematic limitation exaggerated by the sparse population of
Nunavut.

Page 20 of 44
7.1.3 – Terms Obtained from Frequent Text Mining
Our results from the text mining aspect of our project can be considered as inconclusive or
producing insignificant results. We found that frequent terms in campaign titles and campaign
descriptions differed (see Figures 15 & 16). The term ‘cancer’ was the most frequently used term at a
national scale, which was to be expected as the dataset used was centered on cancer. Verbs such as
‘battle’, ‘fight’, ‘help’, ‘fund’, and ‘beat’ were frequently seen in campaign titles with ‘battle’ and ‘fight’
being more common in eastern provinces than their western counterparts. Terms including ‘help’,
‘treatment’, ‘family’, and time-related words (i.e. ‘weeks’, ‘months’) are more frequent in crowdfunding
campaign descriptions. We did not find any distinct geographic patterns in specific frequency of words
used in either campaign titles or descriptions and the terms used were typically similar at both regional
and national scales.
7.2 – Limitations of the Data
7.2.1 – ADA to FSA Conversion Process
Our research is limited by the data collected from GoFundMe. The primary spatial information
was the first three digits of the postal codes which were then linked to FSAs. FSAs are smaller in urban
areas and may be geographically vast in rural areas. Linking ADAs to FSAs can result in broad
generalizations and aggregation errors (N. Schuurman, personal communication, February 19, 2018). This
potentially introduced ecological fallacies into our results. This implies that findings from our study are
limited, as only broad claims can be stated. The aforementioned generalizations could be less impacted in
urban areas with smaller FSAs comparatively to rural areas. While this has implications on our results, the
impact may be reduced considering that as of 2011, over 80% of Canada’s population lives in urban
environments (Statistics Canada, 2011).
7.2.2 – Temporal Attributes of Campaign Data
The data is also only a snapshot that does not capture the dynamic nature of campaigns. It was

Page 21 of 44
collected over a period of a few days and only captured the campaigns that existed during that time
interval. It also only depicts the campaign state during that specific range, which means that the variables,
such as the amount of money collected, are not likely to be accurate representations of the actual value
raised. For example, a campaign that was created on the last day of the web crawling duration may not
have raised enough money to meet its goal. In the current dataset, this would be shown as an unsuccessful
campaign. This is problematic because it does not capture the campaign dynamics over time. It would be
advantageous to collect the campaign data over a longer duration to capture varying states of each
campaign as attributes such as the amount raised are not static features. This would reduce some of the
major limitations of the data and increase its usefulness to show inequalities and variables of success.
These limitations are unavoidable with the data provided, impacting the selection of methods for this
work. The methods were picked to minimize fallacies introduced to the research. Problems arising from
the current dataset will help provide direction for future data collection and research.
7.2.3 – Quality of Self-Reported Campaigner Information
Another data limitation is that campaigner information is self-authored by persons seeking
financial support. Campaigners may craft campaigns with falsified information to motivate donors.
Campaigner information is also limited as it contains minimal geographic information besides the city
and FSA. Within a campaign description, other details might exist inconsistently throughout the site, such
as gender, marital status, and parental status. The success of the campaign is dependent on one’s ability to
market themselves and increase the likeliness of donors to take action. Whether campaigner’s truths or
embellishments motivate these donors should be assessed in future medical crowdfunding research.
Additionally, instances exist in the current dataset where the recipient may be different from
campaign’s creator. This poses an issue and necessitates further research because campaigners may reside
in or report different FSAs than the individual or family in need of financial assistance. Our analysis was
conducted under the assumption that the recipient and campaign creator are the same person or that they
live in close proximity to each other (i.e. not in different provinces or FSAs). The postal codes are also

Page 22 of 44
self-reported which allows campaign instigators to make errors or misstate their geographic location. An
assumption upheld prior to implementing methods and conducting analyses was that differences would
exist between the geographic location of campaigners and recipients especially in the maritime provinces.
Assessment of self-reported of campaigns requires more research, as more concrete conclusions cannot be
ascertained without introducing bias. Consequently, we aim to minimize dependence on assumptions for
drawing conclusions about socioeconomic status and the potential gaps in the Canadian healthcare
system.
7.2.4 – Other Limitations
Several additional limitations were encountered throughout this project. The most prominent is
associated with the accuracy of the medical crowdfunding dataset provided at the outset of the project. It
was observed that an FSA encapsulating a relatively rural region in southwest of British Columbia (The
postal code beginning with V0S) contained an abnormally high number of campaigns (102). Upon closer
inspection, we found that this was an error that was likely introduced either when the medical
crowdfunding dataset was initially created or by user error. Cities attributed to these campaign entries
tended to lie outside the FSA they were linked to. For example, campaigner's self-reported cities could
include Vancouver or Burnaby, BC, but the record was linked to this incorrect FSA. Due to the city-level
geocoding conducted in the data pre-processing stage, these discrepancies are exacerbated as campaign
markers do not always align with the associated FSA in the web mapping application view.
FSAs encoded in the campaign entries dictated the primary level of aggregation for our study,
thus necessitating us to limit selection of socioeconomic variables. It was recommended that few common
or easily understood variables be selected to make to make regional comparisons as we would be unable
to make specific claims due to risks of potential generalization or aggregation fallacies (N. Schuurman,
personal communication, February 19, 2018). If spatial and non-spatial attributes were improved, more
socioeconomic status variables could be involved, such as gender or immigration status. This would aid in
obtaining more robust results. Another limitation encountered was the fact that the census profiles at the

Page 23 of 44
FSA-level were unavailable during the course of our project due to accuracy issues (Statistics Canada,
2018). To substitute, a methodology to link and weight the chosen socioeconomic variables from the
ADA-level to FSA-level had to be developed (see Methods section). Lastly, due to technological
constraints, the geographic visual representation of the FSA dataset was simplified for viewing on our
web map as its initial file size was too large for the existing configuration. This simplification introduced
visual generalizations on our web map but did not impede previously computed numerical results.
8 – Conclusion
There is an obvious lack of academic literature on medical crowdfunding. This inspired Snyder et
al. (2016) to make a call for further research in the subject matter. Using the given 2016 medical
crowdfunding dataset, we developed an initial framework that can handle datasets of this nature and can
be used to further geographic research on medical crowdfunding. Exploratory work performed enabled
regional comparisons using socioeconomic variables related to income, education and housing. We found
that the prairie provinces, particularly Alberta and potentially Saskatchewan, could be areas of interest for
future studies exploring medical crowdfunding in Canada. These provinces possess unusually high
amounts of campaigns relative to their respective populations and to the rest of the nation. Results from
the text mining procedure were insignificant and did not expose major geographic trends of discourse
utilized across the nation.
Due to the limitations associated with our data, the robustness of our study was restricted. The
idyllic medical crowdfunding dataset would contain up-to-date entries obtained at the 6-digit postal code
level rather than the 3-digit FSA level. Additionally, having FSA-level census profiles instead of using
weighted socioeconomic variable data from an ADA-level would reduce the amount of fallacy
introduced. In several cases, definitive claims from results obtained could not be made as it was uncertain
whether particular variables were behaving as a function of population. It would be beneficial if future
studies involved exploratory regression work.

Page 24 of 44
9 – References
Aggarwal, C. C. (2015). Data Mining: The Textbook. Yorktown Heights, New York: Springer.
Agrawal, A., Catalini, C., & Goldfarb, A. (2011). The Geography of Crowdfunding. National Bureau of
Economic Research Working Paper Series, No. 16820. doi: 10.3386/w16820
Agrawal, A., Catalini, C., & Goldfarb, A. (2015). Crowdfunding: Geography, Social Networks, and the
Timing of Investment Decisions. Journal of Economics & Management Strategy, 24(2), 253-274.
doi: 10.1111/jems.12093
Aitamurto, T. (2011). The Impact of Crowdfunding on Journalism: Case study of Spot.Us, a platform for
community-funded reporting. Journalism Practice, 5(4), 429-445. doi:
10.1080/17512786.2010.551018
Alter, D. A., Naylor, C. D., Austin, P., & Tu, J. V. (1999). Effects of Socioeconomic Status on Access to
Invasive Cardiac Procedures and on Mortality after Acute Myocardial Infarction. New England
Journal of Medicine, 341(18), 1359-1367. doi: 10.1056/nejm199910283411806
Bagga, S., & Singh, G. N. (2011). Three Phase Iterative Model of KDD. International Journal of
Information Technology and Knowledge Management, 4(2), 695-697.
Bailey, T. C., & Gatrell, A. C. (1995). Interactive spatial data analysis.
Berliner, L. S., & Kenworthy, N. J. (2017). Producing a worthy illness: Personal crowdfunding amidst
financial crisis. Social Science & Medicine, 187, 233-242. doi: 10.1016/j.socscimed.2017.02.008
Cohen, A. M., & Hersh, W. R. (2005). A survey of current work in biomedical text mining. Briefings in
Bioinformatics, 6(1), 57-71. doi: 10.1093/bib/6.1.57
Çöltekin, A., Bleisch, S., Andrienko, G., & Dykes, J. (2017). Persistent challenges in geovisualization – a
community perspective. International Journal of Cartography, 3(sup1), 115-139. doi:
10.1080/23729333.2017.1302910
Feinerer, I. (2013). Introduction to the tm Package: Text Mining in R. Retrieved February 23, 2018,
from https://cran.r-project.org/web/packages/tm/vignettes/tm.pdf

Page 25 of 44
Forward Sortation Area - Definition. (2015). Retrieved February 23, 2018, from
https://www.ic.gc.ca/eic/site/bsf-osb.nsf/eng/br03396.html
Gerber, E., Hui, J., & Kuo, P.-Y. (2012). Crowdfunding: Why People are Motivated to Post and Fund
Projects on Crowdfunding Platforms. Paper presented at the 2012 ACM Conference on Computer
Supported Cooperative Work.
GoFundMe. (n.d.). GoFundMe - About Us. Retrieved February 18, 2018, from
https://www.gofundme.com/about-us
Goovaerts, P. (2012). Geostatistical analysis of health data with different levels of spatial aggregation.
Spatial and Spatio-temporal Epidemiology, 3(1), 83-92. doi: 10.1016/j.sste.2012.02.008
Haining, R., Wise, S., & Ma, J. (1998). Exploratory Spatial Data Analysis. Journal of the Royal
Statistical Society: Series D (The Statistician), 47(3), 457-469. doi: 10.1111/1467-9884.00147
Kapral, M. K., Wang, H., Mamdani, M., & Tu, J. V. (2002). Effect of Socioeconomic Status on
Treatment and Mortality After Stroke. Stroke, 33(1), 268.
Kraak, M. (2009). Geovisualization. In R. Kitchin & N. Thrift (Eds.), International Encyclopedia of
Human Geography (pp. 468-480).
Lukkarinen, A., Teich, J. E., Wallenius, H., & Wallenius, J. (2016). Success drivers of online equity
crowdfunding campaigns. Decision Support Systems, 87, 26-38. doi: 10.1016/j.dss.2016.04.006
Majumdar, A., & Bose, I. (2018). My words for your pizza: An analysis of persuasive narratives in online
crowdfunding. Information & Management. doi: 10.1016/j.im.2018.03.007
Murphy, M. L. (2017). Startup storytelling : an analysis of narrative in rewards and equity based
crowdfunding campaigns. (Doctor of Philosophy), University of Texas at Austin.
Paulus, T. M., & Roberts, K. R. (2017). Crowdfunding a “Real-life Superhero”: The construction of
worthy bodies in medical campaign narratives. Discourse, Context & Media. doi:
10.1016/j.dcm.2017.09.008
Preece, J., Sharp, H., & Rogers, Y. (2015). Interaction Design: Beyond Human-Computer Interaction.
Chichester: Wiley.

Page 26 of 44
Robinson, L., Cotten, S. R., Ono, H., Quan-Haase, A., Mesch, G., Chen, W., . . . Stern, M. J. (2015).
Digital inequalities and why they matter. Information, Communication & Society, 18(5), 569-582.
doi: 10.1080/1369118X.2015.1012532
Rogers, A. C. (1997). Vulnerability, health and health care. Journal of Advanced Nursing, 26(1), 65-72.
doi: 10.1046/j.1365-2648.1997.1997026065.x
Romm, C. (2015). Is It Fair to Ask the Internet to Pay Your Hospital Bill? The ethical issues that come
with crowdfunded healthcare. Retrieved March 25, 2018, from
https://www.theatlantic.com/health/archive/2015/03/is-it-fair-to-ask-the-internet-to-pay-your-
hospital-bill/387577/
Sisler, J. (2012). Crowdfunding for medical expenses. Canadian Medical Association Journal, 184(2),
E123-E124. doi: 10.1503/cmaj.109-4084
Snyder, J. (2016). Crowdfunding for Medical Care: Ethical Issues in an Emerging Health Care Funding
Practice. Hastings Center Report, 46(6), 36-42. doi: 10.1002/hast.645
Snyder, J., Chow-White, P., Crooks, V. A., & Mathers, A. (2017). Widening the gap: additional concerns
with crowdfunding in health care. The Lancet Oncology, 18(5), e240. doi: 10.1016/S1470-
2045(17)30259-0
Snyder, J., Crooks, V. A., Mathers, A., & Chow-White, P. (2017). Appealing to the crowd: ethical
justifications in Canadian medical crowdfunding campaigns. Journal of Medical Ethics. doi:
10.1136/medethics-2016-103933
Snyder, J., Mathers, A., & Crooks, V. A. (2016). Fund my treatment!: A call for ethics-focused social
science research into the use of crowdfunding for medical care. Social Science & Medicine, 169,
27-30. doi: 10.1016/j.socscimed.2016.09.024
Southern, D. A., Ghali, W. A., Faris, P. D., Norris, C. M., Galbraith, P. D., Graham, M. M., & Knudtson,
M. L. (2002). Misclassification of Income Quintiles Derived from Area-based Measures: A
Comparison of Enumeration Area and Forward Sortation Area. Canadian Journal of Public
Health / Revue Canadienne de Sante'e Publique, 93(6), 465-469.

Page 27 of 44
Statistics Canada. (2011). Population, urban and rural, by province and territory (Canada). Retrieved
February 23, 2018, from http://www.statcan.gc.ca/tables-tableaux/sum-som/l01/cst01/demo62a-
eng.htm
Statistics Canada. (2016). The aggregate dissemination area (ADA): a new census dissemination
geographic area. Retrieved February 23, 2018, from http://www12.statcan.gc.ca/census-
recensement/2016/geo/ADA/adainfo-eng.cfm
Statistics Canada. (2018). Forward sortation areas currently being analyzed, 2016 Census. Retrieved
February 25, 2018, from http://www12.statcan.gc.ca/census-recensement/2016/ref/FSA-note-
eng.cfm
The Lancet Oncology. (2017). Mind the gap: charity and crowdfunding in health care. The Lancet
Oncology, 18(3), 269. doi: 10.1016/S1470-2045(17)30117-1
Torget, A. J., Mihalcea, R., Christensen, J., & McGhee, G. (2011). Mapping Texts: Combining Text-
Mining and Geo-Visualization to Unlock the Research Potential of Historical Newspapers:
National Endowment for the Humanities.
What is R? (n.d.). Retrieved February 23, 2018, from https://www.r-project.org/about.html
Young, M. J., & Scheinberg, E. (2017). The rise of crowdfunding for medical care: Promises and perils.
JAMA, 317(16), 1623-1624. doi: 10.1001/jama.2017.3078

Page 28 of 44
10 – Appendix
10.1 – Related Links
• Code References for Project:
o https://github.com/alyshav/CrowdfundingForHealthResearchProject
o https://github.com/alyshav/ArcPy-Calculate-Percent-Area-Shared-and-Compute-Weighted-
Values
o https://github.com/alyshav/CHRP-DataMining
• Interactive Exploratory Spatial Data Analysis tool: https://alyshav.com/chrp/explore
10.2 – List of Figures
Algorithm GenerateWeights(ADA dataset, FSA dataset)
begin
a = Number of FSA, b = Number of ADA
Initialize relationship matrix of size a rows by b columns
For each i ∈ {FSA1...FSAa):
Select all from ADA that intersect with FSAi
For each j ∈ {intersecting ADA retrieved in selection}:
Calculate percent area that ADAj occupies in FSAi
Add weight to matrix at the position corresponding with the respective FSA
and ADA IDs.
Store relationship matrix as CSV for reuse
end
Figure 1. High-Level Description of Conversion Procedure Utilized to add Socioeconomic Data at
ADA-Level to FSA-Level.

Page 29 of 44
The User:
1. Views the "CHRP Explorer" web mapping application
2. Clicks and drags the map to populate the campaign list sidebar
3. Clicks on campaign markers or hovers over sidebar listings to learn more about individual
Canadian medical crowdfunding campaigns
4. Uses the basic filters slider to filter campaigns to have at least $10,000 raised, more than 300
friends, and at least 100 donations
5. Clicks the "Exploratory" tab to change the panel contents
6. Selects "Income" under the "Campaign - Socioeconomic Variable Comparison Layers by
Forward sortation area" section
7. Zooms into a geographic area of interest and clicks on a coloured area to view the median income
average for that FSA the campaign is associated with
Figure 2. Sample interaction sequence to support adding context to campaign markers in the
interactive web mapping tool
The User:
1. Views the "CHRP Explorer" web mapping application
2. Deselects the "Campaign Markers" checkbox from "Feature Layers" in "Features & Filters"
3. Clicks the "Analysis" tab to change the panel contents
4. Clicks the 'Frequent Terms from Campaign Titles" radio button to enable geographic wordle
5. Zooms in the various geographic regions to view terms and term distribution
6. Clicks a term to view the associate FSA, along with the top 3 terms for that particular FSA
Figure 3. Sample interaction sequence to support geographic wordle viewing
The User:
1. Views the "CHRP Explorer" web mapping application
2. Deselects the "Campaign Markers" checkbox from "Feature Layers" in "Features & Filters"
3. Clicks the "Exploratory" tab to change the panel contents
4. Selects the Heatmap" checkbox to enable the heatmap layer
5. Selects the "Housing (Ownership)" radio button to enable the housing data layer
6. Zooms in to view the properties associated with higher densities of campaigns
7. Clicks on a coloured area to view the approximate number of people in that FSA that own their
own house
Figure 4. Sample interaction sequence to support adding context to high densities of Canadian
medical crowdfunding campaigns instigated
Page 30 of 44
Fig
ure
5.
Flo
w C
hart
of
Ov
era
ll P
roje
ct W
ork
flow
.

Page 31 of 44
Figure 6. Flow Chart of Text Mining Methodology.

Page 32 of 44
Fig
ure
7. S
cree
n C
ap
ture
of
Web
Map
Ap
pli
cati
on
(M
ain
Page)
.

Page 33 of 44
Fig
ure
8. S
cree
n C
ap
ture
of
Web
Map
Ap
pli
cati
on
(w
ith
th
e E
xp
lora
tory
layer
of
Fre
qu
ency
Co
un
ts o
f C
am
paig
ns
per
FS
A D
isp
lay
ed
).

Page 34 of 44
Fig
ure
9. S
cree
n C
ap
ture
of
Web
Map
Ap
pli
cati
on
(w
ith
th
e E
xp
lora
tory
layer
of
Inco
me
(Med
ian
, A
fter
-Ta
x, 2
01
5)
Dis
pla
yed
).

Page 35 of 44
Fig
ure
10
. S
cree
n C
ap
ture
of
Web
Map
Ap
pli
cati
on
(w
ith
Exp
lora
tory
layer
of
Ed
uca
tion
(N
um
ber
of
Peo
ple
wit
h a
Po
st-S
eco
nd
ary
Ed
uca
tio
n)
Dis
pla
yed
).

Page 36 of 44
Fig
ure
11
. S
cree
n C
ap
ture
of
Web
Map
Ap
pli
cati
on
(w
ith
th
e E
xp
lora
tory
layer
of
Hou
sin
g (
Nu
mb
er o
f P
eop
le t
ha
t o
wn
ho
mes
)
Dis
pla
yed
).

Page 37 of 44
Fig
ure
12
. S
cree
n C
ap
ture
of
Web
Map
Ap
pli
cati
on
(w
ith
th
e A
naly
sis
layer
of
Fre
qu
ent
Ter
ms
use
d i
n C
am
pa
ign
Tit
les
Dis
pla
yed
).

Page 38 of 44
Fig
ure
13
. S
cree
n C
ap
ture
of
Web
Map
Ap
pli
cati
on
(w
ith
th
e A
naly
sis
layer
of
Fre
qu
ent
Ter
ms
use
d i
n C
am
pa
ign
Des
crip
tio
ns
Dis
pla
yed
).

Page 39 of 44
Fig
ure
14
. S
cree
n C
ap
ture
of
Web
Map
Ap
pli
cati
on
(w
ith
th
e A
naly
sis
layer
of
Fre
qu
ent
Ter
ms
use
d i
n C
am
pa
ign
Des
crip
tio
ns
Dis
pla
yed
). T
his
Fig
ure
sh
ow
s a
n E
xam
ple
of
a P
op
-Up
Box (
wh
ich
des
cri
bes
Oth
er F
req
uen
tly U
sed
Ter
ms)
.

Page 40 of 44
Figure 15. Bar Graph of Frequently Used Terms in 2016 Cancer-Related Medical Crowdfunding
Campaign Titles (from GoFundMe).
Figure 16. Bar Graph of Frequently Used Terms in 2016 Cancer-Related Medical Crowdfunding
Campaign Descriptions (from GoFundMe).

Page 41 of 44
Figure 17. Word Cloud of Frequently Used Terms in 2016 Cancer-Related Medical Crowdfunding
Campaign Titles (from GoFundMe).
Figure 18. Word Cloud of Frequently Used Terms in 2016 Cancer-Related Medical Crowdfunding
Campaign Descriptions (from GoFundMe).

Page 42 of 44
10.3 – List of Tables
Table 1. Variables Obtained from 2016 Census Profiles for Aggregate Dissemination Areas.
Retrieved from the Canadian Census Analyser, University of Toronto
Quintile Number of
FSA
Percentage
(FSA)
Number of
Campaigns
Percentage
(Campaigns)
1 - 5 114 64.77% 247 13.81%
6 - 17 36 20.45% 337 18.85%
18 - 41 16 9.09% 402 22.48%
42 - 76 6 3.41% 362 20.25%
77 - 138 4 2.27% 440 24.61%
Total 176 100.00% 1788 100.00%
Table 2. Frequency of Campaigns per FSA. Proportion of Campaigns belonging to each Quintile.
Quintile Number of
FSA
Percentage
(FSA)
Number of
Campaigns
Percentage
(Campaigns)
$0.00 - $12699.19 3 1.70% 104 5.82%
$12699.19 - $28556.91 54 30.68% 513 28.69%
$28556.91 - $33333.84 63 35.80% 449 25.11%
$33333.84 - $38980.26 45 25.57% 593 33.17%
$38980.26 - $51498.11 11 6.25% 129 7.21%
Total 176 100.00% 1788 100.00%
Table 3. Income, Median After-Tax (2015). Proportion of Campaigns belonging to each Quintile.
Variable Data Obtained
Population and dwelling counts Population, 2016
Income
(Total Sex / Total)
Income statistics in 2015 for the population aged 15 years and over
in private households - 100% data / Number of after-tax income
recipients aged 15 years and over in private households - 100% data /
Median after-tax income in 2015 among recipients ($)
Education
(Total Sex / Total)
Highest certificate, diploma or degree for the population aged 15
years and over in private households - 25% sample data /
Postsecondary certificate, diploma or degree
Housing
(Total Sex / Total) Private households by tenure - 25% sample data / Owner

Page 43 of 44
Quintile Number of
FSA
Percentage
(FSA)
Number of
Campaigns
Percentage
(Campaigns)
1 - 1397 12 6.82% 159 8.89%
13979 - 2980 41 23.30% 308 17.23%
2980 - 4156 72 40.91% 755 42.23%
4156 - 6087 46 26.14% 524 29.31%
6087 - 10046 5 2.84% 42 2.35%
Total 176 100.00% 1788 100.00%
Table 4. Education, Post-Secondary. Proportion of Campaigns belonging to each Quintile.
Quintile Number of
FSA
Percentage
(FSA)
Number of
Campaigns
Percentage
(Campaigns)
1 - 1393 17 9.66% 180 10.07%
1393 - 2429 38 21.59% 283 15.83%
2429 - 3218 68 38.64% 711 39.77%
3218 - 4579 48 27.27% 571 31.94%
4579 - 7121 5 2.84% 43 2.40%
Total 176 100.00% 1788 100.00%
Table 5. Housing, Owner. Proportion of Campaigns belonging to each Quintile.

Page 44 of 44
Ta
ble
6.
Nu
mb
er o
f C
am
paig
ns,
Pop
ula
tion
, an
d S
oci
oec
on
om
ic V
alu
es p
er P
rov
ince
.