Embed Size (px)
Citation preview
IEEE JOURNAL OF BIOMEDICAL AND HEALTH INFORMATICS 1
Deep Learning for Smartphone-Based MalariaParasite Detection in Thick Blood Smears
Feng Yang , Mahdieh Poostchi, Hang Yu, Zhou Zhou , Kamolrat Silamut, Jian Yu, Richard J. Maude,Stefan Jaeger , and Sameer Antani
Abstract—Objective: This work investigates the possibil-ity of automated malaria parasite detection in thick bloodsmears with smartphones. Methods: We have developedthe first deep learning method that can detect malaria para-sites in thick blood smear images and can run on smart-phones. Our method consists of two processing steps.First, we apply an intensity-based Iterative Global Mini-mum Screening (IGMS), which performs a fast screeningof a thick smear image to find parasite candidates. Then,a customized Convolutional Neural Network (CNN) classi-fies each candidate as either parasite or background. To-gether with this paper, we make a dataset of 1819 thicksmear images from 150 patients publicly available to theresearch community. We used this dataset to train andtest our deep learning method, as described in this paper.Results: A patient-level five-fold cross-evaluation demon-strates the effectiveness of the customized CNN modelin discriminating between positive (parasitic) and negativeimage patches in terms of the following performance indi-cators: accuracy (93.46% ± 0.32%), AUC (98.39% ± 0.18%),sensitivity (92.59% ± 1.27%), specificity (94.33% ± 1.25%),precision (94.25% ± 1.13%), and negative predictive value(92.74% ± 1.09%). High correlation coefficients (>0.98) be-tween automatically detected parasites and ground truth,on both image level and patient level, demonstrate thepracticality of our method. Conclusion: Promising results
Manuscript received December 21, 2018; revised June 5, 2019 andJuly 26, 2019; accepted August 25, 2019. This research was supportedby the Intramural Research Program of the National Institutes of Health(NIH), by National Library of Medicine (NLM), by Lister Hill NationalCenter for Biomedical Communications (LHNCBC), by Mahidol-OxfordTropical Medicine Research Unit that is funded by the Wellcome Trustof Great Britain, by the National Basic Research Program of Chinaunder Grant 61671049, and by the National Key R&D Plan of Chinaunder Grant 2017YFB1400100. (Corresponding authors: Feng Yang;Stefan Jaeger.)
F. Yang is with the Beijing Key Lab of Traffic Data Analysis and Miningin School of Computer and Information Technology, Beijing JiaotongUniversity, Beijing 100044, China, and also with the Lister Hill NationalCenter for Biomedical Communications, National Library of Medicine,NIH, Bethesda, MD 20894 USA (e-mail: [email protected]).
M. Poostchi, H. Yu, S. Jaeger, and S. Antani are with the ListerHill National Center for Biomedical Communications, National Libraryof Medicine, National Institute of Health, Bethesda, MD 20894 USA(e-mail: [email protected]; [email protected]; [email protected]; [email protected]).
Z. Zhou and J. Yu are with the Beijing Key Lab of Traffic Data Analysisand Mining in the School of Computer and Information Technology,Beijing Jiaotong University, Beijing 100044, China (e-mail: [email protected]; [email protected]).
K. Silamut and R. J. Maude are with the Mahidol-Oxford TropicalMedicine Research Unit, Bangkok 10400, Thailand (e-mail: [email protected]; [email protected]).
Digital Object Identifier 10.1109/JBHI.2019.2939121
are obtained for parasite detection in thick blood smearsfor a smartphone application using deep learning meth-ods. Significance: Automated parasite detection running onsmartphones is a promising alternative to manual parasitecounting for malaria diagnosis, especially in areas lackingexperienced parasitologists.
Index Terms—Deep learning, convolutional neuralnetworks, computer-aided diagnosis, malaria.
I. INTRODUCTION
MALARIA is a worldwide life-threatening disease. Ac-cording to the 2018 World Health Organization (WHO)
malaria report [1], about 219 million malaria cases were detectedworldwide in 2017, causing approximately 435,000 deaths. Mi-croscopy examination of stained thick and thin blood smearsis the gold standard for malaria diagnosis [2], [3]. Microscopyexamination is low-cost and is widely available, but is time-consuming. Moreover, the effectiveness of microscopy diag-nosis depends on the parasitologists’ expertise [4]. It is verycommon for parasitologists to work in resource-limited envi-ronments, with no rigorous system in place that can ensurethe maintenance of their skills or/and diagnostic quality. Thisleads to incorrect diagnostic results and thus inappropriate treat-ment [4]. For example, false positive diagnostic results leadto unnecessary use of anti-malaria drugs and suffering fromtheir side effects such as abdominal pain, nausea, etc., whereasfalse negative diagnosis leads to unnecessary use of antibiotics,second consultation, and potential progression of more severemalaria [5]. Therefore, the development of an automated systemfor malaria diagnosis is an appealing research goal for improvingindividualized patient treatment and management. Automatedparasite detection has two big advantages: 1) it can provide amore reliable diagnosis, especially in resource-limited areas,and 2) it reduces diagnostic costs. Parasite counts are essentialto diagnosing malaria and quantifying disease severity. Theyare also important for monitoring patients to measure drug-effectiveness and potential drug-resistance. In this study, weinvestigate automatic malaria parasite detection and counting indigital images of thick blood smears acquired with smartphones.
A thick blood smear is used to detect the presence of malariaparasites in a drop of blood. It allows more efficient detectionof parasites than a thin blood smear, with about 11 times highersensitivity [5]. A thin blood smear results from spreading a dropof blood across a glass slide, and is typically used to differentiate
This work is licensed under a Creative Commons Attribution 4.0 License. For more information, see https://creativecommons.org/licenses/by/4.0/
2 IEEE JOURNAL OF BIOMEDICAL AND HEALTH INFORMATICS
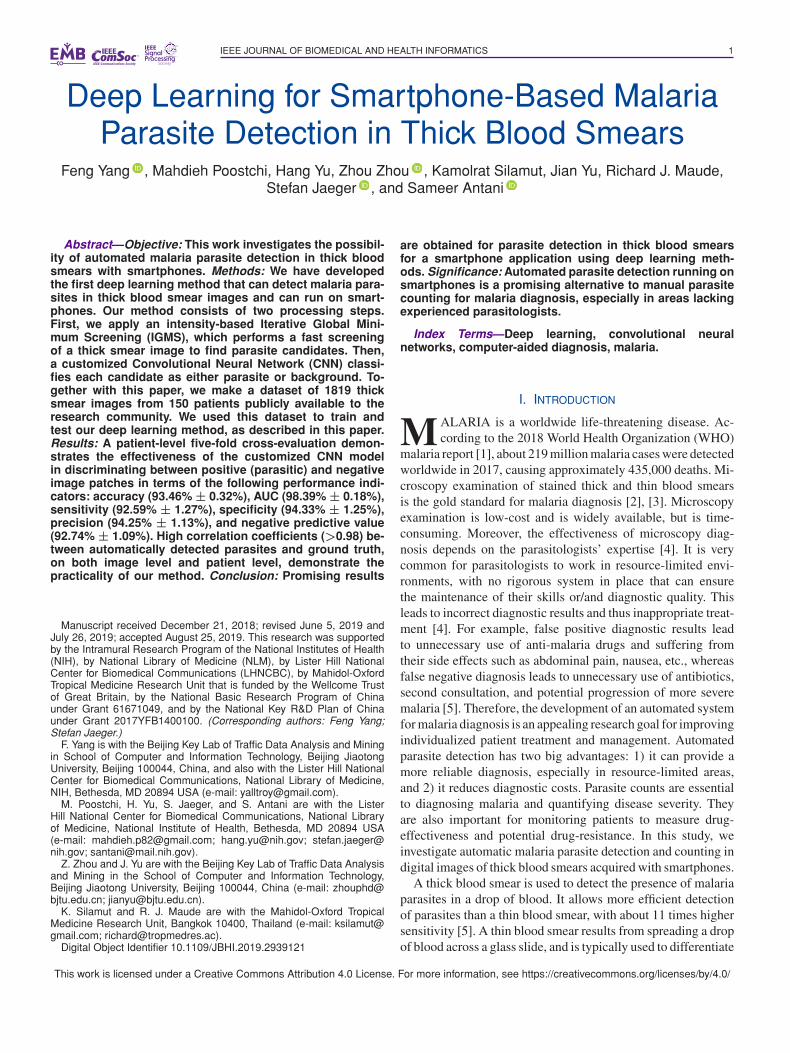
Fig. 1. Examples of thick and thin blood smears. Red circles areparasites and yellow circles are white blood cells.
parasite species and development stages. Thick and thin bloodsmears, as shown in Fig. 1, require different processing methodsfor parasite detection. In thin blood smears, both white bloodcells (WBCs) and red blood cells (RBCs) are clearly visible. Atypical step for automatic parasite detection in thin smears is tofirst segment RBCs and then classify each segmented RBC asinfected or uninfected [5]–[7]. In thick blood smears, however,only WBCs and the nuclei of RBCs are visible (see Fig. 1(a)).Therefore, parasites need to be detected directly, and a typicalstep is to first preselect parasite candidates and then classify thecandidates as either actual parasites or background noise. Thiscan be challenging because the nuclei of WBCs and variousnon-parasite components can absorb stain, creating artifacts thatcan lead to false parasite detection.
A. Related Work
In recent years, several approaches have been proposed forimage processing and analysis on both thin and thick bloodsmears, aiming at automated detection of parasites. Reviewsof the published literature may be found in [5], [8], [9]. Inthe following paragraph, we provide a brief overview of theapproaches for malaria detection in thick blood smears.
Traditional parasite detection techniques are often performedbased on segmentation [10]–[13] using thresholding and mor-phological operations. Kaewkamnerd et al. [10] propose amethod using an adaptive threshold on the V-value histogramof the HSV image to extract parasite candidates and whiteblood cells (WBCs) from the background, and then distinguishparasites from WBCs according to their size. Evaluation on 20images shows that the proposed method achieves an accuracyof 60%. Hanif et al. [11] use an intensity-stretching methodto enhance the contrast of 255 thick blood smears, and thenuse an empirical threshold to segment malaria parasites. Theauthors show qualitative results on different images, in whichdifferent empirical thresholds are applied to obtain satisfy-ing segmentation results. Chakrabortya et al. [12] combine amorphological segmentation with color information to identifyparasites in thick blood smears. Experiments are performedon 75 images and patch level evaluation shows a successfuldetection rate of 95% with a false positive ratio of 10%. Daveet al. [13] perform histogram-based adaptive thresholding andmorphological operations on denoised images to detect RBCsinfected by malaria parasites in thin and thick blood smears.
Patch level evaluation on 87 images shows that the methoddetects 533 parasites compared to 484 parasites annotated asground truth. Traditional approaches for parasite detection aresimple and fast, whereas they are difficult to extend to largedatasets. This is due to the fact that traditional approaches arevery sensitive to image variations and that parameters are veryoften determined empirically. Performance evaluation on patchlevel on small datasets (from 20 to 300 images) can changegreatly when evaluating on big datasets, on image level or patientlevel.
Feature-based approaches involve feature extraction and clas-sification based on machine learning techniques [14]–[18]. Elteret al. [14] extract 174 features from pre-detected plasmodiacandidates and apply a Support Vector Machine (SVM) classifierto the feature set for parasite identification. The authors reporta sensitivity of 97% for 256 images on patch level. Purnamaet al. [15] extract features from histograms of RGB channel,H channel from HSV space, and H channel from HIS space,and then use Genetic Programming to identify parasite typeand stage. Their classification model on 180 patches achievesan average accuracy of 95.58% for parasite identification and95.49% for non-parasite identification. Yunda et al. [16] ex-tract color features, co-occurrence texture features, and wavelet-based texture features from the pre-segmented image, and thenuse Principal Component Analysis (PCA) to reduce redundantfeatures, followed by a neural network model for the final clas-sification. Evaluation on 110 images shows that the sensitivityfor parasite detection is 76.45%. Quinn et al. [17] propose tofirst split each image into 475 randomly overlapping patchesusing downsampling and sliding window screening, then extractconnected component and moment features from the patches,and finally use a randomized tree classifier for the classification.The method is evaluated on 2903 images from 133 patients andproduces a precision of 90% at a recall of 20% on patch level.Rosado et al. [18] use an adaptive thresholding approach for theparasite detection and then apply geometry, color and texturefeatures in combination with a RBF kernel based SVM classifierfor WBC and parasite identification. Evaluation on 94 imagesfrom 6 patients shows their automatic prediction of parasiteshas achieved a patch level accuracy of 91.8% along with asensitivity of 80.5% and a specificity of 93.5%, while their WBCdetection achieves 98.2% sensitivity and 72.1% specificity. Thefeature-based approaches evaluate their performance on patchlevel. That is, the input sample is a single patch image and theevaluation is typically a patch classification accuracy. However,the ultimate goal for malaria patient diagnosis is to detect andclassify all patches (both parasites and false positives) for apatient. A satisfying patch level classification performance doesnot necessarily assure good performance on image level orpatient level.
Deep learning is the latest trend in machine learning forits superior performance on big data. It has already boostedthe performance in many non-medical areas. Recently, deeplearning has gained increasing recognition in computer-aideddiagnostic systems. Two main factors contributed to this de-velopment: 1) compared to traditional methods and feature-based approaches, deep learning requires neither segmentation
YANG et al.: DEEP LEARNING FOR SMARTPHONE-BASED MALARIA PARASITE DETECTION IN THICK BLOOD SMEARS 3
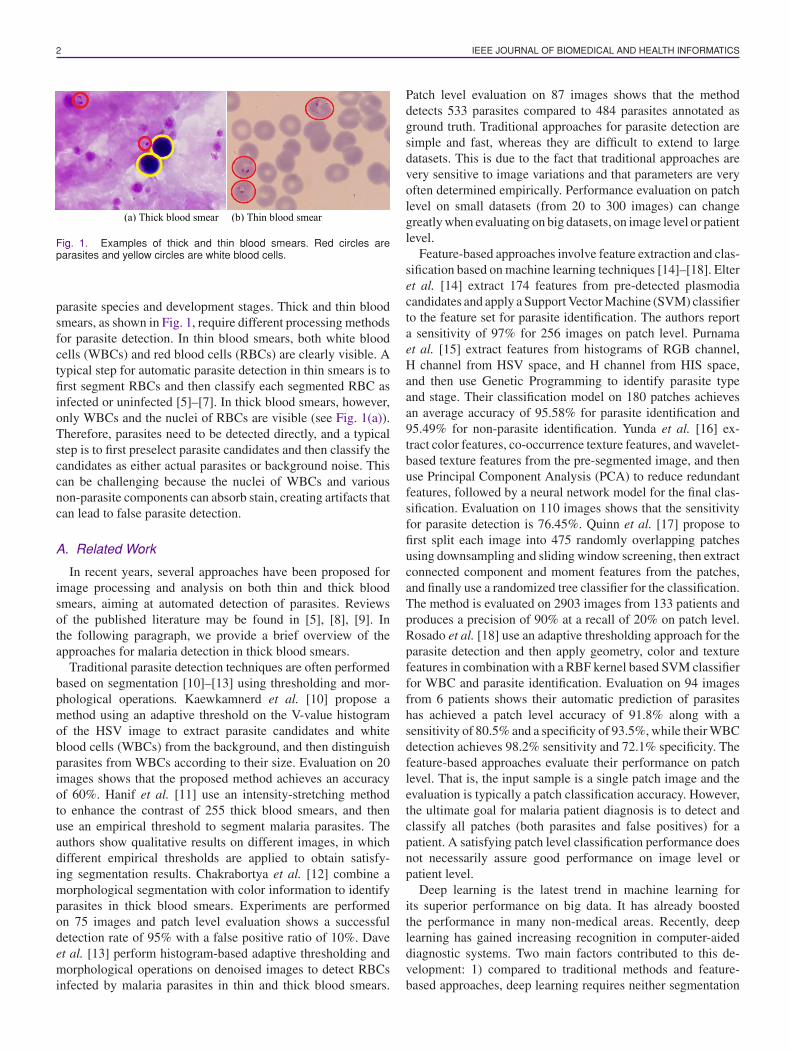
TABLE IEXISTING APPROACHES APPLIED TO PARASITE DETECTION IN THICK BLOOD SMEARS
Note: DR indicates detection rate; FPR represents false positive rate; PR denotes precision; ACC means accuracy; SE indicates sensitivity; SP is specificity.
nor handcrafted features, offering an end-to-end solution and2) it can discover hierarchical feature representations that aresolely derived from data [19]–[21]. In the past three years, deeplearning methods have been applied to thick blood smears forautomatic feature extraction and parasite detection. Delahunt etal. [22] propose a combination of a linear SVM and a Convolu-tional Neural Network (CNN) for classification after localizingparasite candidates. They suggest the use of CNNs for featureextraction, whereas their reported results on 143 patients useonly traditional features (including morphological, color, textureand Harr-like features), showing the method predicted a Limit ofDetection (LoD) about 300 parasites/µL at a specificity of 92%on patient level. Quinn et al. [23] propose a parasite detectionby training a four-layer CNN model on overlapping patches,which are extracted from the downsampled RGB images. Theyreport an average precision of 97% on 1182 images. However,the authors split the training dataset and testing dataset on imagelevel and not on patient level. That is, their training dataset andtesting dataset may include images from the same patient. Theperformance is evaluated only on patch level. Mehanian et al.[24] first detect WBCs by applying a Gaussian-kernel SVM onthresholded candidates, then train another Gaussian-kernel SVMon the parasite candidates, which are generated using a dynamiclocal thresholding method, and finally use a CNN model forfeature extraction and classification. The authors report that theirmethod achieves a sensitivity of 91.6% and a precision of 89.7%at a specificity of 94.1% on patch level, and a LoD of about 100parasites/µL at a specificity of 90.0% on patient level based on1452 images from 195 patients. However, a run time withinroughly 20 minutes (on a quad-core processor) for parasitedetection is not necessarily faster than human processing. Torreset al. [25] test Autoscope (a prototype digital microscope devicewith automated methods proposed in [24]) at two peripheral
health facilities, with routine microscopy and Polymerase ChainReaction (PCR) as reference standards. The authors concludethat Autoscope’s performance (sensitivity of 72% at a specificityof 85%) is close to that of routine microcopy (sensitivity of 68%at a specificity of 100%) when the slides had adequate bloodvolume; otherwise, its performance will be less than routinemicroscopy.
Table I is an overview of the existing parasite detectionapproaches that have been applied to thick blood smears. Thetraditional parasite detection techniques in [10]–[13] use smalldatasets and do not achieve high accuracies. Experimentalevaluations of the methods are either qualitative or on patchlevel, which does not guarantee similar results on patient level.Feature-based approaches [14]–[18] generally achieve a bet-ter detection rate of parasites than the traditional techniques.However, most of them [14]–[16], [18] use datasets with lessthan 256 images, and all evaluations are on patch level. Anevaluation of such approaches on patient level may result ina big performance drop. A big dataset has been used in [17];however, the authors only achieve a sensitivity of 20%. So far,only four papers [22]–[25] have used deep learning methodsfor parasite detection on big datasets in thick blood smears,and three of them [22], [24], [25] have performed evaluationon patient level. In the literature mentioned above, only threepapers [17], [18], [23] have worked on smartphone-acquiredimages for thick smears. Among these papers, [17], [23] usethe smartphone only for data acquisition with the intention toprocess these images on a more powerful platform for remotediagnosis. Reference [18] is the only work that has implementeda screening application on a smartphone. The goal of our paperis to develop a parasite detection application for smartphonesbased on deep learning, which can provide a better performancecompared to the traditional SVM, as implemented in [18].
4 IEEE JOURNAL OF BIOMEDICAL AND HEALTH INFORMATICS
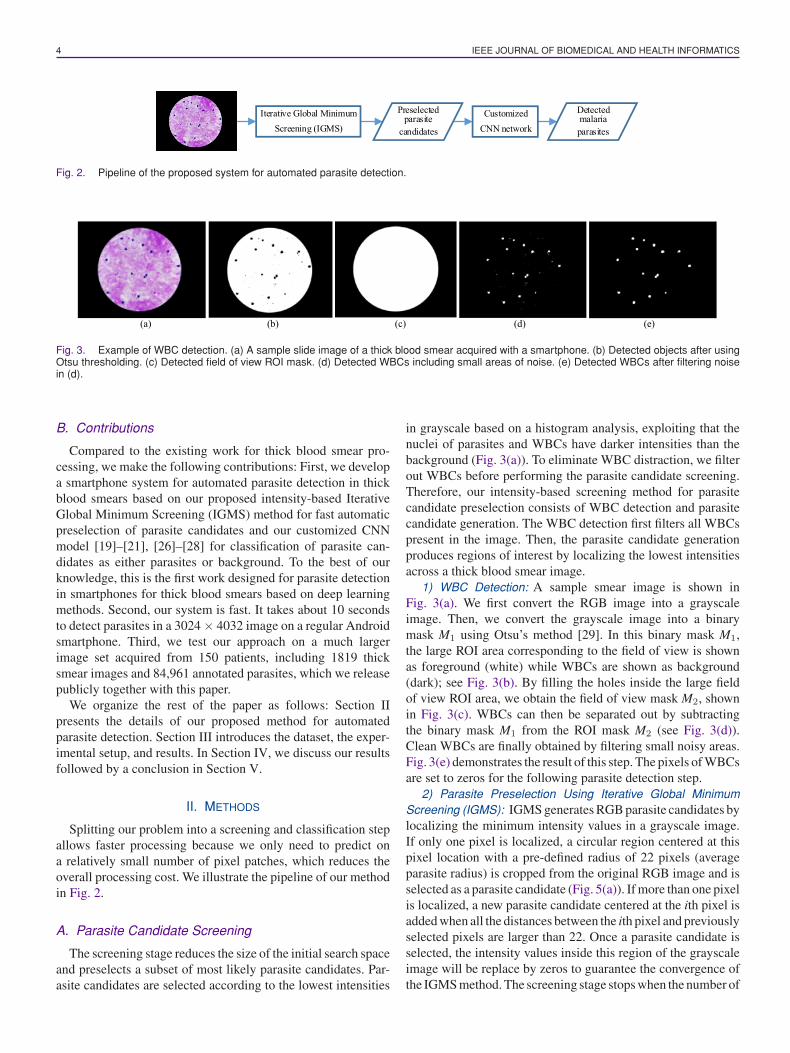
Fig. 2. Pipeline of the proposed system for automated parasite detection.
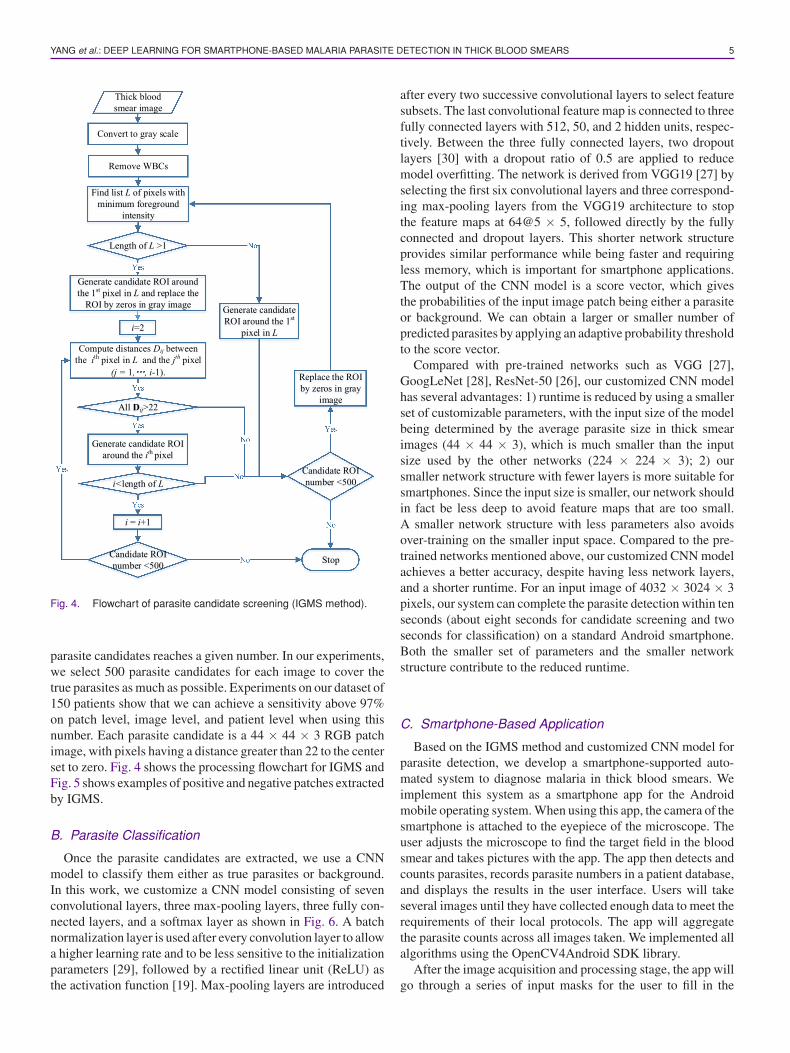
Fig. 3. Example of WBC detection. (a) A sample slide image of a thick blood smear acquired with a smartphone. (b) Detected objects after usingOtsu thresholding. (c) Detected field of view ROI mask. (d) Detected WBCs including small areas of noise. (e) Detected WBCs after filtering noisein (d).
B. Contributions
Compared to the existing work for thick blood smear pro-cessing, we make the following contributions: First, we developa smartphone system for automated parasite detection in thickblood smears based on our proposed intensity-based IterativeGlobal Minimum Screening (IGMS) method for fast automaticpreselection of parasite candidates and our customized CNNmodel [19]–[21], [26]–[28] for classification of parasite can-didates as either parasites or background. To the best of ourknowledge, this is the first work designed for parasite detectionin smartphones for thick blood smears based on deep learningmethods. Second, our system is fast. It takes about 10 secondsto detect parasites in a 3024 × 4032 image on a regular Androidsmartphone. Third, we test our approach on a much largerimage set acquired from 150 patients, including 1819 thicksmear images and 84,961 annotated parasites, which we releasepublicly together with this paper.
We organize the rest of the paper as follows: Section IIpresents the details of our proposed method for automatedparasite detection. Section III introduces the dataset, the exper-imental setup, and results. In Section IV, we discuss our resultsfollowed by a conclusion in Section V.
II. METHODS
Splitting our problem into a screening and classification stepallows faster processing because we only need to predict ona relatively small number of pixel patches, which reduces theoverall processing cost. We illustrate the pipeline of our methodin Fig. 2.
A. Parasite Candidate Screening
The screening stage reduces the size of the initial search spaceand preselects a subset of most likely parasite candidates. Par-asite candidates are selected according to the lowest intensities
in grayscale based on a histogram analysis, exploiting that thenuclei of parasites and WBCs have darker intensities than thebackground (Fig. 3(a)). To eliminate WBC distraction, we filterout WBCs before performing the parasite candidate screening.Therefore, our intensity-based screening method for parasitecandidate preselection consists of WBC detection and parasitecandidate generation. The WBC detection first filters all WBCspresent in the image. Then, the parasite candidate generationproduces regions of interest by localizing the lowest intensitiesacross a thick blood smear image.
1) WBC Detection: A sample smear image is shown inFig. 3(a). We first convert the RGB image into a grayscaleimage. Then, we convert the grayscale image into a binarymask M1 using Otsu’s method [29]. In this binary mask M1,the large ROI area corresponding to the field of view is shownas foreground (white) while WBCs are shown as background(dark); see Fig. 3(b). By filling the holes inside the large fieldof view ROI area, we obtain the field of view mask M2, shownin Fig. 3(c). WBCs can then be separated out by subtractingthe binary mask M1 from the ROI mask M2 (see Fig. 3(d)).Clean WBCs are finally obtained by filtering small noisy areas.Fig. 3(e) demonstrates the result of this step. The pixels of WBCsare set to zeros for the following parasite detection step.
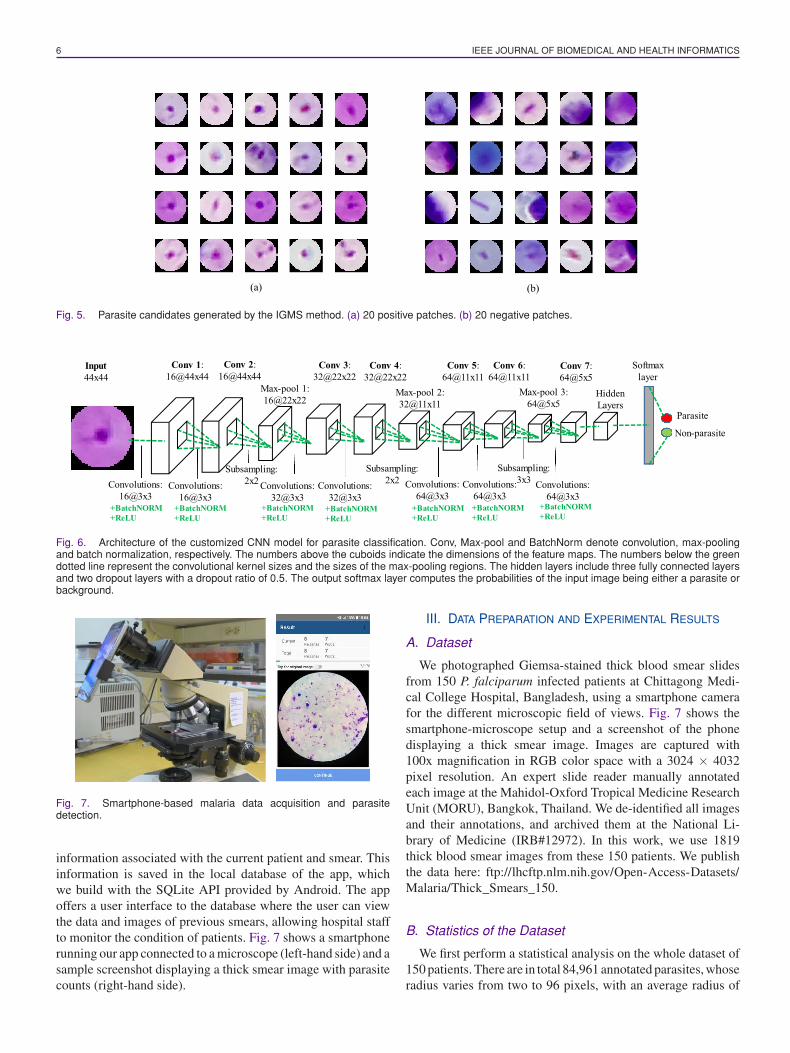
2) Parasite Preselection Using Iterative Global MinimumScreening (IGMS): IGMS generates RGB parasite candidates bylocalizing the minimum intensity values in a grayscale image.If only one pixel is localized, a circular region centered at thispixel location with a pre-defined radius of 22 pixels (averageparasite radius) is cropped from the original RGB image and isselected as a parasite candidate (Fig. 5(a)). If more than one pixelis localized, a new parasite candidate centered at the ith pixel isadded when all the distances between the ith pixel and previouslyselected pixels are larger than 22. Once a parasite candidate isselected, the intensity values inside this region of the grayscaleimage will be replace by zeros to guarantee the convergence ofthe IGMS method. The screening stage stops when the number of
YANG et al.: DEEP LEARNING FOR SMARTPHONE-BASED MALARIA PARASITE DETECTION IN THICK BLOOD SMEARS 5
Fig. 4. Flowchart of parasite candidate screening (IGMS method).
parasite candidates reaches a given number. In our experiments,we select 500 parasite candidates for each image to cover thetrue parasites as much as possible. Experiments on our dataset of150 patients show that we can achieve a sensitivity above 97%on patch level, image level, and patient level when using thisnumber. Each parasite candidate is a 44 × 44 × 3 RGB patchimage, with pixels having a distance greater than 22 to the centerset to zero. Fig. 4 shows the processing flowchart for IGMS andFig. 5 shows examples of positive and negative patches extractedby IGMS.
B. Parasite Classification
Once the parasite candidates are extracted, we use a CNNmodel to classify them either as true parasites or background.In this work, we customize a CNN model consisting of sevenconvolutional layers, three max-pooling layers, three fully con-nected layers, and a softmax layer as shown in Fig. 6. A batchnormalization layer is used after every convolution layer to allowa higher learning rate and to be less sensitive to the initializationparameters [29], followed by a rectified linear unit (ReLU) asthe activation function [19]. Max-pooling layers are introduced
after every two successive convolutional layers to select featuresubsets. The last convolutional feature map is connected to threefully connected layers with 512, 50, and 2 hidden units, respec-tively. Between the three fully connected layers, two dropoutlayers [30] with a dropout ratio of 0.5 are applied to reducemodel overfitting. The network is derived from VGG19 [27] byselecting the first six convolutional layers and three correspond-ing max-pooling layers from the VGG19 architecture to stopthe feature maps at 64@5 × 5, followed directly by the fullyconnected and dropout layers. This shorter network structureprovides similar performance while being faster and requiringless memory, which is important for smartphone applications.The output of the CNN model is a score vector, which givesthe probabilities of the input image patch being either a parasiteor background. We can obtain a larger or smaller number ofpredicted parasites by applying an adaptive probability thresholdto the score vector.
Compared with pre-trained networks such as VGG [27],GoogLeNet [28], ResNet-50 [26], our customized CNN modelhas several advantages: 1) runtime is reduced by using a smallerset of customizable parameters, with the input size of the modelbeing determined by the average parasite size in thick smearimages (44 × 44 × 3), which is much smaller than the inputsize used by the other networks (224 × 224 × 3); 2) oursmaller network structure with fewer layers is more suitable forsmartphones. Since the input size is smaller, our network shouldin fact be less deep to avoid feature maps that are too small.A smaller network structure with less parameters also avoidsover-training on the smaller input space. Compared to the pre-trained networks mentioned above, our customized CNN modelachieves a better accuracy, despite having less network layers,and a shorter runtime. For an input image of 4032 × 3024 × 3pixels, our system can complete the parasite detection within tenseconds (about eight seconds for candidate screening and twoseconds for classification) on a standard Android smartphone.Both the smaller set of parameters and the smaller networkstructure contribute to the reduced runtime.
C. Smartphone-Based Application
Based on the IGMS method and customized CNN model forparasite detection, we develop a smartphone-supported auto-mated system to diagnose malaria in thick blood smears. Weimplement this system as a smartphone app for the Androidmobile operating system. When using this app, the camera of thesmartphone is attached to the eyepiece of the microscope. Theuser adjusts the microscope to find the target field in the bloodsmear and takes pictures with the app. The app then detects andcounts parasites, records parasite numbers in a patient database,and displays the results in the user interface. Users will takeseveral images until they have collected enough data to meet therequirements of their local protocols. The app will aggregatethe parasite counts across all images taken. We implemented allalgorithms using the OpenCV4Android SDK library.
After the image acquisition and processing stage, the app willgo through a series of input masks for the user to fill in the
6 IEEE JOURNAL OF BIOMEDICAL AND HEALTH INFORMATICS
Fig. 5. Parasite candidates generated by the IGMS method. (a) 20 positive patches. (b) 20 negative patches.
Fig. 6. Architecture of the customized CNN model for parasite classification. Conv, Max-pool and BatchNorm denote convolution, max-poolingand batch normalization, respectively. The numbers above the cuboids indicate the dimensions of the feature maps. The numbers below the greendotted line represent the convolutional kernel sizes and the sizes of the max-pooling regions. The hidden layers include three fully connected layersand two dropout layers with a dropout ratio of 0.5. The output softmax layer computes the probabilities of the input image being either a parasite orbackground.
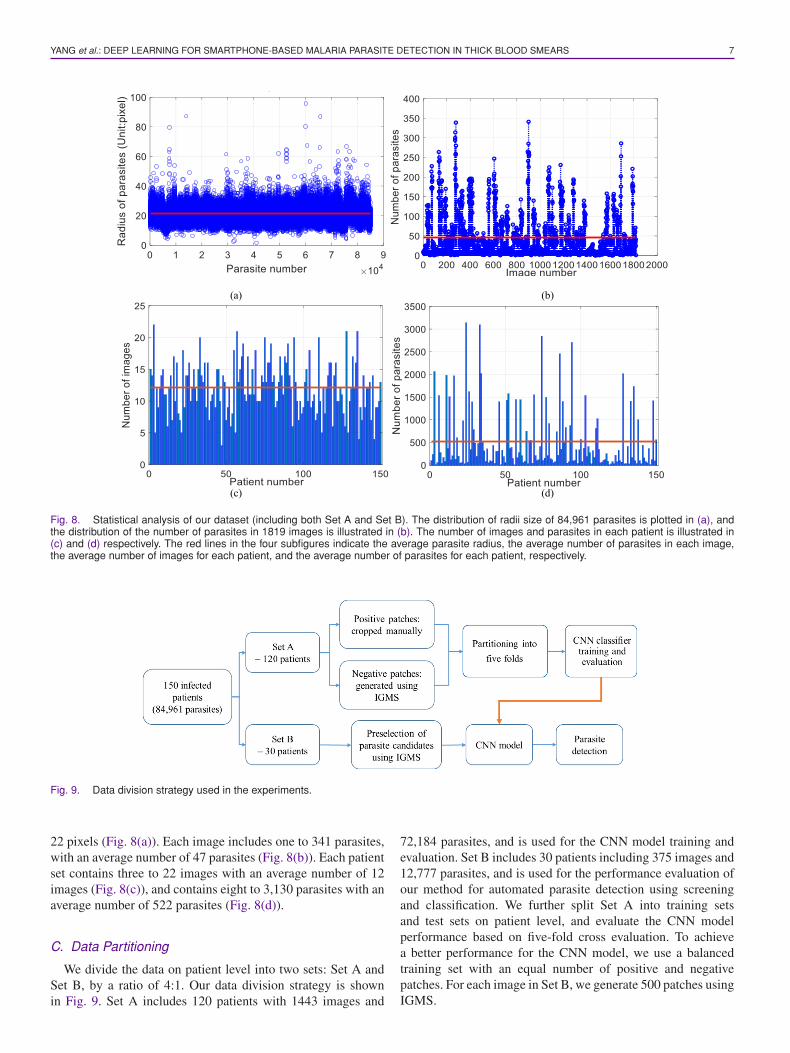
Fig. 7. Smartphone-based malaria data acquisition and parasitedetection.
information associated with the current patient and smear. Thisinformation is saved in the local database of the app, whichwe build with the SQLite API provided by Android. The appoffers a user interface to the database where the user can viewthe data and images of previous smears, allowing hospital staffto monitor the condition of patients. Fig. 7 shows a smartphonerunning our app connected to a microscope (left-hand side) and asample screenshot displaying a thick smear image with parasitecounts (right-hand side).
III. DATA PREPARATION AND EXPERIMENTAL RESULTS
A. Dataset
We photographed Giemsa-stained thick blood smear slidesfrom 150 P. falciparum infected patients at Chittagong Medi-cal College Hospital, Bangladesh, using a smartphone camerafor the different microscopic field of views. Fig. 7 shows thesmartphone-microscope setup and a screenshot of the phonedisplaying a thick smear image. Images are captured with100x magnification in RGB color space with a 3024 × 4032pixel resolution. An expert slide reader manually annotatedeach image at the Mahidol-Oxford Tropical Medicine ResearchUnit (MORU), Bangkok, Thailand. We de-identified all imagesand their annotations, and archived them at the National Li-brary of Medicine (IRB#12972). In this work, we use 1819thick blood smear images from these 150 patients. We publishthe data here: ftp://lhcftp.nlm.nih.gov/Open-Access-Datasets/Malaria/Thick_Smears_150.
B. Statistics of the Dataset
We first perform a statistical analysis on the whole dataset of150 patients. There are in total 84,961 annotated parasites, whoseradius varies from two to 96 pixels, with an average radius of
YANG et al.: DEEP LEARNING FOR SMARTPHONE-BASED MALARIA PARASITE DETECTION IN THICK BLOOD SMEARS 7
Fig. 8. Statistical analysis of our dataset (including both Set A and Set B). The distribution of radii size of 84,961 parasites is plotted in (a), andthe distribution of the number of parasites in 1819 images is illustrated in (b). The number of images and parasites in each patient is illustrated in(c) and (d) respectively. The red lines in the four subfigures indicate the average parasite radius, the average number of parasites in each image,the average number of images for each patient, and the average number of parasites for each patient, respectively.
Fig. 9. Data division strategy used in the experiments.
22 pixels (Fig. 8(a)). Each image includes one to 341 parasites,with an average number of 47 parasites (Fig. 8(b)). Each patientset contains three to 22 images with an average number of 12images (Fig. 8(c)), and contains eight to 3,130 parasites with anaverage number of 522 parasites (Fig. 8(d)).
C. Data Partitioning
We divide the data on patient level into two sets: Set A andSet B, by a ratio of 4:1. Our data division strategy is shownin Fig. 9. Set A includes 120 patients with 1443 images and
72,184 parasites, and is used for the CNN model training andevaluation. Set B includes 30 patients including 375 images and12,777 parasites, and is used for the performance evaluation ofour method for automated parasite detection using screeningand classification. We further split Set A into training setsand test sets on patient level, and evaluate the CNN modelperformance based on five-fold cross evaluation. To achievea better performance for the CNN model, we use a balancedtraining set with an equal number of positive and negativepatches. For each image in Set B, we generate 500 patches usingIGMS.
8 IEEE JOURNAL OF BIOMEDICAL AND HEALTH INFORMATICS
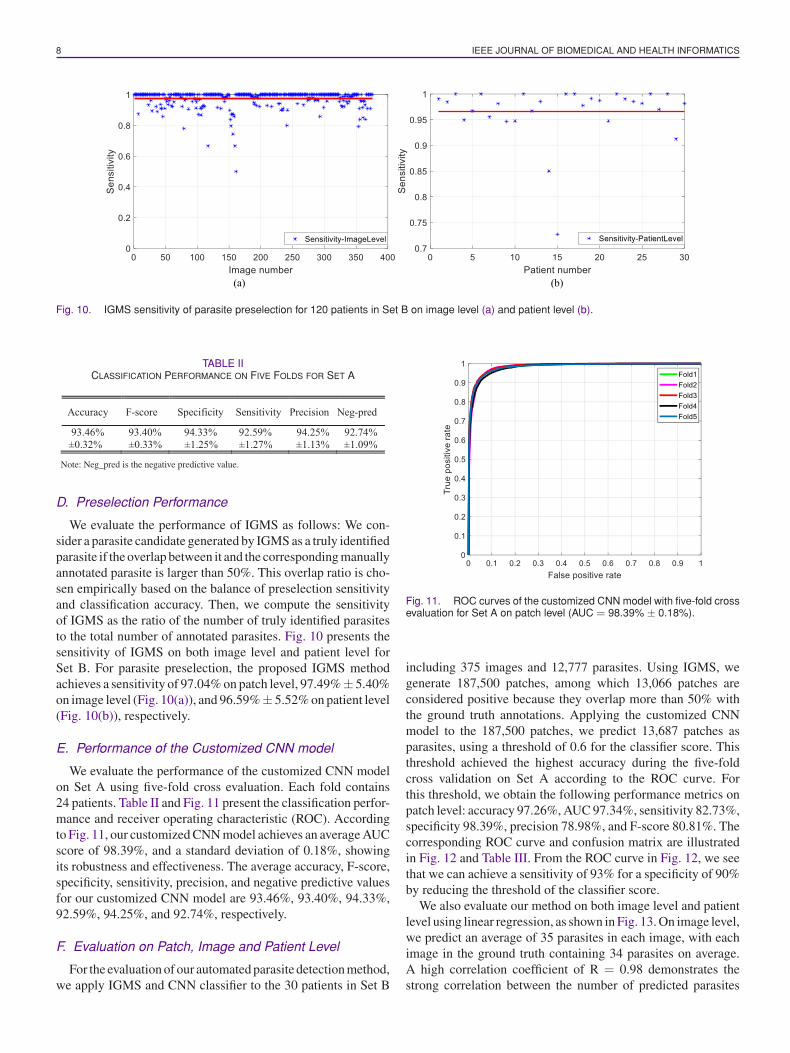
Fig. 10. IGMS sensitivity of parasite preselection for 120 patients in Set B on image level (a) and patient level (b).
TABLE IICLASSIFICATION PERFORMANCE ON FIVE FOLDS FOR SET A
Note: Neg_pred is the negative predictive value.
D. Preselection Performance
We evaluate the performance of IGMS as follows: We con-sider a parasite candidate generated by IGMS as a truly identifiedparasite if the overlap between it and the corresponding manuallyannotated parasite is larger than 50%. This overlap ratio is cho-sen empirically based on the balance of preselection sensitivityand classification accuracy. Then, we compute the sensitivityof IGMS as the ratio of the number of truly identified parasitesto the total number of annotated parasites. Fig. 10 presents thesensitivity of IGMS on both image level and patient level forSet B. For parasite preselection, the proposed IGMS methodachieves a sensitivity of 97.04% on patch level, 97.49%± 5.40%on image level (Fig. 10(a)), and 96.59%± 5.52% on patient level(Fig. 10(b)), respectively.
E. Performance of the Customized CNN model
We evaluate the performance of the customized CNN modelon Set A using five-fold cross evaluation. Each fold contains24 patients. Table II and Fig. 11 present the classification perfor-mance and receiver operating characteristic (ROC). Accordingto Fig. 11, our customized CNN model achieves an average AUCscore of 98.39%, and a standard deviation of 0.18%, showingits robustness and effectiveness. The average accuracy, F-score,specificity, sensitivity, precision, and negative predictive valuesfor our customized CNN model are 93.46%, 93.40%, 94.33%,92.59%, 94.25%, and 92.74%, respectively.
F. Evaluation on Patch, Image and Patient Level
For the evaluation of our automated parasite detection method,we apply IGMS and CNN classifier to the 30 patients in Set B
Fig. 11. ROC curves of the customized CNN model with five-fold crossevaluation for Set A on patch level (AUC = 98.39% ± 0.18%).
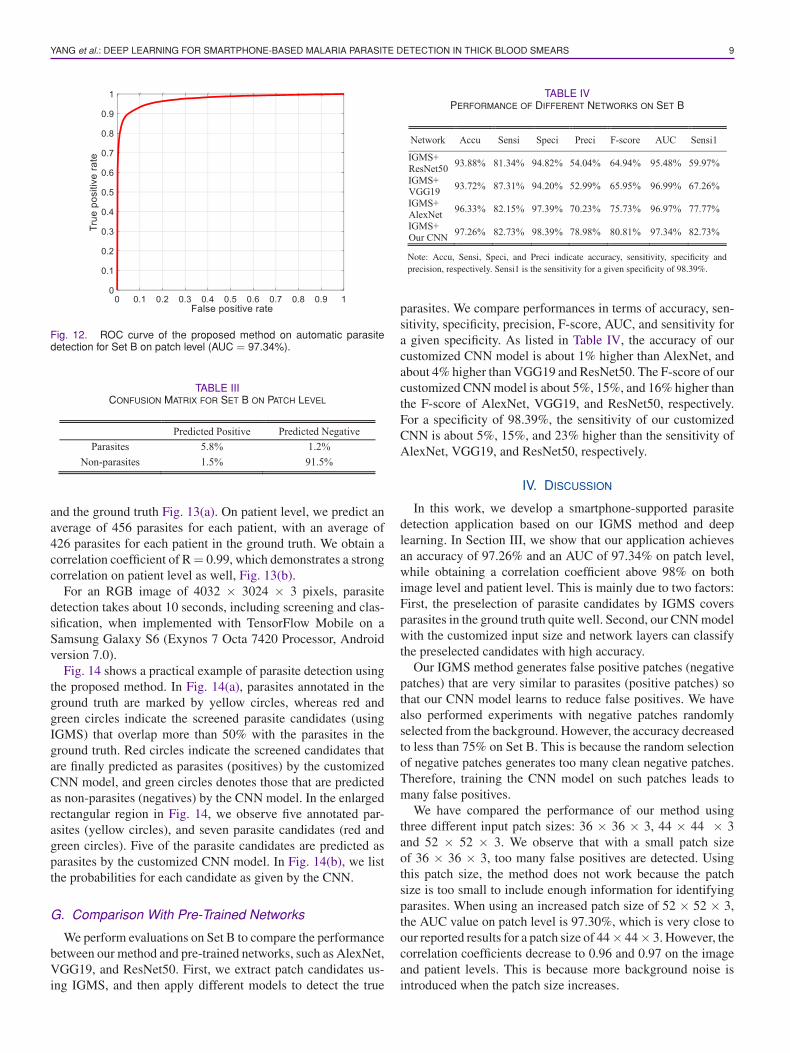
including 375 images and 12,777 parasites. Using IGMS, wegenerate 187,500 patches, among which 13,066 patches areconsidered positive because they overlap more than 50% withthe ground truth annotations. Applying the customized CNNmodel to the 187,500 patches, we predict 13,687 patches asparasites, using a threshold of 0.6 for the classifier score. Thisthreshold achieved the highest accuracy during the five-foldcross validation on Set A according to the ROC curve. Forthis threshold, we obtain the following performance metrics onpatch level: accuracy 97.26%, AUC 97.34%, sensitivity 82.73%,specificity 98.39%, precision 78.98%, and F-score 80.81%. Thecorresponding ROC curve and confusion matrix are illustratedin Fig. 12 and Table III. From the ROC curve in Fig. 12, we seethat we can achieve a sensitivity of 93% for a specificity of 90%by reducing the threshold of the classifier score.
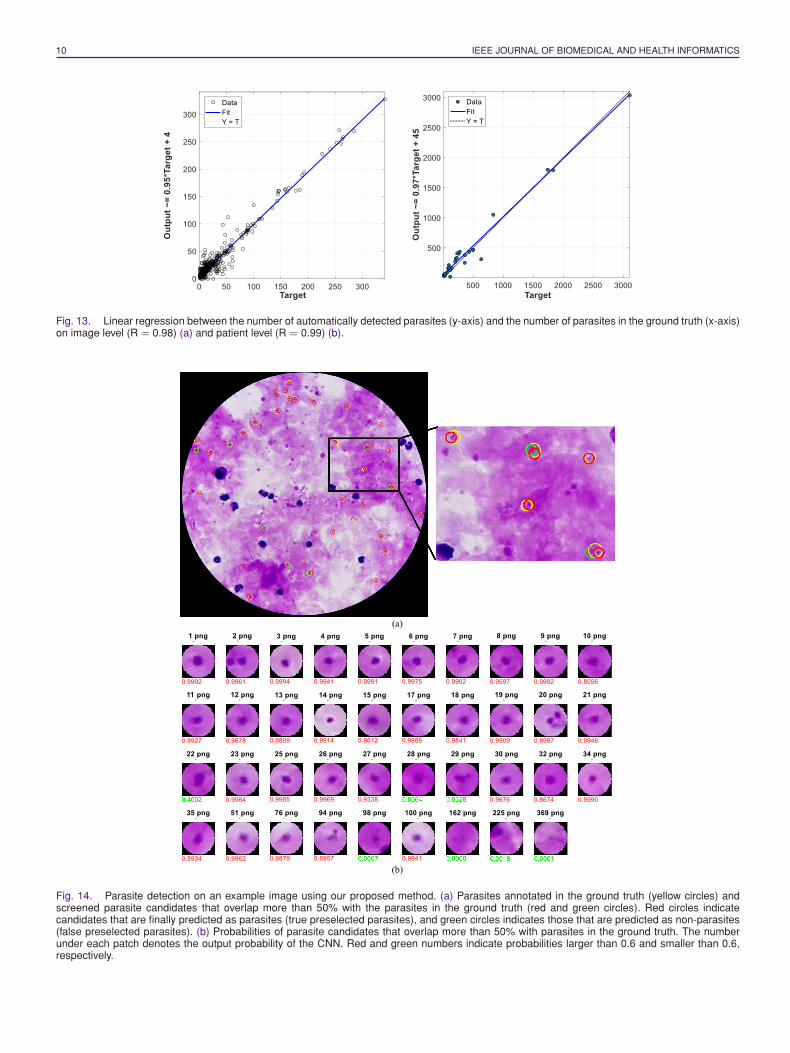
We also evaluate our method on both image level and patientlevel using linear regression, as shown in Fig. 13. On image level,we predict an average of 35 parasites in each image, with eachimage in the ground truth containing 34 parasites on average.A high correlation coefficient of R = 0.98 demonstrates thestrong correlation between the number of predicted parasites
YANG et al.: DEEP LEARNING FOR SMARTPHONE-BASED MALARIA PARASITE DETECTION IN THICK BLOOD SMEARS 9
Fig. 12. ROC curve of the proposed method on automatic parasitedetection for Set B on patch level (AUC = 97.34%).
TABLE IIICONFUSION MATRIX FOR SET B ON PATCH LEVEL
and the ground truth Fig. 13(a). On patient level, we predict anaverage of 456 parasites for each patient, with an average of426 parasites for each patient in the ground truth. We obtain acorrelation coefficient of R = 0.99, which demonstrates a strongcorrelation on patient level as well, Fig. 13(b).
For an RGB image of 4032 × 3024 × 3 pixels, parasitedetection takes about 10 seconds, including screening and clas-sification, when implemented with TensorFlow Mobile on aSamsung Galaxy S6 (Exynos 7 Octa 7420 Processor, Androidversion 7.0).
Fig. 14 shows a practical example of parasite detection usingthe proposed method. In Fig. 14(a), parasites annotated in theground truth are marked by yellow circles, whereas red andgreen circles indicate the screened parasite candidates (usingIGMS) that overlap more than 50% with the parasites in theground truth. Red circles indicate the screened candidates thatare finally predicted as parasites (positives) by the customizedCNN model, and green circles denotes those that are predictedas non-parasites (negatives) by the CNN model. In the enlargedrectangular region in Fig. 14, we observe five annotated par-asites (yellow circles), and seven parasite candidates (red andgreen circles). Five of the parasite candidates are predicted asparasites by the customized CNN model. In Fig. 14(b), we listthe probabilities for each candidate as given by the CNN.
G. Comparison With Pre-Trained Networks
We perform evaluations on Set B to compare the performancebetween our method and pre-trained networks, such as AlexNet,VGG19, and ResNet50. First, we extract patch candidates us-ing IGMS, and then apply different models to detect the true
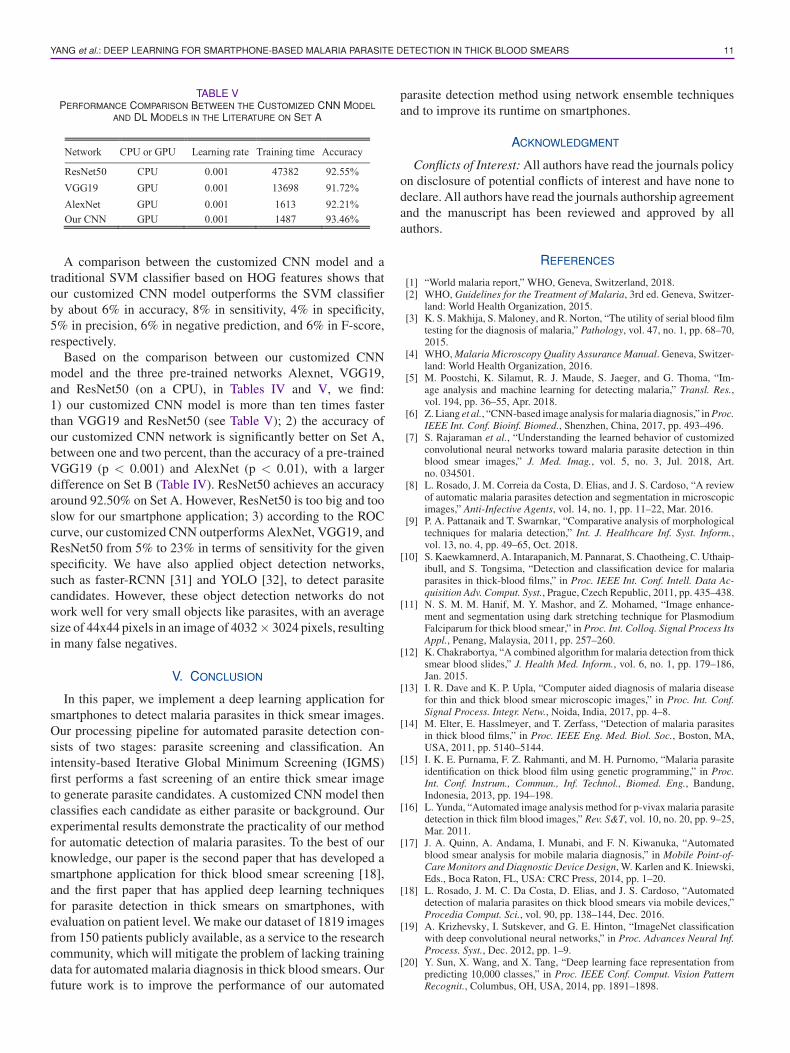
TABLE IVPERFORMANCE OF DIFFERENT NETWORKS ON SET B
Note: Accu, Sensi, Speci, and Preci indicate accuracy, sensitivity, specificity andprecision, respectively. Sensi1 is the sensitivity for a given specificity of 98.39%.
parasites. We compare performances in terms of accuracy, sen-sitivity, specificity, precision, F-score, AUC, and sensitivity fora given specificity. As listed in Table IV, the accuracy of ourcustomized CNN model is about 1% higher than AlexNet, andabout 4% higher than VGG19 and ResNet50. The F-score of ourcustomized CNN model is about 5%, 15%, and 16% higher thanthe F-score of AlexNet, VGG19, and ResNet50, respectively.For a specificity of 98.39%, the sensitivity of our customizedCNN is about 5%, 15%, and 23% higher than the sensitivity ofAlexNet, VGG19, and ResNet50, respectively.
IV. DISCUSSION
In this work, we develop a smartphone-supported parasitedetection application based on our IGMS method and deeplearning. In Section III, we show that our application achievesan accuracy of 97.26% and an AUC of 97.34% on patch level,while obtaining a correlation coefficient above 98% on bothimage level and patient level. This is mainly due to two factors:First, the preselection of parasite candidates by IGMS coversparasites in the ground truth quite well. Second, our CNN modelwith the customized input size and network layers can classifythe preselected candidates with high accuracy.
Our IGMS method generates false positive patches (negativepatches) that are very similar to parasites (positive patches) sothat our CNN model learns to reduce false positives. We havealso performed experiments with negative patches randomlyselected from the background. However, the accuracy decreasedto less than 75% on Set B. This is because the random selectionof negative patches generates too many clean negative patches.Therefore, training the CNN model on such patches leads tomany false positives.
We have compared the performance of our method usingthree different input patch sizes: 36 × 36 × 3, 44 × 44 × 3and 52 × 52 × 3. We observe that with a small patch sizeof 36 × 36 × 3, too many false positives are detected. Usingthis patch size, the method does not work because the patchsize is too small to include enough information for identifyingparasites. When using an increased patch size of 52 × 52 × 3,the AUC value on patch level is 97.30%, which is very close toour reported results for a patch size of 44× 44× 3. However, thecorrelation coefficients decrease to 0.96 and 0.97 on the imageand patient levels. This is because more background noise isintroduced when the patch size increases.
10 IEEE JOURNAL OF BIOMEDICAL AND HEALTH INFORMATICS
Fig. 13. Linear regression between the number of automatically detected parasites (y-axis) and the number of parasites in the ground truth (x-axis)on image level (R = 0.98) (a) and patient level (R = 0.99) (b).
Fig. 14. Parasite detection on an example image using our proposed method. (a) Parasites annotated in the ground truth (yellow circles) andscreened parasite candidates that overlap more than 50% with the parasites in the ground truth (red and green circles). Red circles indicatecandidates that are finally predicted as parasites (true preselected parasites), and green circles indicates those that are predicted as non-parasites(false preselected parasites). (b) Probabilities of parasite candidates that overlap more than 50% with parasites in the ground truth. The numberunder each patch denotes the output probability of the CNN. Red and green numbers indicate probabilities larger than 0.6 and smaller than 0.6,respectively.
YANG et al.: DEEP LEARNING FOR SMARTPHONE-BASED MALARIA PARASITE DETECTION IN THICK BLOOD SMEARS 11
TABLE VPERFORMANCE COMPARISON BETWEEN THE CUSTOMIZED CNN MODEL
AND DL MODELS IN THE LITERATURE ON SET A
A comparison between the customized CNN model and atraditional SVM classifier based on HOG features shows thatour customized CNN model outperforms the SVM classifierby about 6% in accuracy, 8% in sensitivity, 4% in specificity,5% in precision, 6% in negative prediction, and 6% in F-score,respectively.
Based on the comparison between our customized CNNmodel and the three pre-trained networks Alexnet, VGG19,and ResNet50 (on a CPU), in Tables IV and V, we find:1) our customized CNN model is more than ten times fasterthan VGG19 and ResNet50 (see Table V); 2) the accuracy ofour customized CNN network is significantly better on Set A,between one and two percent, than the accuracy of a pre-trainedVGG19 (p < 0.001) and AlexNet (p < 0.01), with a largerdifference on Set B (Table IV). ResNet50 achieves an accuracyaround 92.50% on Set A. However, ResNet50 is too big and tooslow for our smartphone application; 3) according to the ROCcurve, our customized CNN outperforms AlexNet, VGG19, andResNet50 from 5% to 23% in terms of sensitivity for the givenspecificity. We have also applied object detection networks,such as faster-RCNN [31] and YOLO [32], to detect parasitecandidates. However, these object detection networks do notwork well for very small objects like parasites, with an averagesize of 44x44 pixels in an image of 4032× 3024 pixels, resultingin many false negatives.
V. CONCLUSION
In this paper, we implement a deep learning application forsmartphones to detect malaria parasites in thick smear images.Our processing pipeline for automated parasite detection con-sists of two stages: parasite screening and classification. Anintensity-based Iterative Global Minimum Screening (IGMS)first performs a fast screening of an entire thick smear imageto generate parasite candidates. A customized CNN model thenclassifies each candidate as either parasite or background. Ourexperimental results demonstrate the practicality of our methodfor automatic detection of malaria parasites. To the best of ourknowledge, our paper is the second paper that has developed asmartphone application for thick blood smear screening [18],and the first paper that has applied deep learning techniquesfor parasite detection in thick smears on smartphones, withevaluation on patient level. We make our dataset of 1819 imagesfrom 150 patients publicly available, as a service to the researchcommunity, which will mitigate the problem of lacking trainingdata for automated malaria diagnosis in thick blood smears. Ourfuture work is to improve the performance of our automated
parasite detection method using network ensemble techniquesand to improve its runtime on smartphones.
ACKNOWLEDGMENT
Conflicts of Interest: All authors have read the journals policyon disclosure of potential conflicts of interest and have none todeclare. All authors have read the journals authorship agreementand the manuscript has been reviewed and approved by allauthors.
REFERENCES
[1] “World malaria report,” WHO, Geneva, Switzerland, 2018.[2] WHO, Guidelines for the Treatment of Malaria, 3rd ed. Geneva, Switzer-
land: World Health Organization, 2015.[3] K. S. Makhija, S. Maloney, and R. Norton, “The utility of serial blood film
testing for the diagnosis of malaria,” Pathology, vol. 47, no. 1, pp. 68–70,2015.
[4] WHO, Malaria Microscopy Quality Assurance Manual. Geneva, Switzer-land: World Health Organization, 2016.
[5] M. Poostchi, K. Silamut, R. J. Maude, S. Jaeger, and G. Thoma, “Im-age analysis and machine learning for detecting malaria,” Transl. Res.,vol. 194, pp. 36–55, Apr. 2018.
[6] Z. Liang et al., “CNN-based image analysis for malaria diagnosis,” in Proc.IEEE Int. Conf. Bioinf. Biomed., Shenzhen, China, 2017, pp. 493–496.
[7] S. Rajaraman et al., “Understanding the learned behavior of customizedconvolutional neural networks toward malaria parasite detection in thinblood smear images,” J. Med. Imag., vol. 5, no. 3, Jul. 2018, Art.no. 034501.
[8] L. Rosado, J. M. Correia da Costa, D. Elias, and J. S. Cardoso, “A reviewof automatic malaria parasites detection and segmentation in microscopicimages,” Anti-Infective Agents, vol. 14, no. 1, pp. 11–22, Mar. 2016.
[9] P. A. Pattanaik and T. Swarnkar, “Comparative analysis of morphologicaltechniques for malaria detection,” Int. J. Healthcare Inf. Syst. Inform.,vol. 13, no. 4, pp. 49–65, Oct. 2018.
[10] S. Kaewkamnerd, A. Intarapanich, M. Pannarat, S. Chaotheing, C. Uthaip-ibull, and S. Tongsima, “Detection and classification device for malariaparasites in thick-blood films,” in Proc. IEEE Int. Conf. Intell. Data Ac-quisition Adv. Comput. Syst., Prague, Czech Republic, 2011, pp. 435–438.
[11] N. S. M. M. Hanif, M. Y. Mashor, and Z. Mohamed, “Image enhance-ment and segmentation using dark stretching technique for PlasmodiumFalciparum for thick blood smear,” in Proc. Int. Colloq. Signal Process ItsAppl., Penang, Malaysia, 2011, pp. 257–260.
[12] K. Chakrabortya, “A combined algorithm for malaria detection from thicksmear blood slides,” J. Health Med. Inform., vol. 6, no. 1, pp. 179–186,Jan. 2015.
[13] I. R. Dave and K. P. Upla, “Computer aided diagnosis of malaria diseasefor thin and thick blood smear microscopic images,” in Proc. Int. Conf.Signal Process. Integr. Netw., Noida, India, 2017, pp. 4–8.
[14] M. Elter, E. Hasslmeyer, and T. Zerfass, “Detection of malaria parasitesin thick blood films,” in Proc. IEEE Eng. Med. Biol. Soc., Boston, MA,USA, 2011, pp. 5140–5144.
[15] I. K. E. Purnama, F. Z. Rahmanti, and M. H. Purnomo, “Malaria parasiteidentification on thick blood film using genetic programming,” in Proc.Int. Conf. Instrum., Commun., Inf. Technol., Biomed. Eng., Bandung,Indonesia, 2013, pp. 194–198.
[16] L. Yunda, “Automated image analysis method for p-vivax malaria parasitedetection in thick film blood images,” Rev. S&T, vol. 10, no. 20, pp. 9–25,Mar. 2011.
[17] J. A. Quinn, A. Andama, I. Munabi, and F. N. Kiwanuka, “Automatedblood smear analysis for mobile malaria diagnosis,” in Mobile Point-of-Care Monitors and Diagnostic Device Design, W. Karlen and K. Iniewski,Eds., Boca Raton, FL, USA: CRC Press, 2014, pp. 1–20.
[18] L. Rosado, J. M. C. Da Costa, D. Elias, and J. S. Cardoso, “Automateddetection of malaria parasites on thick blood smears via mobile devices,”Procedia Comput. Sci., vol. 90, pp. 138–144, Dec. 2016.
[19] A. Krizhevsky, I. Sutskever, and G. E. Hinton, “ImageNet classificationwith deep convolutional neural networks,” in Proc. Advances Neural Inf.Process. Syst., Dec. 2012, pp. 1–9.
[20] Y. Sun, X. Wang, and X. Tang, “Deep learning face representation frompredicting 10,000 classes,” in Proc. IEEE Conf. Comput. Vision PatternRecognit., Columbus, OH, USA, 2014, pp. 1891–1898.
12 IEEE JOURNAL OF BIOMEDICAL AND HEALTH INFORMATICS
[21] S. Ren et al., “Rich feature hierarchies for accurate object detection andsemantic segmentation,” in Proc. IEEE Conf. Comput. Vision PatternRecognit., Boston, MA, USA, 2015, vol. 794, pp. 1–15.
[22] C. B. Delahunt et al., “Automated microscopy and machine learning forexpert-level malaria field diagnosis,” in Proc. IEEE Global HumanitarianTechnol. Conf., Seattle, WA, USA, 2015, pp. 393–399.
[23] J. A. Quinn, R. Nakasi, P. K. B. Mugagga, P. Byanyima, W. Lubega, andA. Andama, “Deep convolutional neural networks for microscopy-basedpoint of care diagnostics,” in Proc. Mach. Learn. Healthcare Conf., LosAngeles, CA, USA, 2016, pp. 271–281.
[24] C. Mehanian, M. Jaiswal, C. Delahunt, and C. Thompson, “Computer-automated malaria diagnosis and quantitation using convolutional neuralnetworks,” in Proc. IEEE Int. Conf. Comput. Vision Workshops, Venice,Italy, 2017, pp. 116–125.
[25] K. Torres et al., “Automated microscopy for routine malaria diagnosis:A field comparison on Giemsa-stained blood films in Peru,” Malaria J.,vol. 17, no. 1, pp. 339–350, Sep. 2018.
[26] K. He, X. Zhang, S. Ren, and J. Sun, “Deep residual learning for imagerecognition,” in Proc. IEEE Conf. Comput. Vision Pattern Recognit., LasVegas, NA, USA, 2016, pp. 770–778.
[27] K. Simonyan and A. Zisserman, “Very deep convolutional networks forlarge-scale image recognition,” presented at the 3rd Int. Conf. Learn.Representations, San Diego, May 7–9, 2015, arXiv1409.1556.
[28] C. Szegedy et al., “Going deeper with convolutions,” in Proc. IEEEConf. Comput. Vision Pattern Recognit., Boston, MA, USA, 2015,pp. 1–9.
[29] S. Ioffe and C. Szegedy, “Batch normalization: Accelerating deep networktraining by reducing internal covariate shift,” in Proc. Int. Conf. Mach.Learn., Lille, France, 2015, pp. 81–87.
[30] N. Srivastava, G. Hinton, A. Krizhevsky, I. Sutskever, and R. Salakhutdi-nov, “Dropout: A simple way to prevent neural networks from overfitting,”J. Mach. Learn. Res., vol. 15, pp. 1929–1958, Jun. 2014.
[31] S. Ren, K. He, R. Girshick, and J. Sun, “Faster R-CNN: Towards real-timeobject detection with region proposal networks,” IEEE Trans. Pattern Anal.Mach. Intell., vol. 39, no. 6, pp. 1137–1149, Jun. 2017.
[32] J. Redmon, S. Divvala, R. Girshick, and A. Farhadi, “You only look once:Unified, real-time object detection,” in Proc. IEEE Conf. Comput. VisionPattern Recognit., Las Vegas, NV, USA, 2016, pp. 779–788.
[33] N. Otsu, “A threshold selection method from gray-level histograms,” IEEETrans. Syst., Man., Cybern., vol. SMC-9, no. 1, pp. 62–66, Jan. 1979.