Embed Size (px)
Citation preview
An Analysis of IEEE 802.11 DCF and ItsApplication to Energy-Efficient Relaying
in Multihop Wireless NetworksCanan Aydogdu, Student Member, IEEE, and Ezhan Karasan, Member, IEEE
Abstract—We present an analytical model for the IEEE 802.11 DCF in multihop wireless networks that considers hidden terminals
and accurately works for a large range of traffic loads. An energy model, which considers energy consumption due to collisions,
retransmissions, exponential backoff and freezing mechanisms, and overhearing of nodes, and the proposed IEEE 802.11 DCF
analytical model are used to analyze the energy consumption of various relaying strategies. The results show that the energy-efficient
relaying strategy depends significantly on the traffic load. Under light traffic, energy spent during idle mode dominates, making any
relaying strategy nearly optimal. Under moderate traffic, energy spent during idle and receive modes dominates and multihop
transmissions become more advantageous where the optimal hop number varies with processing power consumed at relay nodes.
Under very heavy traffic, where multihopping becomes unstable due to increased collisions, direct transmission becomes more energy
efficient. The choice of relaying strategy is observed to affect energy efficiency more for large and homogeneous networks where it is
beneficial to use multiple short hops each covering similar distances. The results indicate that a cross-layered relaying approach, which
dynamically changes the relaying strategy, can substantially save energy as the network traffic load changes in time.
Index Terms—IEEE 802.11 DCF, analytical model, energy-efficient relaying, multihop wireless networks, hidden terminal.
Ç
1 INTRODUCTION
ONE of the greatest limitations of wireless multihopnetworks is the finite energy resource of terminals. As
a result, energy-efficient routing protocol design for wire-less multihop networks has been the focus of many researchefforts. Many minimum-energy routing protocols considersolely the energy consumption at the amplifier due totransmission, ignoring the energy consumed at the trans-mitter and receiver circuitry for reception and processing,favoring multihop paths [1], [2]. However signal processingassociated with packet transmission and reception con-sumes nonnegligible energy [3]. It has been shown thatrouting through multiple short hops is not always moreenergy efficient than direct transmission when processingpower is also taken into account [4], [5], [6], [7].
Recent studies have shown that energy efficiency ofrouting protocols is enhanced by cross layering, whichconsiders multiple protocol layers and allows exchange ofinformation among layers [8], [9], [10]. This paper extendsthe studies investigating the effect of relaying on energyefficiency using a cross-layered approach. The effects ofmedium access control (MAC) contention on energyefficiency are investigated to answer the following basicquestion: “When should we use a single long hop or multiple shorthops for energy-efficient routing in wireless multihop networks?”The goal of this study is to reveal when multihopping
becomes advantageous and to state guidelines for energy-efficient routing considering MAC contention.
Under transmit power control, the energy consumed atthe physical (PHY) layer decreases when switching fromdirect transmission to multihopping, which in turn de-creases the number of contending stations within thetransmission range. A decreased number of contendingstations implies decreased number of collisions, retransmis-sions, backoff, and freezing mechanisms at the MAC layer,and less overhearing, which decrease the overall energyconsumption. On the other hand, multihopping requiressuccessful transmissions at all hops of the path and energyis lost when packet is lost at some hop. The relayingstrategy used by the routing protocol at the network layerhas impacts on MAC parameters, affecting energy effi-ciency. Thus, for energy-efficient selection of routes, thebehavior of MAC layer should be carefully contemplated.
The IEEE 802.11 distributed coordination function (DCF)is studied in this paper, since most commercial wirelessproducts are based on the IEEE 802.11 standard [11]. TheIEEE 802.11 DCF performance changes when switchingfrom local area networks to wireless multihop networks inthree major aspects: 1) paths are multihop whereas they aresingle hop in local area networks, 2) traffic handled by eachnode is the superposition of node’s own traffic and the relaytraffic, and 3) the behavior of each node depends also onhidden nodes.
Various analytical models exist for IEEE 802.11 DCFbased single-hop networks, where the first model is intro-duced for saturated networks with infinite retry count [12].Further models have been developed under differentassumptions such as finite retry limit [13], unsaturatedtraffic conditions [14], etc. On the other hand, there are few
IEEE TRANSACTIONS ON MOBILE COMPUTING, VOL. 10, NO. 10, OCTOBER 2011 1361
. The authors are with the Department of Electrical and ElectronicsEngineering, Bilkent University, Bilkent 06800, Ankara, Turkey.E-mail: {canan, ezhan}@ee.bilkent.edu.tr.
Manuscript received 1 Sept. 2009; revised 4 Oct. 2010; accepted 7 Oct. 2010;published online 17 Dec. 2010.For information on obtaining reprints of this article, please send e-mail to:[email protected], and reference IEEECS Log Number TMC-2009-09-0359.Digital Object Identifier no. 10.1109/TMC.2010.239.
1536-1233/11/$26.00 � 2011 IEEE Published by the IEEE CS, CASS, ComSoc, IES, & SPS
analytical models for multihop networks, which work undereither unsaturated [15] or saturated [16], [17], [18] trafficconditions. Owing to the comparable complexity increasewhen switching from single hop to multihop networkarchitecture, the existing models are based on simplifiedassumptions. The hidden terminal problem is eliminated in[15] by the assumption of RTS/CTS mode with busy tone,whereas the analysis in [16] ignores the existence of hiddenterminals and assumes that each node is either relay orsource. The hidden terminal problem is included in theanalysis of IEEE 802.11 DCF in [17] and [18], where only3-node and string topologies are considered, respectively.An analytical DCF model, which considers hidden term-inals and works for various traffic loads in various multihoptopologies, does not exist to the best of our knowledge.
Energy consumption of IEEE 802.11 DCF in single-hopnetworks is analyzed in [19], [20], [21], [22], [23]. The binaryexponential backoff mechanism (BEB) is ignored in [19],whereas BEB is approximated by a p-persistent model in[20] for saturated traffic conditions. Analytical energymodels which consider the BEB and account for the IEEE802.11 DCF protocol by encapsulating the carrier sensing,collisions, and freezing mechanism in backoff are proposedwith infinite retry limit in [21] and finite retry limit in [22]and [23] under saturated traffic conditions. Despite variousmodels for energy consumption in single-hop networks[19], [20], [21], [22], [23], energy consumption in IEEE 802.11DCF based wireless multi-hop networks has not beenanalytically modeled so far.
The primary contribution of this study is an analyticalframework for the investigation of the energy efficiency ofrelaying strategies in IEEE 802.11 DCF based wirelessmultihop networks. To the best of our knowledge, this is thefirst study in multihop networks that includes the energyconsumption due to MAC operations such as collisions,retransmissions, overhearing of nodes, BEB, and freezingmechanisms. Owing to the fact that existing models areinadequate for energy-efficiency analysis in multihop net-works, an analytical model for IEEE 802.11 DCF formultihop networks is introduced which:
. considers hidden terminals,
. provides fairly accurate results for large range oftraffic loads,
. works for any given two-dimensional topology,
. increases the accuracy and scalability of the analyticalmodel by joint use of fixed and variable slots, and
. allows each node to be both source and/or relay.
A semi-Markov chain (SMC) based model is proposed,since SMC models are shown to predict the DCF behaviorbetter than discrete-time Markov chain (DTMC) models[12], [13]. The analytic results obtained via the IEEE 802.11DCF and the energy model, supported by simulations,show that the energy-efficient relaying strategy highlydepends on the traffic load. Under light traffic, energyspent during idle mode is responsible for most of the energyconsumed, making any relaying strategy equivalentlyoptimal. Under moderate traffic, energy spent during idleand receive modes dominates and multihop transmissionsbecome more advantageous. At heavy traffic, multihoppingbecomes unstable due to increased packet collisions and
excessive traffic congestion, and direct transmission be-comes more energy efficient and stable. It is also shown thatthe processing power at relay nodes affects the optimal hopnumber, but only for a specific range of traffic loads. Themajor attributes of the proposed analytical IEEE 802.11 DCFmodel for multihop networks are discussed in Section 2 andthe model is introduced in Section 3. A theoretical frame-work to evaluate the energy consumption of IEEE 802.11DCF is introduced in Section 4. Finally, analytical andsimulation results are presented in Section 5.
2 MAJOR ATTRIBUTES OF THE PROPOSED
ANALYTICAL MODEL FOR IEEE 802.11 DCF
Owing to the fact that the existing analytical models of IEEE802.11 DCF systems are inadequate for an energy-efficiencyanalysis in wireless multihop networks, an analytical modelfor IEEE 802.11 DCF for wireless multihop networks isdeveloped in this paper. The major attributes of the proposedDCF model together with the limitations and assumptions ofthe previous DCF models are described in this section.
2.1 Joint Use of Fixed and Variable Slots
Most of the IEEE 802.11 DCF models are based ondiscretizing time into variable length slots, where a slot iseither the constant SlotTime, or the variable time intervalbetween two consecutive backoff counter decrements [11].A limitation stemming from variable slot length ismentioned in [17] and it is shown that the error in findingthroughput for various PHY layer parameters grows forsmaller contention window sizes, larger packet sizes, andlower data rates. On the other hand, using short fixedlength slots in the analysis increases the number of states ofthe DTMC. In order to limit the number of states, the fixedslot length analysis in [17] is based on constant contentionwindow (CCW) assumption, which hinders the dynamics ofthe IEEE 802.11 DCF.
In this paper, a solution methodology different from theliterature is developed where a joint usage of fixed andvariable length slots is adapted. The SMC is developed andsolved based on variable slot notion, whereas MACparameters such as collision probability and networkallocation vector (NAV) setting probabilities are developedbased on fixed length slot notion. Variable length slot notionensures that the number of states of the SMC is keptrelatively small, so that BEB is included in the analysis,reflecting the real dynamics of the IEEE 802.11 DCF. On theother hand, the fixed-slot notion used in developing MACparameters ensures that our analysis is not prone to theerrors pointed out by Tsertou and Laurenson [17]. This way,the weaknesses of variable slot length analysis are elimi-nated, while keeping the SMC state size small enough to becomputationally efficient even with BEB.
2.2 From Channel State Probability toward NAVSetting Probability
In studies modeling the IEEE 802.11 DCF in single-hopnetworks, successful, collision, and idle channel perceivedby a node are represented by channel state probabilities.However this representation is not appropriate for multihopnetworks, because the channel state perceived by a node maynot be the actual state of the channel when hidden nodes
1362 IEEE TRANSACTIONS ON MOBILE COMPUTING, VOL. 10, NO. 10, OCTOBER 2011

exist. For example, two concurrent successful transmissionsin the channel of a node are perceived as a collision. Also, anode perceives a successful channel if it successfully receivesan RTS or CTS frame that collides at the relevant receivers. In[17], instead of distinguishing among channel states theprobability of freezing/not freezing the backoff counter isused. But NAV duration takes only one value and leads toinsufficient accuracy in large multihop networks. We switchfrom channel state probability notion to NAV settingprobability notion and discriminate between events that setthe NAV for long and short durations.
2.3 Large Range of Traffic Loads
The existing analytical models for IEEE 802.11 DCF for bothsingle-hop and multihop networks work under eitherunsaturated [14], [15] or saturated [12], [13], [16], [17], [18]traffic loads. In this paper, we develop an analytical modelfor multihop networks that operates in any traffic loadranging from light to heavy traffic conditions.
2.4 Any Given Topology and Traffic Pattern
Unlike previous studies that have focused on analyzingIEEE 802.11 behavior by considering hidden terminals inmultihop networks under assumptions of specific network(e.g., [17], [18]), the proposed model accurately works forvarious network topologies and traffic patterns consideredin this study.
2.5 Not Only RTS Collisions
Existence of hidden terminals in multihop networks resultsin collisions other than collision of RTS packets. An RTS orCTS packet that is not received correctly by neighborsinside the carrier sensing range may cause collision of othertypes of frames. In the analysis carried out in this paper,collisions of RTS, CTS, DATA, or ACK frames with eachother are also considered in the calculation of theprobability of collision.
3 IEEE 802.11 DCF MODEL FOR MULTIHOP
AD HOC NETWORKS
Basics of the proposed IEEE 802.11 DCF model isintroduced in this section after an overview of assumptions.Geometry related notations, calculation of the state resi-dence times, NAV setting probabilities and collisionprobability are described next. A list of notations used inthis paper is given in Table 1.
3.1 Assumptions
Several simplifying assumptions also made by severalprevious studies [12], [13], [14], [15], [16], [17], [18] areadapted in order to provide an analytically tractablesolution to the problem:
1. disc radio model,2. Poisson offered traffic,3. bit error-free channel, and4. stationary nodes.
No assumption is imposed neither on the topology nor onthe traffic pattern. In order to be able to compare the energyefficiency of relaying strategies, a comparison is conducted
using the same topology and traffic pattern where all nodesin the network are assumed to adapt the same routingstrategy: each generated packet traverses a path of h hops.Thus, source-destination pairs are selected so that areasonable h-hop path exists. Nodes are assumed toconduct power control with infinitely variable levels and
AYDOGDU AND KARASAN: AN ANALYSIS OF IEEE 802.11 DCF AND ITS APPLICATION TO ENERGY-EFFICIENT RELAYING IN MULTIHOP... 1363
TABLE 1List of Notations
transmit with the minimum required power to reach thenext hop. The transmission range is assumed to be equal tothe carrier sensing range and the interference range.
Each node is assumed to use the IEEE 802.11 DCF inconjunction with the RTS/CTS exchange as the MACprotocol. Although the RTS/CTS handshake mechanismintroduces an overhead, it is shown to improve IEEE 802.11performance in multihop wireless networks when hiddennodes are present [24]. In case of a collision, packets areretransmitted according to BEB until the maximum retrycount (M) is reached. At each transmission attempt,regardless of the number of retransmissions, each packetcollides with a conditional probability p, conditioned on thefact that the particular node is attempting a transmission.Packets are dropped after M unsuccessful retries withprobability pM or due to overflow of the finite sized interfacequeue (IFQ) with probability PifqðiÞ at node i for 1 � i � N ,where N is the total number of nodes in the wirelessnetwork. In our model, a single value is used for p whichcorresponds to the average conditional collision probabilitytaken over all links, whereasPifqðiÞ is different for each node.
3.2 Basics of IEEE 802.11 DCF Model
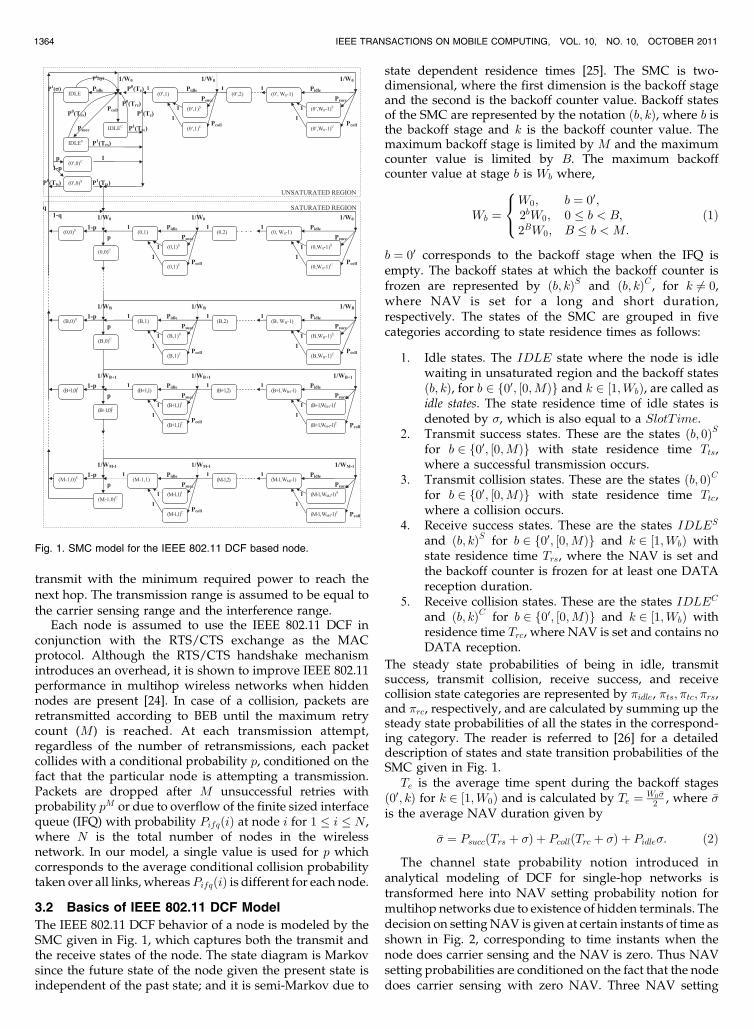
The IEEE 802.11 DCF behavior of a node is modeled by theSMC given in Fig. 1, which captures both the transmit andthe receive states of the node. The state diagram is Markovsince the future state of the node given the present state isindependent of the past state; and it is semi-Markov due to
state dependent residence times [25]. The SMC is two-dimensional, where the first dimension is the backoff stageand the second is the backoff counter value. Backoff statesof the SMC are represented by the notation ðb; kÞ, where b isthe backoff stage and k is the backoff counter value. Themaximum backoff stage is limited by M and the maximumcounter value is limited by B. The maximum backoffcounter value at stage b is Wb where,
Wb ¼W0; b ¼ 00;2bW0; 0 � b < B;2BW0; B � b < M:
8<: ð1Þ
b ¼ 00 corresponds to the backoff stage when the IFQ isempty. The backoff states at which the backoff counter isfrozen are represented by ðb; kÞS and ðb; kÞC , for k 6¼ 0,where NAV is set for a long and short duration,respectively. The states of the SMC are grouped in fivecategories according to state residence times as follows:
1. Idle states. The IDLE state where the node is idlewaiting in unsaturated region and the backoff statesðb; kÞ, for b 2 f00; ½0;MÞg and k 2 ½1;WbÞ, are called asidle states. The state residence time of idle states isdenoted by �, which is also equal to a SlotTime.
2. Transmit success states. These are the states ðb; 0ÞSfor b 2 f00; ½0;MÞg with state residence time Tts,where a successful transmission occurs.
3. Transmit collision states. These are the states ðb; 0ÞCfor b 2 f00; ½0;MÞg with state residence time Ttc,where a collision occurs.
4. Receive success states. These are the states IDLES
and ðb; kÞS for b 2 f00; ½0;MÞg and k 2 ½1;WbÞ withstate residence time Trs, where the NAV is set andthe backoff counter is frozen for at least one DATAreception duration.
5. Receive collision states. These are the states IDLEC
and ðb; kÞC for b 2 f00; ½0;MÞg and k 2 ½1;WbÞ withresidence time Trc, where NAV is set and contains noDATA reception.
The steady state probabilities of being in idle, transmitsuccess, transmit collision, receive success, and receivecollision state categories are represented by �idle, �ts; �tc; �rs,and �rc, respectively, and are calculated by summing up thesteady state probabilities of all the states in the correspond-ing category. The reader is referred to [26] for a detaileddescription of states and state transition probabilities of theSMC given in Fig. 1.Te is the average time spent during the backoff stages
ð00; kÞ for k 2 ½1;W0Þ and is calculated by Te ¼ W0 ��2 , where ��
is the average NAV duration given by
�� ¼ PsuccðTrs þ �Þ þ PcollðTrc þ �Þ þ Pidle�: ð2Þ
The channel state probability notion introduced inanalytical modeling of DCF for single-hop networks istransformed here into NAV setting probability notion formultihop networks due to existence of hidden terminals. Thedecision on setting NAV is given at certain instants of time asshown in Fig. 2, corresponding to time instants when thenode does carrier sensing and the NAV is zero. Thus NAVsetting probabilities are conditioned on the fact that the nodedoes carrier sensing with zero NAV. Three NAV setting
1364 IEEE TRANSACTIONS ON MOBILE COMPUTING, VOL. 10, NO. 10, OCTOBER 2011
Fig. 1. SMC model for the IEEE 802.11 DCF based node.
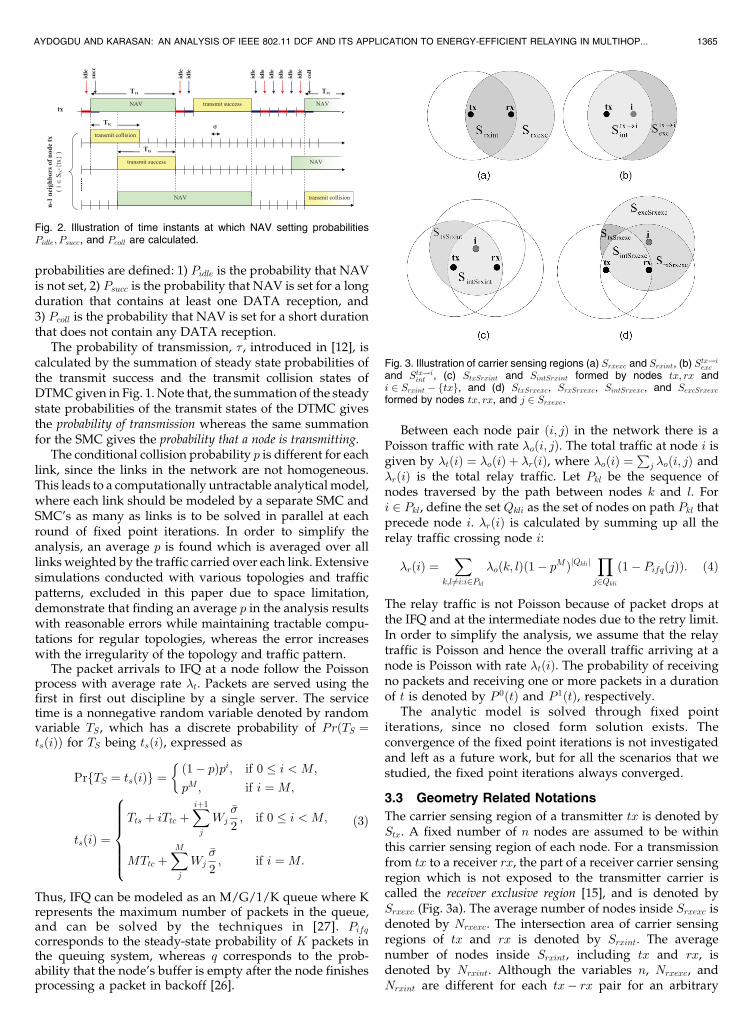
probabilities are defined: 1) Pidle is the probability that NAVis not set, 2) Psucc is the probability that NAV is set for a longduration that contains at least one DATA reception, and3) Pcoll is the probability that NAV is set for a short durationthat does not contain any DATA reception.
The probability of transmission, � , introduced in [12], iscalculated by the summation of steady state probabilities ofthe transmit success and the transmit collision states ofDTMC given in Fig. 1. Note that, the summation of the steadystate probabilities of the transmit states of the DTMC givesthe probability of transmission whereas the same summationfor the SMC gives the probability that a node is transmitting.
The conditional collision probability p is different for eachlink, since the links in the network are not homogeneous.This leads to a computationally untractable analytical model,where each link should be modeled by a separate SMC andSMC’s as many as links is to be solved in parallel at eachround of fixed point iterations. In order to simplify theanalysis, an average p is found which is averaged over alllinks weighted by the traffic carried over each link. Extensivesimulations conducted with various topologies and trafficpatterns, excluded in this paper due to space limitation,demonstrate that finding an average p in the analysis resultswith reasonable errors while maintaining tractable compu-tations for regular topologies, whereas the error increaseswith the irregularity of the topology and traffic pattern.
The packet arrivals to IFQ at a node follow the Poissonprocess with average rate �t. Packets are served using thefirst in first out discipline by a single server. The servicetime is a nonnegative random variable denoted by randomvariable TS , which has a discrete probability of PrðTS ¼tsðiÞÞ for TS being tsðiÞ, expressed as
PrfTS ¼ tsðiÞg ¼ð1� pÞpi; if 0 � i < M;
pM; if i ¼M;
�
tsðiÞ ¼Tts þ iTtc þ
Xiþ1
j
Wj��
2; if 0 � i < M;
MTtc þXMj
Wj��
2; if i ¼M:
8>>>>><>>>>>:
ð3Þ
Thus, IFQ can be modeled as an M/G/1/K queue where Krepresents the maximum number of packets in the queue,and can be solved by the techniques in [27]. Pifqcorresponds to the steady-state probability of K packets inthe queuing system, whereas q corresponds to the prob-ability that the node’s buffer is empty after the node finishesprocessing a packet in backoff [26].
Between each node pair ði; jÞ in the network there is aPoisson traffic with rate �oði; jÞ. The total traffic at node i isgiven by �tðiÞ ¼ �oðiÞ þ �rðiÞ, where �oðiÞ ¼
Pj �oði; jÞ and
�rðiÞ is the total relay traffic. Let Pkl be the sequence ofnodes traversed by the path between nodes k and l. Fori 2 Pkl, define the set Qkli as the set of nodes on path Pkl thatprecede node i. �rðiÞ is calculated by summing up all therelay traffic crossing node i:
�rðiÞ ¼X
k;l6¼i:i2Pkl�oðk; lÞð1� pMÞjQklij
Yj2Qkli
ð1� PifqðjÞÞ: ð4Þ
The relay traffic is not Poisson because of packet drops atthe IFQ and at the intermediate nodes due to the retry limit.In order to simplify the analysis, we assume that the relaytraffic is Poisson and hence the overall traffic arriving at anode is Poisson with rate �tðiÞ. The probability of receivingno packets and receiving one or more packets in a durationof t is denoted by P 0ðtÞ and P 1ðtÞ, respectively.
The analytic model is solved through fixed pointiterations, since no closed form solution exists. Theconvergence of the fixed point iterations is not investigatedand left as a future work, but for all the scenarios that westudied, the fixed point iterations always converged.
3.3 Geometry Related Notations
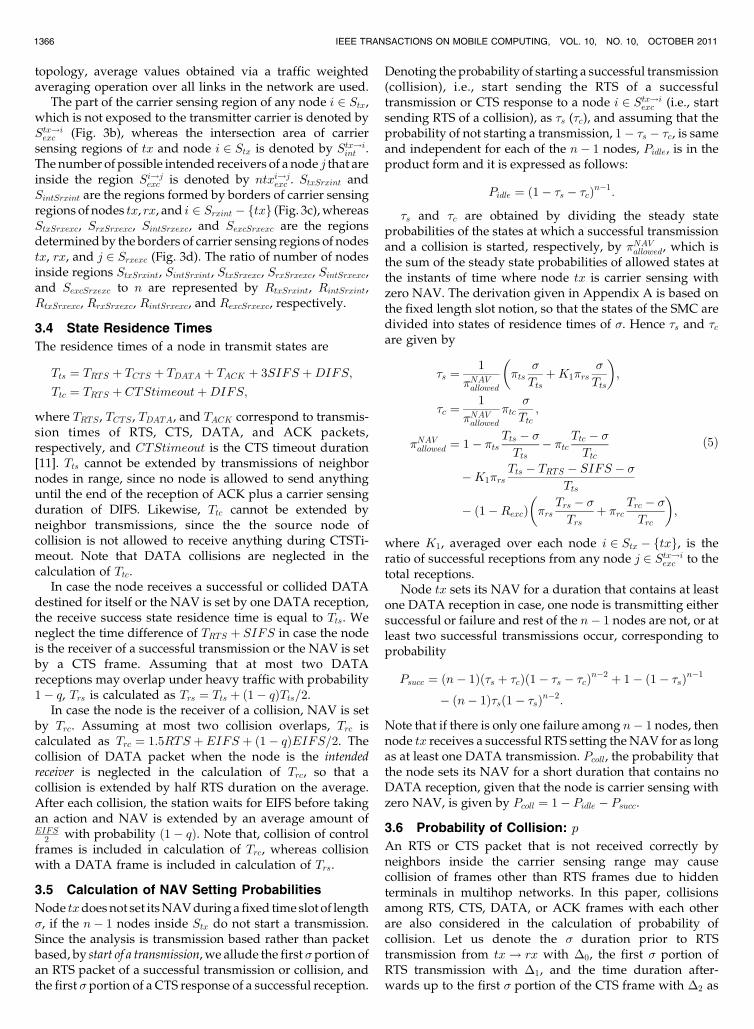
The carrier sensing region of a transmitter tx is denoted byStx. A fixed number of n nodes are assumed to be withinthis carrier sensing region of each node. For a transmissionfrom tx to a receiver rx, the part of a receiver carrier sensingregion which is not exposed to the transmitter carrier iscalled the receiver exclusive region [15], and is denoted bySrxexc (Fig. 3a). The average number of nodes inside Srxexc isdenoted by Nrxexc. The intersection area of carrier sensingregions of tx and rx is denoted by Srxint. The averagenumber of nodes inside Srxint, including tx and rx, isdenoted by Nrxint. Although the variables n, Nrxexc, andNrxint are different for each tx� rx pair for an arbitrary
AYDOGDU AND KARASAN: AN ANALYSIS OF IEEE 802.11 DCF AND ITS APPLICATION TO ENERGY-EFFICIENT RELAYING IN MULTIHOP... 1365
Fig. 2. Illustration of time instants at which NAV setting probabilitiesPidle; Psucc, and Pcoll are calculated.
Fig. 3. Illustration of carrier sensing regions (a) Srxexc and Srxint, (b) Stx!iexc
and Stx!iint , (c) StxSrxint and SintSrxint formed by nodes tx; rx andi 2 Srxint � ftxg, and (d) StxSrxexc, SrxSrxexc, SintSrxexc, and SexcSrxexcformed by nodes tx; rx, and j 2 Srxexc.
topology, average values obtained via a traffic weightedaveraging operation over all links in the network are used.
The part of the carrier sensing region of any node i 2 Stx,which is not exposed to the transmitter carrier is denoted byStx!iexc (Fig. 3b), whereas the intersection area of carriersensing regions of tx and node i 2 Stx is denoted by Stx!iint .The number of possible intended receivers of a node j that areinside the region Si!jexc is denoted by ntxi!jexc . StxSrxint andSintSrxint are the regions formed by borders of carrier sensingregions of nodes tx, rx, and i 2 Srxint � ftxg (Fig. 3c), whereasStxSrxexc, SrxSrxexc, SintSrxexc, and SexcSrxexc are the regionsdetermined by the borders of carrier sensing regions of nodestx, rx, and j 2 Srxexc (Fig. 3d). The ratio of number of nodesinside regions StxSrxint, SintSrxint, StxSrxexc, SrxSrxexc, SintSrxexc,and SexcSrxexc to n are represented by RtxSrxint, RintSrxint,RtxSrxexc, RrxSrxexc, RintSrxexc, and RexcSrxexc, respectively.
3.4 State Residence Times
The residence times of a node in transmit states are
Tts ¼ TRTS þ TCTS þ TDATA þ TACK þ 3SIFS þDIFS;Ttc ¼ TRTS þ CTStimeoutþDIFS;
where TRTS , TCTS , TDATA, and TACK correspond to transmis-sion times of RTS, CTS, DATA, and ACK packets,respectively, and CTStimeout is the CTS timeout duration[11]. Tts cannot be extended by transmissions of neighbornodes in range, since no node is allowed to send anythinguntil the end of the reception of ACK plus a carrier sensingduration of DIFS. Likewise, Ttc cannot be extended byneighbor transmissions, since the the source node ofcollision is not allowed to receive anything during CTSTi-meout. Note that DATA collisions are neglected in thecalculation of Ttc.
In case the node receives a successful or collided DATAdestined for itself or the NAV is set by one DATA reception,the receive success state residence time is equal to Tts. Weneglect the time difference of TRTS þ SIFS in case the nodeis the receiver of a successful transmission or the NAV is setby a CTS frame. Assuming that at most two DATAreceptions may overlap under heavy traffic with probability1� q, Trs is calculated as Trs ¼ Tts þ ð1� qÞTts=2.
In case the node is the receiver of a collision, NAV is setby Trc. Assuming at most two collision overlaps, Trc iscalculated as Trc ¼ 1:5RTS þ EIFS þ ð1� qÞEIFS=2. Thecollision of DATA packet when the node is the intendedreceiver is neglected in the calculation of Trc, so that acollision is extended by half RTS duration on the average.After each collision, the station waits for EIFS before takingan action and NAV is extended by an average amount ofEIFS
2 with probability ð1� qÞ. Note that, collision of controlframes is included in calculation of Trc, whereas collisionwith a DATA frame is included in calculation of Trs.
3.5 Calculation of NAV Setting Probabilities
Node txdoes not set its NAV during a fixed time slot of length�, if the n� 1 nodes inside Stx do not start a transmission.Since the analysis is transmission based rather than packetbased, by start of a transmission, we allude the first �portion ofan RTS packet of a successful transmission or collision, andthe first � portion of a CTS response of a successful reception.
Denoting the probability of starting a successful transmission(collision), i.e., start sending the RTS of a successfultransmission or CTS response to a node i 2 Stx!iexc (i.e., startsending RTS of a collision), as �s (�c), and assuming that theprobability of not starting a transmission, 1� �s � �c, is sameand independent for each of the n� 1 nodes, Pidle, is in theproduct form and it is expressed as follows:
Pidle ¼ ð1� �s � �cÞn�1:
�s and �c are obtained by dividing the steady stateprobabilities of the states at which a successful transmissionand a collision is started, respectively, by �NAVallowed, which isthe sum of the steady state probabilities of allowed states atthe instants of time where node tx is carrier sensing withzero NAV. The derivation given in Appendix A is based onthe fixed length slot notion, so that the states of the SMC aredivided into states of residence times of �. Hence �s and �care given by
�s ¼1
�NAVallowed
�ts�
TtsþK1�rs
�
Tts
� �;
�c ¼1
�NAVallowed
�tc�
Ttc;
�NAVallowed ¼ 1� �tsTts � �Tts
� �tcTtc � �Ttc
�K1�rsTts � TRTS � SIFS � �
Tts
� ð1�RexcÞ �rsTrs � �Trs
þ �rcTrc � �Trc
� �;
ð5Þ
where K1, averaged over each node i 2 Stx � ftxg, is theratio of successful receptions from any node j 2 Stx!iexc to thetotal receptions.
Node tx sets its NAV for a duration that contains at leastone DATA reception in case, one node is transmitting eithersuccessful or failure and rest of the n� 1 nodes are not, or atleast two successful transmissions occur, corresponding toprobability
Psucc ¼ ðn� 1Þð�s þ �cÞð1� �s � �cÞn�2 þ 1� ð1� �sÞn�1
� ðn� 1Þ�sð1� �sÞn�2:
Note that if there is only one failure among n� 1 nodes, thennode tx receives a successful RTS setting the NAV for as longas at least one DATA transmission. Pcoll, the probability thatthe node sets its NAV for a short duration that contains noDATA reception, given that the node is carrier sensing withzero NAV, is given by Pcoll ¼ 1� Pidle � Psucc.
3.6 Probability of Collision: p
An RTS or CTS packet that is not received correctly byneighbors inside the carrier sensing range may causecollision of frames other than RTS frames due to hiddenterminals in multihop networks. In this paper, collisionsamong RTS, CTS, DATA, or ACK frames with each otherare also considered in the calculation of probability ofcollision. Let us denote the � duration prior to RTStransmission from tx! rx with �0, the first � portion ofRTS transmission with �1, and the time duration after-wards up to the first � portion of the CTS frame with �2 as
1366 IEEE TRANSACTIONS ON MOBILE COMPUTING, VOL. 10, NO. 10, OCTOBER 2011
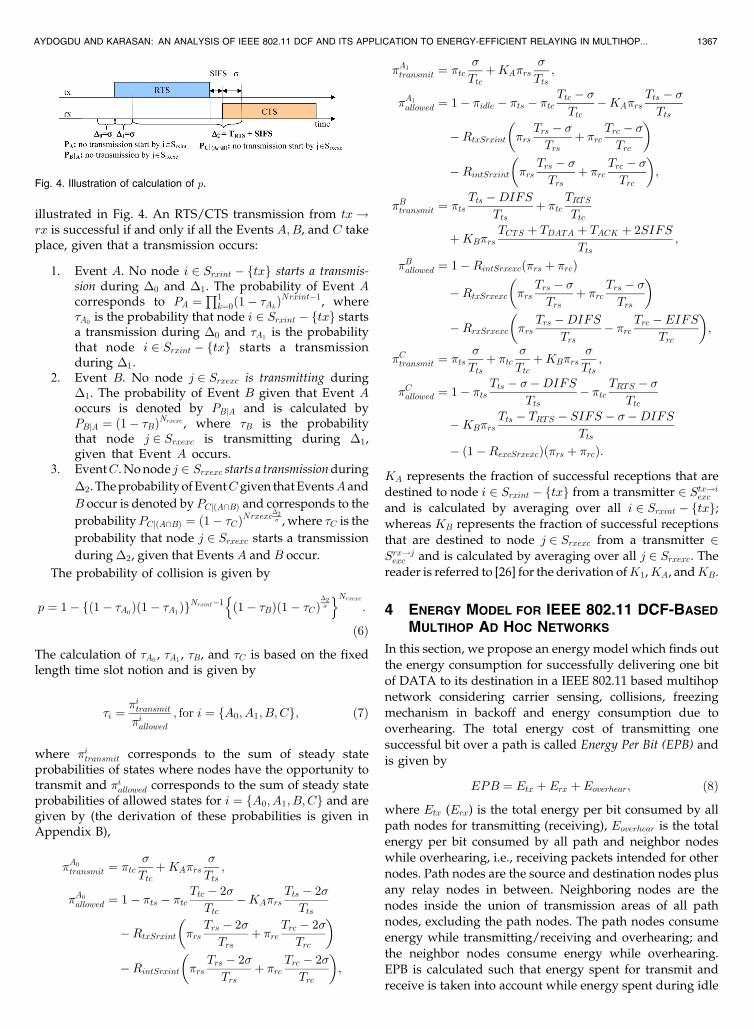
illustrated in Fig. 4. An RTS/CTS transmission from tx!rx is successful if and only if all the Events A;B, and C takeplace, given that a transmission occurs:
1. Event A. No node i 2 Srxint � ftxg starts a transmis-sion during �0 and �1. The probability of Event Acorresponds to PA ¼
Q1k¼0ð1� �Ak
ÞNrxint�1, where�A0
is the probability that node i 2 Srxint � ftxg startsa transmission during �0 and �A1
is the probabilitythat node i 2 Srxint � ftxg starts a transmissionduring �1.
2. Event B. No node j 2 Srxexc is transmitting during�1. The probability of Event B given that Event Aoccurs is denoted by PBjA and is calculated byPBjA ¼ ð1� �BÞNrxexc , where �B is the probabilitythat node j 2 Srxexc is transmitting during �1,given that Event A occurs.
3. EventC. No node j 2 Srxexc starts a transmission during
�2. The probability of EventC given that EventsAand
B occur is denoted by PCjðA\BÞ and corresponds to the
probabilityPCjðA\BÞ ¼ ð1� �CÞNrxexc�2� , where �C is the
probability that node j 2 Srxexc starts a transmission
during �2, given that Events A and B occur.
The probability of collision is given by
p ¼ 1� fð1� �A0Þð1� �A1
ÞgNrxint�1 ð1� �BÞð1� �CÞ�2�
n oNrxexc
:
ð6Þ
The calculation of �A0, �A1
, �B, and �C is based on the fixedlength time slot notion and is given by
�i ¼�itransmit�iallowed
; for i ¼ fA0; A1; B; Cg; ð7Þ
where �itransmit corresponds to the sum of steady stateprobabilities of states where nodes have the opportunity totransmit and �iallowed corresponds to the sum of steady stateprobabilities of allowed states for i ¼ fA0; A1; B; Cg and aregiven by (the derivation of these probabilities is given inAppendix B),
�A0
transmit ¼ �tc�
TtcþKA�rs
�
Tts;
�A0
allowed ¼ 1� �ts � �tcTtc � 2�
Ttc�KA�rs
Tts � 2�
Tts
�RtxSrxint �rsTrs � 2�
Trsþ �rc
Trc � 2�
Trc
� �
�RintSrxint �rsTrs � 2�
Trsþ �rc
Trc � 2�
Trc
� �;
�A1transmit ¼ �tc
�
TtcþKA�rs
�
Tts;
�A1
allowed ¼ 1� �idle � �ts � �tcTtc � �Ttc
�KA�rsTts � �Tts
�RtxSrxint �rsTrs � �Trs
þ �rcTrc � �Trc
� �
�RintSrxint �rsTrs � �Trs
þ �rcTrc � �Trc
� �;
�Btransmit ¼ �tsTts �DIFS
Ttsþ �tc
TRTSTtc
þKB�rsTCTS þ TDATA þ TACK þ 2SIFS
Tts;
�Ballowed ¼ 1�RintSrxexcð�rs þ �rcÞ
�RtxSrxexc �rsTrs � �Trs
þ �rcTrs � �Trs
� �
�RrxSrxexc �rsTrs �DIFS
Trs� �rc
Trc �EIFSTrc
� �;
�Ctransmit ¼ �ts�
Ttsþ �tc
�
TtcþKB�rs
�
Tts;
�Callowed ¼ 1� �tsTts � ��DIFS
Tts� �tc
TRTS � �Ttc
�KB�rsTts � TRTS � SIFS � ��DIFS
Tts
� ð1�RexcSrxexcÞð�rs þ �rcÞ:
KA represents the fraction of successful receptions that are
destined to node i 2 Srxint � ftxg from a transmitter 2 Stx!iexc
and is calculated by averaging over all i 2 Srxint � ftxg;whereas KB represents the fraction of successful receptions
that are destined to node j 2 Srxexc from a transmitter 2Srx!jexc and is calculated by averaging over all j 2 Srxexc. The
reader is referred to [26] for the derivation ofK1,KA, andKB.
4 ENERGY MODEL FOR IEEE 802.11 DCF-BASED
MULTIHOP AD HOC NETWORKS
In this section, we propose an energy model which finds out
the energy consumption for successfully delivering one bit
of DATA to its destination in a IEEE 802.11 based multihop
network considering carrier sensing, collisions, freezing
mechanism in backoff and energy consumption due to
overhearing. The total energy cost of transmitting one
successful bit over a path is called Energy Per Bit (EPB) and
is given by
EPB ¼ Etx þ Erx þ Eoverhear; ð8Þ
where Etx (Erx) is the total energy per bit consumed by all
path nodes for transmitting (receiving), Eoverhear is the total
energy per bit consumed by all path and neighbor nodes
while overhearing, i.e., receiving packets intended for other
nodes. Path nodes are the source and destination nodes plus
any relay nodes in between. Neighboring nodes are the
nodes inside the union of transmission areas of all path
nodes, excluding the path nodes. The path nodes consume
energy while transmitting/receiving and overhearing; and
the neighbor nodes consume energy while overhearing.
EPB is calculated such that energy spent for transmit and
receive is taken into account while energy spent during idle
AYDOGDU AND KARASAN: AN ANALYSIS OF IEEE 802.11 DCF AND ITS APPLICATION TO ENERGY-EFFICIENT RELAYING IN MULTIHOP... 1367
Fig. 4. Illustration of calculation of p.
mode is excluded. For the computation of the idle energythe reader is referred to [26].
We assume that the PHY layer may be in transmit,receive, or idle mode (neglecting sleep mode) and denotethe power consumed by Pwrtx, Pwrrx, and Pwridle,respectively. EPB is calculated by considering the energyconsumed by a DATA packet and any related controlpackets, collisions, retransmissions, and packet drops dueto that specific DATA packet. For a single successful DATApacket to be received by the destination, a total of Nsucc
successful transmissions and Ndrop packet drops take placeon the average, over an h-hop path. Nsucc and Ndrop areobtained by averaging the total number of successful/failedtransmissions over all h-hop paths � consisting of nodesfx0; x1; . . . ; xhg, where the averaging function over all pathsis denoted by avg� :
Nsucc ¼ avg�Xh�1
i¼0
ðð1� pMÞiYij¼1
ð1� Pifqðxh�jÞÞÞ�1
( );
Ndrop ¼ NsuccpM
ð1� pMÞ :
Let us denote the duration where transmit or receiveenergy is spent over a link for one successful transmissionby Tsucc and for a dropped packet by Tdrop:
Tsucc ¼ �nMTRTS þ TCTS þ TDATA þ TACK;Tdrop ¼MTRTS:
�nM is the average number of dropped packets due toexceeding M and is calculated as follows:
�nM ¼XM�1
i¼0
ipið1� pÞ þMpM:
Tbusy denotes the total time duration where transmit orreceive energy is spent over an h-hop path
Tbusy ¼ NsuccTsucc þNdropTdrop:
Etx and Erx are given by
Etx ¼1
bDATAðPwrtx � PwridleÞTbusy;
Erx ¼1
bDATAðPwrrx � PwridleÞTbusy:
A specific transmission flowing through an h-hop pathconsumes no additional energy at an overhearing node ifthe NAV of the overhearing node is already set. Recallingthat Pidle is a conditional probability conditioned on theevent that the node is carrier sensing with zero NAV, andnoting that the probability that a node is carrier sensingwith zero NAV is 1� � , the unconditional probability thatNAV of a node is not set becomes ð1� �ÞPidle. Since thenumber of overhearing nodes is n� 2, excluding thetransmitter and receiver, we obtain
Eoverhear ¼ðn� 2Þð1� �ÞPidleðPwrrx � PwridleÞTbusy
bDATA:
Our extensive numerical studies show that the accuracyof the analytical model in predicting EPB degrades as the
topology and traffic pattern become more irregular due tothe averaging of p. However, the general characteristics ofthe EPB curves and the implications regarding relaying arenot affected.
5 NUMERICAL RESULTS
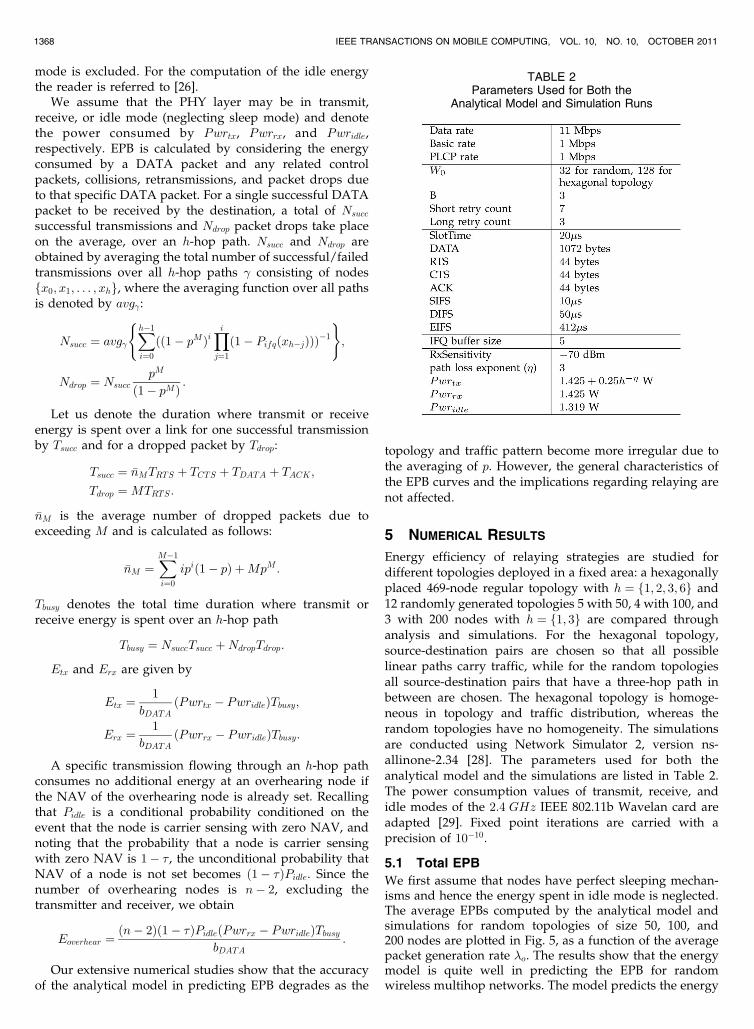
Energy efficiency of relaying strategies are studied fordifferent topologies deployed in a fixed area: a hexagonallyplaced 469-node regular topology with h ¼ f1; 2; 3; 6g and12 randomly generated topologies 5 with 50, 4 with 100, and3 with 200 nodes with h ¼ f1; 3g are compared throughanalysis and simulations. For the hexagonal topology,source-destination pairs are chosen so that all possiblelinear paths carry traffic, while for the random topologiesall source-destination pairs that have a three-hop path inbetween are chosen. The hexagonal topology is homoge-neous in topology and traffic distribution, whereas therandom topologies have no homogeneity. The simulationsare conducted using Network Simulator 2, version ns-allinone-2.34 [28]. The parameters used for both theanalytical model and the simulations are listed in Table 2.The power consumption values of transmit, receive, andidle modes of the 2:4 GHz IEEE 802.11b Wavelan card areadapted [29]. Fixed point iterations are carried with aprecision of 10�10.
5.1 Total EPB
We first assume that nodes have perfect sleeping mechan-isms and hence the energy spent in idle mode is neglected.The average EPBs computed by the analytical model andsimulations for random topologies of size 50, 100, and200 nodes are plotted in Fig. 5, as a function of the averagepacket generation rate �o. The results show that the energymodel is quite well in predicting the EPB for randomwireless multihop networks. The model predicts the energy
1368 IEEE TRANSACTIONS ON MOBILE COMPUTING, VOL. 10, NO. 10, OCTOBER 2011
TABLE 2Parameters Used for Both the
Analytical Model and Simulation Runs
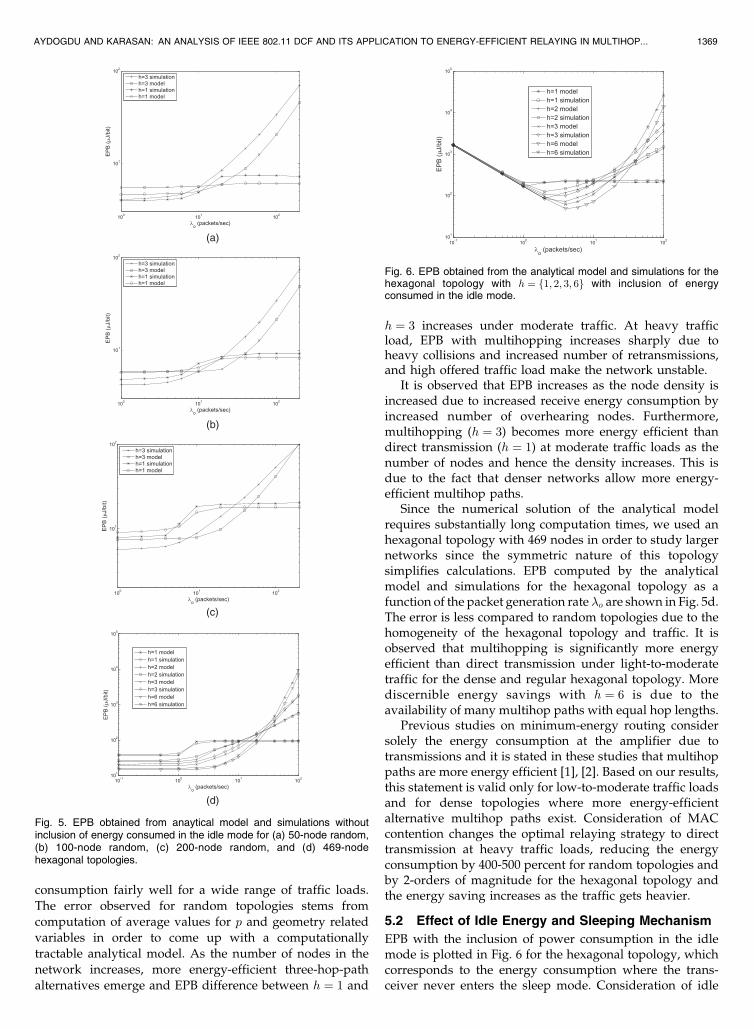
consumption fairly well for a wide range of traffic loads.
The error observed for random topologies stems from
computation of average values for p and geometry related
variables in order to come up with a computationally
tractable analytical model. As the number of nodes in the
network increases, more energy-efficient three-hop-path
alternatives emerge and EPB difference between h ¼ 1 and
h ¼ 3 increases under moderate traffic. At heavy trafficload, EPB with multihopping increases sharply due toheavy collisions and increased number of retransmissions,and high offered traffic load make the network unstable.
It is observed that EPB increases as the node density isincreased due to increased receive energy consumption byincreased number of overhearing nodes. Furthermore,multihopping (h ¼ 3) becomes more energy efficient thandirect transmission (h ¼ 1) at moderate traffic loads as thenumber of nodes and hence the density increases. This isdue to the fact that denser networks allow more energy-efficient multihop paths.
Since the numerical solution of the analytical modelrequires substantially long computation times, we used anhexagonal topology with 469 nodes in order to study largernetworks since the symmetric nature of this topologysimplifies calculations. EPB computed by the analyticalmodel and simulations for the hexagonal topology as afunction of the packet generation rate �o are shown in Fig. 5d.The error is less compared to random topologies due to thehomogeneity of the hexagonal topology and traffic. It isobserved that multihopping is significantly more energyefficient than direct transmission under light-to-moderatetraffic for the dense and regular hexagonal topology. Morediscernible energy savings with h ¼ 6 is due to theavailability of many multihop paths with equal hop lengths.
Previous studies on minimum-energy routing considersolely the energy consumption at the amplifier due totransmissions and it is stated in these studies that multihoppaths are more energy efficient [1], [2]. Based on our results,this statement is valid only for low-to-moderate traffic loadsand for dense topologies where more energy-efficientalternative multihop paths exist. Consideration of MACcontention changes the optimal relaying strategy to directtransmission at heavy traffic loads, reducing the energyconsumption by 400-500 percent for random topologies andby 2-orders of magnitude for the hexagonal topology andthe energy saving increases as the traffic gets heavier.
5.2 Effect of Idle Energy and Sleeping Mechanism
EPB with the inclusion of power consumption in the idlemode is plotted in Fig. 6 for the hexagonal topology, whichcorresponds to the energy consumption where the trans-ceiver never enters the sleep mode. Consideration of idle
AYDOGDU AND KARASAN: AN ANALYSIS OF IEEE 802.11 DCF AND ITS APPLICATION TO ENERGY-EFFICIENT RELAYING IN MULTIHOP... 1369
Fig. 5. EPB obtained from anaytical model and simulations withoutinclusion of energy consumed in the idle mode for (a) 50-node random,(b) 100-node random, (c) 200-node random, and (d) 469-nodehexagonal topologies.
Fig. 6. EPB obtained from the analytical model and simulations for thehexagonal topology with h ¼ f1; 2; 3; 6g with inclusion of energyconsumed in the idle mode.
energy makes any relaying strategy equivalently energyefficient for light traffic loads. For moderate and heavytraffic loads, EPB exhibits a similar behavior as the case ofperfect sleep management shown in Fig. 5d.
5.3 Components of EPB
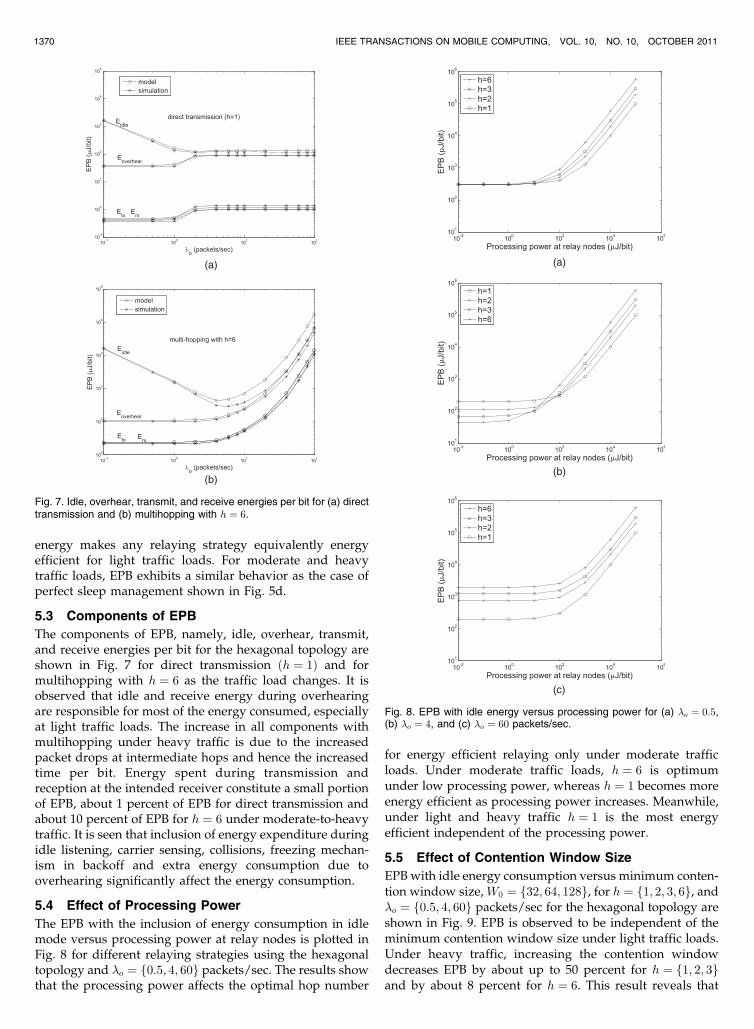
The components of EPB, namely, idle, overhear, transmit,and receive energies per bit for the hexagonal topology areshown in Fig. 7 for direct transmission ðh ¼ 1Þ and formultihopping with h ¼ 6 as the traffic load changes. It isobserved that idle and receive energy during overhearingare responsible for most of the energy consumed, especiallyat light traffic loads. The increase in all components withmultihopping under heavy traffic is due to the increasedpacket drops at intermediate hops and hence the increasedtime per bit. Energy spent during transmission andreception at the intended receiver constitute a small portionof EPB, about 1 percent of EPB for direct transmission andabout 10 percent of EPB for h ¼ 6 under moderate-to-heavytraffic. It is seen that inclusion of energy expenditure duringidle listening, carrier sensing, collisions, freezing mechan-ism in backoff and extra energy consumption due tooverhearing significantly affect the energy consumption.
5.4 Effect of Processing Power
The EPB with the inclusion of energy consumption in idlemode versus processing power at relay nodes is plotted inFig. 8 for different relaying strategies using the hexagonaltopology and �o ¼ f0:5; 4; 60g packets/sec. The results showthat the processing power affects the optimal hop number
for energy efficient relaying only under moderate trafficloads. Under moderate traffic loads, h ¼ 6 is optimumunder low processing power, whereas h ¼ 1 becomes moreenergy efficient as processing power increases. Meanwhile,under light and heavy traffic h ¼ 1 is the most energyefficient independent of the processing power.
5.5 Effect of Contention Window Size
EPB with idle energy consumption versus minimum conten-tion window size, W0 ¼ f32; 64; 128g, for h ¼ f1; 2; 3; 6g, and�o ¼ f0:5; 4; 60g packets/sec for the hexagonal topology areshown in Fig. 9. EPB is observed to be independent of theminimum contention window size under light traffic loads.Under heavy traffic, increasing the contention windowdecreases EPB by about up to 50 percent for h ¼ f1; 2; 3gand by about 8 percent for h ¼ 6. This result reveals that
1370 IEEE TRANSACTIONS ON MOBILE COMPUTING, VOL. 10, NO. 10, OCTOBER 2011
Fig. 7. Idle, overhear, transmit, and receive energies per bit for (a) directtransmission and (b) multihopping with h ¼ 6.
Fig. 8. EPB with idle energy versus processing power for (a) �o ¼ 0:5,(b) �o ¼ 4, and (c) �o ¼ 60 packets/sec.
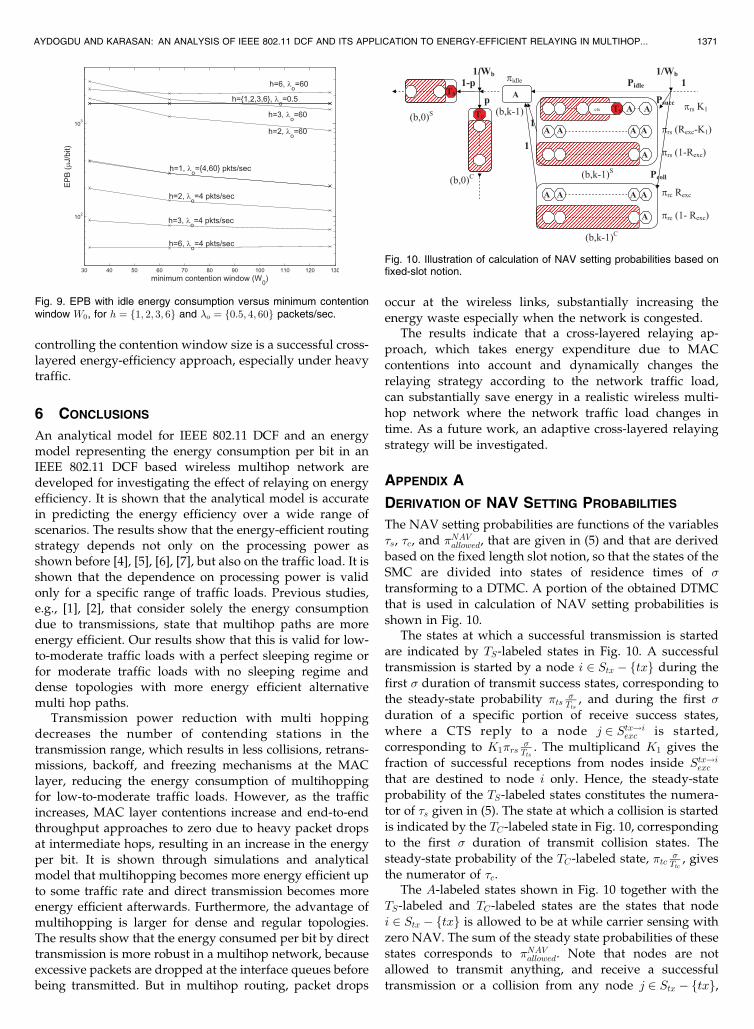
controlling the contention window size is a successful cross-layered energy-efficiency approach, especially under heavytraffic.
6 CONCLUSIONS
An analytical model for IEEE 802.11 DCF and an energymodel representing the energy consumption per bit in anIEEE 802.11 DCF based wireless multihop network aredeveloped for investigating the effect of relaying on energyefficiency. It is shown that the analytical model is accuratein predicting the energy efficiency over a wide range ofscenarios. The results show that the energy-efficient routingstrategy depends not only on the processing power asshown before [4], [5], [6], [7], but also on the traffic load. It isshown that the dependence on processing power is validonly for a specific range of traffic loads. Previous studies,e.g., [1], [2], that consider solely the energy consumptiondue to transmissions, state that multihop paths are moreenergy efficient. Our results show that this is valid for low-to-moderate traffic loads with a perfect sleeping regime orfor moderate traffic loads with no sleeping regime anddense topologies with more energy efficient alternativemulti hop paths.
Transmission power reduction with multi hoppingdecreases the number of contending stations in thetransmission range, which results in less collisions, retrans-missions, backoff, and freezing mechanisms at the MAClayer, reducing the energy consumption of multihoppingfor low-to-moderate traffic loads. However, as the trafficincreases, MAC layer contentions increase and end-to-endthroughput approaches to zero due to heavy packet dropsat intermediate hops, resulting in an increase in the energyper bit. It is shown through simulations and analyticalmodel that multihopping becomes more energy efficient upto some traffic rate and direct transmission becomes moreenergy efficient afterwards. Furthermore, the advantage ofmultihopping is larger for dense and regular topologies.The results show that the energy consumed per bit by directtransmission is more robust in a multihop network, becauseexcessive packets are dropped at the interface queues beforebeing transmitted. But in multihop routing, packet drops
occur at the wireless links, substantially increasing the
energy waste especially when the network is congested.The results indicate that a cross-layered relaying ap-
proach, which takes energy expenditure due to MAC
contentions into account and dynamically changes the
relaying strategy according to the network traffic load,
can substantially save energy in a realistic wireless multi-
hop network where the network traffic load changes in
time. As a future work, an adaptive cross-layered relaying
strategy will be investigated.
APPENDIX A
DERIVATION OF NAV SETTING PROBABILITIES
The NAV setting probabilities are functions of the variables
�s, �c, and �NAVallowed, that are given in (5) and that are derived
based on the fixed length slot notion, so that the states of the
SMC are divided into states of residence times of �
transforming to a DTMC. A portion of the obtained DTMC
that is used in calculation of NAV setting probabilities is
shown in Fig. 10.The states at which a successful transmission is started
are indicated by TS-labeled states in Fig. 10. A successful
transmission is started by a node i 2 Stx � ftxg during the
first � duration of transmit success states, corresponding to
the steady-state probability �ts�Tts
, and during the first �
duration of a specific portion of receive success states,
where a CTS reply to a node j 2 Stx!iexc is started,
corresponding to K1�rs�Tts
. The multiplicand K1 gives the
fraction of successful receptions from nodes inside Stx!iexc
that are destined to node i only. Hence, the steady-state
probability of the TS-labeled states constitutes the numera-
tor of �s given in (5). The state at which a collision is started
is indicated by the TC-labeled state in Fig. 10, corresponding
to the first � duration of transmit collision states. The
steady-state probability of the TC-labeled state, �tc�Ttc
, gives
the numerator of �c.The A-labeled states shown in Fig. 10 together with the
TS-labeled and TC-labeled states are the states that node
i 2 Stx � ftxg is allowed to be at while carrier sensing with
zero NAV. The sum of the steady state probabilities of these
states corresponds to �NAVallowed. Note that nodes are not
allowed to transmit anything, and receive a successful
transmission or a collision from any node j 2 Stx � ftxg,
AYDOGDU AND KARASAN: AN ANALYSIS OF IEEE 802.11 DCF AND ITS APPLICATION TO ENERGY-EFFICIENT RELAYING IN MULTIHOP... 1371
Fig. 9. EPB with idle energy consumption versus minimum contentionwindow W0, for h ¼ f1; 2; 3; 6g and �o ¼ f0:5; 4; 60g packets/sec.
Fig. 10. Illustration of calculation of NAV setting probabilities based onfixed-slot notion.
excluding the first � duration of receive success and receivecollision states.
APPENDIX B
DERIVATION OF p
The probability of collision given that a transmissionoccurs from tx! rx, is a function of �A0
, �A1, �B, and �C ,
as given in (6). These variables are also derived based onthe fixed length slot notion, so that the states of the SMCare divided into states of residence times of � transformingto a DTMC. A portion of the obtained DTMC that is usedto illustrate the calculation of �A0
, �A1, �B, and �C is shown
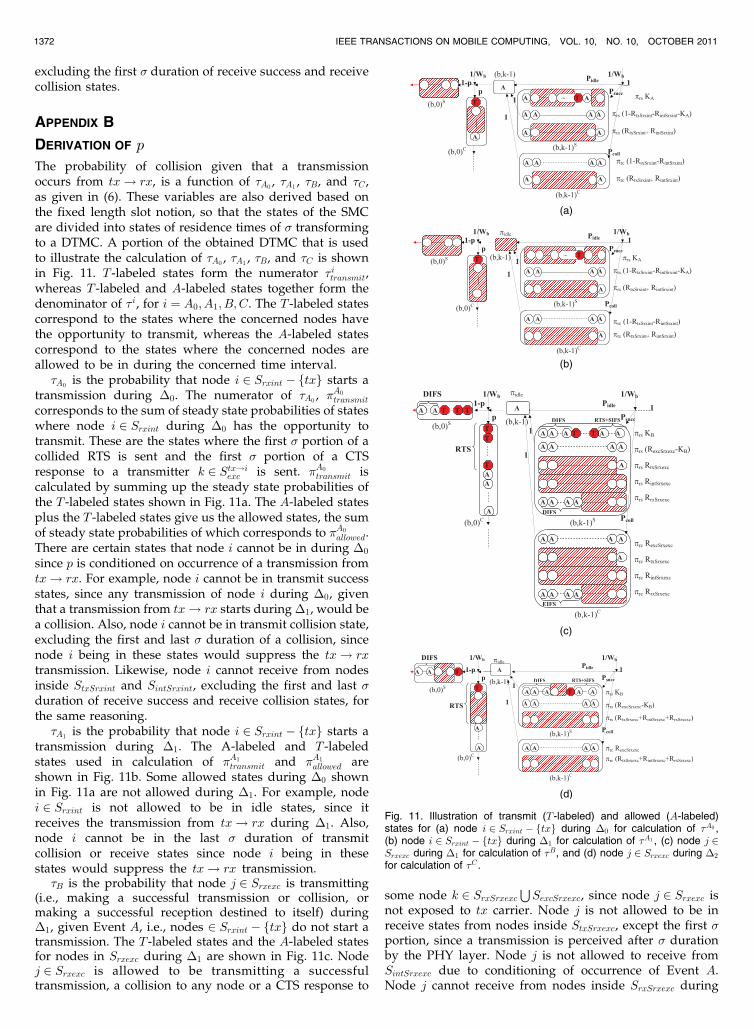
in Fig. 11. T -labeled states form the numerator �itransmit,whereas T -labeled and A-labeled states together form thedenominator of �i, for i ¼ A0; A1; B; C. The T -labeled statescorrespond to the states where the concerned nodes havethe opportunity to transmit, whereas the A-labeled statescorrespond to the states where the concerned nodes areallowed to be in during the concerned time interval.�A0
is the probability that node i 2 Srxint � ftxg starts atransmission during �0. The numerator of �A0
, �A0transmit
corresponds to the sum of steady state probabilities of stateswhere node i 2 Srxint during �0 has the opportunity totransmit. These are the states where the first � portion of acollided RTS is sent and the first � portion of a CTSresponse to a transmitter k 2 Stx!iexc is sent. �A0
transmit iscalculated by summing up the steady state probabilities ofthe T -labeled states shown in Fig. 11a. The A-labeled statesplus the T -labeled states give us the allowed states, the sumof steady state probabilities of which corresponds to �A0
allowed.There are certain states that node i cannot be in during �0
since p is conditioned on occurrence of a transmission fromtx! rx. For example, node i cannot be in transmit successstates, since any transmission of node i during �0, giventhat a transmission from tx! rx starts during �1, would bea collision. Also, node i cannot be in transmit collision state,excluding the first and last � duration of a collision, sincenode i being in these states would suppress the tx! rxtransmission. Likewise, node i cannot receive from nodesinside StxSrxint and SintSrxint, excluding the first and last �duration of receive success and receive collision states, forthe same reasoning.�A1
is the probability that node i 2 Srxint � ftxg starts atransmission during �1. The A-labeled and T -labeledstates used in calculation of �A1
transmit and �A1
allowed areshown in Fig. 11b. Some allowed states during �0 shownin Fig. 11a are not allowed during �1. For example, nodei 2 Srxint is not allowed to be in idle states, since itreceives the transmission from tx! rx during �1. Also,node i cannot be in the last � duration of transmitcollision or receive states since node i being in thesestates would suppress the tx! rx transmission.�B is the probability that node j 2 Srxexc is transmitting
(i.e., making a successful transmission or collision, ormaking a successful reception destined to itself) during�1, given Event A, i.e., nodes 2 Srxint � ftxg do not start atransmission. The T -labeled states and the A-labeled statesfor nodes in Srxexc during �1 are shown in Fig. 11c. Nodej 2 Srxexc is allowed to be transmitting a successfultransmission, a collision to any node or a CTS response to
some node k 2 SrxSrxexcSSexcSrxexc, since node j 2 Srxexc is
not exposed to tx carrier. Node j is not allowed to be inreceive states from nodes inside StxSrxexc, except the first �portion, since a transmission is perceived after � durationby the PHY layer. Node j is not allowed to receive fromSintSrxexc due to conditioning of occurrence of Event A.Node j cannot receive from nodes inside SrxSrxexc during
1372 IEEE TRANSACTIONS ON MOBILE COMPUTING, VOL. 10, NO. 10, OCTOBER 2011
Fig. 11. Illustration of transmit (T -labeled) and allowed (A-labeled)states for (a) node i 2 Srxint � ftxg during �0 for calculation of �A0 ,(b) node i 2 Srxint � ftxg during �1 for calculation of �A1 , (c) node j 2Srxexc during �1 for calculation of �B, and (d) node j 2 Srxexc during �2
for calculation of �C .

the busy periods of received transmissions, i.e., Trs �DIFSand Trc � EIFS, since this implies that some node insideSrxexc is transmitting where this probability is alreadycaptured by taking the power Nrxexc of 1� �B.�C is the probability that node j 2 Srxexc starts a transmis-
sion, given that Events A and B occur. The T -labeled states
and the A-labeled states for nodes in Srxexc during �2 are
shown in Fig. 11d. Node j 2 Srxexc cannot be transmitting a
successful transmission, a collision or a CTS response to
some node k 2 SexcSrxexc, except the first � portion, due to
condition on occurrence of Event B. Node j cannot receive
from nodes inside StxSrxexc during �2 since these nodes are
silenced already by the transmission from tx! rx. Node j
cannot receive from nodes inside SintSrxexc due to condition
on the Event A. Node j cannot receive from nodes inside
SrxSrxexc due to condition on the Event B.
REFERENCES
[1] S. Singh, M. Woo, and C.S. Raghavendra, “Power-Aware Routingin Mobile Ad Hoc Networks,” Proc. Fourth Ann. ACM/IEEE Int’lConf. Mobile Computing and Networking, pp. 181-190, Oct. 1998.
[2] K. Scott and N. Bambos, “Routing and Channel Assignment forLow Power Transmission in PCS,” Proc. Fifth IEEE Int’l Conf.Universal Personal Comm. (lCUPC ’96), vol. 2, pp. 498-502, Oct. 1996.
[3] P. Agrawal, “Energy Efficient Protocols for Wireless Systems,”Proc. Ninth IEEE Int’l Symp. Personal, Indoor and Mobile RadioComm. (PIMRC ’98), vol. 2, pp. 564-569, Sept. 1998.
[4] P. Chen, B. O’Dea, and E. Callaway, “Energy Efficient SystemDesign with Optimum Transmission Range for Wireless Ad HocNetworks,” Proc. IEEE Int’l Conf. Comm. (ICC ’02), vol. 2, pp. 945-952, May 2002.
[5] Z. Shelby, C. Pomalaza-Raez, and J. Haapola, “Energy Optimiza-tion in Multihop Wireless Embedded and Sensor Networks,” Proc.15th IEEE Int’l Symp. Personal, Indoor, and Mobile Radio Comm.(PIMRC ’04), Sept. 2004.
[6] E.I. Oyman and C. Ersoy, “Overhead Energy Considerations forEfficient Routing in Wireless Sensor Networks,” Computer Net-works, vol. 46, no. 4, pp. 465-478, Nov. 2004.
[7] W.R. Heinzelman, A. Chandrakasan, and H. Balakrishnan,“Energy-Efficient Communication Protocol for Wireless Micro-sensor Networks,” Proc. 33rd Int’l Conf. System Sciences, pp. 1-10,Jan. 2000.
[8] U.C. Kozat, I. Koutsopoulos, and L. Tassiulas, “A Framework forCross Layer Design of Energy-Efficient Communication with QoSProvisioning in Multi-Hop Wireless Networks,” Proc. 23rd Ann.Joint Conf. IEEE Computer and Comm. Soc., vol. 2, pp. 1446-56, Mar.2004.
[9] X. Li and Z. Bao-yu, “Study on Cross-Layer Design and PowerConservation in Ad Hoc Network,” Proc. Fourth Int’l Conf. Paralleland Distributed Computing, Applications and Technologies, pp. 324-328, Aug. 2003.
[10] A. Safwat, H. Hassanein, and H. Mouftah, “Optimal Cross-LayerDesigns for Energy-Efficient Wireless Ad Hoc and SensorNetworks,” Proc. 22nd IEEE Int’l Performance Computing and Comm.Conf., Apr. 2003.
[11] “Wireless LAN Medium Access Control (MAC) and PhysicalLayer (PHY) Specifications,” Technical Report Std 802.11, R2003,ANSI/IEEE, 1999.
[12] G. Bianchi, “Performance Analysis of IEEE 802.11 DistributedCoordination Function,” IEEE J. Selected Areas in Comm., vol. 18,no. 3, pp. 535-547, Mar. 2000.
[13] I.S. Hwang and C.A. Chen, “Saturation Throughput Analysis inIEEE 802.11 DCF Using Semi-Markov Model,” Int’l Math. J., vol. 1,nos. 5-8, pp. 289-296, 2006.
[14] K. Duffy, D. Malone, and D.J. Leith, “Modeling the 802.11Distributed Coordination Function in Non-Saturated Heteroge-neous Conditions,” IEEE/ACM Trans. Networking, vol. 15, no. 1,pp. 159-172, Feb. 2007.
[15] F. Alizadeh-Shabdiz and S. Subramaniam, “Analytical Models forSingle-Hop and Multi-Hop Ad Hoc Networks,” Mobile Networksand Applications, vol. 11, no. 1, pp. 75-90, Feb. 2006.
[16] Y. Barowski, S. Biaz, and P. Agrawal, “Towards the PerformanceAnalysis of IEEE 802.11 in Multi-Hop Ad-Hoc Networks,” Proc.IEEE Wireless Comm. and Networking Conf., vol. 1, pp. 100-106, Mar.2005.
[17] A. Tsertou and D.I. Laurenson, “Revisiting the Hidden TerminalProblem in a CSMA/CA Wireless Network,” IEEE Trans. MobileComputing, vol. 7, no. 7, pp. 817-831, July 2008.
[18] P.C. Ng and S.C. Liew, “Throughput Analysis of IEEE 802.11Multi-Hop Ad Hoc Networks,” IEEE/ACM Trans. Networking,vol. 15, no. 2, pp. 309-322, Apr. 2007.
[19] J. Chen, K. Sivalingam, and P. Agrawal, “Performance Compar-ison of Battery Power Consumption in Wireless Multiple AccessProtocols,” Wireless Networks, vol. 5, no. 6, pp. 445-460, Nov. 1999.
[20] R. Bruno, M. Conti, and E. Gregori, “Optimization of Efficiencyand Energy Consumption in P-Persistent CSMA-Based WirelessLANs,” IEEE Trans. Mobile Computing, vol. 1, no. 1, pp. 10-31, Jan.2002.
[21] W.K. Kuo, “Energy Efficiency Modeling for IEEE 802.11 DCFSystem without Retry Limits,” Computer Comm., vol. 30, no. 4,pp. 856-862, Feb. 2007.
[22] L. Ning, “A Power-Consumption Analysis for 802.11 DCF,” Proc.Int’l Conf. Wireless Comm., Networking and Mobile Computing(WiCOM ’06), pp. 1-4, Sept. 2006.
[23] M.M. Carvalho, C.B. Margi, K. Obraczka, and J.J. Garcia-Luna-Aceves, “Modeling Energy Consumption in Single-Hop IEEE802.11 Ad Hoc Networks,” Proc. 13th Int’l Conf. Computer Comm.and Networks, pp. 367-372, 2004.
[24] S. Ray and D. Starobinski, “On False Blocking in RTS/CTS-BasedMulti-Hop Wireless Networks,” IEEE Trans. Vehicular Technology,vol. 56, no. 2, pp. 849-862, Mar. 2007.
[25] B.R. Haverkort, Performance of Computer Communication Systems: AModel-Based Approach. Chichester, John Wiley & Sons Ltd., 1998.
[26] C. Aydogdu, “An Analytical Model of IEEE 802.11 DCF for Multi-Hop Wireless Networks and Its Application to Goodput andEnergy Analysis,” PhD thesis, Bilkent Univ., Nov. 2010.
[27] D. Gross and C.M. Harris, Fundamentals of Queueing Theory, WileySeries in Probability and Mathematical Statistics, second ed. JohnWiley & Sons Ltd., 1985.
[28] “The Network Simulator - ns-2,” http://www.isi.edu/nsnam/ns,2011.
[29] AT&T, WaveMODEM 2.4GHz Data Manual, Release 2, 1995.
Canan Aydogdu received two BS degrees bothwith honors from the Electrical and ElectronicsEngineering Department and the Physics De-partment of Bo�gazici University, Istanbul, Turkeyin 2001. She received the MS degree in 2003and the PhD degree in 2010 in electrical andelectronics engineering from Bilkent University,Ankara, Turkey. Her current work focuses onBluetooth, IEEE 802.11, and energy-conservingprotocols in wireless ad hoc and sensor net-
works. She is a student member of the IEEE.
Ezhan Karasan received the BS degree fromthe Middle East Technical University, Ankara,Turkey, the MS degree from Bilkent University,Ankara, Turkey, and the PhD degree fromRutgers University, Piscataway, New Jersey, allin electrical engineering, in 1987, 1990, and1995, respectively. During 1995-1996, he was apostdoctorate researcher at Bell Labs, Holmdel,New Jersey. From 1996 to 1998, he was a seniortechnical staff member at AT&T Labs-Research,
Red Bank, New Jersey. He has been with the Department of Electricaland Electronics Engineering at Bilkent University since 1998. He is amember of the editorial board of Optical Switching and NetworkingJournal. He was the recipient of the 2004 Young Scientist Award fromthe Turkish Scientific and Technical Research Council (TUBITAK), the2005 Young Scientist Award from Mustafa Parlar Foundation, and theCareer Grant from TUBITAK in 2004. He is a member of the IEEE.
. For more information on this or any other computing topic,please visit our Digital Library at www.computer.org/publications/dlib.
AYDOGDU AND KARASAN: AN ANALYSIS OF IEEE 802.11 DCF AND ITS APPLICATION TO ENERGY-EFFICIENT RELAYING IN MULTIHOP... 1373