Embed Size (px)
Citation preview
09/2015 WHITE PAPER
Medidata and other marks used herein are trademarks of Medidata Solutions, Inc. All other trademarks are the property of their respective owners.Copyright © 2015 Medidata Solutions, Inc.
Illuminating Clinical Trials With Actionable Data Analytics
Pat. Pend. | Copyright © 2015 Medidata Solutions, Inc. | Any redistribution or reproduction of part or all of the contents in any form is prohibited without the express written consent of Medidata Solutions, Inc.
209/2015 WHITE PAPER ILLUMINATING CLINICAL TRIALS WITH ACTIONABLE DATA ANALYTICS
Table of Contents
Abstract 3
The Challenge 3
Life Science Industry R&D Spending 4
The Complication 5
Addressing the Complication 5
Measurement 6
Identify Performance Gaps 7
The Example 7
Analysis and Gap Identification 8
Implementing Changes 10
Summary 10
Pat. Pend. | Copyright © 2015 Medidata Solutions, Inc. | Any redistribution or reproduction of part or all of the contents in any form is prohibited without the express written consent of Medidata Solutions, Inc.
309/2015 WHITE PAPER ILLUMINATING CLINICAL TRIALS WITH ACTIONABLE DATA ANALYTICS
Abstract Data science has broad applicability to many industries and disciplines such as mathematics, economics, computer science and life sciences — particularly in the area of clinical research and drug development. This paper explores the particular intersection of science and technology where big data analytics can be leveraged to provide operational insights into the drug development process to produce better outcomes for those companies willing to employ the technique.
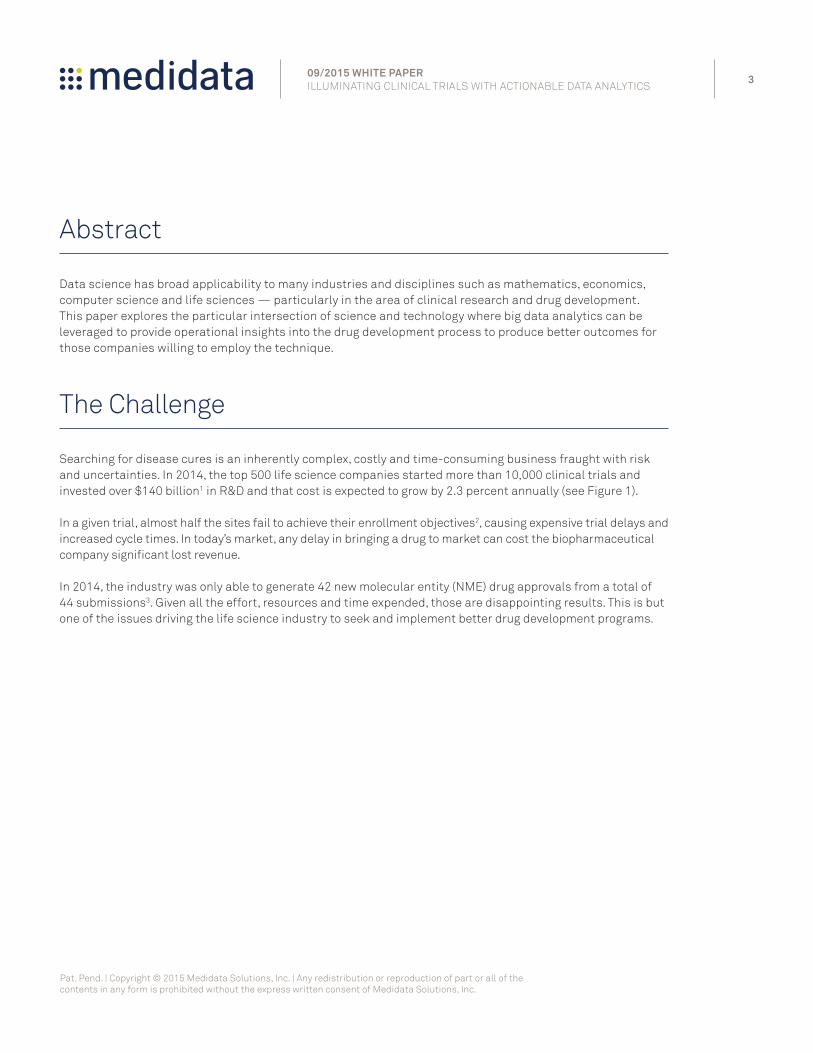
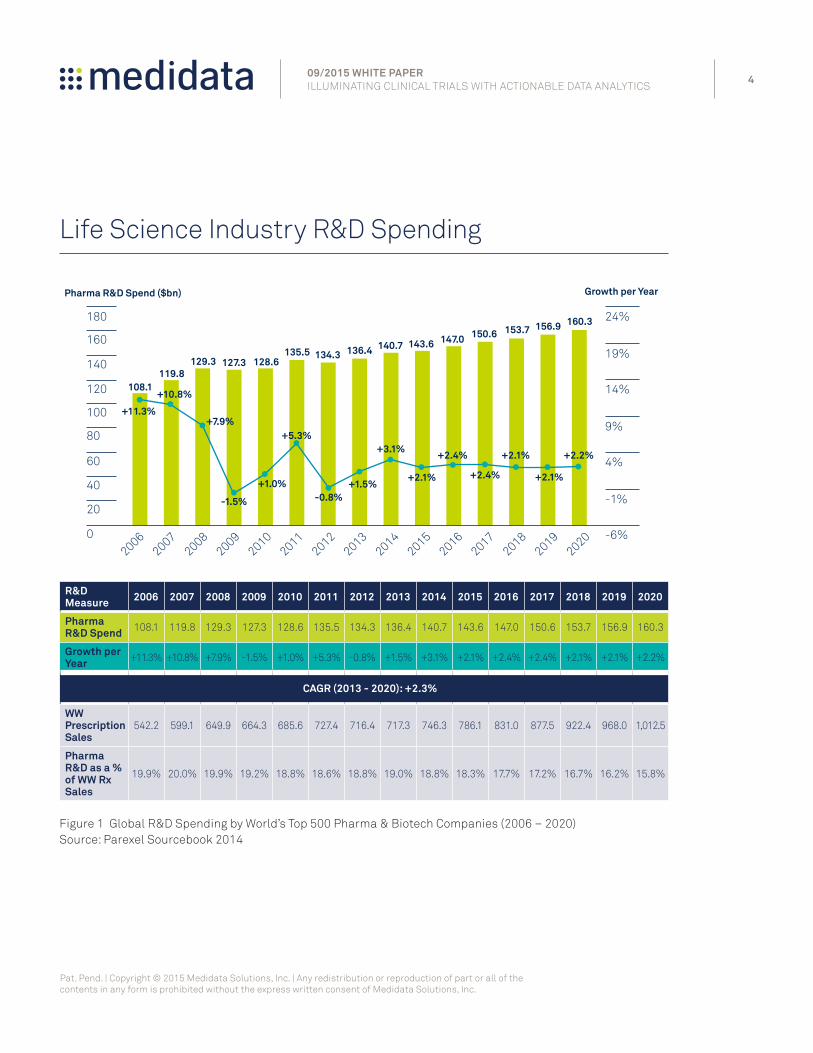
The Challenge Searching for disease cures is an inherently complex, costly and time-consuming business fraught with risk and uncertainties. In 2014, the top 500 life science companies started more than 10,000 clinical trials and invested over $140 billion1 in R&D and that cost is expected to grow by 2.3 percent annually (see Figure 1).
In a given trial, almost half the sites fail to achieve their enrollment objectives2, causing expensive trial delays and increased cycle times. In today’s market, any delay in bringing a drug to market can cost the biopharmaceutical company significant lost revenue.
In 2014, the industry was only able to generate 42 new molecular entity (NME) drug approvals from a total of 44 submissions3. Given all the effort, resources and time expended, those are disappointing results. This is but one of the issues driving the life science industry to seek and implement better drug development programs.
Pat. Pend. | Copyright © 2015 Medidata Solutions, Inc. | Any redistribution or reproduction of part or all of the contents in any form is prohibited without the express written consent of Medidata Solutions, Inc.
409/2015 WHITE PAPER ILLUMINATING CLINICAL TRIALS WITH ACTIONABLE DATA ANALYTICS
Life Science Industry R&D Spending
R&D Measure 2006 2007 2008 2009 2010 2011 2012 2013 2014 2015 2016 2017 2018 2019 2020
Pharma R&D Spend 108.1 119.8 129.3 127.3 128.6 135.5 134.3 136.4 140.7 143.6 147.0 150.6 153.7 156.9 160.3
Growth per Year +11.3% +10.8% +7.9% -1.5% +1.0% +5.3% -0.8% +1.5% +3.1% +2.1% +2.4% +2.4% +2.1% +2.1% +2.2%
CAGR (2013 - 2020): +2.3%
WW Prescription Sales
542.2 599.1 649.9 664.3 685.6 727.4 716.4 717.3 746.3 786.1 831.0 877.5 922.4 968.0 1,012.5
Pharma R&D as a % of WW Rx Sales
19.9% 20.0% 19.9% 19.2% 18.8% 18.6% 18.8% 19.0% 18.8% 18.3% 17.7% 17.2% 16.7% 16.2% 15.8%
Figure 1 Global R&D Spending by World’s Top 500 Pharma & Biotech Companies (2006 – 2020)Source: Parexel Sourcebook 2014
160
180
140
120
100
80
60
40
20
20062007
20082009
20102011
20122013
20142015
20162017
20182019
20200
24%
19%
14%
9%
4%
-1%
-6%
Pharma R&D Spend ($bn) Growth per Year
108.1
+11.3%
+10.8%
+7.9%
-1.5%
+1.0%
+5.3%
+1.5%
+3.1%
+2.1%
+2.4%
+2.4%
+2.1%
+2.1%
+2.2%
-0.8%
119.8129.3 127.3 128.6
135.5 134.3 136.4 140.7 143.6 147.0 150.6 153.7 156.9 160.3
Pat. Pend. | Copyright © 2015 Medidata Solutions, Inc. | Any redistribution or reproduction of part or all of the contents in any form is prohibited without the express written consent of Medidata Solutions, Inc.
509/2015 WHITE PAPER ILLUMINATING CLINICAL TRIALS WITH ACTIONABLE DATA ANALYTICS
The Complication What might be holding the life science industry back from achieving better drug development proficiency?
For starters, the life science industry is conservative in nature and has a tendency to be risk averse and siloed. Many of these companies have not fundamentally changed the template they have used for conducting clinical trials for the past 40 years, making them slow to explore some of the more recent technological advances in big data and data analytics, which can aid in conducting more efficient clinical trials.
The industry is also a highly regulated environment which has the tendency of slowing the pace of change and the embrace of innovation. The regulatory environment is only getting stricter, but, interestingly enough, the additional burden placed on the industry is forcing biopharmaceutical companies to seek innovative paths to making profits.
The large amount of operational data captured in clinical trials typically gets used only once by a particular sponsor. The data is rarely ever leveraged again by the sponsor and certainly not by the industry as a whole. This represents a tremendous amount of wasted potential for the industry because subsequent trials of the same phase, indication or therapeutic area (TA) could benefit from the insights and performance benchmarks that can be distilled from similar trials.
All this data, held confidential and anonymous, can be aggregated over time from tens of thousands of trials without compromising the proprietary integrity of the sponsor organizations from which they come. The operational insights from such data can be of tremendous benefit to anyone thinking of conducting a clinical trial in the future.
Addressing the Complication Medidata provides a broad perspective on clinical trials — with over 80 percent of the top 50 pharmaceutical companies using Medidata’s leading-edge technologies. With access to such a large base of clinical trial information, Medidata offers its clients deep analytic insights.
The use of data analytics to address the challenges companies face in their clinical trial execution is best done in phases.
1. First we establish a baseline of performance for the company by using a set of performance indicator metrics grouped by category.
2. After we have baselined the company’s performance, we analyze that data against industry norms to determine any performance gaps that might exist.
3. Finally, armed with insight into those performance areas that might need work, we can formulate and implement changes to the trial process to improve performance.
Pat. Pend. | Copyright © 2015 Medidata Solutions, Inc. | Any redistribution or reproduction of part or all of the contents in any form is prohibited without the express written consent of Medidata Solutions, Inc.
609/2015 WHITE PAPER ILLUMINATING CLINICAL TRIALS WITH ACTIONABLE DATA ANALYTICS
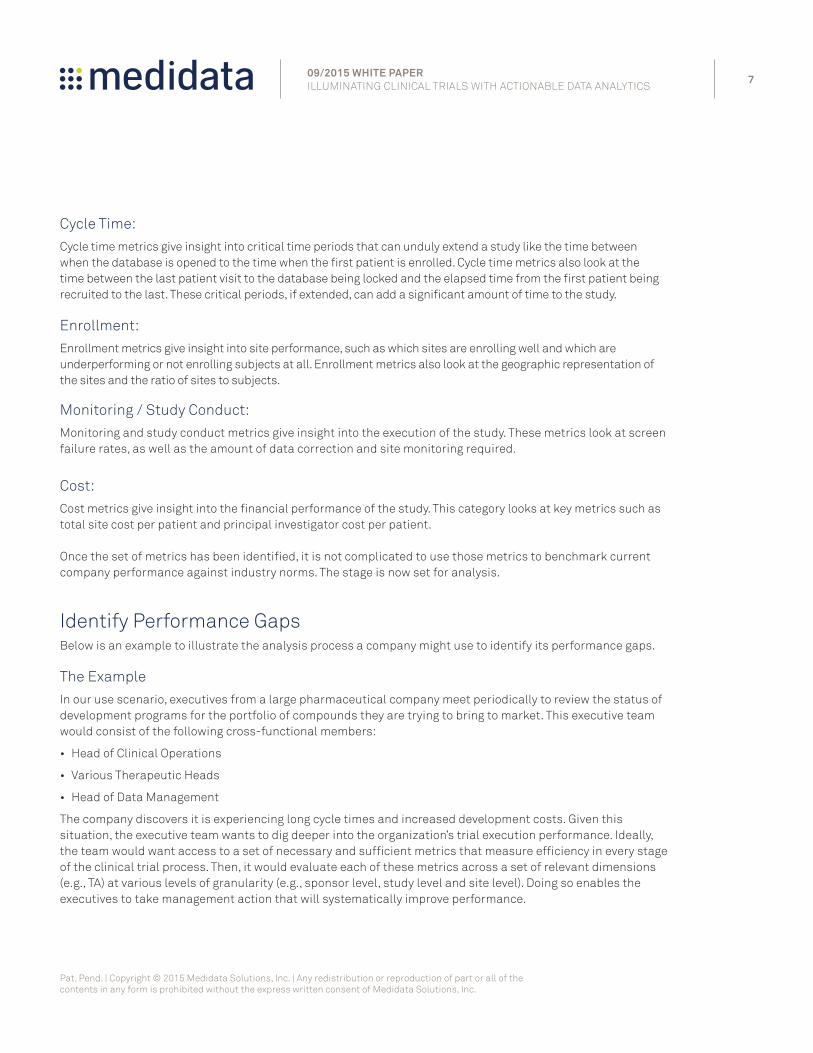
MeasurementTo measure and benchmark effectively, we need to agree on a core set of metrics that we can use. Those metrics should embody the areas of change on which we are focusing. Figure 2 represents a screenshot from the Medidata Operational Performance Analytics tool which contains a set of key industry indicator metrics that can be distilled from clinical trial operational data to help improve trial performance. The larger the data pool — spanning multiple TAs, phases and geographic regions — the more effective the metrics are at providing insight into maximizing trial efficiencies. These metrics can be grouped in many ways depending on the insights that need to be explored. For example, a useful grouping for clinical operations could look at cycle time, enrollment, study conduct monitoring and cost monitoring (see columns in Figure 2).
When metrics are grouped this way, a pharmaceutical executive responsible for bringing one or multiple compounds to market can gain insight into the performance of the drug development program across multiple TAs.
Figure 2
Pat. Pend. | Copyright © 2015 Medidata Solutions, Inc. | Any redistribution or reproduction of part or all of the contents in any form is prohibited without the express written consent of Medidata Solutions, Inc.
709/2015 WHITE PAPER ILLUMINATING CLINICAL TRIALS WITH ACTIONABLE DATA ANALYTICS
Cycle Time:Cycle time metrics give insight into critical time periods that can unduly extend a study like the time between when the database is opened to the time when the first patient is enrolled. Cycle time metrics also look at the time between the last patient visit to the database being locked and the elapsed time from the first patient being recruited to the last. These critical periods, if extended, can add a significant amount of time to the study.
Enrollment:Enrollment metrics give insight into site performance, such as which sites are enrolling well and which are underperforming or not enrolling subjects at all. Enrollment metrics also look at the geographic representation of the sites and the ratio of sites to subjects.
Monitoring / Study Conduct:Monitoring and study conduct metrics give insight into the execution of the study. These metrics look at screen failure rates, as well as the amount of data correction and site monitoring required.
Cost:Cost metrics give insight into the financial performance of the study. This category looks at key metrics such as total site cost per patient and principal investigator cost per patient.
Once the set of metrics has been identified, it is not complicated to use those metrics to benchmark current company performance against industry norms. The stage is now set for analysis.
Identify Performance GapsBelow is an example to illustrate the analysis process a company might use to identify its performance gaps.
The ExampleIn our use scenario, executives from a large pharmaceutical company meet periodically to review the status of development programs for the portfolio of compounds they are trying to bring to market. This executive team would consist of the following cross-functional members:
• Head of Clinical Operations
• Various Therapeutic Heads
• Head of Data Management
The company discovers it is experiencing long cycle times and increased development costs. Given this situation, the executive team wants to dig deeper into the organization’s trial execution performance. Ideally, the team would want access to a set of necessary and sufficient metrics that measure efficiency in every stage of the clinical trial process. Then, it would evaluate each of these metrics across a set of relevant dimensions (e.g., TA) at various levels of granularity (e.g., sponsor level, study level and site level). Doing so enables the executives to take management action that will systematically improve performance.
Pat. Pend. | Copyright © 2015 Medidata Solutions, Inc. | Any redistribution or reproduction of part or all of the contents in any form is prohibited without the express written consent of Medidata Solutions, Inc.
809/2015 WHITE PAPER ILLUMINATING CLINICAL TRIALS WITH ACTIONABLE DATA ANALYTICS
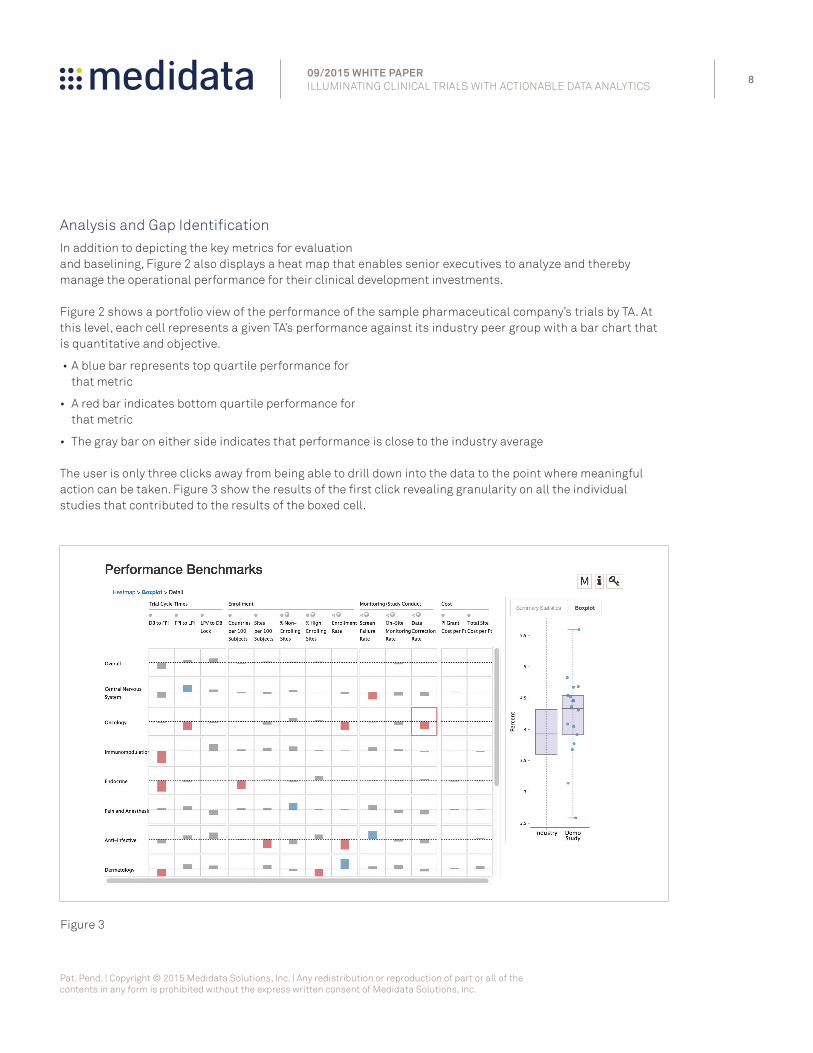
Analysis and Gap IdentificationIn addition to depicting the key metrics for evaluation and baselining, Figure 2 also displays a heat map that enables senior executives to analyze and thereby manage the operational performance for their clinical development investments.
Figure 2 shows a portfolio view of the performance of the sample pharmaceutical company’s trials by TA. At this level, each cell represents a given TA’s performance against its industry peer group with a bar chart that is quantitative and objective.
• A blue bar represents top quartile performance for that metric
• A red bar indicates bottom quartile performance for that metric
• The gray bar on either side indicates that performance is close to the industry average
The user is only three clicks away from being able to drill down into the data to the point where meaningful action can be taken. Figure 3 show the results of the first click revealing granularity on all the individual studies that contributed to the results of the boxed cell.
Pat. Pend. | Copyright © 2015 Medidata Solutions, Inc. | Any redistribution or reproduction of part or all of the contents in any form is prohibited without the express written consent of Medidata Solutions, Inc.
Figure 3
909/2015 WHITE PAPER ILLUMINATING CLINICAL TRIALS WITH ACTIONABLE DATA ANALYTICS
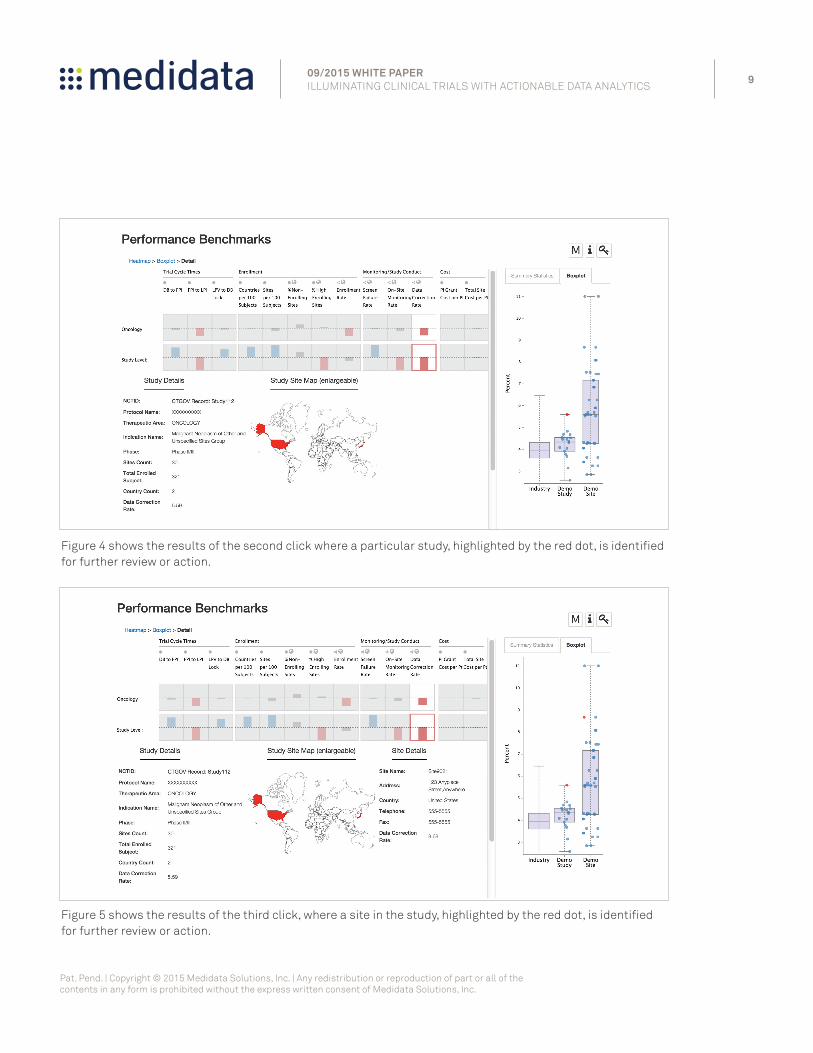
Figure 4 shows the results of the second click where a particular study, highlighted by the red dot, is identified for further review or action.
Figure 5 shows the results of the third click, where a site in the study, highlighted by the red dot, is identified for further review or action.
Pat. Pend. | Copyright © 2015 Medidata Solutions, Inc. | Any redistribution or reproduction of part or all of the contents in any form is prohibited without the express written consent of Medidata Solutions, Inc.
1009/2015 WHITE PAPER ILLUMINATING CLINICAL TRIALS WITH ACTIONABLE DATA ANALYTICS
Implementing ChangesMedidata Operational Performance Analytics draws from the rich information Medidata has aggregated over 10 years of facilitating thousands of clinical trials. This information consists of clinical, operational and cost data from more than 140 sponsors across 17 TAs, 5,000+ studies and over 1.8 million study subjects.
After completing the analysis, the executives will have useful insight into the areas of their business where changes might be needed. For example, if executives notice that their company was underperforming in their patient enrollment metrics, they could easily drill down to identify the studies and sites that have underperformed, contact the appropriate study managers to initiate actions for increased site contact, or perhaps enlist the use of rescue sites. From a strategic perspective, they can identify TAs, countries or study teams that outperform and have the underperforming areas work with the over-performing areas to encourage positive performance and develop corrective action.
Summary The issues of inefficiency facing the life science industry today, especially in the area of drug development, are very real. They can ultimately be mitigated by thoughtfully leveraging technology and big data to provide more insight into trial operations. Pharmaceutical companies that seek to improve their bottom line can take the approach of developing robust benchmark metrics for their programs’ performance to see how they stack up against the rest of the industry. In the areas where they are underperforming, they can think about the changes they will need to make in their process, infrastructure or decision-making that might be causing some of their trials to underperform.
Pat. Pend. | Copyright © 2015 Medidata Solutions, Inc. | Any redistribution or reproduction of part or all of the contents in any form is prohibited without the express written consent of Medidata Solutions, Inc.
Medidata Clinical Cloud™
Cloud-based clinical research solutions | Innovative technology | Data-driven analytics Reduced costs | Improved time to market | Faster decisions | Minimized risk
About MedidataMedidata Solutions is the leading global provider of cloud-based solutions for clinical research in life sciences, transforming clinical development through its advanced applications and intelligent data analytics. The Medidata Clinical Cloud™ brings new levels of productivity and quality to the clinical testing of promising medical treatments, from study design and planning through execution, management and reporting. We are committed to advancing the competitive and scientific goals of global customers, which include over 90% of the top 25 global pharmaceutical companies; innovative biotech, diagnostic and device firms; leading academic medical centers; and contract research organizations.
[email protected] | mdsol.com | +1 866 515 6044
1109/2015 WHITE PAPER ILLUMINATING CLINICAL TRIALS WITH ACTIONABLE DATA ANALYTICS
Endnotes1. Parexel Sourcebook 2014
2. Tufts Center for the Study of Drug Development, Impact Report Vol 15, Number 1 January/February 2013
3. http://www.accessdata.fda.gov/FDATrack/track?program=cder&id=CDER-RRDS-Number-of-NME-and-new-BLAs-submitted-and-approved&fy=2014