Embed Size (px)
Citation preview
IMD2019 – Islington Briefing 1 December 19
IMD2019: ISLINGTON NOW 53RD MOST DEPRIVED IN ENGLAND
David Clifford, Camden and Islington Public Health team ([email protected])
The newly released ‘English Indices of Multiple Deprivation’ (IMD) for 2019 has shown a
considerable fall in Islington’s ranking, continuing from the fall seen in the 2015 IMD ranking.
This brief report looks in detail at what has driven the change in ranking.
Islington has moved from the 24th most deprived local authority in England in 2015 to
53rd most deprived in 2019 (out of 317 local authorities). Islington is now the 6th most
deprived local authority in London (it was 5th in 2015).
This is based on the rank of average score method, one of five variants published.
Three quarters of LSOAs have better rankings than in 2015 for the income and
employment domains, the main components of the Index
The living environments, crime, and health and disability domains have smaller
weights in the Index but most have better rankings than in 2015 (95%, 89%, 84%).
The barriers to housing and services, and education, skills and training domains have
shown smaller relative improvements.
Islington has England’s tenth highest level of income deprivation affecting children,
and fourth highest in England for income deprivation affecting older people.
However, it should be noted that the IMD can only be used to identify deprivation
relative to other areas; not whether an area is more or less deprived than in 2015.
The majority of data used to update the IMD are from between 2014 and 2016, so
any more recent changes in deprivation will not be represented here.
Background to the IMD
The English Indices of Multiple Deprivation (IMD) are an official measure of deprivation in
England. Thirty-nine indicators are used to build a measure of the level of deprivation
experienced by residents in small areas, called LSOAs. These scores are then ranked from
1 (most deprived area) to 32,844 (least deprived area), so that neighbourhoods and local
authorities can be ranked against other areas of the country.
The indicators are grouped across seven domains: income, employment, education, skills
and training, health deprivation and disability, crime, barriers to housing and services, and
living environment. These indicators are measured through a range of data sources,
including the Office for National Statistics, central government departments, and from the
Health and Social Care Information Centre.
The MHCLG’s main report, guidance note, and the background data are available from:
https://www.gov.uk/government/statistics/english-indices-of-deprivation-2019.
What are LSOAs?
A Lower Layer Super Output Area (LSOA) is a small geographic area, used for reporting
small area statistics in England and Wales. Postcodes are grouped together based on
similar socio-demographic characteristics, and contain about 1500 residents on average.
Quintiles and deciles
To allow easier comparisons, areas are grouped in to 10 equal groups, called deciles, to
allow us to look at the most deprived 10%, least deprived 10%, and so on. At local levels,
where there are fewer LSOAs, they can also be grouped in to five equal groups (quintiles), to
allow comparisons between the most deprived 20%, second most deprived 20%, and so on.
IMD2019 – Islington Briefing 2 December 19
The Islington Picture
The 2019 Index has shown a relative improvement in rankings across Islington. The jump
from 24th most deprived borough to 53rd most deprived nationally has come through a
number of LSOAs having significantly improved rankings compared to previous years.
However, again, it should be noted that the Index only measures relative deprivation, so it is
not possible to distinguish whether this is a result of Islington becoming less deprived or
other boroughs becoming more deprived, though it’s most likely to be a mixture of the two.
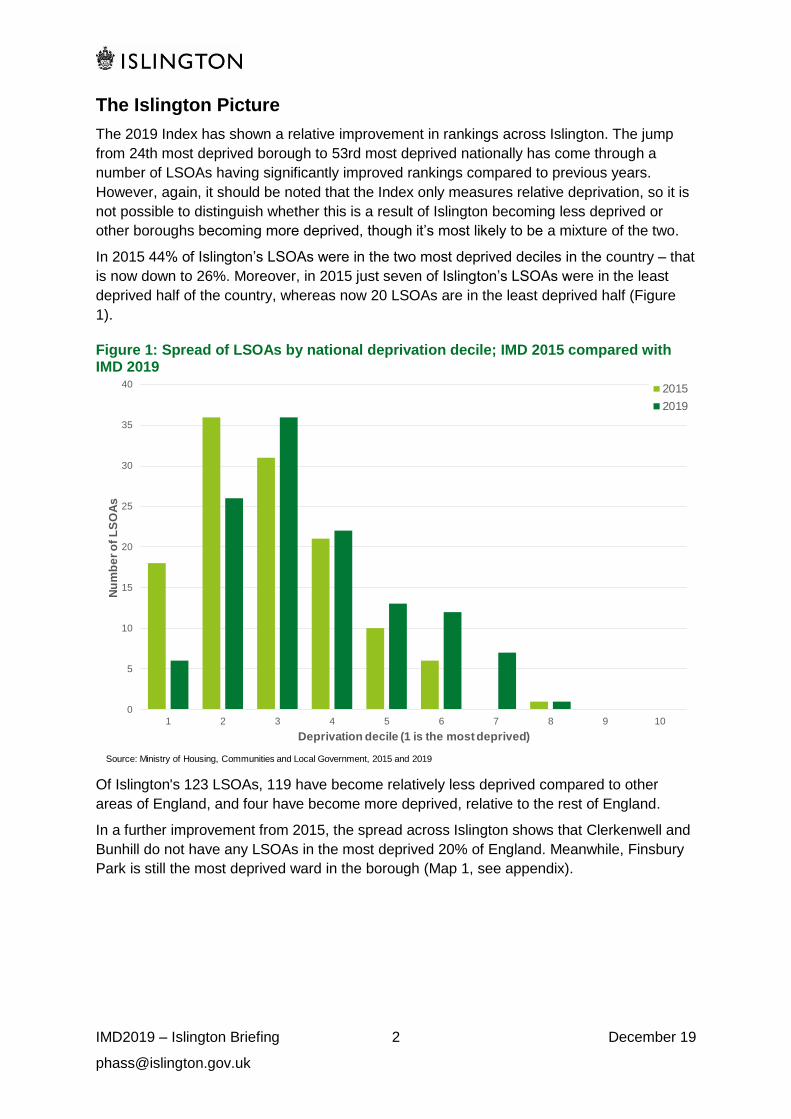
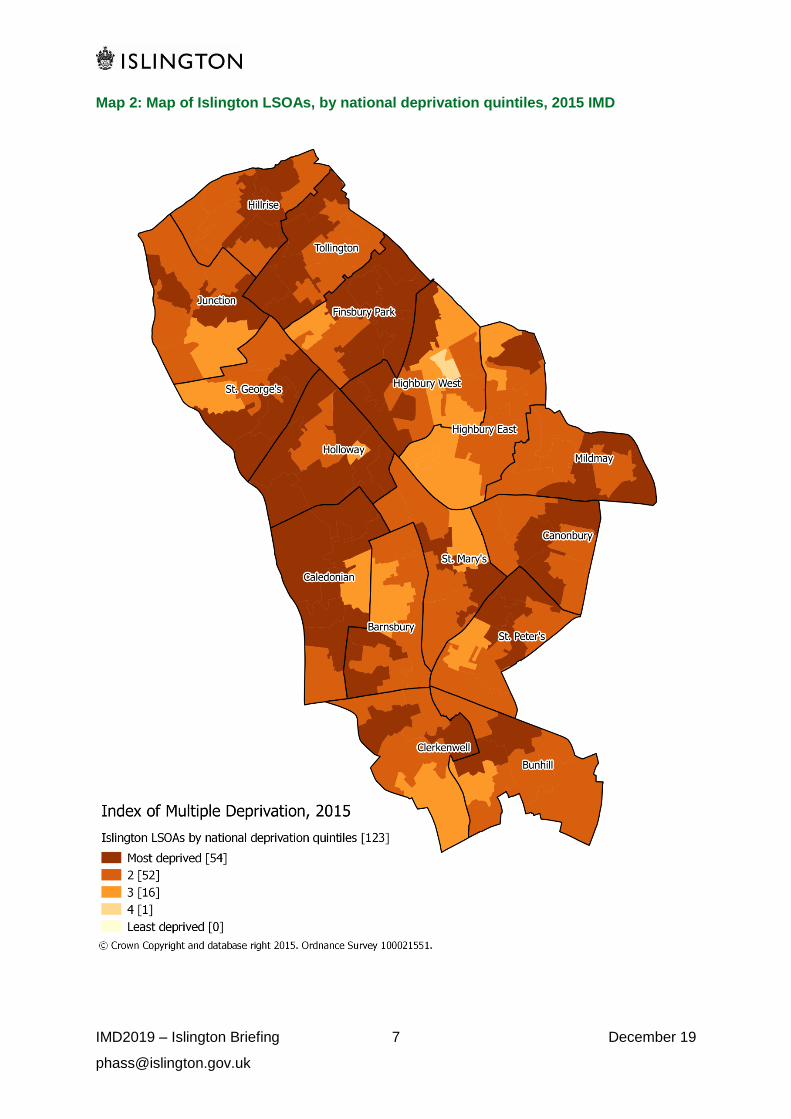
In 2015 44% of Islington’s LSOAs were in the two most deprived deciles in the country – that
is now down to 26%. Moreover, in 2015 just seven of Islington’s LSOAs were in the least
deprived half of the country, whereas now 20 LSOAs are in the least deprived half (Figure
1).
Figure 1: Spread of LSOAs by national deprivation decile; IMD 2015 compared with IMD 2019
Of Islington's 123 LSOAs, 119 have become relatively less deprived compared to other
areas of England, and four have become more deprived, relative to the rest of England.
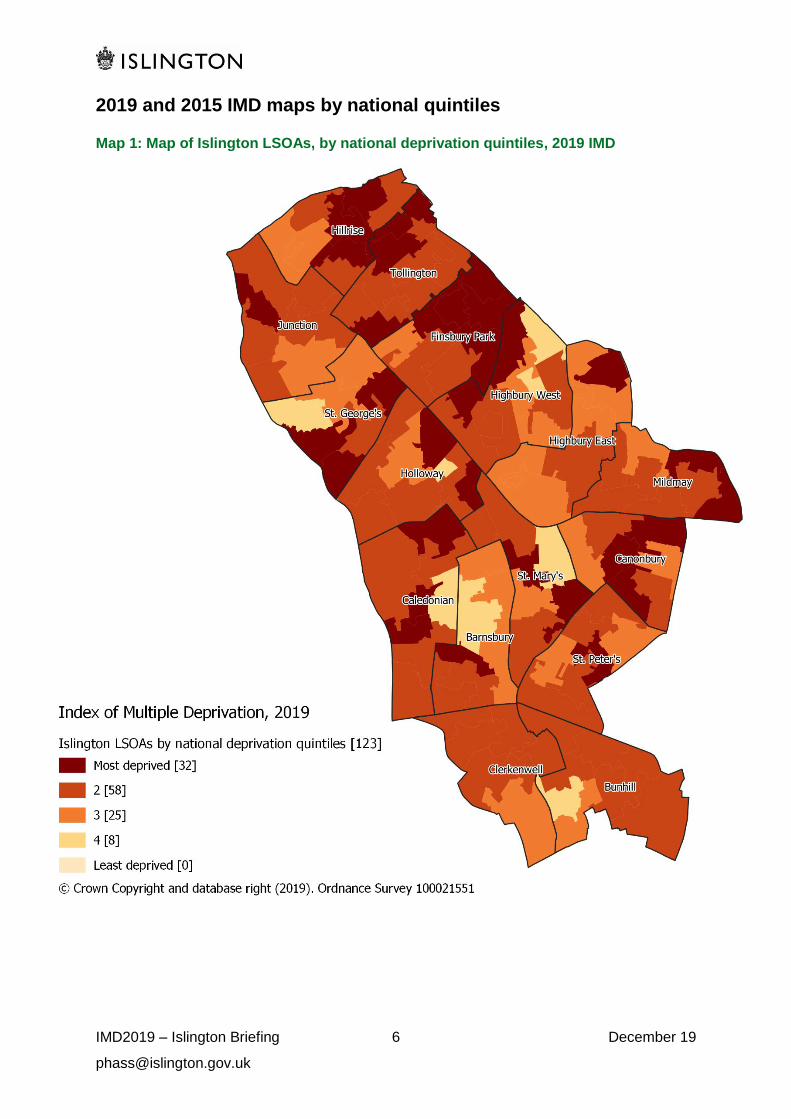
In a further improvement from 2015, the spread across Islington shows that Clerkenwell and
Bunhill do not have any LSOAs in the most deprived 20% of England. Meanwhile, Finsbury
Park is still the most deprived ward in the borough (Map 1, see appendix).
0
5
10
15
20
25
30
35
40
1 2 3 4 5 6 7 8 9 10
Nu
mb
er
of
LS
OA
s
Deprivation decile (1 is the most deprived)
2015
2019
Source: Ministry of Housing, Communities and Local Government, 2015 and 2019
IMD2019 – Islington Briefing 3 December 19
Individual indicator domains
Looking in more detail at the domains of the IMD, Islington has lower rankings across most
of the domains, though there are marked differences in the level of change seen (Table 1).
For the income deprivation and employment deprivation domains, around three quarters of
the borough’s LSOAs have become relatively less deprived than in 2015. These measures
are closely linked, as one looks at people on low incomes and out of work, while the other
looks at those excluded from the labour market involuntarily. These two indicators make up
45% of the overall score, hence it mirroring the overall picture.
The health deprivation and disability domain, which looks at premature death, illness and
disability, emergency hospital admissions, and mental ill health, shows the greatest relative
improvement, with 84% of LSOAs showing an improvement their rankings on 2015. This
domain also showed a large improvement between 2010 and 2015.
The crime domain has also seen a large relative improvement, with 89% of LSOAs ranked
as relatively less deprived than in 2015.
Changes in other domains include:
70% of LSOAs have less relative deprivation in access to education, skills, and
training than in 2015;
63% of LSOAs have less relative deprivation in access to housing and services. This
includes the physical and financial accessibility of housing and local services;
95% of LSOAs have less relative deprivation in terms of their living environment,
which includes the quality of local housing, air quality, and number of road traffic
accidents.
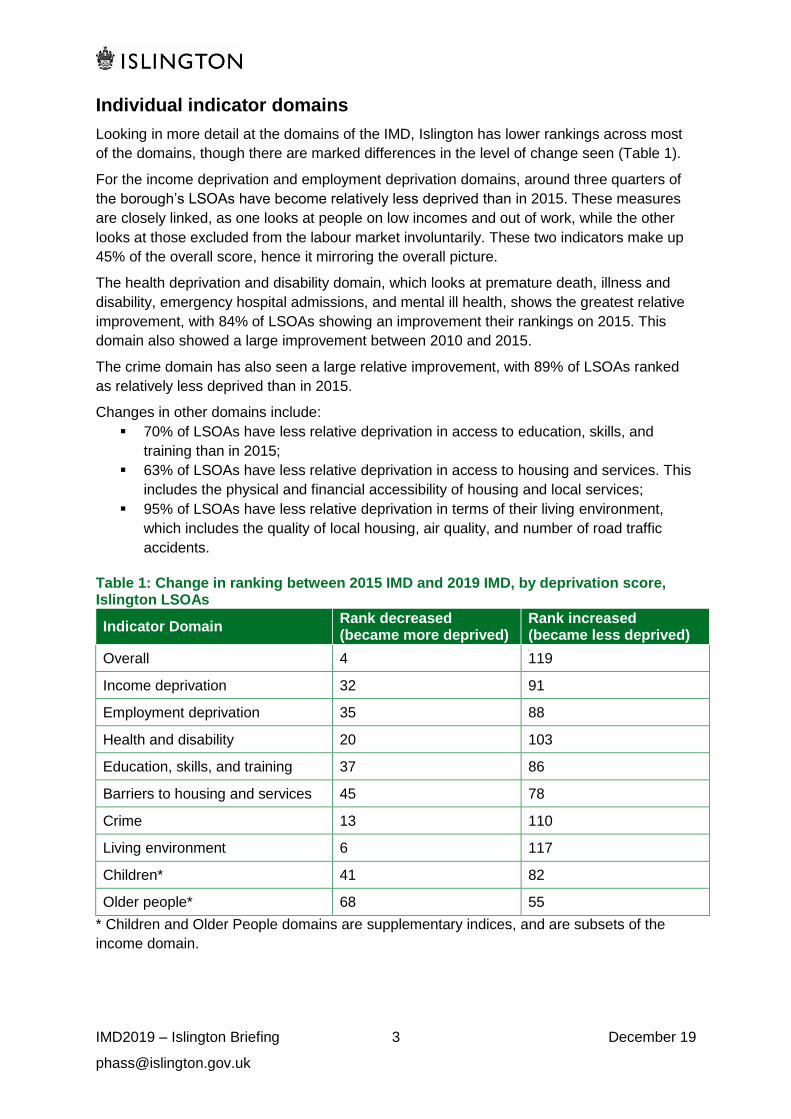
Table 1: Change in ranking between 2015 IMD and 2019 IMD, by deprivation score, Islington LSOAs
Indicator Domain Rank decreased (became more deprived)
Rank increased (became less deprived)
Overall 4 119
Income deprivation 32 91
Employment deprivation 35 88
Health and disability 20 103
Education, skills, and training 37 86
Barriers to housing and services 45 78
Crime 13 110
Living environment 6 117
Children* 41 82
Older people* 68 55
* Children and Older People domains are supplementary indices, and are subsets of the
income domain.
IMD2019 – Islington Briefing 4 December 19
Ward-level analysis
The MHCLG analysis does not include analysis by ward, however average scores for each
Islington ward have been calculated in Table 2. These figures show that Finsbury Park has
the highest level of deprivation in Islington, as in 2015. The ward-level ranking has generally
stayed similar to in 2015, with the exception of Junction, which has become relatively more
deprived than the rest of the borough, and Bunhill, which has become relatively less
deprived.
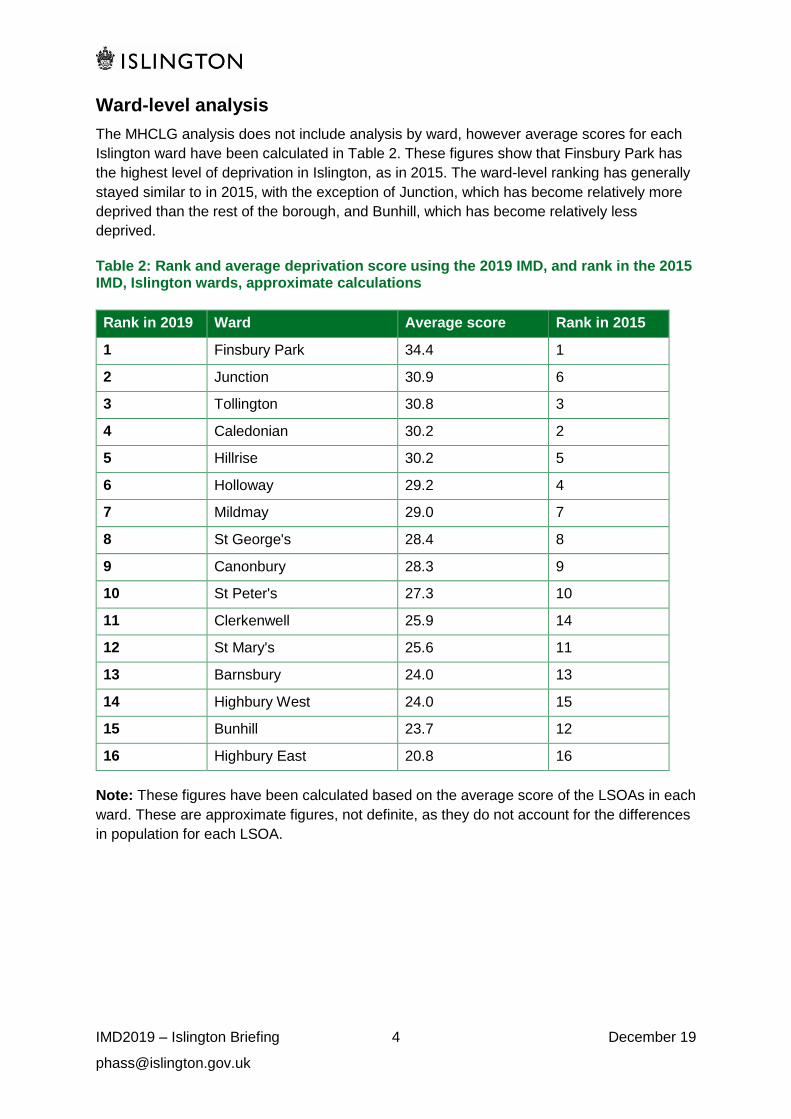
Table 2: Rank and average deprivation score using the 2019 IMD, and rank in the 2015 IMD, Islington wards, approximate calculations
Note: These figures have been calculated based on the average score of the LSOAs in each
ward. These are approximate figures, not definite, as they do not account for the differences
in population for each LSOA.
Rank in 2019 Ward Average score Rank in 2015
1 Finsbury Park 34.4 1
2 Junction 30.9 6
3 Tollington 30.8 3
4 Caledonian 30.2 2
5 Hillrise 30.2 5
6 Holloway 29.2 4
7 Mildmay 29.0 7
8 St George's 28.4 8
9 Canonbury 28.3 9
10 St Peter's 27.3 10
11 Clerkenwell 25.9 14
12 St Mary's 25.6 11
13 Barnsbury 24.0 13
14 Highbury West 24.0 15
15 Bunhill 23.7 12
16 Highbury East 20.8 16
IMD2019 – Islington Briefing 5 December 19
IDACI and IDAOPI
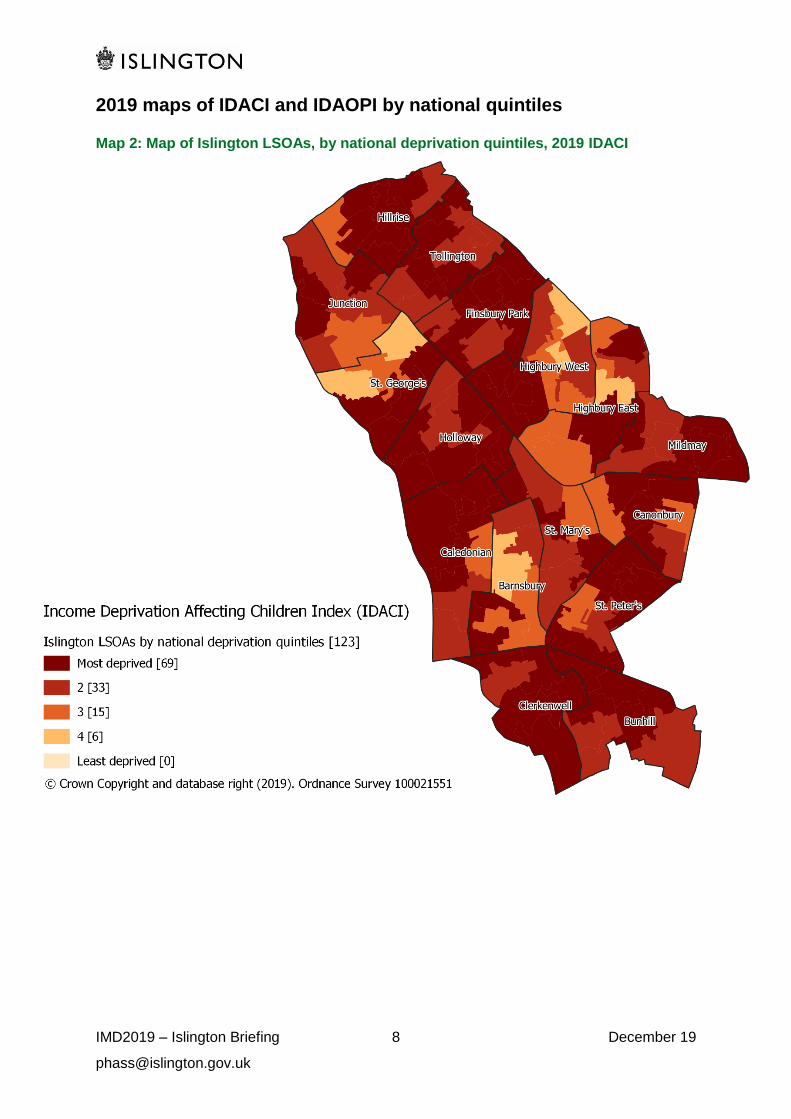
Islington ranks as much more deprived on the indices that focus on children (IDACI) and
older people (IDAOPI). Islington ranks as tenth highest for the proportion of children living in
income deprived households in the country (27%), from third in 2015 in the country –
Islington ranks highest for London, where it was previously the second highest. The 2019
income measures are based on data from 2015, when the benefit changes were coming in.
The change seen may, therefore, be reflecting that a lower proportion of people are eligible
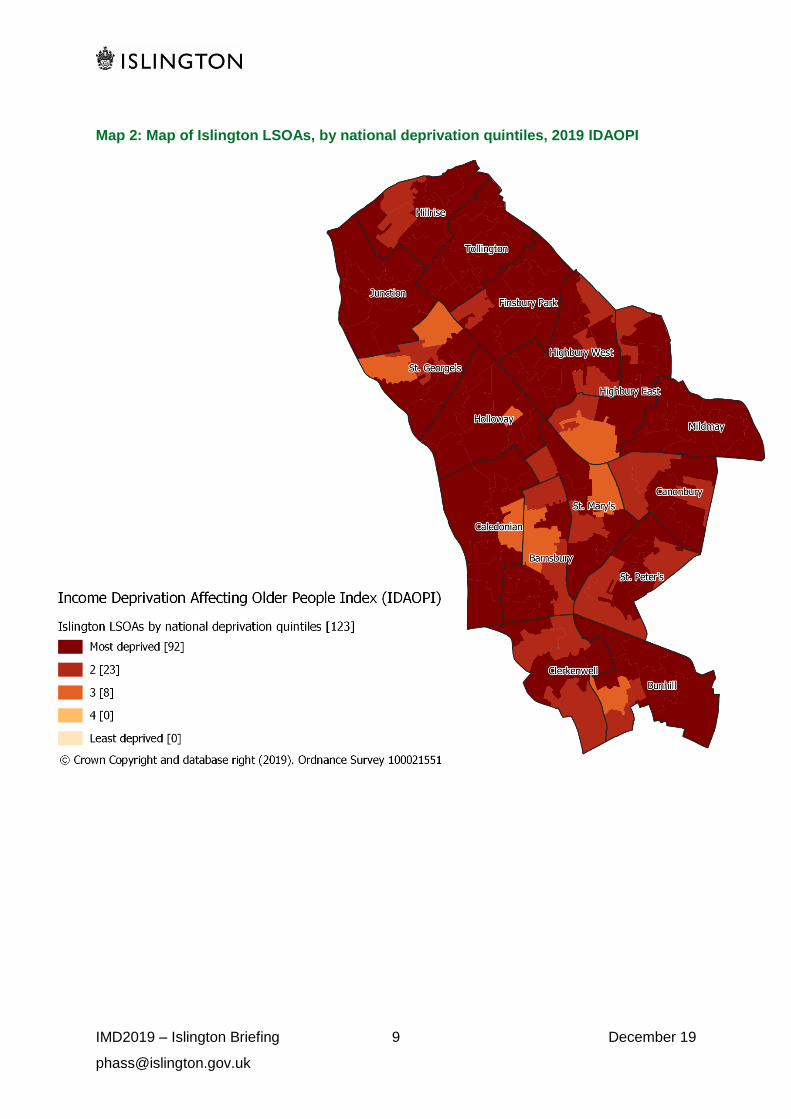
for the benefits after the changes came in. Islington also ranks the fourth highest for income
deprivation affecting older people (33%) behind Tower Hamlets, Hackney, and Newham,
and a slight deterioration from ranking fifth in 2015. Two thirds of the borough's LSOAs have
lower rankings in IDACI, and just 45% have lower rankings in the income deprivation
affecting older people indicator.
Other IMD resources
MHCLG have developed an interactive mapping tool for analysis of the IMD:
http://dclgapps.communities.gov.uk/imd/iod_index.html and a Local Authorities dashboard,
available here. The GLA usually produce analysis of the IMD, once complete it will be
published at https://data.london.gov.uk/dataset/.
NOTES:
The IMD only looks at relative deprivation, it cannot be used to quantify real terms changes.
We can only say that areas of Islington have become relatively more or less deprived
compared to other areas, we cannot say that areas have actually become less deprived.
The index also only measures deprivation, it does not use a scale from deprivation to wealth
or affluence, so we cannot use this information to say that Islington has become more
affluent, only that it is less deprived.
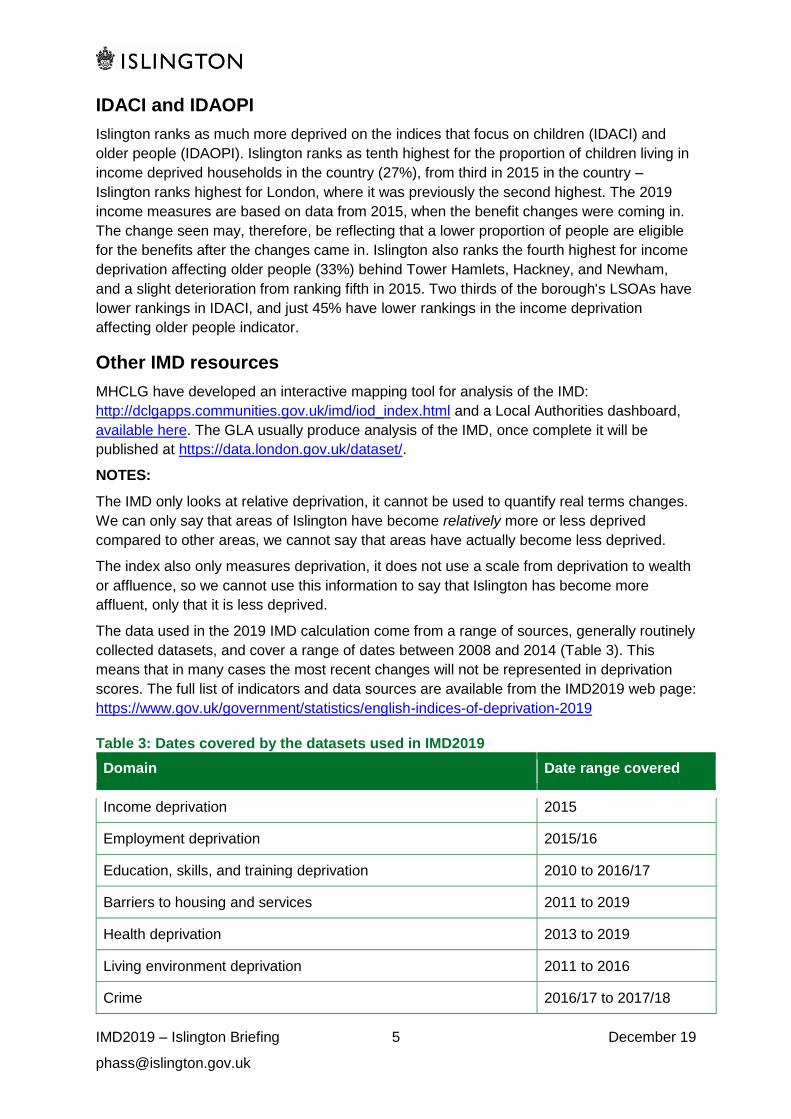
The data used in the 2019 IMD calculation come from a range of sources, generally routinely
collected datasets, and cover a range of dates between 2008 and 2014 (Table 3). This
means that in many cases the most recent changes will not be represented in deprivation
scores. The full list of indicators and data sources are available from the IMD2019 web page:
https://www.gov.uk/government/statistics/english-indices-of-deprivation-2019
Table 3: Dates covered by the datasets used in IMD2019
Domain Date range covered
Income deprivation 2015
Employment deprivation 2015/16
Education, skills, and training deprivation 2010 to 2016/17
Barriers to housing and services 2011 to 2019
Health deprivation 2013 to 2019
Living environment deprivation 2011 to 2016
Crime 2016/17 to 2017/18
IMD2019 – Islington Briefing 6 December 19
2019 and 2015 IMD maps by national quintiles
Map 1: Map of Islington LSOAs, by national deprivation quintiles, 2019 IMD
IMD2019 – Islington Briefing 7 December 19
Map 2: Map of Islington LSOAs, by national deprivation quintiles, 2015 IMD
IMD2019 – Islington Briefing 8 December 19
2019 maps of IDACI and IDAOPI by national quintiles
Map 2: Map of Islington LSOAs, by national deprivation quintiles, 2019 IDACI
IMD2019 – Islington Briefing 9 December 19
Map 2: Map of Islington LSOAs, by national deprivation quintiles, 2019 IDAOPI