Embed Size (px)
Citation preview
IMF Committee on Balance of Payments Statistics
Annual Report
2011
International Monetary Fund

2
Contents Page
List of Abbreviations .................................................................................................................3
Executive Summary ...................................................................................................................4
I. Introduction ....................................................................................................................6
II. Recent Trends in Global Balance of Payments and IIP Data ........................................6
III. Work Undertaken by the Committee in 2011 ................................................................7
A. Implementation of the BPM6 ....................................................................................7
B. Updating of Statistical Guides and Manuals .............................................................8
C. Data Gaps Initiatives .................................................................................................9
D. Coordinated Direct Investment and Portfolio Investment Surveys ........................10
E. Cross-Sectoral Data Consistency Project ................................................................10
F. Statistical Data and Metadata Exchange (SDMX) Data Structure Definition and
Governance ..............................................................................................................11
G. Discussion of Other Methodological Issues............................................................11
H. Updating of the Committee’s Terms of Reference .................................................12
I. Work of Other International Organizations ..............................................................12
IV. Medium-Term Work Program for 2012 ......................................................................12
Appendixes
I. Membership of the IMF Committee on Balance of Payments Statistics and Representatives
of International Organizations as of December 31, 2011 ........................................................13
II. Updated Terms of Reference of the IMF Committee on Balance of Payments Statistics ..14
III. Medium-Term Work Program of the IMF Committee on Balance of Payments Statistics,
End-December 2011 ................................................................................................................15
Appendix Tables
Table 1. Global Balances on Current Account, 2004–2010 ....................................................17
Table 2. Global Balances on Capital and Financial Accounts, 2004–2010 .............................18
Table 3. Global IIP—Assets and Liabilities, 2004–2010 ........................................................19

3
LIST OF ABBREVIATIONS
BOPSY Balance of Payments Statistics Yearbook
BIS Bank for International Settlements
BD4 OECD Benchmark Definition of Foreign Direct Investment,
fourth edition
BPM5 Balance of Payments Manual, fifth edition
BPM6 Balance of Payments and International Investment Position Manual,
sixth edition
CDIS Coordinated Direct Investment Survey
CG Compilation Guide
CPIS Coordinated Portfolio Investment Survey
DSD Data Structure Definition
ECB European Central Bank
EDS External Debt Statistics
FDI Foreign Direct Investment
FISIM Financial Intermediation Services Indirectly Measured
G-20 Group of twenty economies
HSS Handbook on Securities Statistics
IFS International Financial Statistics
IIP International Investment Position
IMF International Monetary Fund
MSITS Manual on Statistics of International Trade in Services
OECD Organization for Economic Cooperation and Development
RESTEG Reserve Assets Technical Expert Group
SDMX Statistical Data and Metadata Exchange
SEFER Survey of Securities Held as Foreign Exchange Reserves
STA IMF Statistics Department
UNCTAD United Nations Conference on Trade and Development
WGIIS OECD Working Group on International Investment Statistics
4
EXECUTIVE SUMMARY
The Annual Report of the IMF Committee on Balance of Payments Statistics (Committee)
for 2011 provides an overview of recent trends and discrepancies in global balance of
payments statistics, summarizes the Committee’s work program during 2011, and reviews
the issues the Committee plans to address in the coming year.
During 2011, the IMF Statistics Department (STA), in consultation with the Committee,
focused attention on improving the availability and quality of external sector data. In
particular:
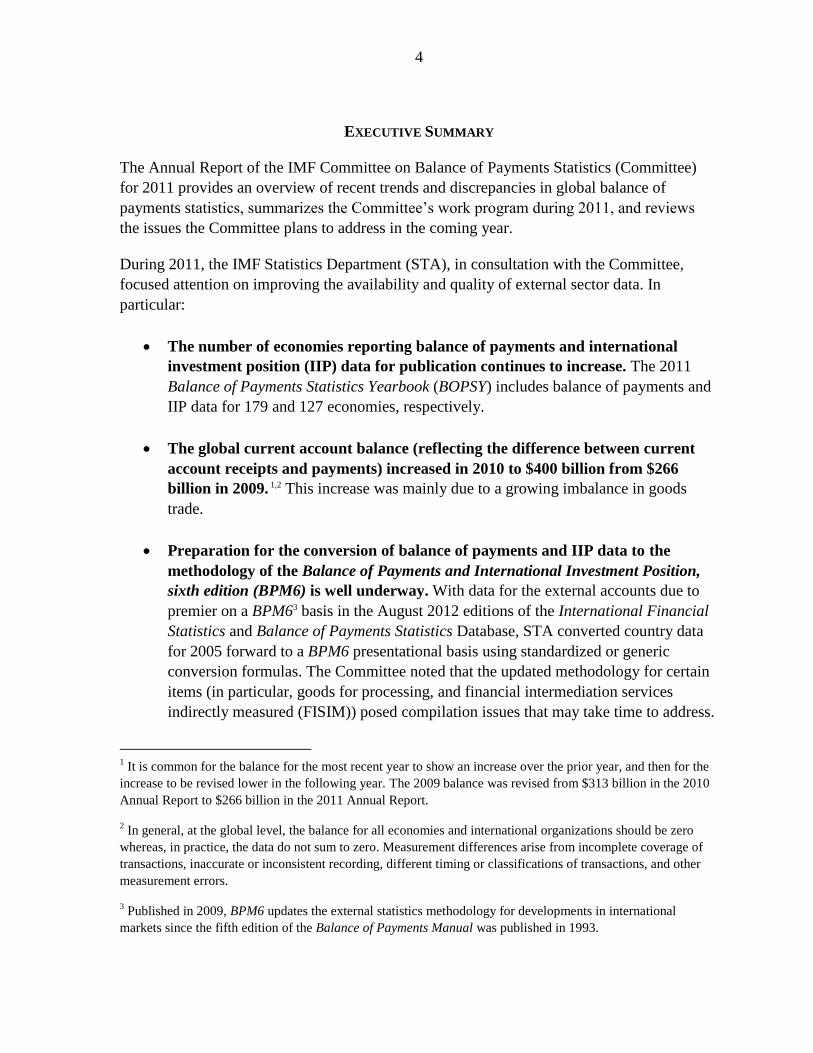
The number of economies reporting balance of payments and international
investment position (IIP) data for publication continues to increase. The 2011
Balance of Payments Statistics Yearbook (BOPSY) includes balance of payments and
IIP data for 179 and 127 economies, respectively.
The global current account balance (reflecting the difference between current
account receipts and payments) increased in 2010 to $400 billion from $266
billion in 2009. 1,2 This increase was mainly due to a growing imbalance in goods
trade.
Preparation for the conversion of balance of payments and IIP data to the
methodology of the Balance of Payments and International Investment Position,
sixth edition (BPM6) is well underway. With data for the external accounts due to
premier on a BPM63 basis in the August 2012 editions of the International Financial
Statistics and Balance of Payments Statistics Database, STA converted country data
for 2005 forward to a BPM6 presentational basis using standardized or generic
conversion formulas. The Committee noted that the updated methodology for certain
items (in particular, goods for processing, and financial intermediation services
indirectly measured (FISIM)) posed compilation issues that may take time to address.
1 It is common for the balance for the most recent year to show an increase over the prior year, and then for the
increase to be revised lower in the following year. The 2009 balance was revised from $313 billion in the 2010
Annual Report to $266 billion in the 2011 Annual Report.
2 In general, at the global level, the balance for all economies and international organizations should be zero
whereas, in practice, the data do not sum to zero. Measurement differences arise from incomplete coverage of
transactions, inaccurate or inconsistent recording, different timing or classifications of transactions, and other
measurement errors.
3 Published in 2009, BPM6 updates the external statistics methodology for developments in international
markets since the fifth edition of the Balance of Payments Manual was published in 1993.

5
Updating of major statistical manuals and guides continues. In particular, in 2011,
work on the updating of the International Reserves and Foreign Currency Liquidity:
Guidelines for a Data Template neared completion, and a worldwide consultation was
conducted on all chapters and appendices. In addition, work on the BPM6
Compilation Guide advanced well.
Substantial progress was made in regard to Coordinated Portfolio Investment
Survey (CPIS) data enhancements and in increasing the number of quarterly
reporters of IIP data. This work strengthens data availability for surveillance and
policy making in member countries, and is part of the G-20 Data Gaps Initiative. The
IMF has redesigned the CPIS report forms in preparation for the introduction of semi-
annual frequency and enhanced scope with data for end–June 2013. The number of
economies reporting quarterly IIP data increased to 70 at end–2011 (from 61 a year
earlier).
In 2012, STA and the Committee will continue with the above agenda and also (1) look to
improve the consistency of balance of payments data with other related datasets, and (2)
participate in the governance of the Statistical Data and Metadata Exchange (SDMX) in
cooperation with other interested parties, as well as to finalize the Data Structure Definition
(DSD) for external sector statistics, to facilitate data transmission among economies and
international agencies.

6
I. INTRODUCTION
1. The IMF Committee on Balance of Payments Statistics (Committee) was
established in 1992. Initially, a main purpose was to oversee the implementation of the
recommendations of two studies on imbalances in measured world current account and
financial flows. The Committee’s mandate has broadened over the years to cover improving
the availability, consistency, and reliability of balance of payments and international
investment position (IIP) statistics, and fostering greater coordination of data collection
among countries.
2. In 2011, the Committee held its twenty-fourth meeting on October 24–26 in
Moscow, Russia. The participants in the meeting, which include members of the Committee
and representatives from international organizations, are listed in Appendix I. During the
meeting, the Committee agreed to update its Terms of Reference, to more clearly state the
Committee’s role. The updated Terms of Reference of the Committee is presented in
Appendix II.
3. Section II of this Annual Report notes recent trends in global balance of payments
and IIP data; Section III focuses on the work undertaken by the Committee in 2011; and
Section IV outlines its medium–term work program.
II. RECENT TRENDS IN GLOBAL BALANCE OF PAYMENTS AND IIP DATA
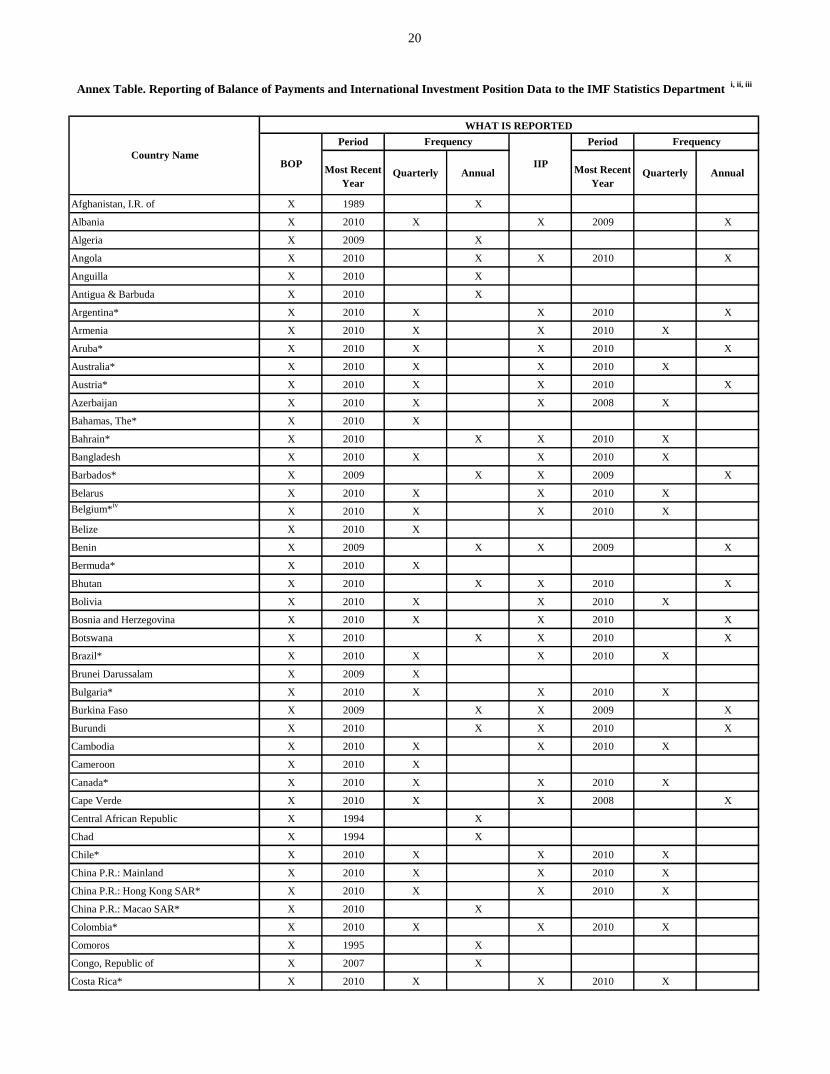
4. A growing number of economies submit external sector statistics to the IMF for re-
dissemination. Annual balance of payments and IIP statistics for the period 2003–10 are
published in the 2011 Balance of Payments Statistics Yearbook (2011 BOPSY). For the 2011
BOPSY, 179 economies submitted balance of payments data, of which 127 also submitted IIP
data. The number of quarterly IIP reporters increased to 70 economies from 61 in 2010.
5. In general, at the global level, the balances for all economies and international
organizations combined should be zero, whereas, in practice, the data do not net to zero.
The balances are of interest to the Committee, as they are a symptom of estimation errors
that, when large, could lead to policy mistakes. A number of factors contribute to the global
balances or statistical discrepancies. In particular, statistical discrepancies arise from
incomplete coverage of transactions, misclassifications, different timing, and asymmetric
valuations.
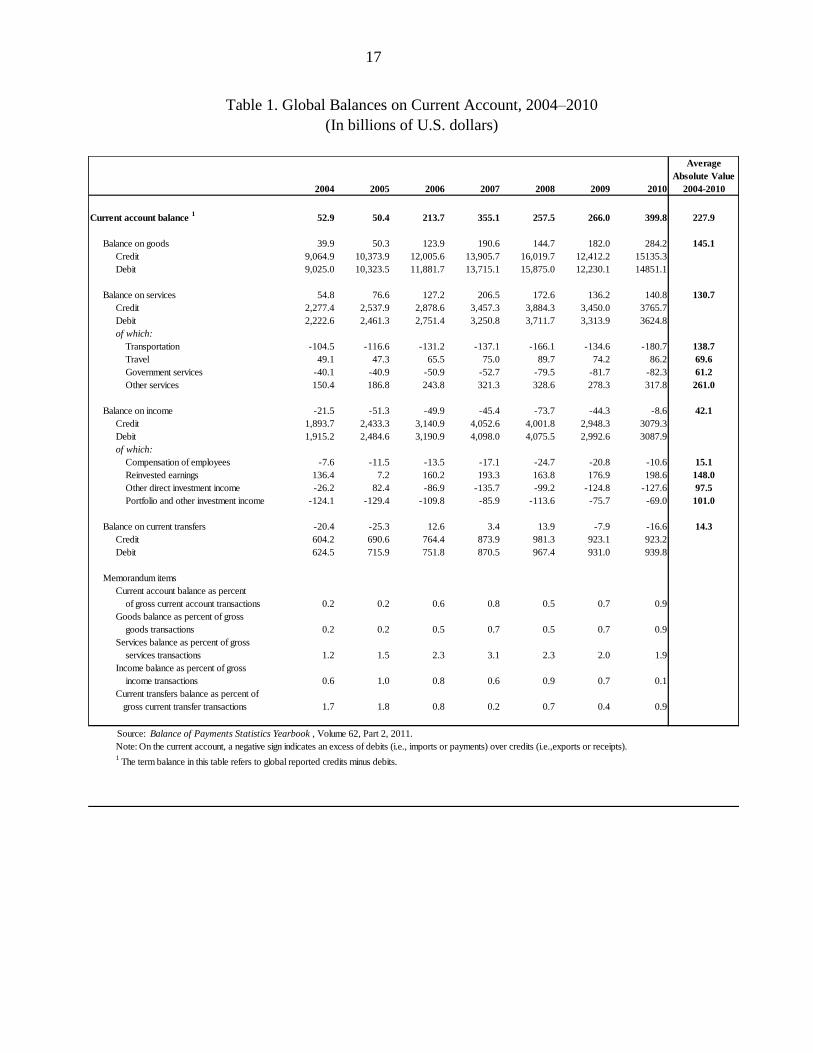
6. According to data published in 2011 BOPSY, the global current account balance
(reflecting the difference between current account receipts and payments) was consistently
positive in 2004–10 (see Appendix Tables 1 and 2). It increased to $400 billion in 2010,
compared to $266 billion in 2009. In both years, the balance on goods trade was largest,
followed by services trade. The balances on income and current transfers were much smaller.

7
The global goods balance was $284 billion in 2010, compared to $182 billion in 2009, and
the global services balance was $141 billion in 2010, compared to $136 billion in 2009.
Relative to the magnitude of transactions in 2010, however, services had the higher
discrepancy, at 1.9 percent of gross services transactions (sum of global exports and imports),
compared to a discrepancy of 0.9 percent of gross goods transactions.
7. In contrast to the global current account balance, the global financial account
balance in 2004–10 was consistently negative. It increased to negative $352 billion in 2010,
from negative $124 billion in 2009. These negative balances indicate that, at the global level,
acquisitions of financial assets are overestimated and/or the incurrence of liabilities is
understated.
8. In 2009, STA developed world and regional IIP aggregates–similar to the coverage
in the balance of payments world and regional tables–by including estimates for
nonreporting economies. World assets increased from $102 trillion in 2009 to $110 trillion
in 2010 (see Appendix Table 3). World liabilities increased from $102 trillion in 2009 to
$109 trillion in 2010.
III. WORK UNDERTAKEN BY THE COMMITTEE IN 2011
A. Implementation of the BPM6
9. During 2011, the IMF’s Statistics Department (STA) converted country data for
2005 forward to a BPM6 presentational basis using standardized or generic conversion
formulas. The resulting data files were thoroughly reviewed and sent to members beginning
in August 2011, with a request that members indicate whether they: (i) accepted the generic
estimates without changes; (ii) wished to customize those estimates in consultation with
STA; or (iii) wished to provide their own current and historic BPM6 basis estimates to STA.
The BPM6 basis data will premier in the August 2012 editions of the International Financial
Statistics and Balance of Payments Statistics Database. The Committee noted that the
conversion of data to a BPM6 basis was proceeding well, but that the updated methodology
for certain items (in particular, goods for processing, and financial intermediation services
indirectly measured (FISIM)) posed compilation issues that may take time to address.
10. The Committee exchanged information on their experiences in implementing
BPM6 and discussed related issues. Australia, the first country to virtually fully implement
BPM6, described its approach and identified the difficulties it encountered. Australia decided
for a ―big-bang‖ approach, resulting in only one big disruption in time series data. The ECB
and Eurostat reported on the coordinated implementation of BPM6 in the European Union.
The first transmission of data by member states according to BPM6 is expected in June 2014,
covering data for the first quarter of 2014 and all quarters of 2013. Brazil presented a
discussion paper on the issues related to ―superdividends.‖ The Committee supported the
recommendation that dividends be regarded as superdividends only in exceptional cases, and
8
suggested that advice on how to identify superdividends be included in the BPM6
Compilation Guide. Russia informed the Committee that it is generating flash estimates of
balance of payments and some component details within 2 or 3 days after the end of the
reporting quarter. These estimates are highly appreciated by data users because they are so
timely and revisions tend to be small.
B. Updating of Statistical Guides and Manuals
11. Work on updating of the International Reserves and Foreign Currency Liquidity:
Guidelines for a Data Template (Guidelines) was completed, and the Guidelines were
posted on the IMF website in early February 2012 as pre-publication draft (subject only to
minor editing).4 The Committee meeting in Moscow reviewed the draft text of all five
chapters and eight appendices of the Guidelines. This followed the posting of the complete
material on the Fund’s website for world-wide consultation. The material was shared in
parallel with the members of the Reserve Assets Technical Expert Group (RESTEG) and
internally in the IMF.
12. Work on the BPM6 Compilation Guide (CG) is advancing well. Many compilers
stressed the importance of the IMF updating its compilation advice by bringing together the
compilation experiences of countries across the world at all income levels. STA prepared
drafts of several chapters and appendices of the Compilation Guide, covering areas where
major methodological changes were introduced in BPM6. This material was shared with
Committee members for their review, and posted on the dedicated IMF CG website,
http://www.imf.org/external/pubs/ft/bop/2007/bop6comp.htm, for public comment. The
website was later updated to bring in additional materials, including relevant 2011 papers of
the Committee members. It is planned to disseminate the second set of draft chapters to
Committee members and for worldwide comments in March–April 2012.
13. Work on updating the External Debt Statistics (EDS) Guide also is advancing well.
The EDS Guide was published in 2003 and is being updated to come into line with BPM6.
Only a limited number of changes in BPM6 require changes in the methodological
framework or clarifications of the methodological treatment in the EDS Guide. Hence, only
an update rather than a rewrite of the EDS Guide is necessary. Draft chapters and appendices
pertaining to the conceptual framework for external debt statistics were reviewed by STA’s
main advisory group on external debt statistics, the Task Force on Finance Statistics, and
main outstanding issues have been identified.
4 The pre-publication draft of the updated Guidelines is posted at
http://www.imf.org/external/np/sta/ir/IRProcessWeb/dataguide.htm.

9
C. Data Gaps Initiatives
14. Substantial progress is being made in regard to Coordinated Portfolio Investment
Survey (CPIS) data enhancements. In particular, work is underway in regard to increasing
the frequency, timeliness, and scope of data on portfolio investment assets; enhancing data
accessibility; and increasing country participation. The IMF has redesigned the CPIS to
indicate semi-annual frequency and enhanced scope, i.e., introduction of new encouraged
data items, to obtain separate data on short or negative positions, and on the institutional
sector of foreign debtor. In regard to the latter, a new table will collect data on from-whom-
to-whom basis for the 25 economies with systemically important financial sectors, as
identified by the IMF Executive Board, that cross-classifies sector of holder data by sector of
issuer, on an encouraged basis.5 A new data validation tool was deployed to reduce the turn-
around time for data review and dissemination. On data accessibility, the IMF has utilized
new technologies for presenting and exchanging data. Also, an online CPIS metadata
questionnaire was developed (patterned after a similar questionnaire used for the Coordinated
Direct Investment Survey (CDIS)). The IMF has continued outreach efforts to increase CPIS
participation through country technical assistance and country/regional training missions.
15. STA continued to focus on increasing the number of quarterly reporters of IIP
statistics. As part of these efforts, a pamphlet on data sources and compilation techniques for
quarterly IIP was published. As of March 2012, 70 economies report quarterly IIP data to
STA, an increase of 9 since the release of the 2010 BOPSY. To guide compilers to produce
quarterly IIP statistics, STA published in March 2011 the pamphlet Quarterly International
Investment Position Statistics: Data Sources and Compilation Techniques.6 The purpose of
the pamphlet is to assist statistical agencies and central banks in compiling and disseminating
quarterly IIP in line with the initiative to fill information gaps. The document provided
information on sources and guidelines for reporting quarterly IIP data and presented options
for compiling said data given the detail, coverage and frequency of source data available. It
also included sections on revision policies and frequently asked questions.
5 The revised report forms reflecting enhancements to the scope and frequency were shared with CPIS and
SEFER participants in early January 2012. SEFER (Survey of Securities Held as Foreign Exchange Reserves) is
a companion survey to the CPIS; SEFER collects data on securities held in reserve assets, whereas the CPIS
collects data on securities held in portfolio investment.
6 The pamphlet is posted at http://www.imf.org/external/np/sta/iip/2011/030111.htm.
10
D. Coordinated Direct Investment and Portfolio Investment Surveys
16. The results of the first CDIS, providing direct investment position data at end–
2009, were publically disseminated prior to the Committee meeting, and data for 2010
(along with revised data for 2009) were disseminated shortly thereafter. The CDIS (see
http://cdis.imf.org) collects data on inward and outward direct investment positions by
immediate counterpart country, broken down between equity and debt, as of end–December
of the reference year. Seventy-two economies provided data for inward direct investment,
and 52 economies also reported data for outward direct investment, in time for the
preliminary release of 2009 data. With the submissions of revised 2009 data and of
preliminary 2010 data, the number of participants increased. As part of the overall reporting
to the IMF, economies provided metadata and an assessment of what improvements resulted,
at least in part, as a result of their participation in the survey. A very large proportion of
responding economies (50 of 70) who completed the data improvements questionnaire
indicated that overall foreign direct investment data quality improved significantly,
substantially, or highly substantially at least partly as a result of their participation in the
CDIS.
17. The results of the 2010 CPIS were published on schedule in November 2011 (see
http://cpis.imf.org). These data were the tenth annual set of CPIS data since the Committee
launched the annual survey in 2001. In addition to the country tables, the website also
includes a set of global tables that include derived liabilities data.
E. Cross-Sectoral Data Consistency Project
18. To enhance STA’s support of member countries and Area Departments involved in
surveillance work, STA has embarked on a project to assess and improve STA data
consistency. In particular, STA’s work under this project is geared toward improving the
consistency of data within and across statistical domains, including balance of payments
statistics, monetary and financial statistics, national accounts statistics, and government
finance statistics. STA formed a Cross-Sector Data Consistency Working Group in 2011,
which concluded that data inconsistencies exist for most countries, regardless of their size
and level of development. This finding underscored the need for STA to develop and
implement a project to identify and address inconsistencies. Consistent with the
recommendation of the Working Group (whose work has concluded), a Cross-Sector Data
Consistency Group was formed in early 2012 as the central coordinating body for cross-
sector consistency work in STA. Committee members expressed strong support for STA’s
work and recommendations in this area, and shared information on their own experiences.

11
F. Statistical Data and Metadata Exchange (SDMX) Data Structure Definition and
Governance
19. The SDMX is sponsored by seven international organizations (BIS, ECB, Eurostat,
IMF, OECD, United Nations, and World Bank), to help address the circumstance where
the same data are transmitted in different formats to different international organizations.
The IMF has closely worked with the ECB and Eurostat, in collaboration with the OECD and
the BIS, to prepare a Data Structure Definition (DSD) that can be used by all economies to
report BPM6-basis data to all international agencies in the same SDMX format. The
finalization of the DSD for pilot-testing is planned prior to the STA dissemination of BPM6-
basis data in August 2012, although minor enhancements may still be made for a period of
additional months. The proposed BPM6-DSD for external sector statistics will support
datasets including the CPIS, CDIS, and external sector data sets of interest for other
international or regional organizations. It was proposed that the Committee play a role in the
governance structure for external sector statistics, because the Committee is the expert group
responsible for dealing with methodological matters related to BPM6 and relationships
within the scope of external sector statistics. Under the proposed governance structure, the
three organizations currently in the lead for the BPM6–basis DSD (ECB, Eurostat, and IMF)
would regularly report to the SDMX-Sponsors as well as to the Committee. The Committee
would be the forum to review and approve the subject–matter issues related to the BPM6–
basis DSD. The Committee endorsed this proposed governance structure.
G. Discussion of Other Methodological Issues
20. The 2011 Committee meeting included discussions of a number of methodological
issues. Committee members presented papers on a diverse set of statistical issues, including
on those arising from the devastating effects of the tsunami on Japan’s statistical
infrastructure; on challenges associated with accounting for oil production sharing
agreements in the Russian Federation; and of the implications of Basel III for external sector
statistics (BIS). An overview was also given of the different financial assistance schemes that
are currently in place or planned to assist European Union governments in distress, covering
the main features of the schemes and guidance on how to record the activities in the balance
of payments and IIP statistics (Eurostat). Further, Oman reported on statistical data
improvements in the Gulf Cooperation Council Area, including the formation of GCCSTAT,
an organization that is designed to be similar in function to Eurostat.

12
H. Updating of the Committee’s Terms of Reference
21. The terms of reference have been updated (completed in early 2012) to clarify the
mandate of the Committee. While retaining a focus on the world statistical discrepancy, the
revised terms of reference indicates that the Committee advises the IMF on how to respond
to data gaps in the external sectors accounts.
I. Work of Other International Organizations
22. The other international organizations participating in the Committee meeting
reported on their work. The OECD’s Working Group on International Investment Statistics
(WGIIS) is proceeding with the implementation of the OECD Benchmark Definition of
Foreign Direct Investment, 4th
edition (BD4). Its research agenda includes harmonizing and
integrating FDI statistics with statistics on activities of multinational enterprises, and defining
and measuring green FDI. UNCTAD has published the World Investment Report 2011 which
highlights the growing importance of non-equity modes of international investment. In
addition, the Task Force on Statistics of International Trade in Services, which is chaired by
the OECD, has posted on its website the Manual on Statistics of International Trade in
Services (MSITS) 2010. An accompanying compilation guide will be prepared. Finally, the
BIS and ECB drafted parts of the Handbook on Securities Statistics, with technical support
from the IMF. The BIS presented information on its work to enhance the international
banking statistics.
23. The full set of papers presented at the meeting of the Committee in Moscow,
including the summary of discussion are available at
http://www.imf.org/external/bopage/bopindex.htm.
IV. MEDIUM-TERM WORK PROGRAM FOR 2012
24. The top priorities of the Committee will remain the implementation of BPM6,
preparation of the BPM6 Compilation Guide, publication of the Reserves Data Template
Guidelines, and CPIS data enhancements. In addition, expanding the number of countries
reporting annual or quarterly IIP data will be a top priority. However, work on the CDIS is
now proposed to be a medium priority (compared to top priority in 2011), because it is now
an ongoing annual exercise. The medium–term work program of the Committee is shown in
Appendix III.
25. Although not listed in the proposed work program, work on improving the data on
global liquidity and financial account transactions is gaining interest by G-20 and other
data users and could soon become a priority. Work on improving the timeliness and
availability of IIP data was highly appreciated by policy makers and other data users, and
similar data improvements may soon be sought in the areas of liquidity and financial
transactions.
13
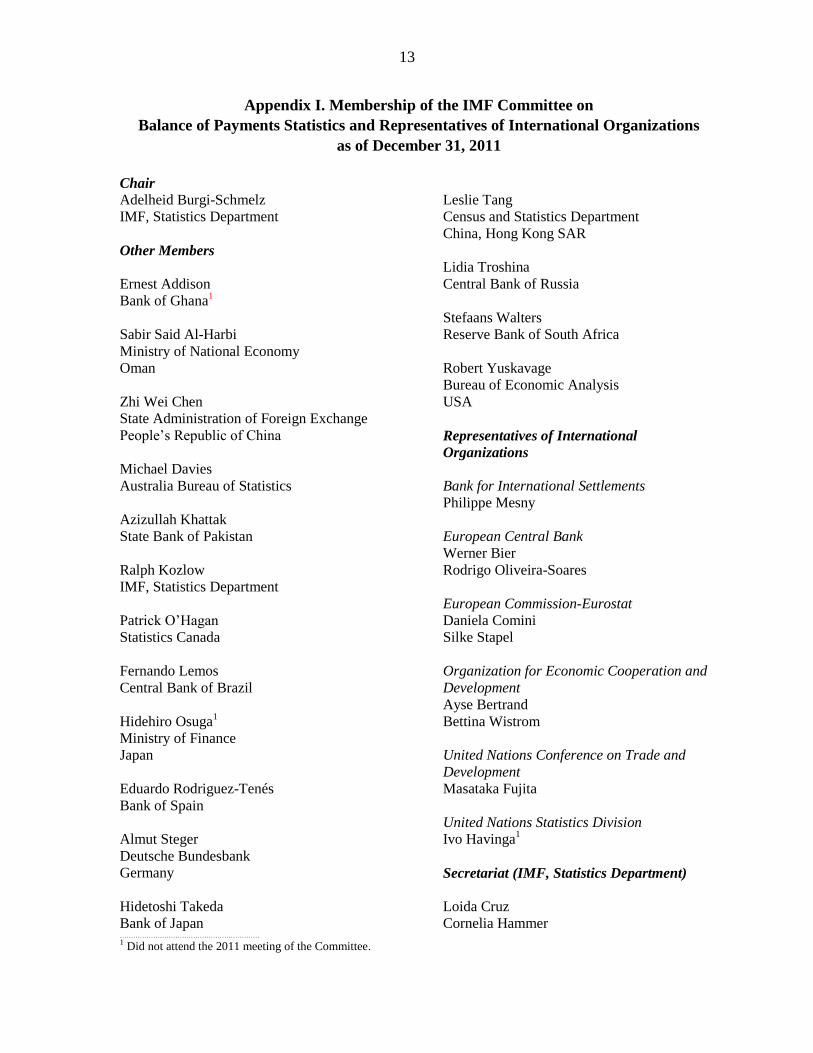
Appendix I. Membership of the IMF Committee on
Balance of Payments Statistics and Representatives of International Organizations
as of December 31, 2011
Chair
Adelheid Burgi-Schmelz
IMF, Statistics Department
Other Members
Ernest Addison
Bank of Ghana1
Sabir Said Al-Harbi
Ministry of National Economy
Oman
Zhi Wei Chen
State Administration of Foreign Exchange
People’s Republic of China
Michael Davies
Australia Bureau of Statistics
Azizullah Khattak
State Bank of Pakistan
Ralph Kozlow
IMF, Statistics Department
Patrick O’Hagan
Statistics Canada
Fernando Lemos
Central Bank of Brazil
Hidehiro Osuga1
Ministry of Finance
Japan
Eduardo Rodriguez-Tenés
Bank of Spain
Almut Steger
Deutsche Bundesbank
Germany
Hidetoshi Takeda
Bank of Japan
Leslie Tang
Census and Statistics Department
China, Hong Kong SAR
Lidia Troshina
Central Bank of Russia
Stefaans Walters
Reserve Bank of South Africa
Robert Yuskavage
Bureau of Economic Analysis
USA
Representatives of International
Organizations
Bank for International Settlements
Philippe Mesny
European Central Bank
Werner Bier
Rodrigo Oliveira-Soares
European Commission-Eurostat
Daniela Comini
Silke Stapel
Organization for Economic Cooperation and
Development
Ayse Bertrand
Bettina Wistrom
United Nations Conference on Trade and
Development
Masataka Fujita
United Nations Statistics Division
Ivo Havinga1
Secretariat (IMF, Statistics Department)
Loida Cruz
Cornelia Hammer ……………………………………………………… 1 Did not attend the 2011 meeting of the Committee.
14
Appendix II. Updated Terms of Reference of the IMF Committee on
Balance of Payments Statistics
1. The Committee will advise the IMF on methodological and compilation issues in the
context of balance of payments and international investment position statistics, and foster
greater coordination of data collection among countries.
2. The Committee will advise on the implementation of the Balance of Payments and
International Investment Position Manual.
3. The Committee will bring to the attention of the IMF new developments that impact
on the compilation of statistics of cross-border transactions or related stocks of financial
assets and liabilities, and work with the IMF in determining how these activities should be
treated in accordance with the Balance of Payments and International Investment Position
Manual.
4. The Committee will advise the IMF on the identification and closing of data gaps in
the external sector accounts, especially those arising from the need to support surveillance
and analysis of cross-border financial interconnectedness.
5. The Committee will investigate ways in which data collection can be better
coordinated among countries, with a view, inter alia, to facilitating the exchange of statistics
(e.g., bilateral transactions or stock data). It will also identify related areas for study and
determine how work in those areas should be carried forward.
6. Members are invited to join the Committee on a personal basis reflecting an
appropriate level of seniority and expertise in the field of external statistics. As part of their
membership obligations, Committee members commit to attending the full meetings of the
Committee and to actively participate, unless there are exceptional circumstances that
prevent such attendance and participation.
7. In carrying forward its work, the Committee will collaborate with other national
compilers and with appropriate international organizations.
8. In consultation with the IMF’s Statistics Department, the Committee will determine
its work program and will meet under IMF auspices at least once a year.
9. The Committee’s work will be summarized in an annual report to the Managing
Director of the IMF.

15
Appendix III. Medium–Term Work Program of the IMF Committee on
Balance of Payments Statistics, End–December 2011
Subject Issue Action
TOP PRIORITY
Balance of Payments and
International Investment Position
Manual (BPM6)
Implementation of the BPM6
IMF and Committee member(s) to report on
progress in adopting the new standards.
IMF develops data collection and processing
systems for BPM6, including SDMX data
structure and codes. IMF publishes data on a
BPM6-basis in the IFS and Balance of
Payments Statistics.
BPM6 Compilation Guide Preparing the BPM6 Compilation Guide IMF presents complete draft of the BPM6
Compilation Guide to the Committee at its
2012 annual meeting.
Reserve Assets Reserve Template Guidelines to be updated.
Advice provided to countries regarding
statistical treatment of reserve assets.
Report by IMF on its final publication of the
updated Guidelines and on other initiatives in
the reserve assets area.
Coordinated Portfolio Investment
Survey (CPIS)
Enhance the quality and availability of
CPIS data
IMF to report on implementation of
enhancements to CPIS data.
IMF to publish results of the 2010 CPIS and
update results of the 2009 CPIS.
International Investment Position
Expansion in the number of quarterly IIP
reporters and further development of annual
estimates
Paper by IMF on developments and
enhancements in IIP estimates

16
MEDIUM PRIORITY
Coordinated Direct Investment
Survey (CDIS)
Results of the 2010–2011 CDIS
IMF to report on release of results from the
2010 CDIS, and report on progress in the
2011 CDIS.
External Debt
Improve reporting of external debt data
Paper by IMF on update of the External Debt
Guide and progress by the Task Force on
Finance Statistics
International Trade in Services Revision of Manual on Statistics of
International Trade in Services (MSITS)
Paper by OECD on activities of the Task
Force on Statistics of International Trade in
Services.
Data Sharing and Confidentiality Developments in the sharing of data with,
and within, the IMF while respecting
confidentiality pledges
Report by IMF
Sovereign wealth funds
Report on progress
Report by IMF
Remittances
Remittances Compilation Guide (RCG)
IMF to report on work on progress in the
remittances area
Research topics
Report on long-term research program in
consultation with Inter-Secretariat Working
Group on National Accounts
Report by IMF
Securities statistics
Handbook on Securities Statistics (HSS),
Working Group on Securities Databases
and progress on the CSDB
Paper by BIS, ECB, and/or IMF on HSS
Paper by ECB on CSDB
Global discrepancies
Developments in discrepancies in global
balance of payments statistics
Report by IMF
International financial statistics
Developments in banking and related
statistics
Report by BIS
17
Table 1. Global Balances on Current Account, 2004–2010
(In billions of U.S. dollars)
Average
Absolute Value
2004 2005 2006 2007 2008 2009 2010 2004-2010
Current account balance 1
52.9 50.4 213.7 355.1 257.5 266.0 399.8 227.9
Balance on goods 39.9 50.3 123.9 190.6 144.7 182.0 284.2 145.1
Credit 9,064.9 10,373.9 12,005.6 13,905.7 16,019.7 12,412.2 15135.3
Debit 9,025.0 10,323.5 11,881.7 13,715.1 15,875.0 12,230.1 14851.1
Balance on services 54.8 76.6 127.2 206.5 172.6 136.2 140.8 130.7
Credit 2,277.4 2,537.9 2,878.6 3,457.3 3,884.3 3,450.0 3765.7
Debit 2,222.6 2,461.3 2,751.4 3,250.8 3,711.7 3,313.9 3624.8
of which:
Transportation -104.5 -116.6 -131.2 -137.1 -166.1 -134.6 -180.7 138.7
Travel 49.1 47.3 65.5 75.0 89.7 74.2 86.2 69.6
Government services -40.1 -40.9 -50.9 -52.7 -79.5 -81.7 -82.3 61.2
Other services 150.4 186.8 243.8 321.3 328.6 278.3 317.8 261.0
Balance on income -21.5 -51.3 -49.9 -45.4 -73.7 -44.3 -8.6 42.1
Credit 1,893.7 2,433.3 3,140.9 4,052.6 4,001.8 2,948.3 3079.3
Debit 1,915.2 2,484.6 3,190.9 4,098.0 4,075.5 2,992.6 3087.9
of which:
Compensation of employees -7.6 -11.5 -13.5 -17.1 -24.7 -20.8 -10.6 15.1
Reinvested earnings 136.4 7.2 160.2 193.3 163.8 176.9 198.6 148.0
Other direct investment income -26.2 82.4 -86.9 -135.7 -99.2 -124.8 -127.6 97.5
Portfolio and other investment income -124.1 -129.4 -109.8 -85.9 -113.6 -75.7 -69.0 101.0
Balance on current transfers -20.4 -25.3 12.6 3.4 13.9 -7.9 -16.6 14.3
Credit 604.2 690.6 764.4 873.9 981.3 923.1 923.2
Debit 624.5 715.9 751.8 870.5 967.4 931.0 939.8
Memorandum items
Current account balance as percent
of gross current account transactions 0.2 0.2 0.6 0.8 0.5 0.7 0.9
Goods balance as percent of gross
goods transactions 0.2 0.2 0.5 0.7 0.5 0.7 0.9
Services balance as percent of gross
services transactions 1.2 1.5 2.3 3.1 2.3 2.0 1.9
Income balance as percent of gross
income transactions 0.6 1.0 0.8 0.6 0.9 0.7 0.1
Current transfers balance as percent of
gross current transfer transactions 1.7 1.8 0.8 0.2 0.7 0.4 0.9
Source: Balance of Payments Statistics Yearbook , Volume 62, Part 2, 2011.
Note: On the current account, a negative sign indicates an excess of debits (i.e., imports or payments) over credits (i.e.,exports or receipts).1
The term balance in this table refers to global reported credits minus debits.

18
Table 2. Global Balances on Capital and Financial Accounts, 2004–2010
(In billions of U.S. dollars)
Average
Absolute Value
2004 2005 2006 2007 2008 2009 2010 2004-2010
Capital account balance -1.8 30.0 14.8 -16.7 5.5 -12.9 16.9 14.1
Credit 71.9 122.4 138.4 104.1 113.6 106.2 125.5
Debit 73.7 92.4 123.7 120.8 108.2 119.1 108.7
Financial account balance -154.9 -70.4 -146.3 -346.2 -52.5 -123.7 -351.6 177.9
Direct investment -239.1 127.5 74.4 -171.2 -191.6 -4.1 -12.0 117.1
Abroad -1,010.2 -1,073.0 -1,507.5 -2,507.0 -2,136.0 -1368.6 -1413.8
In the reporting economy 771.1 1,200.5 1,581.9 2,335.8 1,944.3 1364.5 1401.9
Portfolio investment 245.8 233.0 163.4 191.1 281.0 -174.0 188.5 211.0
Assets -1,898.8 -2,549.4 -2,820.8 -2,520.9 28.7 -1745.8 -1267.4
Liabilities excluding LCFAR1
2,144.7 2,782.5 2,984.2 2,712.0 252.3 1571.8 1455.9
Liabilities including LCFAR 2,530.0 3,190.3 3,505.6 3,635.6 1,132.2 2297.1 2367.1
LCFAR in Portfolio investment 385.3 407.9 521.4 923.6 879.9 725.3 911.1
Financial Derivatives -16.4 -9.7 78.2 -125.6 -344.3 106.9 111.9 113.3
Assets 293.7 454.0 364.6 446.5 812.1 941.9 1152.2
Liabilities -310.1 -463.6 -286.4 -572.1 -1,156.4 -835.0 -1040.2
Other investment -113.3 -361.8 -340.0 -63.4 346.4 220.6 -423.7 267.0
Assets -2,222.6 -2,968.0 -3,496.9 -5,711.8 1,016.1 1959.6 -2194.0
Liabilities excluding LCFAR1
2,109.3 2,606.3 3,157.0 5,648.5 -669.7 -1739.0 1770.3
Liabilities including LCFAR 2,308.5 2,775.3 3,359.0 5,831.6 -859.1 -1724.8 1825.9
LCFAR in Other Investment 199.2 169.1 202.0 183.2 -189.4 14.2 55.7
Reserves plus LCFAR -31.9 -59.5 -122.3 -177.0 -144.0 -273.0 -216.4 146.3
Reserves -616.4 -636.4 -845.7 -1,283.8 -834.4 -1012.5 -1183.2
LCFAR 584.5 576.9 723.4 1,106.8 690.5 739.5 966.8
Net errors and omissions 2
103.8 -10.0 -82.2 7.8 -210.6 -129.4 -65.0
Source: Balance of Payments Statistics Yearbook , Volume 62, Part 2, 2011.
Note: In the financial account, a negative sign indicates an excess of recorded outflows (i.e., increases in assets or decreases in liabilities); the absence of a sign
in the balances indicates an excess of recorded inflows (i.e., decreases in assets or increases in liabilities).1
Liabilities constituting foreign authorities' reserves. The data in liabilities constituting foreign authorities' reserves were derived from
information collected by the IMF from a sample of large reserve-holding countries. These data were used to adjust portfolio and
other investment liabilities to align the data better with corresponding asset series.2
The sum of recorded transactions with sign reversed.

19
Table 3. Global IIP—Assets and Liabilities, 2004–2010
2004 2005 2006 2007 2008 2009 2010
Assets
World Total 56,632 63,171 80,391 101,701 99,041 102,461 110,043
Advanced Economies 51,736 57,198 72,503 90,919 87,781 89,930 95,810
Emerging and
Developing Economies 4,896 5,973 7,887 10,781 11,260 12,531 14,233
Developing Asia 1,512 1,873 2,511 3,533 4,049 4,743 5,614
Europe 793 978 1,426 2,080 2,100 2,258 2,389
Central and Eastern
Europe 316 363 541 760 805 850 832
CIS and Mongolia 477 616 886 1,320 1,295 1,408 1,557
Middle East and
Northern Africa 1,131 1,451 1,915 2,591 2,659 2,766 2,958
Sub-Saharan Africa 237 276 351 433 441 513 592
Western Hemisphere 1,224 1,395 1,684 2,145 2,011 2,251 2,680
Liabilities
World Total 58,729 64,627 81,672 102,703 99,556 102,381 109,242
Advanced Economies 52,769 57,863 73,363 91,619 89,082 89,869 94,854
Emerging and
Developing Economies 5,960 6,764 8,309 11,084 10,474 12,512 14,388
Developing Asia 1,546 1,767 2,181 2,733 2,906 3,666 4,501
Europe 1,312 1,584 2,204 3,271 2,836 3,291 3,581
Central and Eastern
Europe 769 879 1,212 1,720 1,714 1,905 1,967
CIS and Mongolia 542 705 992 1,551 1,122 1,386 1,614
Middle East and
Northern Africa 690 780 962 1,279 1,404 1,504 1,599
Sub-Saharan Africa 447 476 486 585 525 666 788
Western Hemisphere 1,965 2,156 2,475 3,216 2,803 3,386 3,919
Total Assets as % of
Total Liabilities 96.4 97.7 98.4 99.0 99.5 100.1 100.7
20
Period Period
Most Recent
YearQuarterly Annual Most Recent
Year Quarterly Annual
Afghanistan, I.R. of X 1989 X
Albania X 2010 X X 2009 X
Algeria X 2009 X
Angola X 2010 X X 2010 X
Anguilla X 2010 X
Antigua & Barbuda X 2010 X
Argentina* X 2010 X X 2010 X
Armenia X 2010 X X 2010 X
Aruba* X 2010 X X 2010 X
Australia* X 2010 X X 2010 X
Austria* X 2010 X X 2010 X
Azerbaijan X 2010 X X 2008 X
Bahamas, The* X 2010 X
Bahrain* X 2010 X X 2010 X
Bangladesh X 2010 X X 2010 X
Barbados* X 2009 X X 2009 X
Belarus X 2010 X X 2010 X
Belgium*iv
X 2010 X X 2010 X
Belize X 2010 X
Benin X 2009 X X 2009 X
Bermuda* X 2010 X
Bhutan X 2010 X X 2010 X
Bolivia X 2010 X X 2010 X
Bosnia and Herzegovina X 2010 X X 2010 X
Botswana X 2010 X X 2010 X
Brazil* X 2010 X X 2010 X
Brunei Darussalam X 2009 X
Bulgaria* X 2010 X X 2010 X
Burkina Faso X 2009 X X 2009 X
Burundi X 2010 X X 2010 X
Cambodia X 2010 X X 2010 X
Cameroon X 2010 X
Canada* X 2010 X X 2010 X
Cape Verde X 2010 X X 2008 X
Central African Republic X 1994 X
Chad X 1994 X
Chile* X 2010 X X 2010 X
China P.R.: Mainland X 2010 X X 2010 X
China P.R.: Hong Kong SAR* X 2010 X X 2010 X
China P.R.: Macao SAR* X 2010 X
Colombia* X 2010 X X 2010 X
Comoros X 1995 X
Congo, Republic of X 2007 X
Costa Rica* X 2010 X X 2010 X
Annex Table. Reporting of Balance of Payments and International Investment Position Data to the IMF Statistics Department i, ii, iii
Country Name
WHAT IS REPORTED
BOP
Frequency
IIP
Frequency

21
Period Period
Most Recent
YearQuarterly Annual Most Recent
Year Quarterly Annual
Country Name
WHAT IS REPORTED
BOP
Frequency
IIP
Frequency
Côte d'Ivoire X 2009 X X 2009 X
Croatia X 2010 X X 2010 X
Cyprus* X 2010 X X 2010 X
Czech Republic* X 2010 X X 2010 X
Denmark* X 2010 X X 2010 X
Djibouti X 2010 X X 2010 X
Dominica X 2010 X
Dominican Republic X 2010 X X 2010 X
Eastern Caribbean Currency Union X 2010 X
Ecuador X 2010 X X 2010 X
Egypt X 2010 X X 2009 X
El Salvador X 2010 X X 2010 X
Equatorial Guinea X 1996 X
Eritrea X 2000 X
Estonia* X 2010 X X 2010 X
Ethiopia X 2010 X
Euro Area X 2010 X X 2010 X
Faroe Islandsv
X 2003 X
Fiji X 2010 X
Finland* X 2010 X X 2010 X
France* X 2010 X X 2010 X
French Polynesia X 2010 X
Gabon X 2005 X
Gambia, The X 2010 X
Georgia X 2010 X X 2010 X
Germany* X 2010 X X 2010 X
Ghana X 2010 X
Greece* X 2010 X X 2010 X
Grenada X 2010 X
Guatemala X 2010 X X 2010 X
Guinea X 2010 X X 2010 X
Guinea-Bissau X 2009 X X 2009 X
Guyana X 2010 X
Haiti X 2010 X X 2010 X
Honduras X 2010 X X 2010 X
Hungary* X 2010 X X 2010 X
Iceland* X 2010 X X 2010 X
India* X 2010 X X 2010 X
Indonesia* X 2010 X X 2010 X
Iran, I.R. of X 2000 X
Iraq X 2008 X X 2010 X
Ireland* X 2010 X X 2010 X
Israel* X 2010 X X 2010 X
Italy* X 2010 X X 2010 X
Jamaica X 2010 X X 2010 X
Japan* X 2010 X X 2010 X

22
Period Period
Most Recent
YearQuarterly Annual Most Recent
Year Quarterly Annual
Country Name
WHAT IS REPORTED
BOP
Frequency
IIP
Frequency
Jordan X 2010 X X 2010 X
Kazakhstan* X 2010 X X 2010 X
Kenya X 2010 X
Kiribati X 1994 X
Korea* X 2010 X X 2010 X
Kosovo X 2010 X
Kuwait* X 2010 X X 2010 X
Kyrgyz Republic X 2010 X X 2010 X
Lao, P.D.R. X 2010 X
Latvia* X 2010 X X 2010 X
Lebanon* X 2010 X
Lesotho X 2010 X X 2010 X
Liberia X 2010 X
Libya X 2010 X
Lithuania* X 2010 X X 2010 X
Luxembourg* X 2010 X X 2010 X
Macedonia, FYR X 2010 X X 2010 X
Madagascar X 2005 X
Malawi X 2009 X
Malaysia* X 2010 X X 2010 X
Maldives X 2010 X X 2010 X
Mali X 2009 X X 2009 X
Malta* X 2010 X X 2010 X
Mauritania X 1998 X
Mauritius* X 2010 X X 2010 X
Mexico* X 2010 X X 2010 X
Moldova X 2010 X X 2010 X
Mongolia X 2010 X X 2010 X
Montenegro, Rep. of X 2010 X
Montserrat X 2010 X
Morocco X 2010 X X 2010 X
Mozambique X 2010 X X 2010 X
Myanmar X 2010 X X 2006 X
Namibia X 2010 X X 2010 X
Nepal X 2010 X
Netherlands* X 2010 X X 2010 X
Netherlands Antilles X 2009 X
New Caledonia X 2010 X
New Zealand* X 2010 X X 2010 X
Nicaragua X 2010 X X 2010 X
Niger X 2009 X X 2009 X
Nigeria X 2010 X X 2010 X
Norway* X 2010 X X 2010 X
Oman X 2010 X
Pakistan* X 2010 X X 2010 X
Panama* X 2010 X X 2010 X

23
Period Period
Most Recent
YearQuarterly Annual Most Recent
Year Quarterly Annual
Country Name
WHAT IS REPORTED
BOP
Frequency
IIP
Frequency
Papua New Guinea X 2010 X
Paraguay X 2010 X X 2010 X
Peru X 2010 X X 2010 X
Philippines* X 2010 X X 2010 X
Poland* X 2010 X X 2010 X
Portugal* X 2010 X X 2010 X
Romania* X 2010 X X 2010 X
Russian Federation* X 2010 X X 2010 X
Rwanda X 2010 X X 2010 X
Samoa X 2010 X
Sao Tome and Principe X 2010 X
Saudi Arabia X 2010 X
Senegal X 2009 X X 2009 X
Serbia X 2010 X X 2010 X
Seychelles X 2010 X
Sierra Leone X 2010 X X 2010 X
Singapore* X 2010 X X 2010 X
Slovak Republic* X 2010 X X 2010 X
Slovenia* X 2010 X X 2010 X
Solomon Islands X 2010 X X 2010 X
Somalia X 1989 X
South Africa* X 2010 X X 2010 X
Spain* X 2010 X X 2010 X
Sri Lanka X 2010 X
St. Kitts & Nevis X 2010 X
St. Lucia X 2010 X
St. Vincent & the Grenadines X 2010 X
Sudan X 2010 X X 2010 X
Suriname X 2010 X
Swaziland X 2010 X X 2010 X
Sweden* X 2010 X X 2010 X
Switzerland* X 2010 X X 2010 X
Syrian Arab Republic X 2010 X X 2010 X
Tajikistan X 2010 X
Tanzania X 2010 X X 2010 X
Thailand* X 2010 X X 2010 X
Timor-Leste X 2009 X
Togo X 2009 X X 2009 X
Tonga X 2009 X
Trinidad & Tobago X 2009 X
Tunisia X 2010 X X 2010 X
Turkey* X 2010 X X 2010 X
Turkmenistan X 1997 X
Uganda X 2010 X X 2010 X
Ukraine* X 2010 X X 2010 X
United Kingdom* X 2010 X X 2010 X

24
Period Period
Most Recent
YearQuarterly Annual Most Recent
Year Quarterly Annual
Country Name
WHAT IS REPORTED
BOP
Frequency
IIP
Frequency
United States* X 2010 X X 2010 X
Uruguay* X 2010 X X 2010 X
Vanuatu X 2007 X X 2006 X
Venezuela* X 2010 X X 2010 X
Vietnam X 2010 X
West Bank and Gaza X 2009 X
Yemen, Republic of X 2009 X X 2007 X
Zambia X 2010 X
Zimbabwe X 1994 X
Total 191 126 65 127 70 57
i This table was not included in the document submitted to the IMF Executive Board for information.
v Faroe Islands balance of payments data cover current account components only.
Notes:
* Participated in the 2010 CPIS (as of November 2011).
ii In BOPSY 2011 (printed version), country pages are provided for 179 economies, of which 127 reported IIP.
Countries report IIP data of varying
comprehensiveness. iii
The cutoff date for this report is BOPSY 2011 , i.e., October 18, 2011. iv
Balance of payments data prior to 2002 cover Belgium-Luxembourg.