Embed Size (px)
Citation preview
The IMF’s Dissemination Standards Bulletin BoardLinked to National Summary Data Sites
or a number of countries it is now possible to move directly from the IMF’s Dissemination Standards Bulletin Board (DSBB) on the Internet(http://dsbb.imf.org) to national Internet data sites to gain access to key
economic and financial data. The first such electronic links (hyperlinks) opened inApril 1997. Data users can now move between the DSBB and the actual data ofseven countries: Canada, Israel, Mexico, Singapore, South Africa, Switzerland, andUnited Kingdom—Hong Kong.
The DSBB describes the statistical practices of countries that subscribe to theIMF’s Special Data Dissemination Standard (SDDS). The IMF introduced the SDDSin April 1996 to guide its member countries in providing to the public comprehen-sive, timely, accessible, and reliable economic and financial statistics. (See also IMFBalance of Payments Statistics Newsletters, December 1996, June 1996, and December1995.)
Countries that voluntarily sign up for the SDDS undertake to make the neces-sary changes to their statistical practices to meet the SDDS requirements for datacoverage, periodicity, timeliness, public access to the data, integrity of data, anddata quality. To date, there have been 42 subscriptions to the SDDS, and compre-hensive information about data dissemination practices (i.e., metadata) is currentlyshown on the DSBB for 33 of them.
Each of the seven subscribers that has developed hyperlinks shows the datathat are described in the country’s metadata. Data users can move from the sub-scriber’s page on the DSBB to the national summary data pages by clicking on“New Access to [subscriber’s] data” wherever it appears. From many of these na-tional summary data pages, users can move to more detailed data using hyper-links that the subscriber has provided. Users also can move in the other direction,from national pages to the DSBB.
Hyperlinks from the DSBB to national data sites of Finland, Japan, Peru, andTurkey are expected in the near term. Hyperlinks to more DSBB subscribing coun-tries will follow.
A NEWSLETTER FROM THE BALANCE OF PAYMENTS AND EXTERNAL DEBT DIVISIONS • STATISTICS DEPARTMENT • IMF
Volume V, Number 1June 1997
Balance of Payments Statistics
IMF Balance of Payments Statistics Newsletter is now available on the Internet at
http://www.imf.org/external/pubs/ft/bop/news/index.htm. Also available at the same Web site are Annual Report of the IMFCommittee on Balance of Payments Statistics and selected working
papers prepared under the auspices of the Committee.
F
Internet providingimportant newdata links. . . more to follow
June 19972
The IMF’s Dissemination Standards Bulletin Board 1Linked to National Summary Data Sites
Work Program of the Committee on Balance of Payments 3Statistics Continuing in Full Swing
Selected Topics
Major Trends in World Trade and Finance as Reflected 6in the 1996 Balance of Payments Statistics Yearbook
On the Measurement of Financial Derivatives 13
Canada’s Approach for Recording Foreigners’ 17Portfolio Investment in Canadian Bonds
Netherlands’ Quality Control of Balance of 20Payments Statistics
Contents
IMF Balance of Payments Statistics Newsletter • Volume V, Number 1 • June 1997(http://www.imf.org/external/pubs/ft/bop/news/index.htm)
The IMF Balance of Payments Statistics newsletter is pub-lished twice a year by the Statistics Department of theInternational Monetary Fund. The purpose of the newslet-ter is to inform balance of payments data compilers andusers about national and international developments in thecollection of such data. Editions are published in English,French, Spanish, and Russian. The opinions and materialcontained in this newsletter do not necessarily reflect the
official views of the IMF. Draft submissions are welcomeand should be addressed to Anne Y. Kester, Editor, IMFBalance of Payments Statistics Newsletter, Balance ofPayments and External Debt Division II, StatisticsDepartment, Room IS5-300, International Monetary Fund,Washington, D.C. 20431, U.S.A. Telephone: (202) 623-7922 • Fax: (202) 623-8017. Graphic design for thisnewsletter is provided by Isabelle Grohol.
June 1997 3
Work Program of the Committee on Balance ofPayments Statistics Continuing in Full Swing
he IMF Committee on Balance of Payments Statistics is scheduled tohold its annual meeting on October 22–24, 1997. Among other subjects,the Committee will discuss the progress it made during the first half of
1997 on coordinating the international portfolio investment survey, the develop-ment of an international securities database, a survey of direct investmentmethodologies of IMF member countries, and work on the conceptual treatmentof financial derivative transactions.
Coordinated portfolio investment survey
As part of an effort to improve the quality of portfolio investment data,many countries under the auspices of the Committee will conduct a coordinatedsurvey of portfolio investment as of the end of December 1997. The initiativearose because data users and compilers have expressed concerns that with theliberalization of financial markets, financial innovations, and the changing be-havior of investors, balance of payments statistics are failing to measure accu-rately portfolio investment activity. This has been reflected in the global statistics:there is a significant asymmetry between recorded portfolio assets and liabilities.Planning for the survey began in 1994 with the creation of an international taskforce to develop guidelines to assist countries in conducting it. In August 1996,the work of the task force was published in the form of the Survey Guide for theCoordinated Portfolio Investment Survey. It is anticipated that in addition to improv-ing the quality of portfolio investment data, the survey will facilitate cross-coun-try comparisons, permit data exchanges, encourage standardization, and leadcountries to emulate the best statistical practices identified.
Most of the participating countries are well advanced in their preparations.Many have developed survey forms and discussed them with potential respon-dents. During June 18-20, 1996, the IMF’s Statistics Department (STA) convened ameeting in Washington for the national compilers of the participating countries.It afforded compilers an opportunity to exchange their experiences concerningthe preparatory stage of the survey and to review the consistency of the differentapproaches compilers use to address important methodological issues (such asthe treatment of securities involved in repurchase agreements). Consistency isneeded in so far as possible to ensure the comparability of survey results.Participants also discussed the modalities of sharing survey results and the de-velopment of an international securities database, issues that the Committee willrevisit in October 1997.
Development of an international securities database
To help ensure participating countries in the coordinated portfolio invest-ment survey allocate securities geographically on a consistent and accurate basis,the Committee has been examining the possibility of developing an international
T
June 19974
securities database. Significant progress has been made in recent months. TheUfficio Italiano dei Cambi (UIC) has established a database of more than 100,000of the most actively internationally traded securities. National compilers agreedupon specifications for the database at their meeting in September 1996.Compilers subsequently reexamined them in April 1997. The Committee will re-view these developments at its meeting in October and decide how to proceed.While this remains an ambitious project, in part because of the number of securi-ties in existence, it has the potential to improve significantly the quality of thesurvey results.
Survey of direct investment methodology
At its meeting in Singapore in October 1996, the Committee endorsed a pro-posal that the IMF and the Organization for Economic Cooperation andDevelopment (OECD) conduct a joint survey of countries’ metadata (i.e. compre-hensive information on the data) on direct investment income, flows, and stocks.The survey will be timely in view of the increasing importance of multinationalenterprises and their geographical and sectoral diversity. Such factors have stim-ulated interest in foreign direct investment (FDI) statistics among policymakers,analysts, and others. Both the IMF and OECD have a well-known and establishedinterest in FDI statistics because of their maintenance of international databaseson such statistics and their publication of international methodological guide-lines for the measurement of direct investment.
The main purposes of the joint IMF-OECD survey on direct investment arethese:
• To determine the extent to which member countries have imple-mented the recommendations on direct investment statistics advancedin the fifth edition of the IMF’s Balance of Payments Manual (BPM5) andthe third edition of OECD Benchmark Definition of Foreign DirectInvestment;
• To gather metadata on countries’ data sources, collection methods,and reporting practices; and
• To facilitate the exchange of information among countries.
The IMF recently sent a draft survey form for review to the Committee andthe OECD’s Group of Financial Statisticians (GFS). After consultation, includingdiscussions at a meeting of the GFS on April 9–10, 1997, the survey form was ap-proved and dispatched to all OECD and IMF member countries in May 1997. TheIMF requested that countries complete the survey form by mid–July 1997.
One of the aims of the questionnaire design was to minimize the time com-pilers require to complete it, while covering all the major issues. With this inmind, the survey form is presented as a multiple choice questionnaire. This ap-proach standardizes the information to be collected and thereby increases theusefulness of the survey results.
The IMF and OECD plan to review the survey results and produce a jointreport focusing on the comparability and reliability of countries’ FDI statistics.The Committee will receive a status report in October 1997. Copies of the final
Work program initiatives varied,innovative, andpromising
June 1997 5
report on the survey results will be made available to the Committee and OECDand IMF member countries. The IMF and OECD will use the survey data to con-struct a metadatabase on countries’ FDI statistics. The availability of the metadatato compilers and users of FDI statistics will afford a clear understanding of themethodologies used in compiling the data and facilitate analysis of FDI statistics.It will also promote the exchange of information among compilers, encouragingthem to adopt some of the sound practices identified.
Treatment of financial derivatives
In the light of financial market developments, the Committee since 1993 hasbeen reviewing the methodological treatment of financial derivatives. During1996, monetary and national accounts compilers also became involved in thiswork through a meeting of the Informal Group on the Measurement of FinancialDerivatives organized in April 1996 under the IMF’s auspices. They also becameengaged through the meeting of experts on monetary and financial statistics heldat the IMF in Washington in November 1996. The latter meeting was convened inconjunction with the finalization of the IMF’s Manual on Monetary and FinancialStatistics. From the work of these groups has emerged a discussion draft – TheStatistical Measurement of Financial Derivatives. The draft clarifies the conceptualapproach set forth in the 1993 System of National Accounts (1993 SNA) and theBPM5. It also recommends some changes to these guidelines. Most notably, itproposes that net settlement payments on interest rate swaps and forward rateagreements be recorded in the financial, not the current, account. (See also articleon pp. 13–16 of this Newsletter.) The draft was sent to all IMF member countries inApril 1997; the IMF welcomes and encourages comments from countries on theimportant issues raised.
The IMF plans to convene a second meeting of the Informal Group on theMeasurement of Financial Derivatives on September 4–5, 1997, in Washington,D.C., to discuss the draft paper and the comments received from member coun-tries. The IMF expects to present a revised paper to the Committee in October 1997for approval. Thereafter, the paper will be sent to the Intersecretariat WorkingGroup on National Accounts (IWGNA), a group consisting of the United Nations,the IMF, the World Bank, the OECD and the Eurostat. The IWGNA can approvechanges to the recommendations contained in the 1993 SNA.
June 19976
Major Trends in World Trade and Finance asReflected in the 1996 Balance of PaymentsStatistics Yearbook
he 1996 Balance of Payments Statistics Yearbook (1996 Yearbook) was publishedby the IMF in December 1996. It contains detailed tables on the balance of pay-ments statistics of 160 countries and international investment position data of 35
countries. The 1996 Yearbook presents data of individual countries and global aggregatesthrough the year 1995. It also describes the methodologies, compilation practices, and datasources of 110 countries. The expanded coverage of the 1996 Yearbook was highlighted inthe December 1996 issue of the IMF Balance of Payments Statistics Newsletter. In responseto readers’ interest in the major trends in world trade and finance as gleaned from the volu-minous data shown in the Yearbook, this article provides such an analysis1. It also reportson efforts the IMF has undertaken to improve global balance of payments statistics.
Major trends
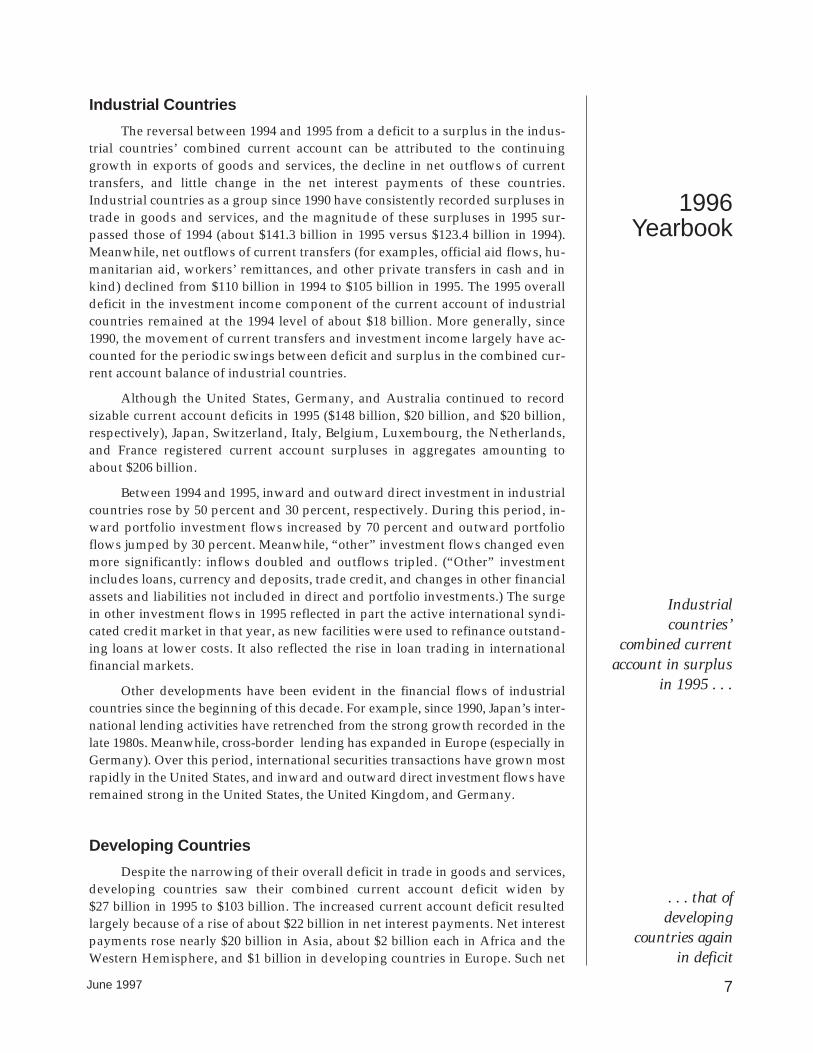
World trade in goods, in U.S. dollars terms, continuing its upward trend in1994, grew nearly 20 percent in 1995, the highest growth rate since 1990. Trade inservices also increased in 1995, by 12 percent. Although this marked a sizable gainfor services trade, the growth rate was well below that of 1990, when services tradegrew by 20 percent (Chart 1). Developing countries of Asia and of Europe ac-counted for much of the 1995 increase in trade in goods and services. Such tradealso grew in industrial countries in 1995, but at a slower rate than in developingones. Developing countries’ share in world trade in goods and services rose from28 percent in 1990 to 32 percent in 1995. Meanwhile, for most industrial and devel-oping countries, external trade in goods and services as a share of their gross do-mestic products rose over the same period.
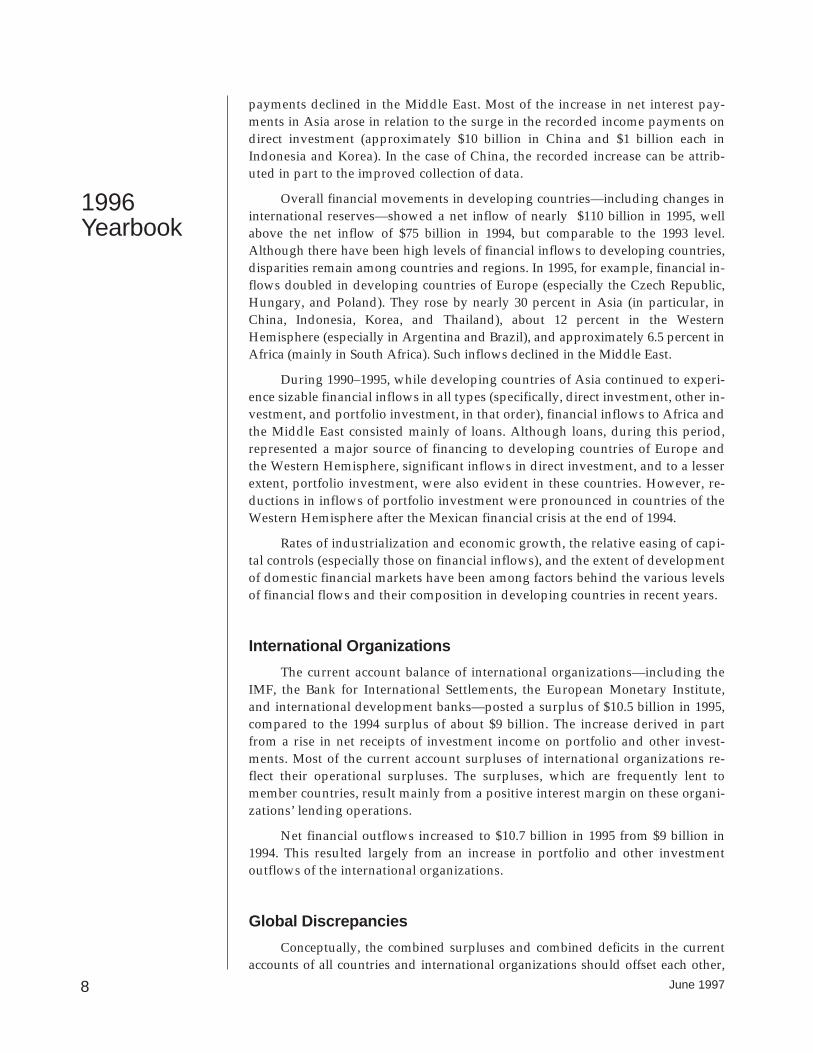
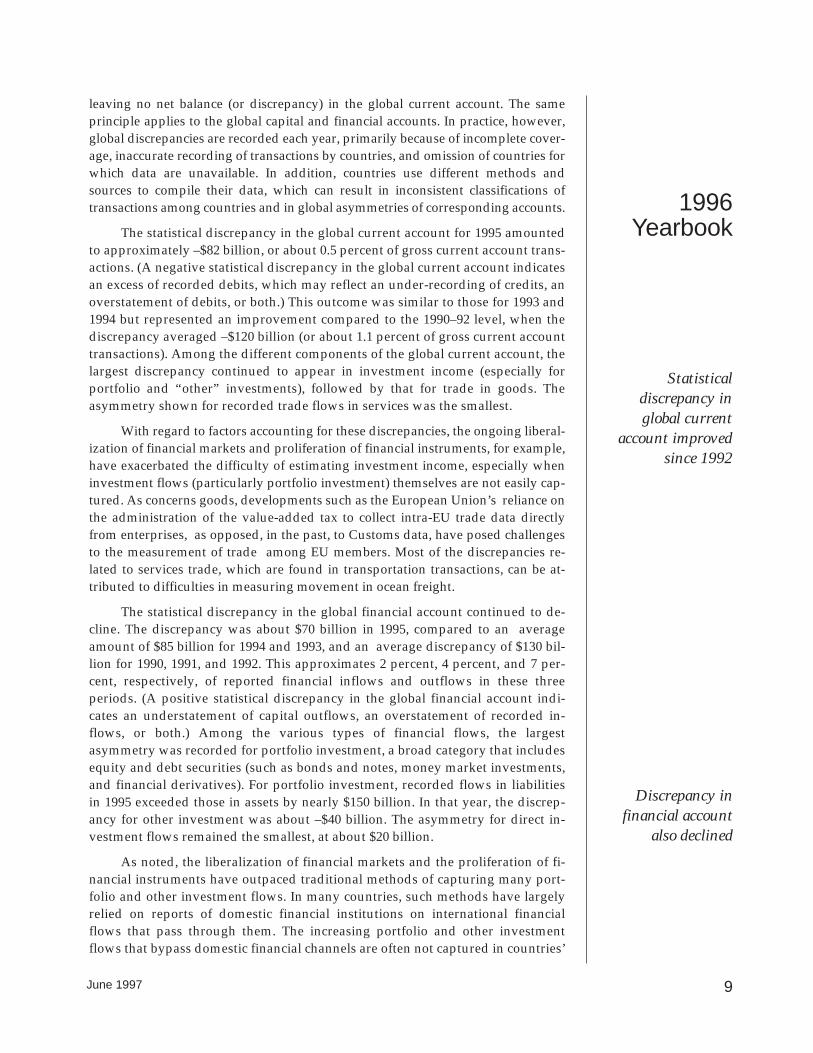
The industrial countries posted a current account surplus of approximately$10.5 billion and net financial outflows of about $30 billion in 1995 (Chart 2). Thiswas in contrast to 1994, when these countries registered a current account deficitof about $11 billion, accompanied by net financial inflows of about $25 billion.The developing countries, including the economies in transition, saw their com-bined current account deficit widen by 35 percent in 1995, while their net finan-cial inflows rose by 45 percent from the 1994 level (Chart 2). In 1995, notableamong financial flows (including direct investment, portfolio investment, otherinvestment, and changes in reserves) were the increases in the absolute value ofreserves in both industrial and developing countries, $80 billion and $118 billion,respectively (Chart 3). These increases reflected the large-scale intervention by se-lected countries (especially Japan, China, and Brazil) facing upward pressure ontheir national currencies and strong capital inflows. To absorb the pressure, thesecountries through their interventions increased their foreign exchange reserves.
Despite improvements countries have made in their data compilations, prob-lems have persisted with incomplete coverage, misclassification of transactions,and other associated difficulties. As will be explained later, these factor have con-tributed to the existing large discrepancies in global balance of payments accounts.
T
SelectedTopics
World trade ingoods and servicessaw substantialgrowth in 1995
1996Yearbook
June 1997 7
Industrial Countries
The reversal between 1994 and 1995 from a deficit to a surplus in the indus-trial countries’ combined current account can be attributed to the continuinggrowth in exports of goods and services, the decline in net outflows of currenttransfers, and little change in the net interest payments of these countries.Industrial countries as a group since 1990 have consistently recorded surpluses intrade in goods and services, and the magnitude of these surpluses in 1995 sur-passed those of 1994 (about $141.3 billion in 1995 versus $123.4 billion in 1994).Meanwhile, net outflows of current transfers (for examples, official aid flows, hu-manitarian aid, workers’ remittances, and other private transfers in cash and inkind) declined from $110 billion in 1994 to $105 billion in 1995. The 1995 overalldeficit in the investment income component of the current account of industrialcountries remained at the 1994 level of about $18 billion. More generally, since1990, the movement of current transfers and investment income largely have ac-counted for the periodic swings between deficit and surplus in the combined cur-rent account balance of industrial countries.
Although the United States, Germany, and Australia continued to recordsizable current account deficits in 1995 ($148 billion, $20 billion, and $20 billion,respectively), Japan, Switzerland, Italy, Belgium, Luxembourg, the Netherlands,and France registered current account surpluses in aggregates amounting toabout $206 billion.
Between 1994 and 1995, inward and outward direct investment in industrialcountries rose by 50 percent and 30 percent, respectively. During this period, in-ward portfolio investment flows increased by 70 percent and outward portfolioflows jumped by 30 percent. Meanwhile, “other” investment flows changed evenmore significantly: inflows doubled and outflows tripled. (“Other” investmentincludes loans, currency and deposits, trade credit, and changes in other financialassets and liabilities not included in direct and portfolio investments.) The surgein other investment flows in 1995 reflected in part the active international syndi-cated credit market in that year, as new facilities were used to refinance outstand-ing loans at lower costs. It also reflected the rise in loan trading in internationalfinancial markets.
Other developments have been evident in the financial flows of industrialcountries since the beginning of this decade. For example, since 1990, Japan’s inter-national lending activities have retrenched from the strong growth recorded in thelate 1980s. Meanwhile, cross-border lending has expanded in Europe (especially inGermany). Over this period, international securities transactions have grown mostrapidly in the United States, and inward and outward direct investment flows haveremained strong in the United States, the United Kingdom, and Germany.
Developing Countries
Despite the narrowing of their overall deficit in trade in goods and services,developing countries saw their combined current account deficit widen by $27 billion in 1995 to $103 billion. The increased current account deficit resultedlargely because of a rise of about $22 billion in net interest payments. Net interestpayments rose nearly $20 billion in Asia, about $2 billion each in Africa and theWestern Hemisphere, and $1 billion in developing countries in Europe. Such net
Industrial countries’
combined currentaccount in surplus
in 1995 . . .
1996Yearbook
. . . that of developing
countries again in deficit
June 19978
payments declined in the Middle East. Most of the increase in net interest pay-ments in Asia arose in relation to the surge in the recorded income payments ondirect investment (approximately $10 billion in China and $1 billion each inIndonesia and Korea). In the case of China, the recorded increase can be attrib-uted in part to the improved collection of data.
Overall financial movements in developing countries—including changes ininternational reserves—showed a net inflow of nearly $110 billion in 1995, wellabove the net inflow of $75 billion in 1994, but comparable to the 1993 level.Although there have been high levels of financial inflows to developing countries,disparities remain among countries and regions. In 1995, for example, financial in-flows doubled in developing countries of Europe (especially the Czech Republic,Hungary, and Poland). They rose by nearly 30 percent in Asia (in particular, inChina, Indonesia, Korea, and Thailand), about 12 percent in the WesternHemisphere (especially in Argentina and Brazil), and approximately 6.5 percent inAfrica (mainly in South Africa). Such inflows declined in the Middle East.
During 1990–1995, while developing countries of Asia continued to experi-ence sizable financial inflows in all types (specifically, direct investment, other in-vestment, and portfolio investment, in that order), financial inflows to Africa andthe Middle East consisted mainly of loans. Although loans, during this period,represented a major source of financing to developing countries of Europe andthe Western Hemisphere, significant inflows in direct investment, and to a lesserextent, portfolio investment, were also evident in these countries. However, re-ductions in inflows of portfolio investment were pronounced in countries of theWestern Hemisphere after the Mexican financial crisis at the end of 1994.
Rates of industrialization and economic growth, the relative easing of capi-tal controls (especially those on financial inflows), and the extent of developmentof domestic financial markets have been among factors behind the various levelsof financial flows and their composition in developing countries in recent years.
International Organizations
The current account balance of international organizations—including theIMF, the Bank for International Settlements, the European Monetary Institute,and international development banks—posted a surplus of $10.5 billion in 1995,compared to the 1994 surplus of about $9 billion. The increase derived in partfrom a rise in net receipts of investment income on portfolio and other invest-ments. Most of the current account surpluses of international organizations re-flect their operational surpluses. The surpluses, which are frequently lent tomember countries, result mainly from a positive interest margin on these organi-zations’ lending operations.
Net financial outflows increased to $10.7 billion in 1995 from $9 billion in1994. This resulted largely from an increase in portfolio and other investmentoutflows of the international organizations.
Global Discrepancies
Conceptually, the combined surpluses and combined deficits in the currentaccounts of all countries and international organizations should offset each other,
1996Yearbook
June 1997 9
leaving no net balance (or discrepancy) in the global current account. The sameprinciple applies to the global capital and financial accounts. In practice, however,global discrepancies are recorded each year, primarily because of incomplete cover-age, inaccurate recording of transactions by countries, and omission of countries forwhich data are unavailable. In addition, countries use different methods andsources to compile their data, which can result in inconsistent classifications oftransactions among countries and in global asymmetries of corresponding accounts.
The statistical discrepancy in the global current account for 1995 amountedto approximately –$82 billion, or about 0.5 percent of gross current account trans-actions. (A negative statistical discrepancy in the global current account indicatesan excess of recorded debits, which may reflect an under-recording of credits, anoverstatement of debits, or both.) This outcome was similar to those for 1993 and1994 but represented an improvement compared to the 1990–92 level, when thediscrepancy averaged –$120 billion (or about 1.1 percent of gross current accounttransactions). Among the different components of the global current account, thelargest discrepancy continued to appear in investment income (especially forportfolio and “other” investments), followed by that for trade in goods. Theasymmetry shown for recorded trade flows in services was the smallest.
With regard to factors accounting for these discrepancies, the ongoing liberal-ization of financial markets and proliferation of financial instruments, for example,have exacerbated the difficulty of estimating investment income, especially wheninvestment flows (particularly portfolio investment) themselves are not easily cap-tured. As concerns goods, developments such as the European Union’s reliance onthe administration of the value-added tax to collect intra-EU trade data directlyfrom enterprises, as opposed, in the past, to Customs data, have posed challengesto the measurement of trade among EU members. Most of the discrepancies re-lated to services trade, which are found in transportation transactions, can be at-tributed to difficulties in measuring movement in ocean freight.
The statistical discrepancy in the global financial account continued to de-cline. The discrepancy was about $70 billion in 1995, compared to an averageamount of $85 billion for 1994 and 1993, and an average discrepancy of $130 bil-lion for 1990, 1991, and 1992. This approximates 2 percent, 4 percent, and 7 per-cent, respectively, of reported financial inflows and outflows in these threeperiods. (A positive statistical discrepancy in the global financial account indi-cates an understatement of capital outflows, an overstatement of recorded in-flows, or both.) Among the various types of financial flows, the largestasymmetry was recorded for portfolio investment, a broad category that includesequity and debt securities (such as bonds and notes, money market investments,and financial derivatives). For portfolio investment, recorded flows in liabilitiesin 1995 exceeded those in assets by nearly $150 billion. In that year, the discrep-ancy for other investment was about –$40 billion. The asymmetry for direct in-vestment flows remained the smallest, at about $20 billion.
As noted, the liberalization of financial markets and the proliferation of fi-nancial instruments have outpaced traditional methods of capturing many port-folio and other investment flows. In many countries, such methods have largelyrelied on reports of domestic financial institutions on international financialflows that pass through them. The increasing portfolio and other investmentflows that bypass domestic financial channels are often not captured in countries’
Statistical discrepancy inglobal current
account improvedsince 1992
Discrepancy in financial account
also declined
1996Yearbook
June 199710
balance of payments. In addition, as countries’ financial activities become moreglobalized, cross-border financial transactions increasingly represent capitalflows among worldwide offices and branches of countries’ financial institutions.These developments have complicated the identification of transactions betweenresidents and nonresidents, the basic concept underlying the balance of pay-ments accounts.
IMF initiatives to improve balance of payments statistics
Although the statistical imbalances in the global current and financial ac-counts of the balance of payments have declined in recent years, significant dis-crepancies persist in a number of the components. This is notably the case for theinvestment income component in the current account and the portfolio and otherinvestment flows in the financial account.
In a major effort to improve countries’ data on cross-border portfolio in-vestment and related income flows, the IMF, in collaboration with participatingcountries, is coordinating a survey of international portfolio investment. The sur-vey requires participating countries to collect comprehensive data on their resi-dents’ ownership of foreign securities (equities and long-term bonds and notes)as of December 31, 1997. The purpose of the survey is to improve statistics oncross-border ownership of securities as well as of associated financial flows andinvestment income. (See also article on p. 3.)
The IMF also encourages countries to use international banking statisticscompiled by the Bank for International Settlements (BIS) to enhance their esti-mates of “other” investment flows in balance of payments. The BIS data containan extensive array of detail on banks’ international assets and liabilities; data arereported on total and nonbank positions by country and currency. The reportedassets include deposits and balances placed with nonresident banks (includingbanks’ own related offices) and loans and advances to foreign bank and nonbankcustomers. Similarly, on the liability side, they take account of deposits and loansreceived from nonresident banks and nonbanks. By aggregating the reporteddata on a country-by-country basis, the BIS is able to derive a statistical series onthe external positions of banks vis-à-vis the bank and nonbank sectors in some200 individual countries. (See also IMF Balance of Payments Statistics Newsletter,June 1996, pp. 11–15.)
In addition, beginning with the 1996 Balance of Payments Statistics Yearbook(Yearbook), the IMF for the first time presents descriptions of methodologies, com-pilation practices, and data sources that individual member countries employ incompiling their balance of payments. These technical reviews are provided bycountries. They are designed to facilitate readers’ use of the data presented in theYearbook and to enhance their understanding of the data coverage, as well as datalimitations. They are also intended to inform national balance of payments com-pilers of the data sources and compilation practices of their counterparts in othercountries. In this way, the reviews should help to foster cooperation and the ex-change of ideas among national compilers. The reviews also should encouragethem to improve their data.
1An abridged version of the analysis appeared in the February 10, 1997 issue of the IMF Survey.
Greater effortsneeded to close statistical gaps inspecific areas
1996Yearbook
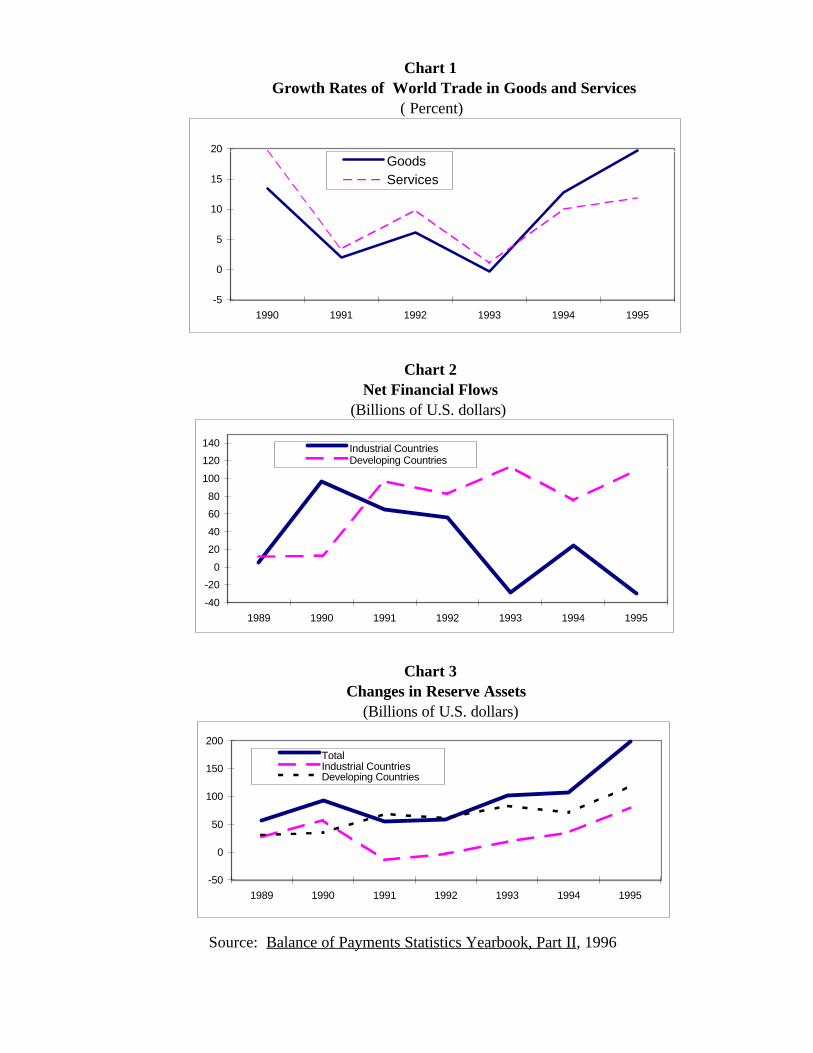
Chart 1 Growth Rates of World Trade in Goods and Services
( Percent)
Chart 2 Net Financial Flows (Billions of U.S. dollars)
Chart 3 Changes in Reserve Assets (Billions of U.S. dollars)
-50
0
50
100
150
200
1989 1990 1991 1992 1993 1994 1995
TotalIndustrial CountriesDeveloping Countries
-40
-20
0
20
40
60
80
100
120
140
1989 1990 1991 1992 1993 1994 1995
Industrial CountriesDeveloping Countries
-5
0
5
10
15
20
1990 1991 1992 1993 1994 1995
GoodsServices
Source: Balance of Payments Statistics Yearbook, Part II, 1996
June 199712
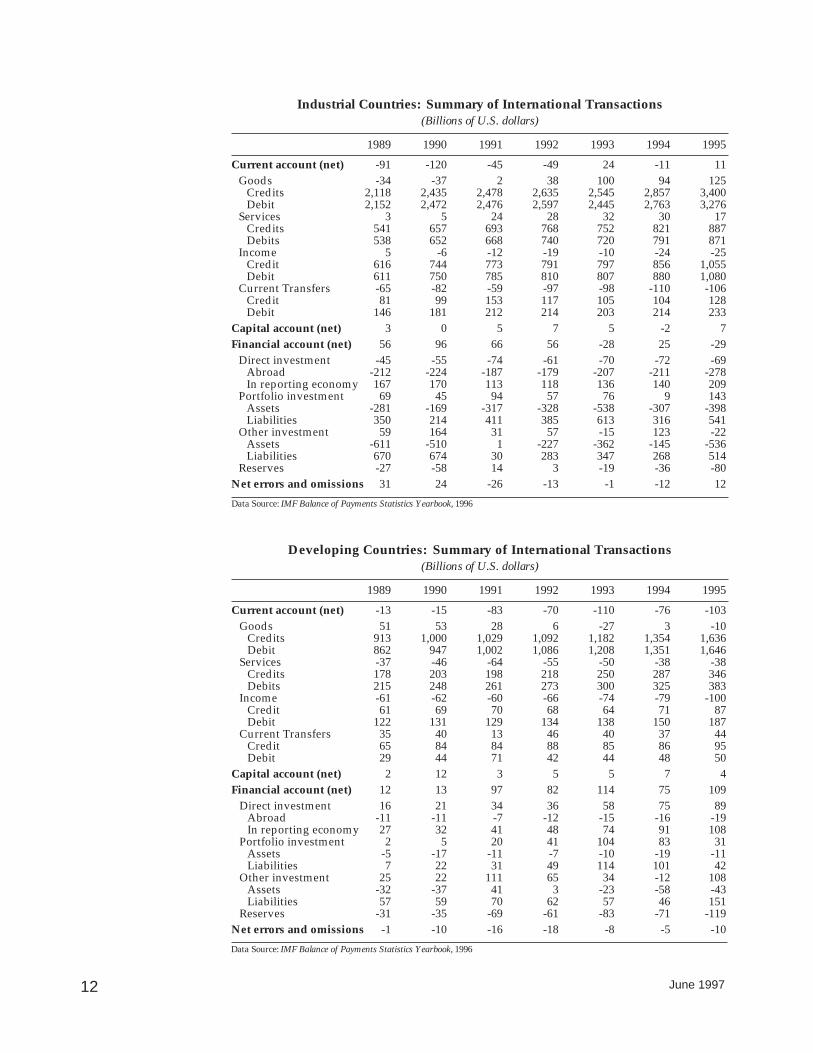
Industrial Countries: Summary of International Transactions(Billions of U.S. dollars)
1989 1990 1991 1992 1993 1994 1995
Current account (net) -91 -120 -45 -49 24 -11 11Goods -34 -37 2 38 100 94 125
Credits 2,118 2,435 2,478 2,635 2,545 2,857 3,400Debit 2,152 2,472 2,476 2,597 2,445 2,763 3,276
Services 3 5 24 28 32 30 17Credits 541 657 693 768 752 821 887Debits 538 652 668 740 720 791 871
Income 5 -6 -12 -19 -10 -24 -25Credit 616 744 773 791 797 856 1,055Debit 611 750 785 810 807 880 1,080
Current Transfers -65 -82 -59 -97 -98 -110 -106Credit 81 99 153 117 105 104 128Debit 146 181 212 214 203 214 233
Capital account (net) 3 0 5 7 5 -2 7Financial account (net) 56 96 66 56 -28 25 -29
Direct investment -45 -55 -74 -61 -70 -72 -69Abroad -212 -224 -187 -179 -207 -211 -278In reporting economy 167 170 113 118 136 140 209
Portfolio investment 69 45 94 57 76 9 143Assets -281 -169 -317 -328 -538 -307 -398Liabilities 350 214 411 385 613 316 541
Other investment 59 164 31 57 -15 123 -22Assets -611 -510 1 -227 -362 -145 -536Liabilities 670 674 30 283 347 268 514
Reserves -27 -58 14 3 -19 -36 -80Net errors and omissions 31 24 -26 -13 -1 -12 12
Developing Countries: Summary of International Transactions(Billions of U.S. dollars)
1989 1990 1991 1992 1993 1994 1995
Current account (net) -13 -15 -83 -70 -110 -76 -103Goods 51 53 28 6 -27 3 -10
Credits 913 1,000 1,029 1,092 1,182 1,354 1,636Debit 862 947 1,002 1,086 1,208 1,351 1,646
Services -37 -46 -64 -55 -50 -38 -38Credits 178 203 198 218 250 287 346Debits 215 248 261 273 300 325 383
Income -61 -62 -60 -66 -74 -79 -100Credit 61 69 70 68 64 71 87Debit 122 131 129 134 138 150 187
Current Transfers 35 40 13 46 40 37 44Credit 65 84 84 88 85 86 95Debit 29 44 71 42 44 48 50
Capital account (net) 2 12 3 5 5 7 4Financial account (net) 12 13 97 82 114 75 109
Direct investment 16 21 34 36 58 75 89Abroad -11 -11 -7 -12 -15 -16 -19In reporting economy 27 32 41 48 74 91 108
Portfolio investment 2 5 20 41 104 83 31Assets -5 -17 -11 -7 -10 -19 -11Liabilities 7 22 31 49 114 101 42
Other investment 25 22 111 65 34 -12 108Assets -32 -37 41 3 -23 -58 -43Liabilities 57 59 70 62 57 46 151
Reserves -31 -35 -69 -61 -83 -71 -119Net errors and omissions -1 -10 -16 -18 -8 -5 -10
Data Source: IMF Balance of Payments Statistics Yearbook, 1996
Data Source: IMF Balance of Payments Statistics Yearbook, 1996
June 1997 13
On the Measurement of Financial Derivatives
n April 1997, the Statistics Department of the IMF circulated to statistical agencies inall IMF member countries a discussion draft for comment on the Statistical Mea-surement of Financial Derivatives. The discussion draft is intended to be a comprehen-
sive document that will clarify and amplify the guidelines on financial derivatives containedin the 1993 System of National Accounts (1993 SNA) and fifth edition of the IMF’s Balanceof Payments Manual (BPM5). The draft includes examples of how to treat certain transac-tions and positions in financial derivatives. It also provides a glossary of terms.
In many respects, the draft endorses the key recommendations of the 1993 SNAand BPM5. It notes that financial derivatives should be treated as financial assets andthat such transactions should, in general, be treated as separate transactions, rather thanas integral parts of the underlying financial assets from which they are derived.Nonetheless, it recommends that some changes be made to the 1993 SNA and BPM5guidelines. Most notably, it proposes that net settlement payments on interest rateswaps and forward rate agreements be recorded in the financial account, as opposed tothe current account. This article summarizes the main conclusions of the discussiondraft and explains their rationale.
What are financial derivatives?
The discussion draft refines the description of financial derivatives as setforth in the 1993 SNA. According to the draft, “Financial derivatives are financialinstruments that are linked to a specific financial instrument or indicator or com-modity, and which involve the trading of financial risk. Financial derivatives areused for a number of purposes including risk management, hedging, and specu-lation.1 Unlike debt instruments, no principal amount is advanced to be repaid;no investment income accrues. The value of a financial derivative derives fromthe price of an underlying item.”
As compared with the description of financial derivatives in the 1993 SNA,a significant addition here is that of “trading of financial risk.” For instance, par-ties to a swap arrangement exchange their risk exposure, and by creating newcontracts with third parties can further trade the risk underlying the swap to oth-ers. Similarly, other forward-type contracts and options are instruments throughwhich financial risk can be traded from one party to another. In short, financialderivatives enable parties to trade risk to other entities who view the same riskdifferently. Moreover, financial derivatives contracts are usually settled by netpayments of cash—often before maturity in the case of exchange-traded contractssuch as commodity futures—and they do not require ownership or delivery of anunderlying item. This logically follows from the use of derivatives to transfer riskindependently of the ownership of the underlying item.
To clarify what a financial derivative instrument is for statistical purposes,the discussion draft provides examples of what are not financial derivative in-struments for statistical purposes. These include:
• Fixed price contracts, if the main purpose of the contract is to deliveran underlying item in exchange for cash (or some other asset). For
I
Financial derivatives are
instruments that,among other
things, provide forthe trading of financial risk
FinancialDerivatives
instance, a commercial contract to deliver a commodity is not a finan-cial derivative unless, as is the case with commodity futures, it istraded as a standardized contract on an exchange so that financial riskcan be traded.
• Timing delays arising in the normal course of business, which mayentail exposure to price movements. Such timing delays include nor-mal settlement periods for spot transactions in financial markets andthose that arise in the normal course of trade in goods and services.
• Insurance because its purpose is not to facilitate trading of financialrisk but rather to provide individual institutional units exposed to cer-tain risks with financial protection against the consequences of the oc-currence of specified events.
• Contingencies, such as guarantees and letters of credit because theirpurpose is not to facilitate the trading of financial risk but rather tomake payments under specified conditions.
• Embedded derivative-like features of standard financial instrumentsthat are an inseparable part of the underlying instrument because therisk element cannot be separately traded.
Which financial derivatives are financial assets?
To distinguish financial assets from other financial arrangements that arenot assets, the 1993 SNA notes that most financial assets involve unconditional re-lationships between debtors and creditors. Arrangements that are conditional toone or both parties are generally to be excluded from financial assets, although aconditional arrangement can be a financial asset if the arrangement itself hasmarket value. “Tradeability” is, of course, a sufficient condition for demonstrat-ing value, but it is not a necessary condition. The 1993 SNA does not specify othermeans for determining value but does allow for them, for example, in the case ofa “nontradeable” arrangement that can give rise to holding gains and losses.
A key characteristic of most derivatives contracts is that transactors committhemselves forward to an agreed price or set of prices at which they will, or arewilling to, transact in an underlying “asset.” The value of a financial derivativederives from the difference between the agreed contract price(s) and the prevail-ing, or expected prevailing, market price(s), appropriately discounted, and in thecase of options taking into account potential volatility of the price of the underly-ing instrument, the time to maturity, and interest rates. More details on howvalue is established for financial derivatives are set out in the discussion paper.
Of course, to calculate the value of any financial derivative instrument it isessential that a prevailing market price for the underlying item be observable. Itis no coincidence that the most frequently traded over-the-counter financial de-rivatives—interest rate swaps, forward rate agreements (FRAs), foreign currencyswaps, and forward foreign exchange contracts—are based on underlying itemsfor which prevailing market prices are readily observable. These are common fi-nancial risks to be “managed,” and they can be readily valued. The draft suggeststhat, in the absence of an observable price for the underlying item, the “financial
June 199714
FinancialDerivatives
June 1997 15
derivative” cannot be valued, cannot be regarded as a store of value, and thuscannot be regarded as a financial asset.
Treatment of selected instruments
The draft considers the treatment of specific financial derivative instru-ments:
• Interest rate swaps, FRAs, foreign currency swaps, and forward for-eign exchange contracts. The draft proposes that all transactions inthese instruments be recognized as financial assets because they arestores of value and can generate holding gains and losses. The draftproposes that net settlements of interest rate swaps, FRAs, and the in-terest component of currency swaps be recorded in the financial ac-count, not in the current account, of the balance of payments.
• Credit derivatives, a relatively new group of instruments. The draftconcludes that there is no inherent reason why a credit derivative can-not be classified as a financial asset, but classification depends uponthe characteristics of the specific instrument in question.
Treatment of margin payments
In the 1993 SNA (paragraph 11.40) a distinction is made between “initial”and “variation” margin, reflecting common terminology in organized financialderivatives markets. However, as the use of margin or collateral has becomemore prevalent in financial markets and as different institutional arrangementsexist in different markets, it has become apparent that the terms “initial” and“variation” have limited applicability. They can convey different meanings todifferent compilers. As a consequence, in order to clarify, rather than revise therecommendations contained in the 1993 SNA and BPM5, the draft emphasizesthe terms “repayable” and “nonrepayable” margins. A repayable margin resem-bles an initial margin, and a nonrepayable margin resembles a variation margin.
A repayable margin is a margin or collateral that remains under the owner-ship of the entity that deposits the margin. While the use of the margin/collat-eral may be restricted, if the entity depositing the margin retains the risks andrewards of ownership, such as the right to receive dividends, coupons, and/orinterest from the debtor, it still owns the margin. The discussion draft suggeststhat the type of financial asset being deposited as a repayable margin determineswhether entries are required in the national accounts. When repayable margindeposits are made in “currency and deposits,” transactions are recorded in thefinancial account under “currency and deposits.” When repayable margin de-posits are made in noncash assets, such as securities, no transactions arerecorded in the national accounts. This is because there has been no change inownership of these assets
A nonrepayable margin is a margin or collateral that once paid is no longerowned by the entity that pays the margin: that entity no longer has the right tothe risks and rewards of ownership, such as receiving dividends, coupons,
Treatment andclassification
issues merit close attention
FinancialDerivatives
June 199716
and/or interest from the debtor. The discussion draft suggests that the paymentof a nonrepayable margin will always require entries in the national accounts be-cause a change in ownership of the asset has occurred.
Classification issues
In the 1993 SNA, all financial derivative contracts that are financial assetsare included under “securities other than shares.” Within the balance of pay-ments, BPM5 recommends that financial derivative transactions and positionsshould primarily be included under “portfolio investment.” However, if a mone-tary authority owns or transacts in financial derivative assets and the assets meetthe criteria of a reserve asset, such transactions and positions could be includedunder “reserve assets.” Alternatively, if the transactors are in a direct investmentrelationship, such transactions and positions are to be recorded under “direct in-vestment.” The discussion draft suggests that financial derivatives could be rec-ognized as a separate instrument category of financial assets in the nationalaccounts and as a separate functional group in the balance of payments, reflect-ing their distinct characteristics.
1The use of financial derivatives can reduce transaction costs and/or facilitate price discovery.
FinancialDerivatives
Canada’s Approach for Recording Foreigners’Portfolio Investment in Canadian Bonds
oreign holdings of Canadian bonds represent a substantial portion of Canada'sexternal liabilities. For this reason, Statistics Canada has developed an elaboratestatistical system for recording such holdings. The Canadian system is noted for
the detailed information it elicits on each bond. This includes the name, sector, and indus-trial classification of the Canadian issuer; the dates of issue and of maturity, the currencyof issue, the interest rate, the timing of payments of interest, etc.; the identification of for-eign holders according to their respective country of residence or at least by broad geo-graphical area and whether or not they are related to the Canadian issuer.
The major features of the Canadian statistical system for recording nonresidents’holdings of Canadian bonds include the various prices used to value bonds, the calcula-tion of income, the derivation of capital transactions, the reconciliation between financialtransactions and the positions outstanding, and the commissions incurred from issuingand trading Canadian bonds. This article, contributed by Lucie Laliberté of StatisticsCanada, describes how these four features form an integral part of the system.
Bond Pricing
In the Canadian statistical system, four prices are maintained on bonds:issue prices, maturity prices, the book value of the issuer, and market prices atyear-ends.
The issue price represents the proceeds received by the issuer when issuingthe bond. The maturity price is the amount the issuer will pay the holder on thedate of redemption of the bond. The book value tracks the costs of the issuer, thatis, the issue price plus the accrued interest on the bond. The accrued interest iscalculated as the accrual of the coupon plus the accrual of the difference betweenthe issue price and the maturity price.
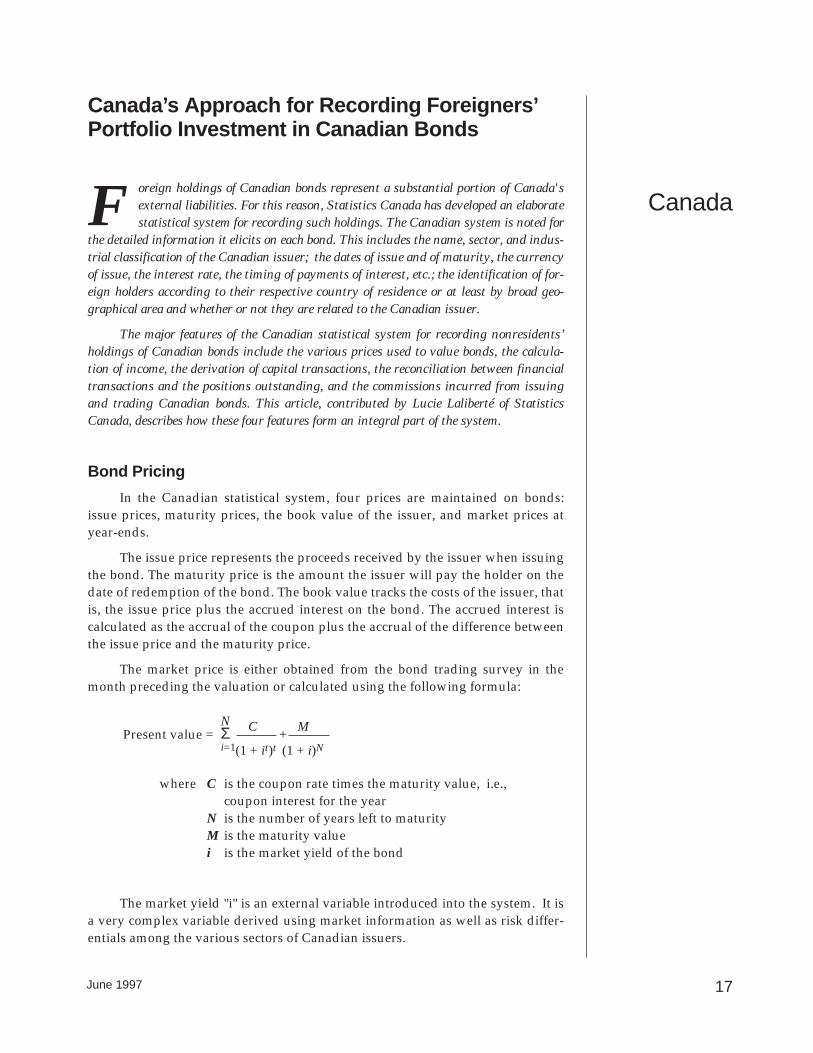
The market price is either obtained from the bond trading survey in themonth preceding the valuation or calculated using the following formula:
N C MPresent value = Σ +i=1(1 + it)t (1 + i)N
where C is the coupon rate times the maturity value, i.e., coupon interest for the year
N is the number of years left to maturityM is the maturity valuei is the market yield of the bond
The market yield "i" is an external variable introduced into the system. It isa very complex variable derived using market information as well as risk differ-entials among the various sectors of Canadian issuers.
June 1997 17
CanadaF
Investment income from holding bonds
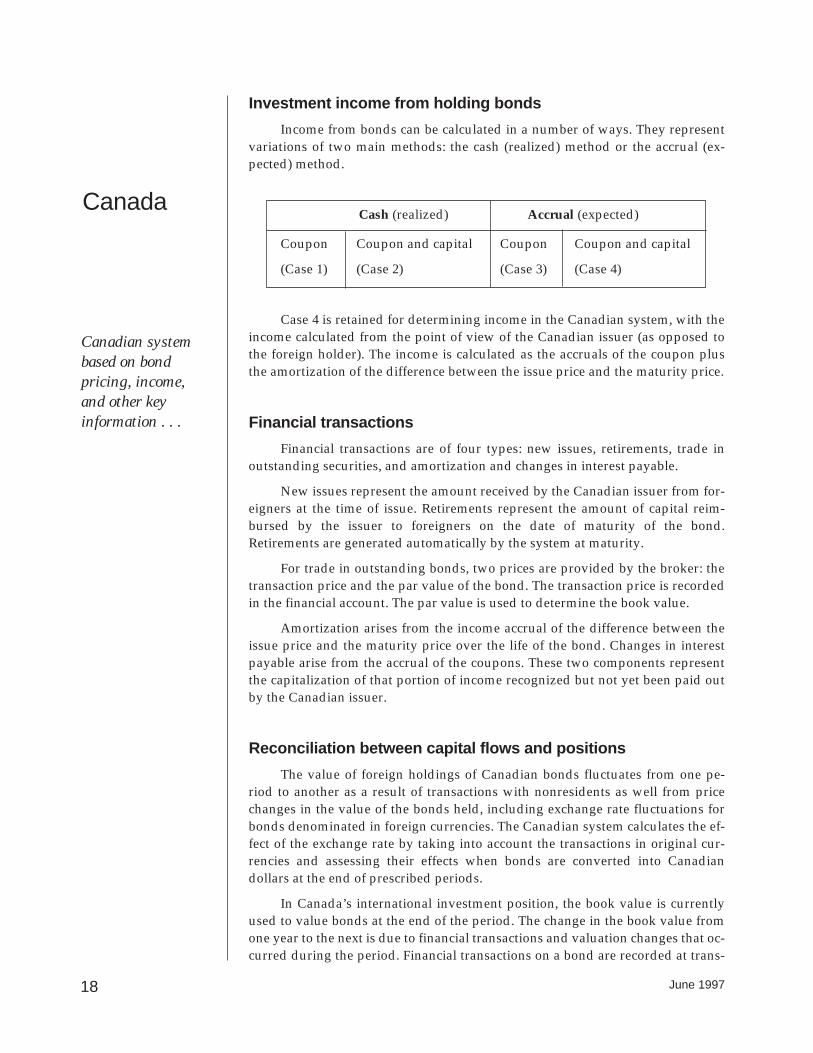
Income from bonds can be calculated in a number of ways. They representvariations of two main methods: the cash (realized) method or the accrual (ex-pected) method.
Cash (realized) Accrual (expected)
Coupon Coupon and capital Coupon Coupon and capital
(Case 1) (Case 2) (Case 3) (Case 4)
Case 4 is retained for determining income in the Canadian system, with theincome calculated from the point of view of the Canadian issuer (as opposed tothe foreign holder). The income is calculated as the accruals of the coupon plusthe amortization of the difference between the issue price and the maturity price.
Financial transactions
Financial transactions are of four types: new issues, retirements, trade inoutstanding securities, and amortization and changes in interest payable.
New issues represent the amount received by the Canadian issuer from for-eigners at the time of issue. Retirements represent the amount of capital reim-bursed by the issuer to foreigners on the date of maturity of the bond.Retirements are generated automatically by the system at maturity.
For trade in outstanding bonds, two prices are provided by the broker: thetransaction price and the par value of the bond. The transaction price is recordedin the financial account. The par value is used to determine the book value.
Amortization arises from the income accrual of the difference between theissue price and the maturity price over the life of the bond. Changes in interestpayable arise from the accrual of the coupons. These two components representthe capitalization of that portion of income recognized but not yet been paid outby the Canadian issuer.
Reconciliation between capital flows and positions
The value of foreign holdings of Canadian bonds fluctuates from one pe-riod to another as a result of transactions with nonresidents as well from pricechanges in the value of the bonds held, including exchange rate fluctuations forbonds denominated in foreign currencies. The Canadian system calculates the ef-fect of the exchange rate by taking into account the transactions in original cur-rencies and assessing their effects when bonds are converted into Canadiandollars at the end of prescribed periods.
In Canada’s international investment position, the book value is currentlyused to value bonds at the end of the period. The change in the book value fromone year to the next is due to financial transactions and valuation changes that oc-curred during the period. Financial transactions on a bond are recorded at trans-
June 199718
Canada
Canadian systembased on bond pricing, income,and other key information . . .
actions prices1 but the position is priced at the book value. It is therefore neces-sary to calculate the difference between the transaction prices and the book valuefor all the financial transactions of the period. This is a first valuation change. Inaddition, for transactions on bonds denominated in foreign currencies, it is alsonecessary to calculate the difference between the exchange rate used for transac-tions and that used to value the bonds at the end of the period. Finally, it is alsonecessary to calculate the difference between the exchange rate used to convertforeign currency bonds which were outstanding at the end of the previous periodand which are still outstanding at the end of the next period.
Commissions
Commissions are calculated on two types of transactions: at issue and fortrading in the secondary market. Income is generated at the time of issue fromcommissions paid by Canadian issuers to foreign financial intermediaries for is-suing their bonds in foreign markets. Commission income is also generated ontrading Canadian bonds with nonresidents, with Canadian financial intermedi-aries earning commissions from both the foreign sellers and the foreign buyers ofCanadian bonds.
Summary
In the Canadian statistical system, foreign holdings of Canadian bonds arevalued according to four prices. First, the issue price is maintained to derive theamount of new issues and, if the issue price differs from the maturity price, to ac-crue this difference as income. Second, the maturity price is also maintained toderive the amount of retirements and to compile the income arising fromcoupons as well as from the difference, if any, between the issue and maturityprices. The book value of the Canadian issuers is maintained to track the incomeexpense incurred by Canadian issuers that has not been paid out. Finally, themarket price is also maintained in the Canadian system on the basis of market ob-servations, when available, or calculation otherwise.
The investment income on foreign holding of Canadian bonds is calculatedas that incurred by the Canadian issuer. Income on commissions is calculated fornew issues (i.e. incurred by the issuer) as well as for trading in the secondarymarket (i.e., earned by both Canadian and nonresident intermediaries).
The degree of detail maintained and the flexibility of the Canadian systemmake it possible to generate many more variables than have been covered in thisarticle. An additional variable generated include the funds that will be needed toservice the debt in the years to come, taking into account the coupons to be paid aswell as the retirements that are expected. The system enables one to analyze theterm to maturity of the debt and its evolution throughout the years. It is also possi-ble to derive a weighted coupon rate on the external bond liability or the size of theforeign versus domestic currency portion of bonds held by nonresidents.
June 1997 19
Canada
. . . yielding detailed data on
nonresidents’ holdings of
Canadian bonds
1The transaction effectively occured at the market price which prevailed at the time the transac-tion occured. To the extent that there are several transactions on a bond during a period, therewill be as many market prices as there are transactions. This is why the term “transaction prices”is used to stress the fact that there may be more than one market price.
Netherlands’ Quality Control of Balance ofPayments Statistics
ata quality is fundamental to the usefulness of economic and financial statis-tics. Data quality has many aspects. Among them are (1) reliability, that is,not subject to many substantial revisions; (2) accuracy, that is, the approxima-
tion of “true” figures; (3) timeliness; (4) consistency with other statistical measures; (5)international comparability; (6) easy access to the data by the public; and (7) trans-parency, that is, good documentation of the methodology used to compile the data anddata sources. To enhance the usefulness of their balance of payments data, countries aredeveloping various quality control mechanisms. This article discusses new data qualitycontrol initiatives the Netherlands has introduced. It is the second article that addressesthe issue of the quality of balance of payments statistics that has appeared in thisNewsletter. Previously, this Newsletter presented an article on the quality control meth-ods of Australian compilers. (See IMF Balance of Payments Statistics Newsletter,December 1996, pp.16-19.)
The Netherlands is making major changes to its balance of payments compilationsystem as it prepares for European Monetary Union (EMU), strives to promote interna-tional harmonization of statistics, and works with a selected group of major respondents.Moreover, the country is gradually transforming its “closed” reporting system into a“semi-open” one. This will afford balance of payments compilers the prospect of exploit-ing related data sources and cooperating more closely with compilers of national ac-counts. The considerable growth in Netherlands’ volume of balance of paymentstransactions and the reporting burden on respondents, especially since the mid-1980swith the liberalization of capital markets, also have given impetus to changes made to theNetherlands’ compilation system. One major innovation in the Netherlands’ compilationsystem is the introduction of new quality control tools in the form of a meta informationsystem (MIS), which has been integrated into an automated compilation process. TheMIS provides profiles of respondents and operational updates on the compilation process.It is used to reduce the impact of nonresponses and late responses and, more generally, toupgrade the quality of the balance of payments data. The new compilation procedures areintended to provide a better tradeoff between timeliness and reliability of data. The compi-lation process is monitored from its beginning, i.e., upon receipt of data from individualrespondents, to its end, i.e., the publication of the aggregate data. The transition to thenew system is to take place over several years.
This article is an edited and abridged version of a paper provided by P. Kramer ofthe Nederlandsche Bank. It is based on observations of the bank staff and on findings of atask force on balance of payments statistics of the Statistical Information and ReportingDepartment of the Nederlandsche Bank, which Mr. Kramer supervised.
Introduction
In the Netherlands, a variety of features of quality are monitored in con-junction with the balance of payments compilation process. Quality control dur-ing the compilation of statistics is essential to ensure the quality of aggregatedata. An assumption is made that superior quality data will be comparable on an
June 199720
Netherlands D
international basis and across related domestic statistical sets. Furthermore, errors and omissions, including reporting errors, will be smaller, and data revi-sions, not large or less frequent.
In the Netherlands, discrepancies now exist both on a bilateral level andwithin national data sets. For example, in comparing Dutch and German balanceof payments data, Dutch exports to Germany do not equate with German im-ports from the Netherlands. To minimize such quantitative international discrep-ancies, compilers have to work together to harmonize bilaterally andmultilaterally specific definitions and concepts. (See IMF Balance of PaymentsStatistics Newsletter, June 1996.)
Within the Netherlands, quantitative differences exist among related na-tional statistical sets, such as discrepancies between balance of payments andmoney and banking statistics for items that are supposed to measure the samephenomena. Steps to reconcile money and banking and balance of payments sta-tistics with national accounts are under way in the Netherlands. Such efforts in-volve the adoption of common methodologies (for example, the 1993 Systems ofNational Accounts (1993 SNA) and the fifth edition of the IMF Balance of PaymentsManual (BPM5)) and common data sources for the different data sets.
More important, Dutch balance of payments data are updated many times.The Dutch compilers are now monitoring the frequency, magnitude, and pat-terns of the data revisions. They find that for most items, the preliminary obser-vations show large underestimates, compared to revised ones; that revisions inthe financial account items are larger and more erratic than those in the currentaccount components; and that preliminary and final estimates often move in op-posite directions.
The Dutch compilers have noted that underestimation is caused by nonre-sponses and late responses, as well as delayed processing of individual balanceof payments returns. They have concluded that improved reporting and process-ing can help to reduce underestimation.
Key methods the Dutch compilers are introducing to enhance the quality ofbalance of payments data are described below.
Old versus new compilation methods and quality control tools
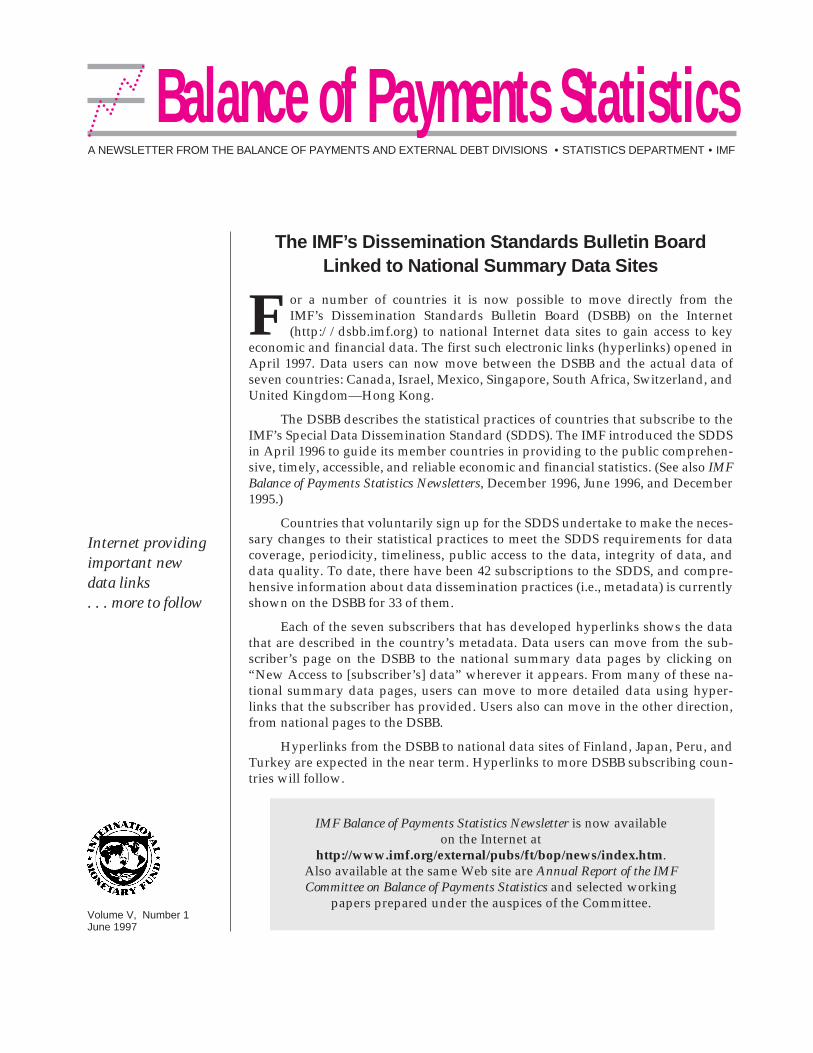
The development of new quality control measures in the Netherlands isgoing hand in hand with the gradual transition of the compilation process from a“closed” to a “semi-open” system. The old and the new compilation and qualitycontrol methods are summarized in chart 1. The important changes to theNetherlands balance of payments compilation practices have included the transi-tion to a selected group of major respondents, the “opening” of the reporting sys-tem, and the reconciliation with other statistical sets. The new quality controlmethods will be based on a meta information system that enables checking ofdata from the micro level to the macro level.
Dutch balance of payments data traditionally have been compiled under a“closed” (self-balancing) system. Data have been collected on all payments andsettlements between residents and nonresidents channeled through (1) accounts
June 1997 21
Netherlands
Netherlands compilers adopting
new methods toimprove quality
control . . .
in authorized Netherlands financial institutions, (2) accounts in foreign banks,and (3) accounts with foreign firms or institutions. The reporting population con-sists of banks, individuals, and businesses (financial and nonfinancial).
An important aspect of the “closed” system is that many transactions are re-ported that do not have direct relevance for the balance of payments (e.g., pay-ments between nonresidents). These are so-called “neutral” transactions. In themethodology of the self-balancing system, the neutral transactions function as ameans of checking the completeness of the reported transactions relevant to thebalance of payments. In the past the neutral transactions were reported in theNetherlands system to account for the difference between the opening and clos-ing positions of an account. In principle, the balance of neutral transactionsshould have been nil. When that was not the case for any month, that was likelyhave been due to differences in timing or to classification errors.
Quality control in the case of the “closed” system was based on the follow-ing elements:
• The “closed” system permitted effective checking of the data reported,since all changes in accounts had to be reported and since the closingbalance of an account in the previous period had to correspond to theopening balance of the account in the current period. The system in-cluded checks of neutral transactions.
• All changes in accounts had a counter-entry elsewhere in the balanceof payments because of the simultaneous reporting of each underlyingtransaction. As a consequence, by definition, the Netherlands’ balanceof payments on a cash basis did not include the residual item of net er-rors and omissions. “Items in transit” were allocated to banking trans-actions and to various items making up private capital transactions.
• Transactions were compiled on a gross basis, i.e., they were not nettedout with other transactions involving the same nonresidents.
As a result of deregulation of the financial markets and the liberalization ofcapital movements, the number of international transactions reported in theNetherlands’ balance of payments compilation system has expanded dramati-cally since the early 1980s. In addition, owing to the massive volume and in-creased complexity of the transactions (most of which have been financial), theneutral transactions have lost much of their significance as a method of checkingbalance of payments data. For these reasons, the Nederlandsche Bank has alteredits compilation and quality control methods.
The Nederlandsche Bank has started to “open” the system to compile ba-lance of payments statistics.1 This approach relies on reporting by a selectedgroup of major respondents, the use of other relevant data sources, and the esti-mation of nonresponses and late responses. It also emphasizes harmonization ofbalance of payments and money and banking statistics and consistency of dataamong data sets. In particular, “net errors and omissions” are made an explicitpart of the balance of payments. “Net errors and omissions” can arise as a resultof erroneous and late reporting, data misclassification, and timing differences intransactors’ recording of transactions.
June 199722
Netherlands
. . . while movingfrom a “closed” toa more “open”compilation system
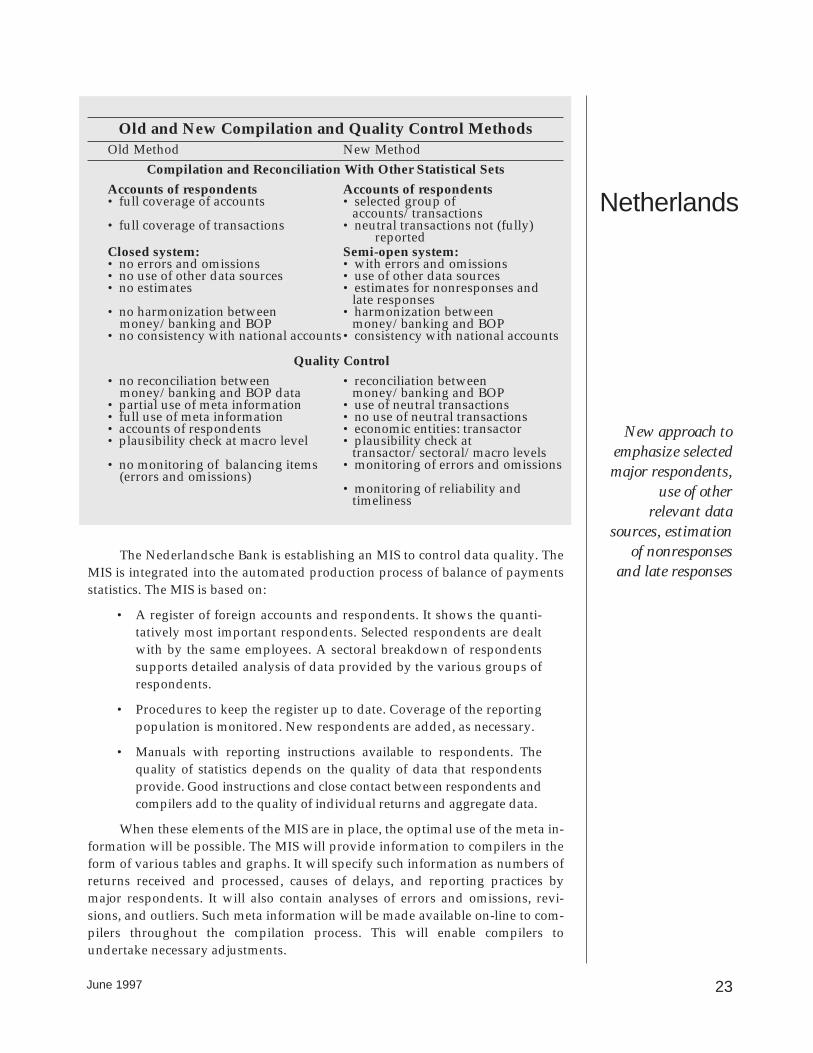
Old and New Compilation and Quality Control MethodsOld Method New Method
Compilation and Reconciliation With Other Statistical Sets
Accounts of respondents Accounts of respondents• full coverage of accounts • selected group of
accounts/transactions• full coverage of transactions • neutral transactions not (fully)
reportedClosed system: Semi-open system:• no errors and omissions • with errors and omissions• no use of other data sources • use of other data sources• no estimates • estimates for nonresponses and
late responses• no harmonization between • harmonization between
money/banking and BOP money/banking and BOP• no consistency with national accounts• consistency with national accounts
Quality Control
• no reconciliation between • reconciliation betweenmoney/banking and BOP data money/banking and BOP
• partial use of meta information • use of neutral transactions• full use of meta information • no use of neutral transactions• accounts of respondents • economic entities: transactor• plausibility check at macro level • plausibility check at
transactor/sectoral/macro levels• no monitoring of balancing items • monitoring of errors and omissions
(errors and omissions)• monitoring of reliability and
timeliness
The Nederlandsche Bank is establishing an MIS to control data quality. TheMIS is integrated into the automated production process of balance of paymentsstatistics. The MIS is based on:
• A register of foreign accounts and respondents. It shows the quanti-tatively most important respondents. Selected respondents are dealtwith by the same employees. A sectoral breakdown of respondentssupports detailed analysis of data provided by the various groups ofrespondents.
• Procedures to keep the register up to date. Coverage of the reportingpopulation is monitored. New respondents are added, as necessary.
• Manuals with reporting instructions available to respondents. Thequality of statistics depends on the quality of data that respondentsprovide. Good instructions and close contact between respondents andcompilers add to the quality of individual returns and aggregate data.
When these elements of the MIS are in place, the optimal use of the meta in-formation will be possible. The MIS will provide information to compilers in theform of various tables and graphs. It will specify such information as numbers ofreturns received and processed, causes of delays, and reporting practices bymajor respondents. It will also contain analyses of errors and omissions, revi-sions, and outliers. Such meta information will be made available on-line to com-pilers throughout the compilation process. This will enable compilers toundertake necessary adjustments.
June 1997 23
Netherlands
New approach toemphasize selectedmajor respondents,
use of other relevant data
sources, estimationof nonresponses
and late responses
June 199724
1See “Adjustments in the Presentation of the Dutch Balance of Payments,” De NederlandscheBank, Quarterly Bulletin, June 1994, pp. 51–55.
Netherlands
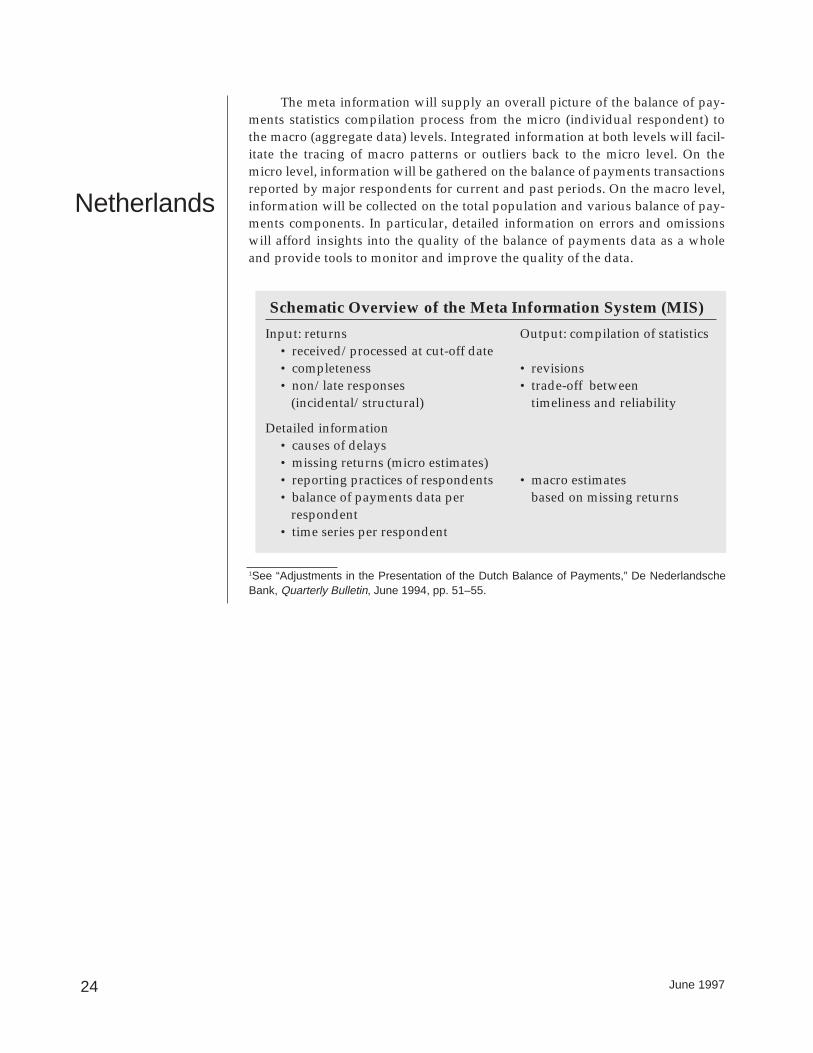
The meta information will supply an overall picture of the balance of pay-ments statistics compilation process from the micro (individual respondent) tothe macro (aggregate data) levels. Integrated information at both levels will facil-itate the tracing of macro patterns or outliers back to the micro level. On themicro level, information will be gathered on the balance of payments transactionsreported by major respondents for current and past periods. On the macro level,information will be collected on the total population and various balance of pay-ments components. In particular, detailed information on errors and omissionswill afford insights into the quality of the balance of payments data as a wholeand provide tools to monitor and improve the quality of the data.
Schematic Overview of the Meta Information System (MIS)
Input: returns Output: compilation of statistics • received/processed at cut-off date• completeness • revisions• non/late responses • trade-off between
(incidental/structural) timeliness and reliability
Detailed information• causes of delays• missing returns (micro estimates) • reporting practices of respondents • macro estimates• balance of payments data per based on missing returns
respondent• time series per respondent