Embed Size (px)
Citation preview
Ie
CNa
b
a
ARR2AA
KTFET
1
duohtftht
hii
0d
Analytica Chimica Acta 662 (2010) 177–185
Contents lists available at ScienceDirect
Analytica Chimica Acta
journa l homepage: www.e lsev ier .com/ locate /aca
mmunochemical determination of oxytetracycline in fish: Comparison betweennzymatic and time-resolved fluorometric assays
onsuelo Cháfer-Pericása, Ángel Maquieiraa, Rosa Puchadesa,∗, Javier Mirallesb, Amelia Morenob,uria Pastor-Navarroa, Francisco Espinósa
Instituto de Reconocimiento Molecular y Desarrollo Tecnológico, Universidad Politécnica de Valencia, Camino de Vera s/n, 46022 Valencia, SpainAINIA, Instituto Tecnológico Agroalimentario, c/Benjamín Franklin 5-11, Parque Tecnológico de Valencia, 46980 Paterna, Valencia, Spain
r t i c l e i n f o
rticle history:eceived 27 October 2009eceived in revised form2 December 2009ccepted 26 December 2009vailable online 11 January 2010
eywords:etracyclineishnzyme-linked immunosorbent assay
a b s t r a c t
An indirect competitive enzyme-linked immunosorbent assay (ELISA) with photometric detection ofhorseradish peroxidase (HRP) activity, was developed in plate to detect oxytetracycline (OTC) in Gilt-head sea bream (Sparus aurata) samples. The results were compared to those obtained by time-resolvedfluoroimmunoassay (TR-FIA) using a secondary antibody with coproporphyrin of platinum (II) (PtCP) asmarker. The limits of detection obtained in fish extract were 16 and 0.08 �g kg−1 for photometric andfluorometric detections, respectively; therefore, they were suitable for fish quality control according tothe maximum residue level established by the European Union.
An extraction procedure using methanol:water 70:30 (v/v) + 1 mL EDTA 0.1 M, and different clean-upprocedures based on solid-phase extraction (C18, polymeric reversed phase, SCX, Si) was assayed. Thematrix effects were overcome by means of an average tetracycline-free fish extract calibration curve
ime-resolved fluoroimmunoassay used for quantification.The OTC optimized ELISA can also be applied to determine tetracycline and chlortetracycline residues
with good results. Thus, the developed immunoassay could be considered as a generic assay for the mostused tetracyclines in aquaculture antibiotic treatments.
In order to confirm the utility of the developed immunoassay as a semi-quantitative methodology, fishsamples obtained from different supermarkets were analyzed. Results correlate well with those obtained
thod
with a reference HPLC me. Introduction
Aquaculture production has notably increased in the lastecades, mainly due to intensive farming. Different antibiotics aresed to treat infections caused by a variety of bacterial pathogensf fish [1]. Tetracyclines (TCs) are broad-spectrum antibiotics thatave been widely used in fish feeding operations. They are designedo act very effectively at low doses and to be completely excretedrom the body after a short residence time. However, in some caseshey can be accumulated in food products causing serious threat touman health, such as allergies, toxic effects, and bacterial resis-
ances, as well.Moreover, as a result of their wide use, residues of tetracyclinesave been found in environmental water samples [2], as well as
n animal manure and agricultural soils [3,4]. In fact, several stud-es have found that tetracyclines were not completely removed by
∗ Corresponding author. Tel.: +34 96 387 73 42; fax: +34 96 387 93 49.E-mail address: [email protected] (R. Puchades).
003-2670/$ – see front matter © 2010 Elsevier B.V. All rights reserved.oi:10.1016/j.aca.2009.12.044
.© 2010 Elsevier B.V. All rights reserved.
conventional wastewater treatments [5], showing the difficulty tomaintain antibiotics-free environment.
Generally, fish feed contains only one antibiotic. For protection,fish cannot be harvested for food before the withdrawal period (aperiod of time after treatment ceases, so that the fish is consid-ered drug free) is over. Withdrawal times vary depending on theantibiotic used and the water temperature (between 3 and 42 days).Maximum residue limits (MRLs) of tetracyclines have been estab-lished for different matrices. Indeed, the European Union has stateda MRL of 100 �g kg−1 for total tetracyclines in edible animal tissues[6].
These limits require the development of sensitive and specificmethods for the determination of antibiotic residues in food. Sev-eral methods for determination of tetracyclines have been reportedin the literature. Most of them are based on liquid chromatogra-phy [7,8], capillary electrophoresis [9], or immunochemistry [10].
Related to detection methods, UV [11,12], fluorescence [13], chemi-luminescence [14] or mass spectrometry detection [15,16] havebeen reported.The most persistent and frequently found pollutant among theTCs is oxytetracycline (OTC) because of its antimicrobial properties
1 ca Chi
[s
spaltsbtbbtoencctr
yccttaSamsr
trrmioin
2
2
7cdmcFslglc(mp(df
78 C. Cháfer-Pericás et al. / Analyti
17]. Therefore, there is a constant effort to develop sensitive andelective methodologies [18].
Immunochemical methods have advantages such as high sen-itivity, simplicity, and cost effectiveness, which make themarticularly useful in routine work. Enzyme-linked immunosorbentssays (ELISAs) are widely used in food analysis [19]. Fluorescentinked immunosorbent assays (FLISAs), using fluorescence ratherhan photometry for detection, have been employed to overcomeome ELISA problems (high background absorption, large num-er of incubation and wash steps, enzyme degradation). Althoughhe best plate results found by Velappan et al. [20] combine high-inding capacity and low intrinsic fluorescence, few FLISAs haveeen applied directly in plates. Their limited sensitivity due tohe high background fluorescence levels, results in a diminutionf signal-to-noise ratio. These problems have been overcome bymploying time-resolved fluoroimmunoassay (TR-FIA) in combi-ation with long-lived fluorophors such as lanthanide chelates andryptates. Moreover, fluorescent platinum (II) and palladium (II)oproporphyrins (PtCP and PdCP, respectively) have characteris-ics that make them suitable compounds for assays employing timeesolution [21,22].
Furthermore, one of the main problems involved in the anal-sis of real samples is the extraction procedure, especially fromomplex matrices such as foods. Most extraction methods are timeonsuming, costly and require large sample volumes. In general,hey are based on solid–liquid extraction [23], solid-phase extrac-ion [24,25], immunoaffinity chromatography [26], metal chelateffinity chromatography [27] and subcritical water extraction [28].ome of them include several steps such as elution, evaporationnd sample resuspension. Recoveries of about 70% for OTC deter-ination in some animal tissues were obtained [27]. In other type of
amples or by means of other extraction procedures, OTC recoverieseached 90% [29].
The aim of this work was to develop a simple, cheap and sensi-ive immunoassay to determine residues of the OTC in fish. For thiseason, two different detection methods (photometry and time-esolved fluorometry) were compared. In addition, the procedureust include a simple sample treatment for routine purposes;
t must be able to be applied in situ and by non-specialists. Tour knowledge, the determination of OTC in fish samples usingmmunoassay technique with photometry or TR fluorometry hasot been previously reported.
. Experimental
.1. Reagents
Tetracycline hydrate (TC), oxytetracycline dehydrate (OTC),-chlortetracycline monohydrochloride (CTC), anhydrotetracy-line hydrochloride (ATC), demeclocycline hydrochloride (DMC),oxycycline hyclate (DXC), methacycline hydrochloride (DMC),inocycline hydrochloride (MNC), rolitetracycline (RTC) and
etyl trimethylammonium bromide (CTAB) were purchased byluka-Sigma-Aldrich Química (Madrid, Spain). Analytical gradeolvents (acetonitrile, methanol and acetone) were from Schar-ab (Barcelona, Spain). Tween 20, o-phenylenediamine (OPD),oat anti-rabbit immunoglobulins (GAR), horseradish peroxidaseabelled goat anti-rabbit immunoglobulins (HRP-GAR), fluores-ein isothiocyanate labelled goat anti-rabbit immunoglobulinsFITC-GAR 1.1 mg mL−1), ovalbumin (OVA), bovine serum albu-
in (BSA) and hemoglobin (Hb) were from Sigma (Madrid, Spain).-Isothiocyanatophenyl derivative of platinum(II)-coproporphyrinPtCP-NCS) was from Luxcel Biosciences (Cork, Ireland). Ethyleneiamine tetraacetic acid (EDTA) and anhydrous sodium sulfite wererom Panreac (Barcelona, Spain). Potassium dihydrogen phosphate
mica Acta 662 (2010) 177–185
was from Scharlau (Barcelona, Spain). All other reagents used wereanalytical grade.
2.2. Materials
Nitrocellulose membranes (0.22 �m) were purchased fromScharlab (Barcelona, Spain). Ultrasonic bath (Selecta, Barcelona,Spain) and vortex mixer (Janke and Kunkel IKA Labortechnik,Staufen, Germany) were used for extraction purposes. Rotary evap-orator (Büchi, Switzerland) was used for the evaporation of organicsolvents. Kitchen blender (Braun MX32, Barcelona, Spain) was usedto grind and homogenize samples. D-1 homogenizer to carry outthe analyte extraction from the sample was from Miccra (Hügel-heim, Germany). Centrifuge was from Heraeus Instruments (Hanau,Germany).
2.3. Apparatus for immunoassay
Polystyrene 96-well flat bottom microtiter plates (clear andblack, non-treated and high-binding) were from Cultek (Barcelona,Spain) and ELISA plate washer from Nunc Maxisarp (Roskilde,Denmark). A microtiter plate reader (Wallac, model Victor 1420multilabel counter, Turku, Finland), with photometric detectionand samarium filters were used for absorbance (� 490 and 650 nm)and fluorescence (�ex 340 nm, �em 642 nm) measurements, respec-tively. UV–vis spectra were recorded on a Hewlett-Packard 8452diode array spectrophotometer (Palo Alto, CA).
2.4. LC-MS/MS chromatographic system
The chromatographic system used consisted of a Waters 2695separations module (Waters Division, Milford, MA, USA) equippedwith an automatic injector, a degasser system and a binary pumpwith four solvent channels. The separation module was con-nected to a triple quadrupole mass spectrometer Quattro microTM
API detector (Micromass UK limited, Manchester, UK) with elec-trospray ionization (ESI). The chromatographic column was aMediterranean C18 (15.0 cm × 0.21 cm, 5-�m particle size) pur-chased from Teknokroma (Barcelona, Spain). A binary mobile phasewith gradient elution was used. Ultra-pure water with 0.1% formicacid and acetonitrile were used as solvent A and solvent B, respec-tively. The gradient starts with 5% B, increases to 90% in 35 min,and then returns to the initial composition for 10 min to conditionthe column for next injection. The flow-rate was 0.3 mL min−1, thecolumn temperature was set to 25 ◦C and the injection volume was20 �L. The mass spectrometer acquired data in quantitative mul-tiple reaction monitoring (MRM) mode. The conditions found forthe optimum performance of the ESI interface in the positive modewere: desolvation flow of 600 L h−1 at 300 ◦C, cone flow of 50 L h−1,source temperature 120 ◦C, and capillary voltage of 3.5 kV. Quan-tification of the antibiotics was carried out with external calibrationcurves.
2.5. Solutions
Phosphate buffered saline (PBS; 100 mmol L−1 sodium phos-phate, 137 mmol L−1 NaCl, 2.7 mmol L−1 KCl, pH 7.5), PBS-T (PBScontaining 0.05% Tween 20), coating buffer (CB; 50 mmol L−1
sodium carbonate/bicarbonate buffer pH 9.6) and citrate buffer(25 mmol L−1, pH 5.5) were used.
Working standard solutions of OTC, CTC and TC (2.2 mg mL−1)were prepared in methanol every week and kept at −20 ◦C in dark-ness. The immunoassay calibration curves were prepared dailyby serial aqueous dilution at concentrations ranging from 104 to10−2 ng mL−1 (in plate) of each analyte.
ca Chi
wsm
2
owtswrtpItt(u
2
sf[atfcacoa
2
cacgrfcwRdru
2
aaaGosto
m
C. Cháfer-Pericás et al. / Analyti
The HPLC multianalyte stock solution (2 mg L−1 each analyte)as prepared in methanol and stored at −20 ◦C in darkness. This
olution was diluted to 0.4, 0.2, 0.1, 0.04 and 0.01 mg L−1 with HPLCobile phase to obtain standard curves.
.6. Coating conjugate preparation
TC was directly linked to OVA via the Mannich reaction [30],btaining the coating conjugate OVA–TC1. The TC (0.1125 mmol)as dissolved in water (2 mL) and added to a solution containing
he OVA protein (2.25 �mol) in 1.5 mL of water. After, 3 mol L−1
odium acetate (1 mL, pH 5.5) and 37% (w/v) formaldehyde (0.4 mL)ere added and the reaction mixture (pH 6–7) was stirred for 2 h at
oom temperature under Ar stream and light-protected. The mix-ure was centrifuged at 10,000 rpm for 12 min and the supernatanturified by D-Salt dextran desalting columns (Pierce, Rockford,
L) using PBS 10 mM for elution. The coating conjugate concen-ration was determined by measuring the absorbance at 280 nm,aking into account the molar extinction coefficient of the OVAε = 0.73 mg−1 mL cm−1). Finally, the conjugate was stored at −20 ◦Cntil use.
.7. Screening of sera and coating conjugates
A set of haptens against tetracyclines (named OTC1, OTC2, CTC2)ynthesized by our research group [31] were linked to BSA and OVAor immunogens and coating conjugates preparation, respectively32]. The coating conjugates OVA–OTC1, OVA–OTC2, OVA–CTC2nd OVA–TC1 were prepared as indicated above. The avidity ofhe available sera (KLH-OCT3-III and BSA-OTC3-IV) against dif-erent coating antigens was determined on a non-competitiveoating-conjugate ELISA format, by measuring the binding of eachntiserum (serial dilutions from 1/1000 to 1/64,000) to differentoating conjugates (serial dilutions from 1 to 0.001 mg L−1). Theptimal concentrations were chosen to produce absorbance signalsround 1 in absence of analyte.
.8. GAR–PtCP conjugate preparation
A small quantity of PtCP-NCS was weighed and diluted to aoncentration of 3 mg mL−1 (3 × 10⁻³ M) in DMSO. An aliquot wasdded to the GAR protein solution (1 mg mL−1 equilibrated in 0.1 Marbonate buffer, pH 9.7) to give a dye molar excess of 20. Afterentle vortexing, the reaction mixture was incubated for 4 h atoom temperature in darkness [33]. The mixture was centrifugedor 12 min at 10,000 rpm and the supernatant was purified by D-Saltolumns using PBS 10 mM for elution. The protein concentrationas determined by means of Bradford Bio-Rad Protein Assay (Bio-ad Laboratories, Barcelona, Spain), measuring the absorbance ofifferent BSA aqueous standards at 595 nm in the microtiter plateeader. The conjugate obtained (464 �g mL−1) was stored at −20 ◦Cntil use.
.9. Competitive indirect ELISA procedure
The competitive immunoassays carried out with the avail-ble immunoreagents established the pair OVA–TC1/K-OTC3-IIIs being the optimum. A set of experimental parameters, suchs competition time, ionic strength, pH, Tween 20 concentration,AR–HRP, OPD and other immunoreagent concentrations, sec-ndary antibody incubation time, and enzymatic reaction time was
tudied sequentially in order to improve the performances (sensi-ivity, maximum absorbance, dynamic range and limit of detection)f the ELISA.Basically, the procedure consisted of the use of 96-wellicrotiter plates coated with 100 �L/well of the appropriate con-
mica Acta 662 (2010) 177–185 179
centration of OVA–hapten conjugate solution in carbonate bufferand incubated overnight at 4 ◦C. The following day, plates werewashed eight times (29 mL per wash, 300 �L per well) with10 mmol L−1 PBS-T. Then, 50 �L of standards in PBS-T and 50 �Lof the appropriate serum dilution in PBS-T were mixed in platewells during 60 min at room temperature. After washing, plateswere incubated for 1 h with GAR–HRP diluted 1:4000 in PBS-T(100 �L/well), and washed again. A total of 100 �L/well of sub-strate solution (2 mg mL−1 OPD and 0.012% H2O2 in citrate buffer)were added. After 10 min, the enzymatic reaction was stopped byaddition of 2.5 mol L−1 H2SO4 (50 �L/well), reading the absorbancevalues in dual-wavelength mode (490 nm as test wavelength and650 nm as reference wavelength).
2.10. Time-resolved fluorometry detection
The same pair of immunoreagents, OVA–TC1/K-OTC3-III, wereselected to develop the TR-FIA for the OTC determination. From thepreviously optimized ELISA parameters, a set of experimental vari-ables (secondary antibody (GAR–PtCP) concentration, type of plate,pH, desorption time with CTAB and reaction time with sodium sul-fite solution) were studied sequentially in order to improve theperformances (sensitivity, maximum absorbance, dynamic rangeand limit of detection) of the assay.
The competition procedure was the same as that describedabove. After washing (as described above), plates were incubatedfor 1 h with GAR–PtCP diluted in PBS-T (100 �L/well), and washedagain.
Different ways to measure the TR fluorescence, using the samar-ium filters (�ex 340 nm, �em 642 nm) were studied [33]: (1) directlyfrom dry empty wells; (2) with 200 �L of phosphate sulfite solution(PSS) (5 mg mL−1 Na2SO3, 5 mg mL−1 KH2PO4, pH 7.4); and (3) with200 �L of 3 mM CTAB, pH 11.5, incubated for 20 min to desorb theconjugate from the solid phase, and then adding 20 �L of the stocksulfite solution (PSS) (50 mg mL−1 Na2SO3, 50 mg mL−1 KH2PO4, pH7.4).
2.11. Effect of organic solvents
The effect of organic solvents on ELISA performance must betested since they are used as extractants of antibiotic residues,and generally, the antibodies are not very tolerant to them. Com-petitive curves containing different percentages of methanol andacetonitrile (0–25% (v/v) in plate) were carried out.
2.12. Cross-reactivity determination
Selectivity of the OTC immunoassay was determined by testinga set of different tetracyclines, and expressed as cross-reactivity(CR) percentage for each interfering compound.
2.13. Fish sample extraction and clean-up
The optimization of the extraction procedure was carried outusing tetracycline-free wild gilthead sea bream fish (Sparus aurata)samples. Once eviscerated, the samples were peeled, and the ediblemuscle minced and homogenized using a kitchen blender. 5 g offish edible tissue were weighed into a 50 mL centrifuge tube andspiked with 312 ng g−1 of OTC (30 ng mL−1 in plate). The mixturewas placed in an ultrasonic bath for about 5 min in order to disperse
the analyte thoroughly into the matrix.After adding 25 mL of MeOH:H2O (70:30, v/v) and 1 mL of EDTA0.1 M, the mixture was homogenized for 3 min using the homoge-nizer, then it was centrifuged at 3500 rpm for 5 min and the liquidwas decanted into another tube. After solvent evaporation using
180 C. Cháfer-Pericás et al. / Analytica Chimica Acta 662 (2010) 177–185
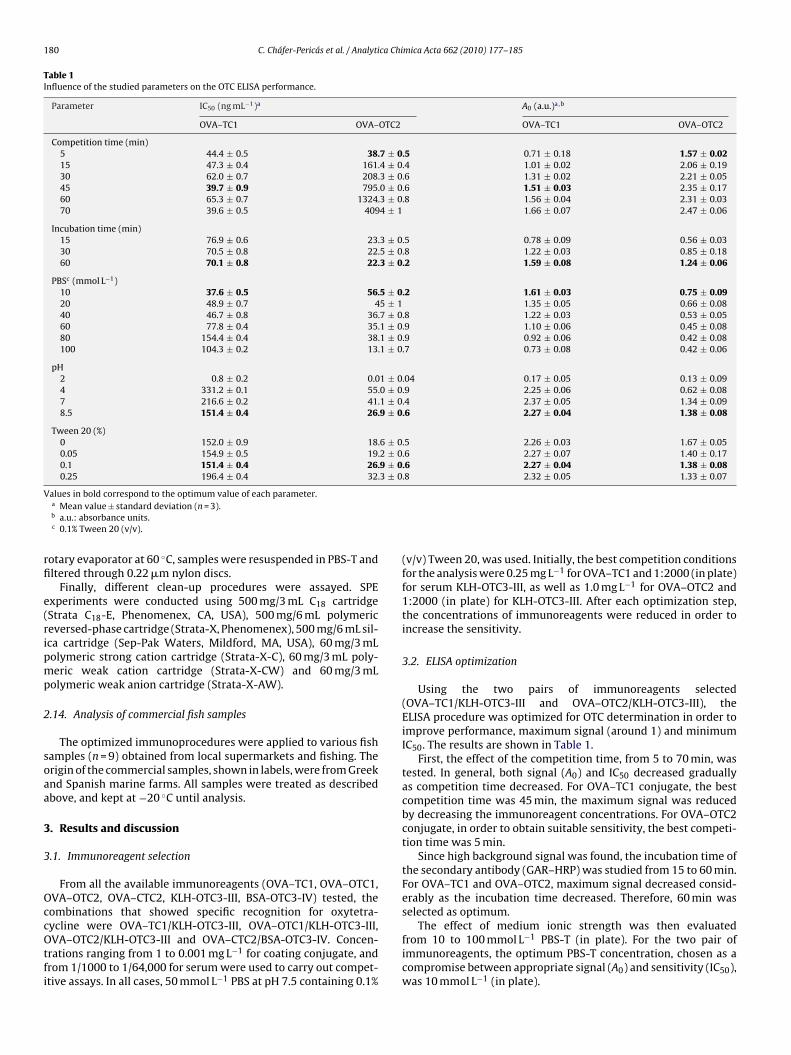
Table 1Influence of the studied parameters on the OTC ELISA performance.
Parameter IC50 (ng mL−1)a A0 (a.u.)a,b
OVA–TC1 OVA–OTC2 OVA–TC1 OVA–OTC2
Competition time (min)5 44.4 ± 0.5 38.7 ± 0.5 0.71 ± 0.18 1.57 ± 0.0215 47.3 ± 0.4 161.4 ± 0.4 1.01 ± 0.02 2.06 ± 0.1930 62.0 ± 0.7 208.3 ± 0.6 1.31 ± 0.02 2.21 ± 0.0545 39.7 ± 0.9 795.0 ± 0.6 1.51 ± 0.03 2.35 ± 0.1760 65.3 ± 0.7 1324.3 ± 0.8 1.56 ± 0.04 2.31 ± 0.0370 39.6 ± 0.5 4094 ± 1 1.66 ± 0.07 2.47 ± 0.06
Incubation time (min)15 76.9 ± 0.6 23.3 ± 0.5 0.78 ± 0.09 0.56 ± 0.0330 70.5 ± 0.8 22.5 ± 0.8 1.22 ± 0.03 0.85 ± 0.1860 70.1 ± 0.8 22.3 ± 0.2 1.59 ± 0.08 1.24 ± 0.06
PBSc (mmol L−1)10 37.6 ± 0.5 56.5 ± 0.2 1.61 ± 0.03 0.75 ± 0.0920 48.9 ± 0.7 45 ± 1 1.35 ± 0.05 0.66 ± 0.0840 46.7 ± 0.8 36.7 ± 0.8 1.22 ± 0.03 0.53 ± 0.0560 77.8 ± 0.4 35.1 ± 0.9 1.10 ± 0.06 0.45 ± 0.0880 154.4 ± 0.4 38.1 ± 0.9 0.92 ± 0.06 0.42 ± 0.08100 104.3 ± 0.2 13.1 ± 0.7 0.73 ± 0.08 0.42 ± 0.06
pH2 0.8 ± 0.2 0.01 ± 0.04 0.17 ± 0.05 0.13 ± 0.094 331.2 ± 0.1 55.0 ± 0.9 2.25 ± 0.06 0.62 ± 0.087 216.6 ± 0.2 41.1 ± 0.4 2.37 ± 0.05 1.34 ± 0.098.5 151.4 ± 0.4 26.9 ± 0.6 2.27 ± 0.04 1.38 ± 0.08
Tween 20 (%)0 152.0 ± 0.9 18.6 ± 0.5 2.26 ± 0.03 1.67 ± 0.050.05 154.9 ± 0.5 19.2 ± 0.6 2.27 ± 0.07 1.40 ± 0.170.1 151.4 ± 0.4 26.9 ± 0.6 2.27 ± 0.04 1.38 ± 0.080.25 196.4 ± 0.4 32.3 ± 0.8 2.32 ± 0.05 1.33 ± 0.07
V
rfi
e(ripmp
2
soaa
3
3
OccOtfi
alues in bold correspond to the optimum value of each parameter.a Mean value ± standard deviation (n = 3).b a.u.: absorbance units.c 0.1% Tween 20 (v/v).
otary evaporator at 60 ◦C, samples were resuspended in PBS-T andltered through 0.22 �m nylon discs.
Finally, different clean-up procedures were assayed. SPExperiments were conducted using 500 mg/3 mL C18 cartridgeStrata C18-E, Phenomenex, CA, USA), 500 mg/6 mL polymericeversed-phase cartridge (Strata-X, Phenomenex), 500 mg/6 mL sil-ca cartridge (Sep-Pak Waters, Mildford, MA, USA), 60 mg/3 mLolymeric strong cation cartridge (Strata-X-C), 60 mg/3 mL poly-eric weak cation cartridge (Strata-X-CW) and 60 mg/3 mL
olymeric weak anion cartridge (Strata-X-AW).
.14. Analysis of commercial fish samples
The optimized immunoprocedures were applied to various fishamples (n = 9) obtained from local supermarkets and fishing. Therigin of the commercial samples, shown in labels, were from Greeknd Spanish marine farms. All samples were treated as describedbove, and kept at −20 ◦C until analysis.
. Results and discussion
.1. Immunoreagent selection
From all the available immunoreagents (OVA–TC1, OVA–OTC1,VA–OTC2, OVA–CTC2, KLH-OTC3-III, BSA-OTC3-IV) tested, theombinations that showed specific recognition for oxytetra-
ycline were OVA–TC1/KLH-OTC3-III, OVA–OTC1/KLH-OTC3-III,VA–OTC2/KLH-OTC3-III and OVA–CTC2/BSA-OTC3-IV. Concen-rations ranging from 1 to 0.001 mg L−1 for coating conjugate, androm 1/1000 to 1/64,000 for serum were used to carry out compet-tive assays. In all cases, 50 mmol L−1 PBS at pH 7.5 containing 0.1%
(v/v) Tween 20, was used. Initially, the best competition conditionsfor the analysis were 0.25 mg L−1 for OVA–TC1 and 1:2000 (in plate)for serum KLH-OTC3-III, as well as 1.0 mg L−1 for OVA–OTC2 and1:2000 (in plate) for KLH-OTC3-III. After each optimization step,the concentrations of immunoreagents were reduced in order toincrease the sensitivity.
3.2. ELISA optimization
Using the two pairs of immunoreagents selected(OVA–TC1/KLH-OTC3-III and OVA–OTC2/KLH-OTC3-III), theELISA procedure was optimized for OTC determination in order toimprove performance, maximum signal (around 1) and minimumIC50. The results are shown in Table 1.
First, the effect of the competition time, from 5 to 70 min, wastested. In general, both signal (A0) and IC50 decreased graduallyas competition time decreased. For OVA–TC1 conjugate, the bestcompetition time was 45 min, the maximum signal was reducedby decreasing the immunoreagent concentrations. For OVA–OTC2conjugate, in order to obtain suitable sensitivity, the best competi-tion time was 5 min.
Since high background signal was found, the incubation time ofthe secondary antibody (GAR–HRP) was studied from 15 to 60 min.For OVA–TC1 and OVA–OTC2, maximum signal decreased consid-erably as the incubation time decreased. Therefore, 60 min wasselected as optimum.
The effect of medium ionic strength was then evaluatedfrom 10 to 100 mmol L−1 PBS-T (in plate). For the two pair ofimmunoreagents, the optimum PBS-T concentration, chosen as acompromise between appropriate signal (A0) and sensitivity (IC50),was 10 mmol L−1 (in plate).
ca Chimica Acta 662 (2010) 177–185 181
aoFcr
Tmtawpt
sitipw
thbHs
dtirtcocwlicct
cf
3
istsmfsi
3
oa(
TTt
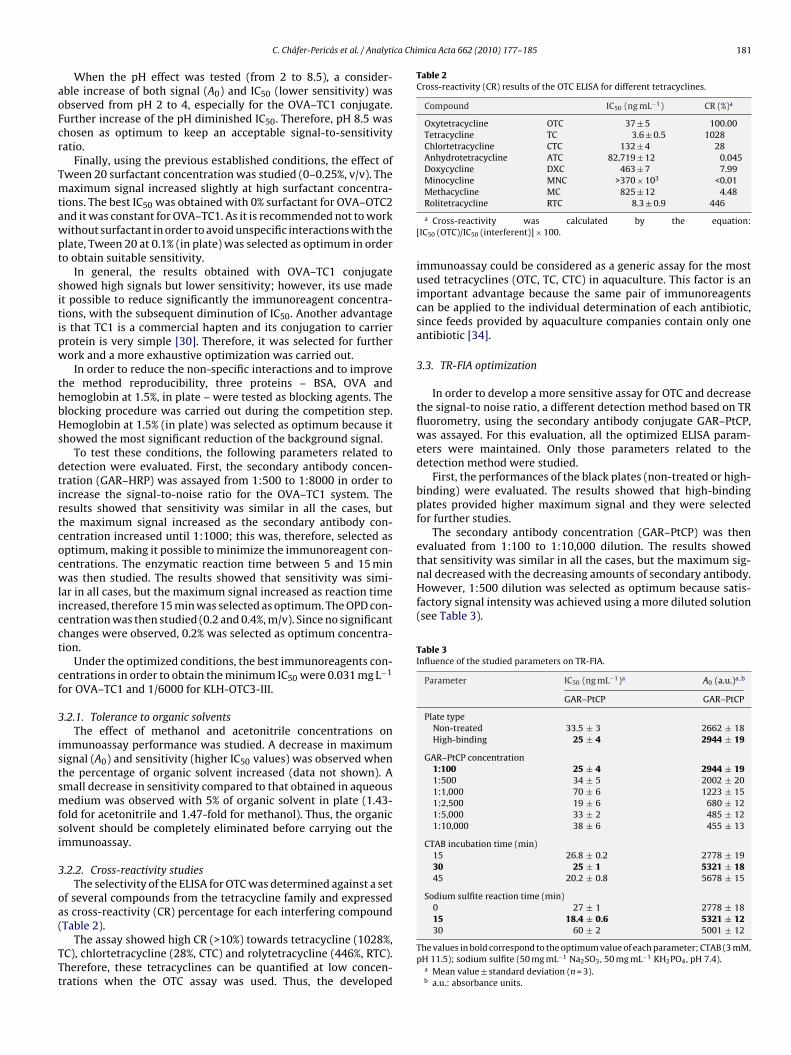
Table 2Cross-reactivity (CR) results of the OTC ELISA for different tetracyclines.
Compound IC50 (ng mL−1) CR (%)a
Oxytetracycline OTC 37 ± 5 100.00Tetracycline TC 3.6 ± 0.5 1028Chlortetracycline CTC 132 ± 4 28Anhydrotetracycline ATC 82,719 ± 12 0.045Doxycycline DXC 463 ± 7 7.99Minocycline MNC >370 × 103 <0.01Methacycline MC 825 ± 12 4.48
nal decreased with the decreasing amounts of secondary antibody.However, 1:500 dilution was selected as optimum because satis-factory signal intensity was achieved using a more diluted solution(see Table 3).
Table 3Influence of the studied parameters on TR-FIA.
Parameter IC50 (ng mL−1)a A0 (a.u.)a,b
GAR–PtCP GAR–PtCP
Plate typeNon-treated 33.5 ± 3 2662 ± 18High-binding 25 ± 4 2944 ± 19
GAR–PtCP concentration1:100 25 ± 4 2944 ± 191:500 34 ± 5 2002 ± 201:1,000 70 ± 6 1223 ± 151:2,500 19 ± 6 680 ± 121:5,000 33 ± 2 485 ± 121:10,000 38 ± 6 455 ± 13
CTAB incubation time (min)15 26.8 ± 0.2 2778 ± 1930 25 ± 1 5321 ± 1845 20.2 ± 0.8 5678 ± 15
Sodium sulfite reaction time (min)0 27 ± 1 2778 ± 1815 18.4 ± 0.6 5321 ± 12
C. Cháfer-Pericás et al. / Analyti
When the pH effect was tested (from 2 to 8.5), a consider-ble increase of both signal (A0) and IC50 (lower sensitivity) wasbserved from pH 2 to 4, especially for the OVA–TC1 conjugate.urther increase of the pH diminished IC50. Therefore, pH 8.5 washosen as optimum to keep an acceptable signal-to-sensitivityatio.
Finally, using the previous established conditions, the effect ofween 20 surfactant concentration was studied (0–0.25%, v/v). Theaximum signal increased slightly at high surfactant concentra-
ions. The best IC50 was obtained with 0% surfactant for OVA–OTC2nd it was constant for OVA–TC1. As it is recommended not to workithout surfactant in order to avoid unspecific interactions with thelate, Tween 20 at 0.1% (in plate) was selected as optimum in ordero obtain suitable sensitivity.
In general, the results obtained with OVA–TC1 conjugatehowed high signals but lower sensitivity; however, its use madet possible to reduce significantly the immunoreagent concentra-ions, with the subsequent diminution of IC50. Another advantages that TC1 is a commercial hapten and its conjugation to carrierrotein is very simple [30]. Therefore, it was selected for furtherork and a more exhaustive optimization was carried out.
In order to reduce the non-specific interactions and to improvehe method reproducibility, three proteins – BSA, OVA andemoglobin at 1.5%, in plate – were tested as blocking agents. Thelocking procedure was carried out during the competition step.emoglobin at 1.5% (in plate) was selected as optimum because it
howed the most significant reduction of the background signal.To test these conditions, the following parameters related to
etection were evaluated. First, the secondary antibody concen-ration (GAR–HRP) was assayed from 1:500 to 1:8000 in order toncrease the signal-to-noise ratio for the OVA–TC1 system. Theesults showed that sensitivity was similar in all the cases, buthe maximum signal increased as the secondary antibody con-entration increased until 1:1000; this was, therefore, selected asptimum, making it possible to minimize the immunoreagent con-entrations. The enzymatic reaction time between 5 and 15 minas then studied. The results showed that sensitivity was simi-
ar in all cases, but the maximum signal increased as reaction timencreased, therefore 15 min was selected as optimum. The OPD con-entration was then studied (0.2 and 0.4%, m/v). Since no significanthanges were observed, 0.2% was selected as optimum concentra-ion.
Under the optimized conditions, the best immunoreagents con-entrations in order to obtain the minimum IC50 were 0.031 mg L−1
or OVA–TC1 and 1/6000 for KLH-OTC3-III.
.2.1. Tolerance to organic solventsThe effect of methanol and acetonitrile concentrations on
mmunoassay performance was studied. A decrease in maximumignal (A0) and sensitivity (higher IC50 values) was observed whenhe percentage of organic solvent increased (data not shown). Amall decrease in sensitivity compared to that obtained in aqueousedium was observed with 5% of organic solvent in plate (1.43-
old for acetonitrile and 1.47-fold for methanol). Thus, the organicolvent should be completely eliminated before carrying out themmunoassay.
.2.2. Cross-reactivity studiesThe selectivity of the ELISA for OTC was determined against a set
f several compounds from the tetracycline family and expresseds cross-reactivity (CR) percentage for each interfering compound
Table 2).The assay showed high CR (>10%) towards tetracycline (1028%,C), chlortetracycline (28%, CTC) and rolytetracycline (446%, RTC).herefore, these tetracyclines can be quantified at low concen-rations when the OTC assay was used. Thus, the developed
Rolitetracycline RTC 8.3 ± 0.9 446
a Cross-reactivity was calculated by the equation:[IC50 (OTC)/IC50 (interferent)] × 100.
immunoassay could be considered as a generic assay for the mostused tetracyclines (OTC, TC, CTC) in aquaculture. This factor is animportant advantage because the same pair of immunoreagentscan be applied to the individual determination of each antibiotic,since feeds provided by aquaculture companies contain only oneantibiotic [34].
3.3. TR-FIA optimization
In order to develop a more sensitive assay for OTC and decreasethe signal-to noise ratio, a different detection method based on TRfluorometry, using the secondary antibody conjugate GAR–PtCP,was assayed. For this evaluation, all the optimized ELISA param-eters were maintained. Only those parameters related to thedetection method were studied.
First, the performances of the black plates (non-treated or high-binding) were evaluated. The results showed that high-bindingplates provided higher maximum signal and they were selectedfor further studies.
The secondary antibody concentration (GAR–PtCP) was thenevaluated from 1:100 to 1:10,000 dilution. The results showedthat sensitivity was similar in all the cases, but the maximum sig-
30 60 ± 2 5001 ± 12
The values in bold correspond to the optimum value of each parameter; CTAB (3 mM,pH 11.5); sodium sulfite (50 mg mL−1 Na2SO3, 50 mg mL−1 KH2PO4, pH 7.4).
a Mean value ± standard deviation (n = 3).b a.u.: absorbance units.
182 C. Cháfer-Pericás et al. / Analytica Chimica Acta 662 (2010) 177–185
Table 4LODs obtained by the immunoassays using different media. Comparison with HPLC results.
Media HPLC ELISA TR-FIA
OTC TC CTC OTC TC CTC OTC TC CTC
ods
hdaws4tow
cK
3
ie
ctEwos
oeitot
ewT
v(Tfi
3
am(eEsm
maximum analyte elution and the minimum matrix compoundselution. The results showed that the best clean-up solution wasmethanol:water (70:30, v/v), obtaining a 99.5% recovery for OTC.As shown in Table 6, the matrix effect corresponding to fish extract
PBS-T (ng mL−1)MeOH-H2O + EDTA (ng mL−1) 2 2 4Fish (�g kg−1) 13 10 16
The study of pH influence (between 2 and 11.5) was carriedut by measuring directly the TR fluorescence signal of GAR–PtCPiluted in PBS-T at different pH, results showed that the maximumignal was obtained at pH 8.
Regarding the different ways to measure the TR fluorescence,igher signal intensity was obtained by means of adding CTAB toesorb the conjugate from the solid phase and by the addition ofsulfite solution to remove oxygen. Desorption time with CTABas evaluated between 15 and 45 min. As shown in Table 3, both
ignal and sensitivity did not significantly change between 30 and5 min, therefore, 30 min was selected as optimum. The reactionime with the sulfite solution (0–30 min) was then evaluated inrder to reduce total assay time. The best sensitivity was achievedith 15 min (Table 3).
At the end of the optimization process, the best immunoreagentoncentrations were 0.0156 �g mL−1 for OVA–TC1 and 1/8000 forLH-OTC3-III.
.4. Analytical performance
Performances of the optimized immunoassay were establishedn spiked PBS-T (10 mM), MeOH:H2O + EDTA mixture, and fishxtract for OTC, TC and CTC.
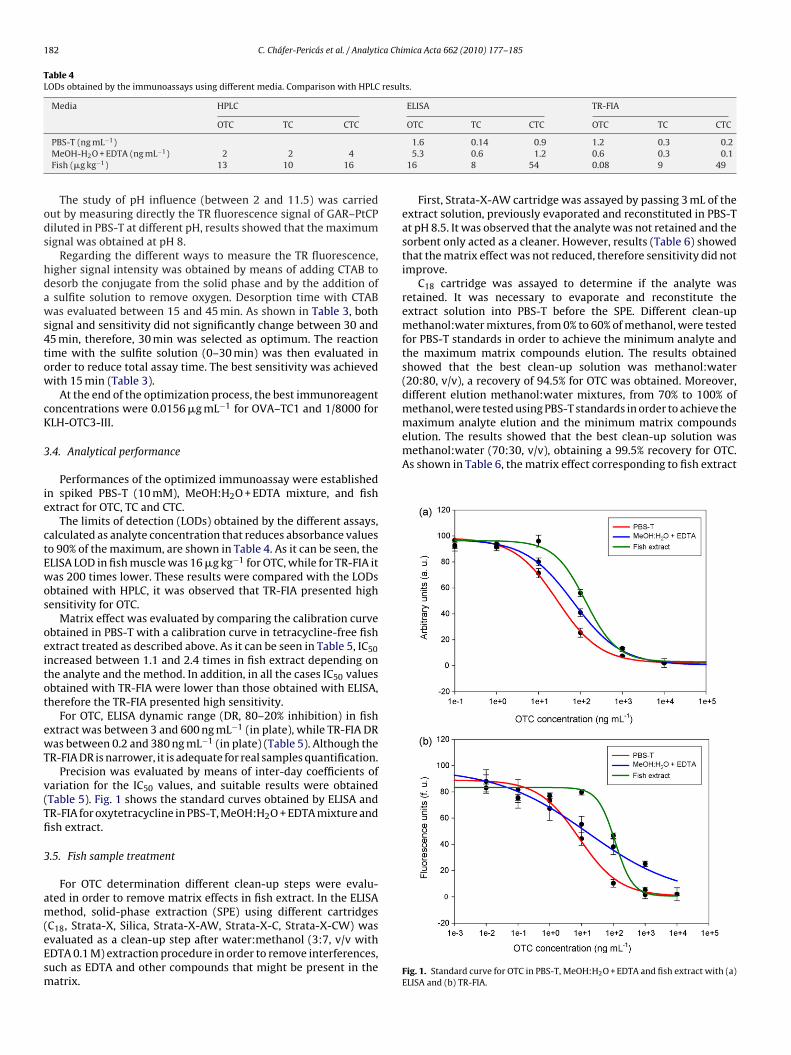
The limits of detection (LODs) obtained by the different assays,alculated as analyte concentration that reduces absorbance valueso 90% of the maximum, are shown in Table 4. As it can be seen, theLISA LOD in fish muscle was 16 �g kg−1 for OTC, while for TR-FIA itas 200 times lower. These results were compared with the LODs
btained with HPLC, it was observed that TR-FIA presented highensitivity for OTC.
Matrix effect was evaluated by comparing the calibration curvebtained in PBS-T with a calibration curve in tetracycline-free fishxtract treated as described above. As it can be seen in Table 5, IC50ncreased between 1.1 and 2.4 times in fish extract depending onhe analyte and the method. In addition, in all the cases IC50 valuesbtained with TR-FIA were lower than those obtained with ELISA,herefore the TR-FIA presented high sensitivity.
For OTC, ELISA dynamic range (DR, 80–20% inhibition) in fishxtract was between 3 and 600 ng mL−1 (in plate), while TR-FIA DRas between 0.2 and 380 ng mL−1 (in plate) (Table 5). Although the
R-FIA DR is narrower, it is adequate for real samples quantification.Precision was evaluated by means of inter-day coefficients of
ariation for the IC50 values, and suitable results were obtainedTable 5). Fig. 1 shows the standard curves obtained by ELISA andR-FIA for oxytetracycline in PBS-T, MeOH:H2O + EDTA mixture andsh extract.
.5. Fish sample treatment
For OTC determination different clean-up steps were evalu-ted in order to remove matrix effects in fish extract. In the ELISAethod, solid-phase extraction (SPE) using different cartridges
C18, Strata-X, Silica, Strata-X-AW, Strata-X-C, Strata-X-CW) wasvaluated as a clean-up step after water:methanol (3:7, v/v withDTA 0.1 M) extraction procedure in order to remove interferences,uch as EDTA and other compounds that might be present in theatrix.
1.6 0.14 0.9 1.2 0.3 0.25.3 0.6 1.2 0.6 0.3 0.1
16 8 54 0.08 9 49
First, Strata-X-AW cartridge was assayed by passing 3 mL of theextract solution, previously evaporated and reconstituted in PBS-Tat pH 8.5. It was observed that the analyte was not retained and thesorbent only acted as a cleaner. However, results (Table 6) showedthat the matrix effect was not reduced, therefore sensitivity did notimprove.
C18 cartridge was assayed to determine if the analyte wasretained. It was necessary to evaporate and reconstitute theextract solution into PBS-T before the SPE. Different clean-upmethanol:water mixtures, from 0% to 60% of methanol, were testedfor PBS-T standards in order to achieve the minimum analyte andthe maximum matrix compounds elution. The results obtainedshowed that the best clean-up solution was methanol:water(20:80, v/v), a recovery of 94.5% for OTC was obtained. Moreover,different elution methanol:water mixtures, from 70% to 100% ofmethanol, were tested using PBS-T standards in order to achieve the
Fig. 1. Standard curve for OTC in PBS-T, MeOH:H2O + EDTA and fish extract with (a)ELISA and (b) TR-FIA.
C. Cháfer-Pericás et al. / Analytica Chimica Acta 662 (2010) 177–185 183
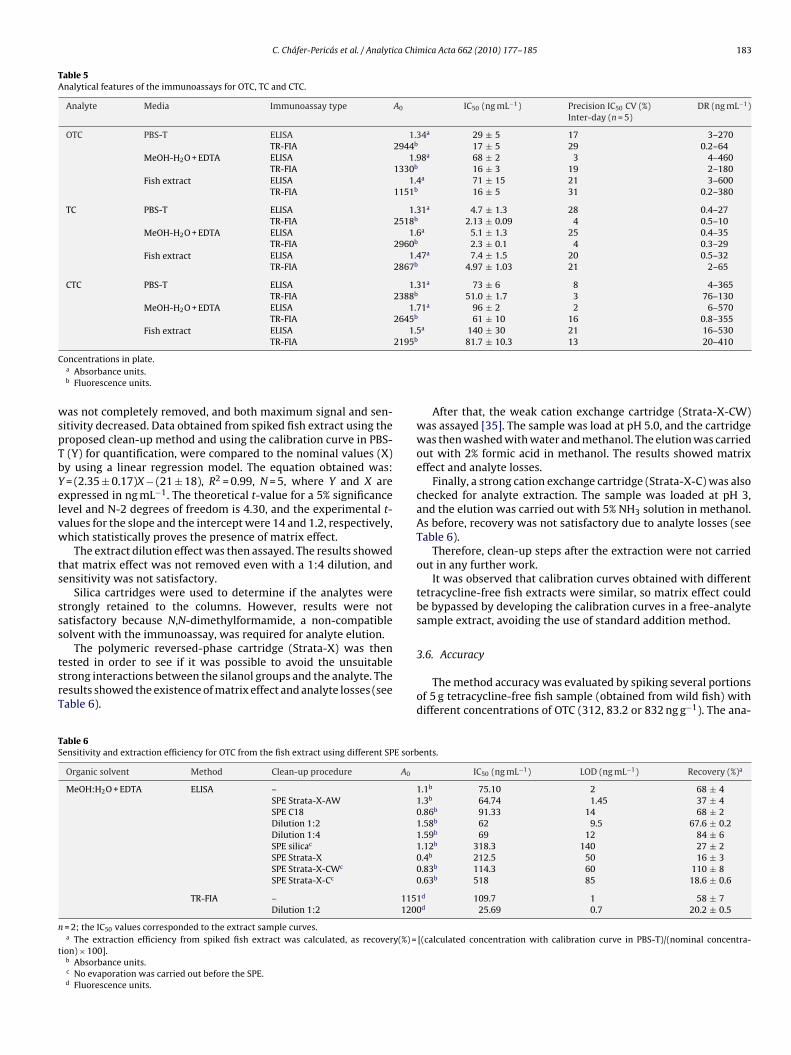
Table 5Analytical features of the immunoassays for OTC, TC and CTC.
Analyte Media Immunoassay type A0 IC50 (ng mL−1) Precision IC50 CV (%) DR (ng mL−1)Inter-day (n = 5)
OTC PBS-T ELISA 1.34a 29 ± 5 17 3–270TR-FIA 2944b 17 ± 5 29 0.2–64
MeOH-H2O + EDTA ELISA 1.98a 68 ± 2 3 4–460TR-FIA 1330b 16 ± 3 19 2–180
Fish extract ELISA 1.4a 71 ± 15 21 3–600TR-FIA 1151b 16 ± 5 31 0.2–380
TC PBS-T ELISA 1.31a 4.7 ± 1.3 28 0.4–27TR-FIA 2518b 2.13 ± 0.09 4 0.5–10
MeOH-H2O + EDTA ELISA 1.6a 5.1 ± 1.3 25 0.4–35TR-FIA 2960b 2.3 ± 0.1 4 0.3–29
Fish extract ELISA 1.47a 7.4 ± 1.5 20 0.5–32TR-FIA 2867b 4.97 ± 1.03 21 2–65
CTC PBS-T ELISA 1.31a 73 ± 6 8 4–365TR-FIA 2388b 51.0 ± 1.7 3 76–130
MeOH-H2O + EDTA ELISA 1.71a 96 ± 2 2 6–570TR-FIA 2645b 61 ± 10 16 0.8–355
Fish extract ELISA 1.5a 140 ± 30 21 16–5302195b
C
wspTbYelvw
ts
sss
tsrT
TS
n
t
TR-FIA
oncentrations in plate.a Absorbance units.b Fluorescence units.
as not completely removed, and both maximum signal and sen-itivity decreased. Data obtained from spiked fish extract using theroposed clean-up method and using the calibration curve in PBS-(Y) for quantification, were compared to the nominal values (X)y using a linear regression model. The equation obtained was:= (2.35 ± 0.17)X − (21 ± 18), R2 = 0.99, N = 5, where Y and X arexpressed in ng mL−1. The theoretical t-value for a 5% significanceevel and N-2 degrees of freedom is 4.30, and the experimental t-alues for the slope and the intercept were 14 and 1.2, respectively,hich statistically proves the presence of matrix effect.
The extract dilution effect was then assayed. The results showedhat matrix effect was not removed even with a 1:4 dilution, andensitivity was not satisfactory.
Silica cartridges were used to determine if the analytes weretrongly retained to the columns. However, results were notatisfactory because N,N-dimethylformamide, a non-compatibleolvent with the immunoassay, was required for analyte elution.
The polymeric reversed-phase cartridge (Strata-X) was thenested in order to see if it was possible to avoid the unsuitabletrong interactions between the silanol groups and the analyte. Theesults showed the existence of matrix effect and analyte losses (seeable 6).
able 6ensitivity and extraction efficiency for OTC from the fish extract using different SPE sorb
Organic solvent Method Clean-up procedure A0
MeOH:H2O + EDTA ELISA –SPE Strata-X-AWSPE C18Dilution 1:2Dilution 1:4SPE silicac
SPE Strata-XSPE Strata-X-CWc
SPE Strata-X-Cc
TR-FIA – 115Dilution 1:2 120
= 2; the IC50 values corresponded to the extract sample curves.a The extraction efficiency from spiked fish extract was calculated, as recovery(%) =
ion) × 100].b Absorbance units.c No evaporation was carried out before the SPE.d Fluorescence units.
81.7 ± 10.3 13 20–410
After that, the weak cation exchange cartridge (Strata-X-CW)was assayed [35]. The sample was load at pH 5.0, and the cartridgewas then washed with water and methanol. The elution was carriedout with 2% formic acid in methanol. The results showed matrixeffect and analyte losses.
Finally, a strong cation exchange cartridge (Strata-X-C) was alsochecked for analyte extraction. The sample was loaded at pH 3,and the elution was carried out with 5% NH3 solution in methanol.As before, recovery was not satisfactory due to analyte losses (seeTable 6).
Therefore, clean-up steps after the extraction were not carriedout in any further work.
It was observed that calibration curves obtained with differenttetracycline-free fish extracts were similar, so matrix effect couldbe bypassed by developing the calibration curves in a free-analytesample extract, avoiding the use of standard addition method.
3.6. Accuracy
The method accuracy was evaluated by spiking several portionsof 5 g tetracycline-free fish sample (obtained from wild fish) withdifferent concentrations of OTC (312, 83.2 or 832 ng g−1). The ana-
ents.
IC50 (ng mL−1) LOD (ng mL−1) Recovery (%)a
1.1b 75.10 2 68 ± 41.3b 64.74 1.45 37 ± 40.86b 91.33 14 68 ± 21.58b 62 9.5 67.6 ± 0.21.59b 69 12 84 ± 61.12b 318.3 140 27 ± 20.4b 212.5 50 16 ± 30.83b 114.3 60 110 ± 80.63b 518 85 18.6 ± 0.6
1d 109.7 1 58 ± 70d 25.69 0.7 20.2 ± 0.5
[(calculated concentration with calibration curve in PBS-T)/(nominal concentra-
184 C. Cháfer-Pericás et al. / Analytica Chi
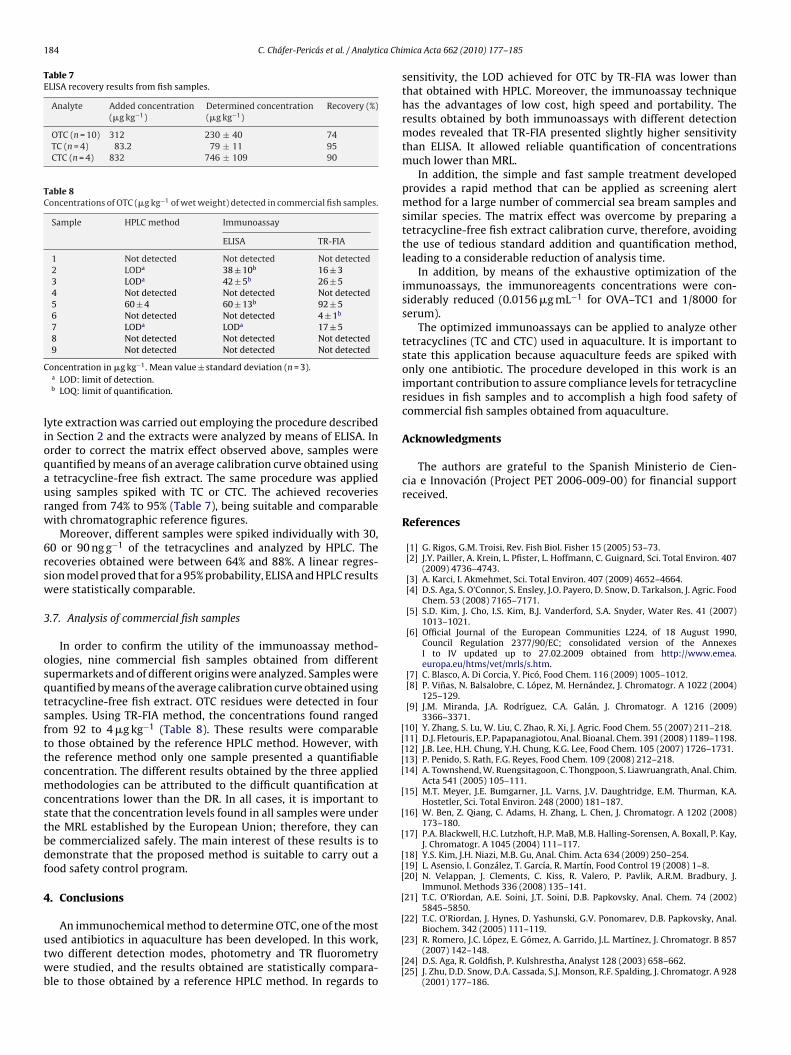
Table 7ELISA recovery results from fish samples.
Analyte Added concentration(�g kg−1)
Determined concentration(�g kg−1)
Recovery (%)
OTC (n = 10) 312 230 ± 40 74TC (n = 4) 83.2 79 ± 11 95CTC (n = 4) 832 746 ± 109 90
Table 8Concentrations of OTC (�g kg−1 of wet weight) detected in commercial fish samples.
Sample HPLC method Immunoassay
ELISA TR-FIA
1 Not detected Not detected Not detected2 LODa 38 ± 10b 16 ± 33 LODa 42 ± 5b 26 ± 54 Not detected Not detected Not detected5 60 ± 4 60 ± 13b 92 ± 56 Not detected Not detected 4 ± 1b
7 LODa LODa 17 ± 58 Not detected Not detected Not detected9 Not detected Not detected Not detected
C
lioqaurw
6rsw
3
osqtsfttcmcstbdf
4
utwb
[[[[[
[
[
[
[[[
[
[
oncentration in �g kg−1. Mean value ± standard deviation (n = 3).a LOD: limit of detection.b LOQ: limit of quantification.
yte extraction was carried out employing the procedure describedn Section 2 and the extracts were analyzed by means of ELISA. Inrder to correct the matrix effect observed above, samples wereuantified by means of an average calibration curve obtained usingtetracycline-free fish extract. The same procedure was applied
sing samples spiked with TC or CTC. The achieved recoveriesanged from 74% to 95% (Table 7), being suitable and comparableith chromatographic reference figures.
Moreover, different samples were spiked individually with 30,0 or 90 ng g−1 of the tetracyclines and analyzed by HPLC. Theecoveries obtained were between 64% and 88%. A linear regres-ion model proved that for a 95% probability, ELISA and HPLC resultsere statistically comparable.
.7. Analysis of commercial fish samples
In order to confirm the utility of the immunoassay method-logies, nine commercial fish samples obtained from differentupermarkets and of different origins were analyzed. Samples wereuantified by means of the average calibration curve obtained usingetracycline-free fish extract. OTC residues were detected in fouramples. Using TR-FIA method, the concentrations found rangedrom 92 to 4 �g kg−1 (Table 8). These results were comparableo those obtained by the reference HPLC method. However, withhe reference method only one sample presented a quantifiableoncentration. The different results obtained by the three appliedethodologies can be attributed to the difficult quantification at
oncentrations lower than the DR. In all cases, it is important totate that the concentration levels found in all samples were underhe MRL established by the European Union; therefore, they cane commercialized safely. The main interest of these results is toemonstrate that the proposed method is suitable to carry out aood safety control program.
. Conclusions
An immunochemical method to determine OTC, one of the mostsed antibiotics in aquaculture has been developed. In this work,wo different detection modes, photometry and TR fluorometryere studied, and the results obtained are statistically compara-
le to those obtained by a reference HPLC method. In regards to
[
[[
mica Acta 662 (2010) 177–185
sensitivity, the LOD achieved for OTC by TR-FIA was lower thanthat obtained with HPLC. Moreover, the immunoassay techniquehas the advantages of low cost, high speed and portability. Theresults obtained by both immunoassays with different detectionmodes revealed that TR-FIA presented slightly higher sensitivitythan ELISA. It allowed reliable quantification of concentrationsmuch lower than MRL.
In addition, the simple and fast sample treatment developedprovides a rapid method that can be applied as screening alertmethod for a large number of commercial sea bream samples andsimilar species. The matrix effect was overcome by preparing atetracycline-free fish extract calibration curve, therefore, avoidingthe use of tedious standard addition and quantification method,leading to a considerable reduction of analysis time.
In addition, by means of the exhaustive optimization of theimmunoassays, the immunoreagents concentrations were con-siderably reduced (0.0156 �g mL−1 for OVA–TC1 and 1/8000 forserum).
The optimized immunoassays can be applied to analyze othertetracyclines (TC and CTC) used in aquaculture. It is important tostate this application because aquaculture feeds are spiked withonly one antibiotic. The procedure developed in this work is animportant contribution to assure compliance levels for tetracyclineresidues in fish samples and to accomplish a high food safety ofcommercial fish samples obtained from aquaculture.
Acknowledgments
The authors are grateful to the Spanish Ministerio de Cien-cia e Innovación (Project PET 2006-009-00) for financial supportreceived.
References
[1] G. Rigos, G.M. Troisi, Rev. Fish Biol. Fisher 15 (2005) 53–73.[2] J.Y. Pailler, A. Krein, L. Pfister, L. Hoffmann, C. Guignard, Sci. Total Environ. 407
(2009) 4736–4743.[3] A. Karci, I. Akmehmet, Sci. Total Environ. 407 (2009) 4652–4664.[4] D.S. Aga, S. O’Connor, S. Ensley, J.O. Payero, D. Snow, D. Tarkalson, J. Agric. Food
Chem. 53 (2008) 7165–7171.[5] S.D. Kim, J. Cho, I.S. Kim, B.J. Vanderford, S.A. Snyder, Water Res. 41 (2007)
1013–1021.[6] Official Journal of the European Communities L224, of 18 August 1990,
Council Regulation 2377/90/EC; consolidated version of the AnnexesI to IV updated up to 27.02.2009 obtained from http://www.emea.europa.eu/htms/vet/mrls/s.htm.
[7] C. Blasco, A. Di Corcia, Y. Picó, Food Chem. 116 (2009) 1005–1012.[8] P. Vinas, N. Balsalobre, C. López, M. Hernández, J. Chromatogr. A 1022 (2004)
125–129.[9] J.M. Miranda, J.A. Rodríguez, C.A. Galán, J. Chromatogr. A 1216 (2009)
3366–3371.10] Y. Zhang, S. Lu, W. Liu, C. Zhao, R. Xi, J. Agric. Food Chem. 55 (2007) 211–218.11] D.J. Fletouris, E.P. Papapanagiotou, Anal. Bioanal. Chem. 391 (2008) 1189–1198.12] J.B. Lee, H.H. Chung, Y.H. Chung, K.G. Lee, Food Chem. 105 (2007) 1726–1731.13] P. Penido, S. Rath, F.G. Reyes, Food Chem. 109 (2008) 212–218.14] A. Townshend, W. Ruengsitagoon, C. Thongpoon, S. Liawruangrath, Anal. Chim.
Acta 541 (2005) 105–111.15] M.T. Meyer, J.E. Bumgarner, J.L. Varns, J.V. Daughtridge, E.M. Thurman, K.A.
Hostetler, Sci. Total Environ. 248 (2000) 181–187.16] W. Ben, Z. Qiang, C. Adams, H. Zhang, L. Chen, J. Chromatogr. A 1202 (2008)
173–180.17] P.A. Blackwell, H.C. Lutzhoft, H.P. MaB, M.B. Halling-Sorensen, A. Boxall, P. Kay,
J. Chromatogr. A 1045 (2004) 111–117.18] Y.S. Kim, J.H. Niazi, M.B. Gu, Anal. Chim. Acta 634 (2009) 250–254.19] L. Asensio, I. González, T. García, R. Martín, Food Control 19 (2008) 1–8.20] N. Velappan, J. Clements, C. Kiss, R. Valero, P. Pavlik, A.R.M. Bradbury, J.
Immunol. Methods 336 (2008) 135–141.21] T.C. O’Riordan, A.E. Soini, J.T. Soini, D.B. Papkovsky, Anal. Chem. 74 (2002)
5845–5850.22] T.C. O’Riordan, J. Hynes, D. Yashunski, G.V. Ponomarev, D.B. Papkovsky, Anal.
Biochem. 342 (2005) 111–119.23] R. Romero, J.C. López, E. Gómez, A. Garrido, J.L. Martínez, J. Chromatogr. B 857
(2007) 142–148.24] D.S. Aga, R. Goldfish, P. Kulshrestha, Analyst 128 (2003) 658–662.25] J. Zhu, D.D. Snow, D.A. Cassada, S.J. Monson, R.F. Spalding, J. Chromatogr. A 928
(2001) 177–186.

ca Chi
[
[
[[[
[
C. Cháfer-Pericás et al. / Analyti
26] H.Z. Senyuva, J. Gilbert, J. Chromatogr. B, 2009, doi:10.1016/j.jchromb.
2009.05.042.27] A.D. Cooper, G.W.F. Stubbings, M. Kelly, J.A. Tarbin, W.H.H. Farrington, G.Shearer, J. Chromatogr. A 812 (1998) 321–326.
28] L. Wang, H. Yang, C. Zhang, Y. Mo, X. Lu, Anal. Chim. Acta 619 (2008) 54–58.29] C.R. Anderson, H.S. Rupp, W.H. Wu, J. Chromatogr. A 1075 (2005) 23–32.30] B.A. Faraj, F.M. Ali, J. Pharmacol. Exp. Ther. 217 (1981) 10–14.
[[
[[
mica Acta 662 (2010) 177–185 185
31] N. Pastor, S. Morais, A. Maquieira, R. Puchades, Anal. Chim. Acta 594 (2007)
211–218.32] J.J. Langone, H. van Vanukis, Methods Enzymol. 84 (1982) 628–640.33] T.C. O’Riordan, A.E. Soini, D.B. Papkovsky, Anal. Biochem. 290 (2001) 366–
375.34] GESAMP. Rep. Stud., vol. 65, 1997, 44 pp.35] S. Huq, M. Garriques, K.M.R. Kallury, J. Chromatogr. A 1135 (2006) 12–18.