Embed Size (px)
Citation preview
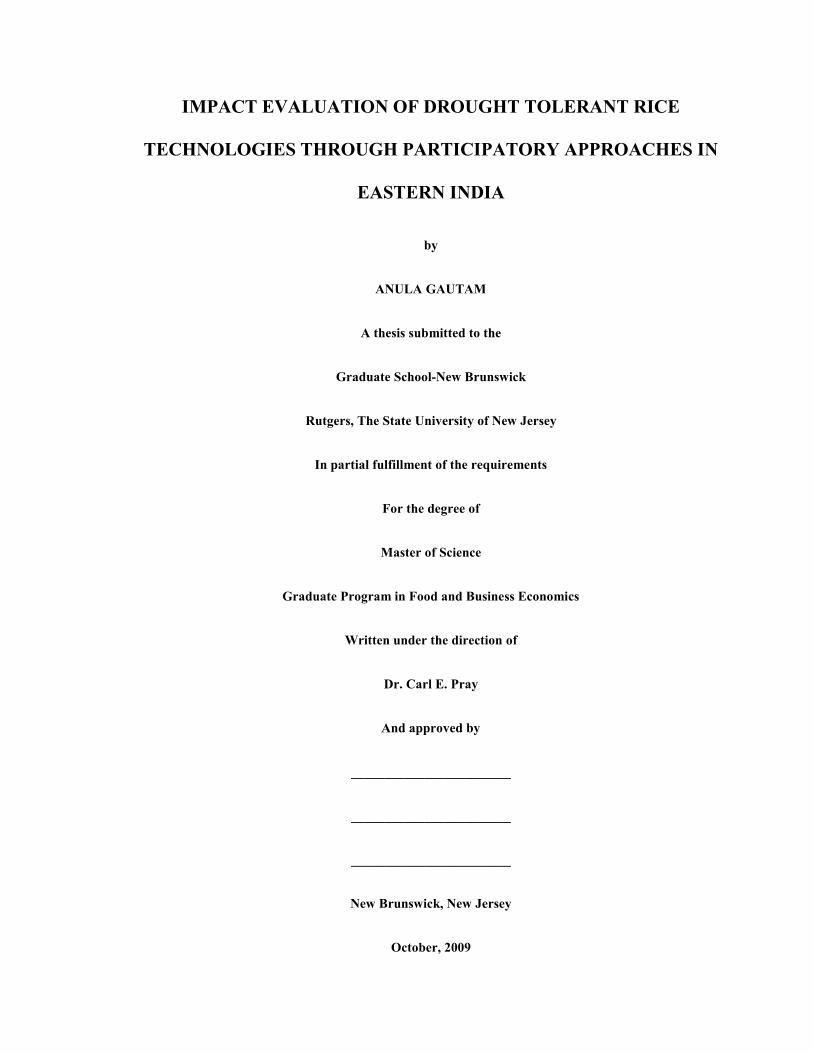
IMPACT EVALUATIO OF DROUGHT TOLERA T RICE
TECH OLOGIES THROUGH PARTICIPATORY APPROACHES I
EASTER I DIA
by
A ULA GAUTAM
A thesis submitted to the
Graduate School- ew Brunswick
Rutgers, The State University of ew Jersey
In partial fulfillment of the requirements
For the degree of
Master of Science
Graduate Program in Food and Business Economics
Written under the direction of
Dr. Carl E. Pray
And approved by
________________________
________________________
________________________
ew Brunswick, ew Jersey
October, 2009
ii
ABSTRACT OF THE THESIS
IMPACT EVALUATIO OF DROUGHT TOLERA T RICE TECH OLOGIES
THROUGH PARTICIPATORY APPROACHES I EASTER I DIA
by
A ULA GAUTAM
Thesis Director:
Dr. Carl E. Pray
Rice is a staple food crop grown and consumed widely in India. A larger portion of rice
acreage in India is still occupied by land race cultivars mostly cultivated by small and
marginal farmers. This situation is more prevalent in upland rice farming. Upland
farmers in Eastern India lacked high yielding rice variety with good quality and
quantitative attributes and hence mostly cultivated poor yielding cultivars. In the late
1990s, a new approach known as Participatory Plant Breeding was adopted for breeding
drought tolerant rice varieties suitable for upland cultivation in Eastern India. This was
funded through Department For International Development (DFID), UK and
implemented in collaboration with University of Wales at Bangor, UK in partnership
with Gramin Vikas Trust (GVT), an NGO and Birsa Agricultural University (BAU). The
research lead to the development of two upland rice varieties Ashoka 200F and Ashoka
228 and medium land varieties such as Sugandha 1 and Barkhe. Seed production and
dissemination for these drought resistant cultivars has taken place through NGOs,
farmers, and other innovative mechanisms of seed supply. However, the research and
dissemination activities are carried out through donor funded projects of DFID and
iii
Rockefeller Foundation. No private companies are interested in the multiplication of
these improved cultivars due to lack of profit margins. This research is aimed at
evaluating the economic benefits of drought tolerant rice research investments and its
adoption in Eastern India. We use the economic surplus model to compare the cost of
research and diffusion programs through participatory plant breeding in Eastern India.
Further, the causal relationship between yield levels of upland varieties obtained at the
farmers’ fields through trials in relation to their location and varietal characteristics were
determined using simple OLS regression method. We used Unnevehrs’ hedonic price
model to calculate the consumer and producer surplus attributing the difference in prices
between Ashoka and BG102 to better quality. Lastly, we estimated efficiency of
Rockefeller funding component towards the drought tolerant rice research and seed
dissemination in Eastern India. Preliminary results favored higher social returns towards
both drought tolerant rice research and dissemination efforts in Eastern India.
iv
ACK OWLEDGEME TS
It is my pleasure to thank everyone who has helped me with my thesis. I feel very
fortunate to have become a part of our department and to have met so many helpful and
friendly people during the course of my study. I would like to thank my advisor Dr.Pray
for the opportunity to work under his guidance, for his advice and support all though the
program. I would like to thank Dr. Latha Nagarajan for her contribution, support and for
being so approachable and friendly. I would like to thank Dr.Bhuyan for always
answering all my questions promptly, Dr Camasso and Dr.Tavernier for their suggestions
and for being on my committee. It was a pleasure to work with Dr Camasso. I would like
to thank Dr. Puduri and Dr Toole for sharing his articles and books. Marshalene Houston
for all her help.
It was great spending time with Rupa, Smriti, & Metin and my other colleagues. I would
like to thank them for their support.
None of this would have been possible without the unwavering support of my loving
husband Aasheesh. I thank him for always being there and Aarush for making my life
complete with all his naughty tricks.
Last but not the least I would like to thank everyone in my family for being so helpful
and understanding, especially my parents for their unconditional love and support.
v
TABLE OF CO TE TS
ABSTRACT OF THE THESIS…………………………………………………………...ii
ACKNOWLEGEMENTS………………………………………………………………...iv
TABLE OF CONTENTS………………………………………………………………....v
LIST OF TABLES………………………………………………………………………. ix
LIST OF ILLUSTRATIONS…………………………………………………….............xi
LIST OF ACRONYMS……………………………………………………………….... xii
CHAPTER 1: INTRODUCTION AND BACKGROUND………………………………1
Drought tolerance research………………………………………………………..............5
Purpose of the study and research objectives……………………………………..............7
Methods used……………………………………………………………………..............8
CHAPTER 2: PLANT BREEDING RESEARCH IN INDIA………………...................9
Alternative types of plant breeding……………………………………………….............9
a) Conventional breeding…………………………………………………………………9
b) Biotech breeding……………………………………………………………….............9
c) Participatory breeding…………………………………………………………............10
Participatory research and extension in Eastern India…...………………………………12
Impact assessment of PPB varieties……………………………...………………………14
Adoption...........................................................………………………………….............18
vi
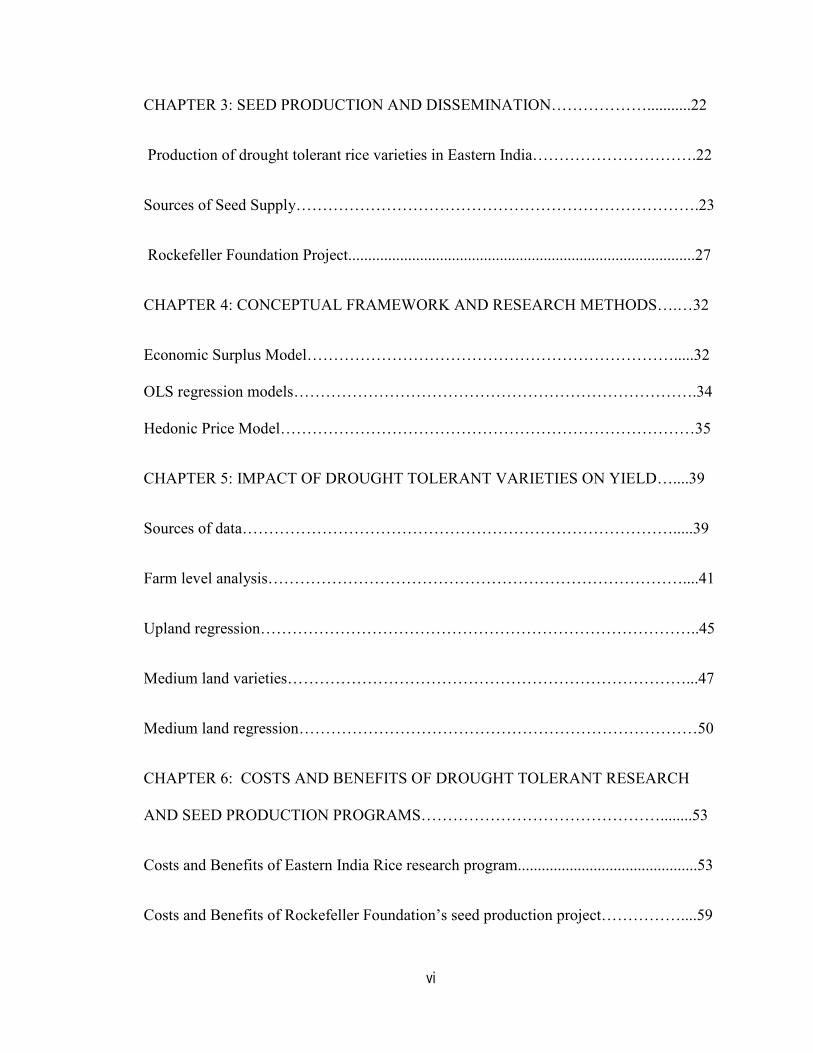
CHAPTER 3: SEED PRODUCTION AND DISSEMINATION………………...........22
Production of drought tolerant rice varieties in Eastern India………………………….22
Sources of Seed Supply………………………………………………………………….23
Rockefeller Foundation Project.......................................................................................27
CHAPTER 4: CONCEPTUAL FRAMEWORK AND RESEARCH METHODS….…32
Economic Surplus Model…………………………………………………………….....32
OLS regression models………………………………………………………………….34
Hedonic Price Model……………………………………………………………………35
CHAPTER 5: IMPACT OF DROUGHT TOLERANT VARIETIES ON YIELD…....39
Sources of data……………………………………………………………………….....39
Farm level analysis……………………………………………………………………....41
Upland regression………………………………………………………………………..45
Medium land varieties…………………………………………………………………...47
Medium land regression…………………………………………………………………50
CHAPTER 6: COSTS AND BENEFITS OF DROUGHT TOLERANT RESEARCH
AND SEED PRODUCTION PROGRAMS………………………………………........53
Costs and Benefits of Eastern India Rice research program.............................................53
Costs and Benefits of Rockefeller Foundation’s seed production project……………....59
vii
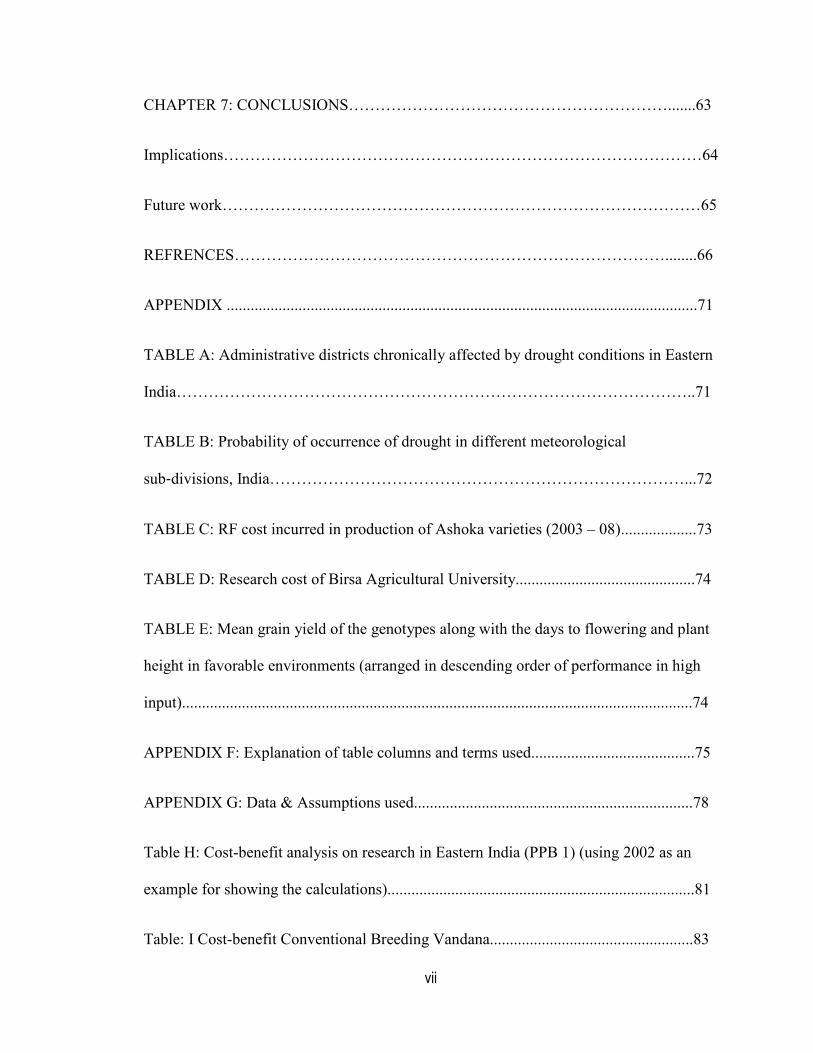
CHAPTER 7: CONCLUSIONS…………………………………………………….......63
Implications………………………………………………………………………………64
Future work………………………………………………………………………………65
REFRENCES………………………………………………………………………........66
APPENDIX ......................................................................................................................71
TABLE A: Administrative districts chronically affected by drought conditions in Eastern
India……………………………………………………………………………………..71
TABLE B: Probability of occurrence of drought in different meteorological
sub‐divisions, India……………………………………………………………………...72
TABLE C: RF cost incurred in production of Ashoka varieties (2003 – 08)...................73
TABLE D: Research cost of Birsa Agricultural University.............................................74
TABLE E: Mean grain yield of the genotypes along with the days to flowering and plant
height in favorable environments (arranged in descending order of performance in high
input)................................................................................................................................74
APPENDIX F: Explanation of table columns and terms used.........................................75
APPENDIX G: Data & Assumptions used......................................................................78
Table H: Cost-benefit analysis on research in Eastern India (PPB 1) (using 2002 as an
example for showing the calculations).............................................................................81
Table: I Cost-benefit Conventional Breeding Vandana...................................................83
viii
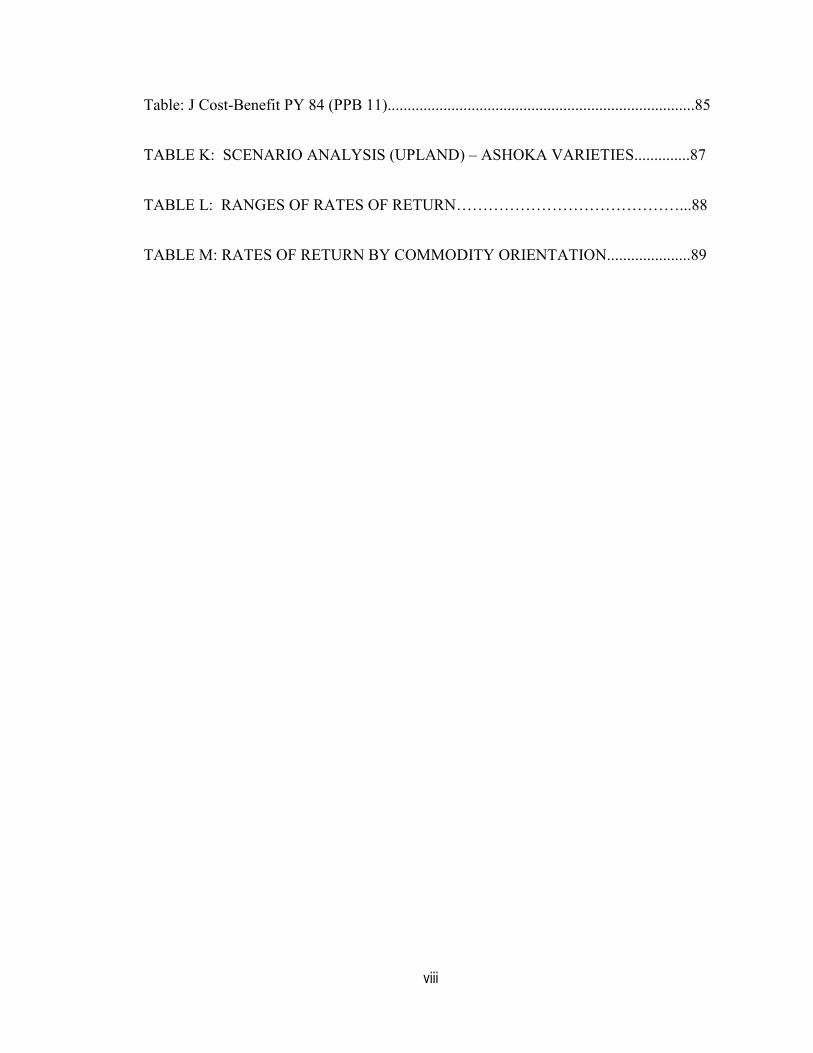
Table: J Cost-Benefit PY 84 (PPB 11).............................................................................85
TABLE K: SCENARIO ANALYSIS (UPLAND) – ASHOKA VARIETIES..............87
TABLE L: RANGES OF RATES OF RETURN……………………………………...88
TABLE M: RATES OF RETURN BY COMMODITY ORIENTATION.....................89
ix
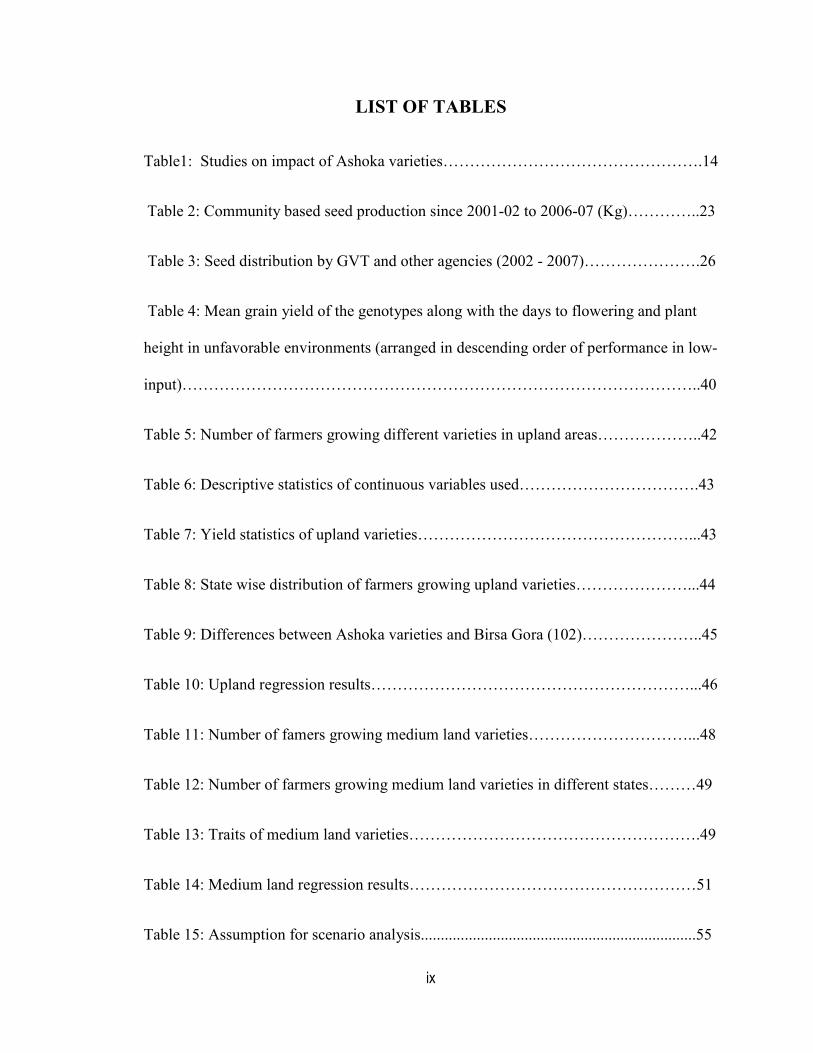
LIST OF TABLES
Table1: Studies on impact of Ashoka varieties………………………………………….14
Table 2: Community based seed production since 2001-02 to 2006-07 (Kg)…………..23
Table 3: Seed distribution by GVT and other agencies (2002 - 2007)………………….26
Table 4: Mean grain yield of the genotypes along with the days to flowering and plant
height in unfavorable environments (arranged in descending order of performance in low-
input)……………………………………………………………………………………..40
Table 5: Number of farmers growing different varieties in upland areas………………..42
Table 6: Descriptive statistics of continuous variables used…………………………….43
Table 7: Yield statistics of upland varieties……………………………………………...43
Table 8: State wise distribution of farmers growing upland varieties…………………...44
Table 9: Differences between Ashoka varieties and Birsa Gora (102)…………………..45
Table 10: Upland regression results……………………………………………………...46
Table 11: Number of famers growing medium land varieties…………………………...48
Table 12: Number of farmers growing medium land varieties in different states………49
Table 13: Traits of medium land varieties……………………………………………….49
Table 14: Medium land regression results………………………………………………51
Table 15: Assumption for scenario analysis.....................................................................55
x
Table 16: Change in Adoption rates…………………………………………………….58
Table 17: Internal Rate of Return for seed production and dissemination……………...61
xi
LIST OF FIGURES
Figure 1: Economic Surplus Model……………………………………………………..32
Figure 2: Benefits over time for different varieties…………………………….………. 56
Figure 3: Increased value due to Ashoka varieties………………………………………60
xii
LIST OF ACRO YMS
RF Rockefeller Foundation
PPB Participatory plant breeding
PVS Participatory varietal selection
MAS Marker Assisted Selection
ABSP II Agricultural Biotechnology Support Project II
TNAU Tamil Nadu Agricultural University
GVT Gramin Vikas Trust
BAU Birsa Agricultural University
CAZS Center for Arid Zone Studies
DST Drought and Salinity Tolerant
IDRC International development research center
CIAT International Center for tropical agriculture
KRIBHCO Krishak Bharati Cooperative Limited
KVK Krishi Vigyan Kendras
NGO Non- Governmental Organization
CTS Change in Total Surplus
xiii
A 200F Ashoka 200F
A228 Ashoka 228
BG102 Birsa Gora 102
Breeder seed: is seed whose production is personally supervised by a qualified plant
breeder and which provides the source for the initial and recurring increase of foundation
seed.
Foundation seed: is the progeny of breeder seed and it can be clearly traced to breeder
seed.
Certified Seed: is the progeny of foundation seed. Its production should be undertaken in
a way that specific genetic identity and purity are maintained according to the standards
prescribed for the crops certification.
1
1. I TRODUCTIO A D BACKGROU D
India is considered to be one of the primary centers of origin for rice (Oryza sativa (sp)
indica) in the world. Rice is a major staple food cereal here, and next to wheat, is
extensively cultivated across all regions. India contributes 21.5% of the global rice
production, second only to China in this regard. Rice production is carried out on 44
million hectares of land (FAOSTAT, 2007). India produced 143 million tons of rice in
2007 out of which 91 million tons were consumed (USDA, 2007). India is one of the
largest exporters of rice – it exported 4 million tons of milled rice in 2007 (Oryza.com).
Basmati is the major rice variety being exported from India with nearly 0.84 million tons
exported in 2006-07 (Oryza.com).
Though rice is cultivated in all regions in India, it is concentrated mainly in the Eastern
states of Assam, Bihar, West Bengal, Jharkhand, Chhattisgarh and Orissa. These are the
major rice-growing areas, accounting for about half of the total rice production in the
country (Pandey, 2007). Some of the northern central states producing rice are Madhya
Pradesh, Uttar Pradesh and Punjab. In south, rice is grown in Tamil Nadu, Karnataka and
Andra Pradesh. Rice-based production systems provide the main source of income and
employment for more than 50 million households in the country. Rice is the staple food
for 65% of the total population in India (www.fao.org).
The varieties cultivated in Eastern India are more localized, land cultivars with few
improved varieties. The most common varieties of rice grown here are White Gora, Red
Gora, Khandagiri, BG102, Anjali, Vandana, China Gora, Malati, Gayabali, Local Gora,
Red Gara,Vandana, Ashoka 200F, Ashoka 228, and Shusk Samrat . High yielding rice
varieties which developed and spread during the Green Revolution in the country are
2
mainly grown in Andhra Pradesh, Punjab, Haryana and Uttar Pradesh. Eastern India did
not gain much from the benefits of green revolution.
Rice is planted mainly in three seasons in Eastern India: June-July, mid August or late
season namely September-October. Rice is grown in different types of land: 1upland,
medium land and 2low land.
Around 253 million hectares of cropland is irrigated worldwide; 100 million of this is in
India and China (Frederiksen, 1993). Rice environments in India are extremely diverse.
Of the over 40 million hectares of harvested rice area, about 33 percent are rainfed
lowland, 45 percent irrigated, 15 percent rainfed upland, and 7 percent flood-prone. Since
the major portion (55 percent) of the area under rice in India is rainfed, production is
strongly tied to the distribution of rainfall (Selvaraj, 2006).
Drought is a very common phenomenon in India - the probability of occurrence of
drought here is 0.46 (Pandey, 2005). Frequency of drought for each period is estimated as
the number of years in which rainfall was below 80% of the long-term average for that
period (Pandey, 2005). The probability of occurrence of drought in different
meteorological subdivisions of India varies from once in 15 years to once in 2.5 years.
Drought occurs once in 5 years in West Bengal, Orissa, Madhya Pradesh, Konkan and
Bihar. It occurs every 2.5 years in Tamil Nadu, West Rajasthan, Jammu and Kashmir and
Telengana (UNDP, 2003) [refer to Appendix B for details].
Effects of moisture shortage on crop production vary depending on when it occurs. Rice
is very sensitive during the grain fill period (Fisher and Fukai 2003) - a drought during
1 Upland rice is grown in conditions without surface water relying solely on rainfall.
2 Lowland rice is grown in fields bunded to retain water; there is adequate water either from rainfall or
irrigation.
3
this period leads to loss of yield. Lack of adequate rainfall in planting season could lead
to poor land preparation, delayed planting and difficulties in weed control. In extreme
cases of drought such as in 2002, farmers are forced to abandon crop production.
Some of the areas which are chronically affected by drought in Orissa are Bolangir,
Kalahandi, Kendrapada & Phulbani. In West Bengal Bankura, Midnapore & Purulia
district are very severely affected by drought. In Bihar district Aurangabad, Bhojpur,
Gaya, Munger, Nawadah & Rohtas have had a very severe impact of drought. [refer to
Appendix A for details]. In Eastern parts of India, with extensive acreage under upland
rice cultivation, drought occurs once in 5 years. A large part of the rice growing area in
Eastern India is semi arid. The local farmers still grow rice in these areas because rice is
their staple food. Farmers tend to grow land races which do not have good yield or grain
quality.
Drought has a very significant impact on agricultural output as well as on the lives of
farmers. Dr. Pandey and his teams’ report on increasing production and sustainability in
rainfed rice focusing on drought prone environments takes a very in-depth look at
drought in Eastern India (Pandey, 2005). It is evident from their report that the impact of
drought is not limited to the farmer or the agriculture sector but affects the entire country.
The economic costs of drought are very high and can become a hindrance to the
development of countries like India which is on the path of rapid economic growth in its
tertiary sector. During 1900 to 2004 the country lost 4.3 million human lives due to
drought; 1.4 billion people were affected with cumulative damages of US$2 billion
(Samra, 2004).
4
The world rice statistics published by the International Rice Research Institute (IRRI)
estimated that 11 percent of rice area in developing countries is under marginal
environments, and is mostly affected by droughts. In such environments the average
yields are less than 2 tons/hectares as opposed to 5.5 tons/hectares in case of irrigated
tropical and subtropical environments (IRRI, 1997).
A closer look at the consumption patterns of rice reveals that there has been a steady
increase in consumption of rice in India. During 1960s, rice consumption was around 35
million tons; and steadily increased to 75 million tons in 2000 and currently stands at 91
million tons (USDA, 2007). The increase in rice consumption in the recent years is
mainly attributed to the increased population growth. With the projected population
growth rate of 1.38 % over the next decade, there is a lot of concern from the scientific
community and policy makers regarding meeting the growing domestic demand for rice.
The current population rate expects an additional 2.33 million tons of rice per annum to
feed the growing demand (Selvaraj, 2006). Increased population growth is also expected
to increase pressure on land utilization as other inputs such as irrigation water decrease
proportionately. One way to keep up with increased demand is to be able to grow drought
tolerant varieties of rice. Since a larger part of agriculture in India is still dependent on
monsoons and is frequently affected by droughts, any efforts to improve the productivity
of rice under drought conditions would not only enhance the overall production but
would also reduce the risk of crop failure.
5
Drought tolerance research
In India, since early 1990s, a number of public and private institutions and universities
are involved in the research of drought tolerant varieties of rice. The rice scientists in
India have long viewed genetic improvement of drought prone or water deficient
environments as a challenge. But in the past three decades the national and state multi
location testing system (All India Coordinated Rice Improvement Program-AICRIP) has
made steady progress in varietal development for marginal areas that includes drought
tolerance (O’Toole, 2004) Researchers in Tamil Nadu, Karnataka and in five states of
Eastern India are using new managed stress environment facilities to operate field-
oriented selection practices (IRRI, 2002; Poland, 2004).
The Indian Council of Agricultural Research (ICAR) has established National Research
Centre on Plant Biotechnology at the Indian Agricultural Research Institute (IARI) in
New Delhi to conduct biotech research on stress tolerance for various field crops. They
are working on gene isolation, resistance in transgenic plants for biotic and abiotic stress
and marker assisted selection. The Department of Biotechnology, established in 1986,
promotes molecular biology and biotechnology research (Pal & Byerlee, 2003), the
department supports seven Centers of Plant Molecular Biology (CPMBs) in different
parts of the country and aims to promote research and human resource development in
plant molecular biology.
Different types of breeding techniques are being used in research. Conventional breeding
using marker assisted selection is used widely in agricultural research in India and has
been discussed in detail in Chapter 2. Biotech breeding is being tried with international
collaboration in Tamil Nadu so far no varieties have been developed using this technique.
6
Participatory plant breeding research is being carried out in Eastern India. The research is
being done by Birsa Agricultural University, Gramin Vikas Trust and Centre for Arid
Zone Research,UK. The PPB approach led to the development of two new upland
varieties Ashoka 200F and Ashoka 228. One technique that we will be evaluating in this
study is the participatory plant breeding technique, also known as client-oriented
breeding technology. It has also been discussed in detail in Chapter 2.
7
Objectives
There has been limited amount of research to breed varieties for marginal rice growing
areas. Recently some novel approaches have been used to develop varieties for farmers
growing rice in upland areas in order to improve their livelihood. This study tries to
evaluate if the research is beneficial to farmers and society as a whole. To do this we
estimate the benefits derived from Ashoka varieties that were developed by this research
by measuring the increases in value of the improved quality and yield compared to the
existing varieties. The main research objectives are summarized below:
1) Measure changes in yield/ productivity levels of different varieties and variability
of these varieties, using data from yield trials of farmer’s fields. Then calculate
the value of the differences in quality of these varieties using the formulas from
Unnevehrs’ hedonic price model.
2) Determine the cost and benefits of research and diffusion programs on drought
tolerant varieties through participatory plant breeding methods in Eastern India.
3) Evaluate the efficiency of Rockefeller financed programs for the seed production
and dissemination of drought tolerant varieties.
8
Methods Used
Our aim is to do a cost benefit analysis to evaluate the impact of research and extension
investment on drought tolerance rice research in Eastern India. We use the costs from
various sources - Indian Council of Agricultural Research expenditure on agricultural
universities in India, Department For International Development, UK, Gramin Vikas
Trust and Rockefeller foundation investment. We also used data from past studies in this
area. We expected the rates of returns to be positive because these varieties do have better
yield and quality attributes. In order to capture the shift in demand due to better quality
we used the hedonic price model by Unnevehr. We used the formulas from hedonic price
model to calculate the change in total surplus due to difference in quality of Ashoka and
BG102 based on the assumption that difference is price is due to better quality.
We use farmers’ trial yield data to see the impact on grain yield of the improved varieties.
We use the yields of varieties from the regression analysis in the economic surplus model
to determine the rates of return of PPB. We used the data from GVT annual reports to
calculate rough estimates of the annual benefits incorporating the yield increase and
quality attributes brought about by dissemination of Ashoka varieties among the farming
households in Eastern India.
9
2. PLA T BREEDI G RESEARCH I I DIA
In India rice breeding program was started by Dr. G. P. Hector, an Economic Botanist in
1911 in undivided Bengal (http://drdpat.bih.nic.in). The rice research program in India
has come a long way since its inception; 720 improved rice varieties have been released
so far and 62% of these varieties are for irrigated areas (Pandey, 2007).The most common
types of breeding used are conventional, Biotech and participatory plant breeding. These
are discussed in detail here.
a) Conventional breeding
In conventional breeding, the progeny inherits genes of both desirable and undesirable
traits from both parents. The breeders conserve desirable characteristics and suppress the
undesirable ones by repeatedly selecting the good progeny from each generation to be
parents of the next. This leads to the development of a new variety. In conventional
breeding thousands of genes get transferred in each cross - these may or may not be of
use for the specific target variety. It is not easy to isolate desired traits due to
incompatibility and difference in species.
b) Biotech breeding
In biotech breeding, new varieties are developed and designed by artificially inserting
genes of favorable attributes from other species. A Number of scientists have been
working on genetically engineered crops (including rice) for various abiotic and biotic
stress tolerant conditions to improve productivity. Biologists working at the Cornell
University, led by Prof. Ray Wu, successfully introduced genes for trehalose sugar
synthesis into indica rice varieties. Trehalose is a simple sugar produced naturally in a
10
wide variety of organisms like bacteria, fungi, yeasts, mushrooms and invertebrates,
particularly insects. Most plants normally do not have much of trehalose, the only
exception being the resurrection plants that can survive prolonged droughts in deserts.
Drought stressed resurrection plants look as if they are dead, but when moisture is
available they spring back to life (Selvaraj, 2006).
Five generations of transgenic rice plants with the trehalose enhancement gene
sequences have been tested in the greenhouse and stress tolerance characteristics have
been observed (Segelken, 2002). Transgenic rice plants are robust under a combination
of environmental stresses when compared with non-engineered rice plants that do not
have the trehalose enhancement gene sequences, Professor Wu’s lab is working on
several other genes for improving drought and salinity tolerance in rice. However, this
technology needs to be transferred before the new varieties can be grown in other
countries. Under the Agricultural Biotechnology Support Project II program researchers
in Cornell University and TNAU are working closely on drought and salinity tolerant
rice. The department of Plant Molecular Biology and Biotechnology of TNAU is
conducting research on genetic engineering of rice for disease and pest resistance and
creating a database on upstream sequence of drought/salt stress inducible genes in rice
(http://btisnet.gov.in/uniquepage.asp).
c) Participatory plant breeding
During the early 1970’s and 80’s, participatory varietal selection (PVS) was carried out
as a part of farming systems research or participatory research (Walker, 2006). More
recently farmers are being involved in earlier stages of selection in plant breeding. One of
11
the first applications of PPB was in Cauca Valley in Colombia where three farmer
breeders worked with breeders in the CIAT bean program. The selections made by the
farmer breeders helped in getting information on the demand for characteristics across
several environments (Kornegay, 1996). The term PPB and the acronym PVS were
coined at an IDRC workshop in 1995. The first joint use of PPB and PVS took place in
Experimental Agriculture in the following year (Witcombe, 1996). Since 1995, about 30
articles relevant to PPB have been published in the plant-breeding journal Euphytica
(Walker, 2006).
Participatory research can be used to increase benefits if proper choices are made about
the research goals, selection of user communities and environments (Ashby & Lilja,
2004). Participatory research is based on different modes of participation. There are two
groups of decision makers - the scientists (including research programs and extension
agencies) and the farmers. The types of participation are conventional, consultative,
collaborative, collegial and farmer experimentation.
A systematic understanding of different types of participation is needed to select suitable
participatory research tools and techniques (Ashby & Lilja, 2004). The impact is also
based on how early in the breeding process participation is sought. The innovation
process is divided into three stages - design, testing and diffusion. The outcomes vary
depending on who makes the decision and when.
A study in Nepal used participatory breeding in rice. The varieties produced were tested
in mother baby trials in Bangladesh (Witcombe, 2004). The study discusses the
techniques used by PPB in using germplasm that meets the demand of the farmers,
12
identifying the farmers, matching the environments and testing the varieties in the
targeted area with the farmers. These varieties were accepted by farmers in a very short
span of time indicating the success of participatory plant breeding (Witcombe, 2004).
PPB Research and Extension in Eastern India
Marginal farmers of Eastern India grow rice on rainfed uplands which typically are less
fertile. They desire varieties that could escape the end of season drought and also give a
high yield of grain and fodder.
In 1997 a collaborative project was started in Jharkhand by GVT (E), Center for Arid
Zone Studies, Bangor, Wales and Birsa Agricultural University (BAU). In 2001 it led to
the release of first high yielding and early maturing varieties for rainfed uplands in
Jharkhand. They looked at the available upland varieties. Amongst them Kalinga III was
identified as a variety with advantages of early maturity, high grain yield, high fodder
yield and good cooking quality but a limitation of poor lodging resistance . In the PPB
program Kalinga III was crossed with IR64 (GVT report, 2007) and used as a parent in
participatory plant breeding research to breed two varieties - Ashoka 228 and Ashoka
200F. These varieties seemed to be superior, drought tolerant and more cost effective
than the land races. These varieties yield more than the control varieties including
Kalinga III in both research trials and trials in farmers’ fields (Virk & Witcombe, 2003).
Collaborative and Consultative breeding was used to produce the two Ashoka varieties.
In case of Ashoka 200F, collaborative breeding was used – here farmers grow and select
materials in their field. In case of Ashoka 228 however, consultative breeding was used –
here farmers select among progenies in researchers plots.
13
In 1995 village surveys were conducted which showed that in the rainfed uplands farmers
grew coarse-grained rice landraces that had low yields. In 1995 and 1996 appraisals were
conducted by focus group discussions and individual interviews to find out the varietal
traits that farmers were looking for in the new varieties. Study started in 1997 in
collaboration with Birsa Agricultural University Ranchi and Center for Arid Zone Studies
(CAZS) varieties were selected based on PVS trials and BAU data. Research-station
trials were conducted by BAU, Ranchi at various locations. Participatory trials were done
in the form of mother and baby trial methods for participatory evaluation (Joshi &
Witcombe, 1996).
Mother trial was a single randomized replicate of all the test entries and controls grown
in farmers fields. The trial was replicated across farmer’s fields. Forty trials were
conducted in the rainy season in 2000 and 2001 in GVT villages in Jharkhand, Orissa and
West Bengal. Data was collected on grain yield, days to 50% flowering, height and straw
yield. The farmers received the seed packets with a plot number, allocated at random by
researchers, and the variety name. All plots were managed according to the farmers’
practices for irrigation, fertilizer, weeding and other inputs. A farm walk was organized
to find out farmers’ views regarding earliness, disease, insects and pests and lodging
resistance. After the harvesting, focus group discussions were held to evaluate varieties
for traits like grain type, grain straw yield, grain colour, cooking quality. For all the traits
considered important by farmer matrix ranking was done.
Baby trials were single replicate single test entry trials with farmers as replicates. The
trials were conducted by 198 farmers in Jharkhand, West Bengal and Orissa in 2001. Out
of these 65 were for Ashoka 200F and 128 for Ashoka 228. In about 50% of the baby
14
trials of A200F and A228, Kalinga III was used as the preferred check and Birsa Gora
102 as the local check. After harvest, a household level questionnaire was completed to
determine the perceptions of the household.
Qualitative data from participatory trials were highly informative, statistically analysable
and cheaper to obtain than quantitative data (Virk & Witcombe, 2003). Some of the
studies done by Mottram, Bourai, Ratan and Paul (GVT report, 2007) conclude that the
Ashoka varieties have greater yield, early maturity, higher adoption, higher adaptability
and increased food sufficiency.
Impact Assessment of PPB Varieties
Surveys were done in 2002, 2004 and 2006 to estimate the impact of these PPB varieties.
A number of studies were carried out for the impact assessment. A summary of those
studies is given in Table 1.
Table 1: Studies on impact of Ashoka varieties
ID Study Details Chief Conclusions
1 (a) Author: V.A. Bourai
(Dec 2002)
(b) :159
(c) Location: Jharkhand,
Orissa, West Bengal
• High preference (97% would grow again) for new
varieties for their high yield, earlier maturity, good
grain quality and higher market price.
• High adoption rates (occupy 50% of household
upland area in three states) of up to 100% of
household upland area.
• Seed spread up to 300 km and sales from 2 to 2000
15
kg.
• The majority of farmers indicated small to large
effects of new varieties on livelihoods.
2 (a) Author: P.D. Paul
(Nov/Dec 2004)
(b) : By group meetings
(farmers 324)
(c) Location: Jharkhand,
Orissa, West Bengal
• Farmers get 50 to 300% yield increase over local
varieties.
• Identified a seed demand of about 700 tons
• There is a huge seed supply gap. Private seed
companies are not interested in upland rice seed
production because of low profits.
3 (a) Author: P.D. Paul
(Aug 2005)
(b) : By group meetings
(c) Location: Jharkhand,
Orissa, West Bengal
• Ashoka varieties have broad adaptability. Also
grown in medium lands by broadcasting or
transplanting due to high drought in 2005
• High rate of farm saved seed (50 and 100%) from
2004 to2005.
• Predicted a demand of over 350 t seed demand for
the main season of 2006.
4 (a) Author: CAZS-NR
(March 2004)
• High preference (100% would grow again) for new
varieties for their high yield, earlier maturity, good
grain quality and higher market price.
16
(b) : 150
(c) Location: Jharkhand,
Orissa, West Bengal
• High adoption rates (70% to 100% of household
upland area in different states).
• High rate of replacement of local varieties.
• Increase in food sufficient by 2 to 3 months and
trebling of grain sales from 60 to 207 kg per family
• 70% farmers reported more than 20% increase in
on-farm income with improved livelihoods.
5 (a) Author: A. Mottram
(Oct 2004)
(b) : Whole village
(c) Location: Jharkhand,
Orissa, West Bengal
• Confirms findings of household surveys done in
2002 and 2004
• High adoption rate cultivated in (30% of upland
area)
• Informal seed spread is slow
6 (a) Author: R.P.S. Ratan
(April/May 2007)
(b) : 106
(c) Location: Jharkhand,
Orissa, West Bengal
• High adoption rate (66% average upland area)
• New varieties occupy 93% upland area of modern
varieties.
• Average 20 to 80 kg seed transaction up to 500 km.
• Replaced 7 landraces and 3 modern varieties.
• 70% increase in seed sale and 140% increase in
income from new varieties.
17
• Food sufficiency increase by 3 months (36%
increase).
• Earlier maturity gives new options (increase in
cropping intensity from 100 to 200%).
(Source: adapted from GVT annual report 2007-08)
The participatory rural appraisals showed that farmers mostly grew coarse-grained
landrace ‘Brown Gora’ and a similarly coarse-grained released selection from it, ‘Birsa
Gora 102’ which was used as a local check in the trials. The adoption of improved
varieties, including Kalinga III, was very low. The village surveys by GVT showed that
irrigation was rarely available, farm holdings were typically very small, and had shallow,
infertile soils on sloping lands that gave poor yields of upland rice.
Farmers desired varieties with the following characteristics (Virk & Witcombe, 2003):
• early vigor to reduce weeds in the initial stages;
• early maturity (<100 days) to escape from end-of-season drought;
• tall plants (about 100 cm) for higher fodder yield;
• stiff straw and resistance to lodging;
• tolerance to major pests and diseases;
• higher grain yield;
• good cooking quality
In the research station trials in Jharkhand, both Ashoka 200F and Ashoka 228 yielded
significantly more than both Kalinga III and Birsa Gora 102 at most locations. In the
within-state, within-year analyses of mother trials, both Ashoka 200F and Ashoka 228
18
yielded significantly more than the check varieties, Kalinga III and BG 102. The overall
mean grain yield of Ashoka 200F and Ashoka 228 over 40 trials was 51–56% more than
BG 102 (p ≤ 0.001), and 19–23% more than Kalinga III (p ≤ 0.05) (Virk & Witcombe,
2003). In baby trials, both Ashoka 200F and Ashoka 228 yielded significantly more than
BG 102 and Kalinga III.
In the mother trials of 2000, farmers observed that the Ashoka varieties had superior
cooking quality to BG 102 (80% for Ashoka 200F and 95% for Ashoka 228) - Kalinga III
was also superior for cooking quality to BG 102 but to a lesser extent (Virk & Witcombe,
2003).
Adoption
Another study (Virk & Witcombe, 2006) examines the case of adoption of Ashoka
varieties in three states in Eastern India - Jharkhand, West Bengal and Orissa. Surveys
were carried out that confirmed low adoption of modern varieties in the upland
ecosystem. Farmers in marginal and diverse agricultural environments maintain landrace
diversity to sustain production under adverse environmental changes or reduce the risk of
poor production years (Rosenzweig and Stark 1989). Farmers do not feel the need to
replace land races because the modern varieties are not an attractive option. They pay a
price in terms of lost yield potential, when they grow a low-yielding variety because it
has resistance to a biotic or abiotic stress. This lost yield is a measure of the farmer’s
willingness to pay for genetic diversity. Thus on-farm varietal diversity is high in
marginal agricultural environments. This paper determines how farmers traded-off
diversity for higher yield.
19
Packets of Ashoka 200F and Ashoka 228 seed were distributed to farmer groups in the
GVT project villages. A community based seed production program was facilitated by
GVT from 2001 to 2004, with the seed produced provided to thousands of farmers. In
March 2004, 150 farmers in the GVT project villages who had previously been given
seed of one of the two varieties were interviewed. The survey included only those
farmers who were given seed of Ashoka varieties by GVT or by other farmers. The seed
was given to 6% of total households in Jharkhand, 8% in West Bengal and 2% in Orissa.
Each household was asked, using semi-structured questionnaires, about their use of the
new varieties from 2001 to 2003. Responses of farmers’ from the 2004 survey were
compared with results of an earlier survey in December 2002 on 159 farmers (76 in
Jharkhand, 45 in West Bengal and 38 in Orissa) (Bourai, 2002; Virk, 2003a).
The results of the study show that farmers had adopted modern varieties to different
extents in the three states but most were released many years ago, e.g. Kalinga III was
released in 1983 and Heera in 1988 (both in Orissa). The adoption was not high in any of
the states. Very few farmers grew a modern variety and those that did, grew it on a
minority of their land. Vandana (released in 1992 in Bihar) was less popular than Kalinga
III and has been identified as the most preferred variety in GVT’s PVS trials since 1996.
The yield of grain and straw for Vandana is more than local varieties but its grain quality
is poor. Adoption of older modern varieties was highest in Jharkhand. In Orissa, adoption
was the lowest where coarse-grained modern varieties such as Heera (released in 1988 in
Orissa), Annapurna (released in 1968 in Madhya Pradesh) and Khandagiri (released in
1993 in Orissa) were grown by, at most, 15% of farmers on a very small proportion of
their land (Virk & Witcombe, 2006).
20
Nearly all of the householders who had tried the varieties continued to grow them.
Acceptability of A 200F was lower than that of A 228 - of the 42 households in all three
states who grew both varieties, 38 (90%) preferred A 228 to A 200F. Hence,
progressively fewer households grew A200F and by 2004, 37 (66%) of the 56 farmers
that were originally given seed in 2001 or 2002 continued to grow it. This compares with
the 90 to 100% of farmers (depending on the year and state) who continued to grow A
228. On average, 45% of farmers in all states devoted 100% of their upland fields to the
new varieties (Virk & Witcombe, 2006).
Majority of farmers in the 2002 and 2004 surveys perceived that, in comparison with
local varieties, the new Ashoka varieties were, higher yielding in grain and fodder, earlier
to mature and had better quality of grain. They got a higher market price because of their
long-slender grains. The price advantage in the 2004 survey averaged 12% for both
varieties over all three states (Rs 6.28 per kg for the Ashoka varieties and Rs 5.62 per kg
for the local variety) (Virk & Witcombe, 2006). After the severe drought of 2002, most
farmers reported that the new varieties had better drought tolerance and weed
suppression. In matrix rankings conducted during the 2004 survey the best variety was
given the highest ranking. The Ashoka varieties scored high for all traits.
A large number of farmers reported that they had already replaced or intended to replace
by 2004 at least a landrace or modern variety with either A200F or A228. There was a
significant decline in the number of farmers growing any landrace in Jharkhand and
Orissa with only West Bengal having a non significant decline. Although both Ashoka
varieties were liked and adopting farmers increased the area under them A 228 was
preferred over A200F. This preference for A 228 may be because of the type of land and
21
area of the surveyed farmers that was slightly more favorable than the harsher
environments where A200F performs better. A 200F is popular in areas where drought is
of a more consistent occurrence, e.g., the worse drought-hit areas of Kalahandi and
Bolangir districts of Orissa that were excluded from the current survey as they lay outside
of the GVT project area (Virk & Witcombe, 2006). When participatory plant breeding
methods were used successfully the need for trade-offs was reduced. Farmers expanded
the cultivation of Ashoka varieties into the medium lands in Jharkhand; of the 57 sampled
farmers, 8 in 2002 and 11 in 2003 grew them in medium land. The average area per
household increased in the medium land from 0.24 ha to 0.31 ha in this period. Fallow
land was brought into cultivation. In 2002 in Orissa, 19 of the 33 sampled households
grew them on an average of 0.23 ha of what would have been fallow land in 2002. This
increased to 20 farmers and an average area of 0.30 ha by 2003.Cultivation on rented
land also increased; of the 150 sampled farmers 6 rented land to grow them on an average
of 0.24 ha in 2002. In 2003, 11 farmers did so on an average of 0.29 ha (Virk &
Witcombe, 2006).A200F and A 228 varieties were tolerant to abiotic stress and had no
disadvantages in comparison to local landraces. In chapter 3 we talk about seed
production for these drought tolerant rice varieties, seed supply and the role played by
Rockefeller foundation in the research and dissemination of these varieties.
22
3. SEED PRODUCTIO A D DISSEMI ATIO
Production of drought tolerant rice varieties in Eastern India
The farmers in Eastern India were provided seed of Ashoka varieties by Gramin Vikas
Trust (GVT) during the first year for further multiplication through self help groups. The
seed production activities were mainly concentrated in the villages around Haldikundi in
Dekhanal district in Orissa during Rabi 2002-2003. The crop was monitored by plant
breeders and consultants during the entire production period. At the end of the season, the
seed was procured by GVT and were offered 20 % premium price than the existing seed
rates of the government agency (GVT report, 2003-04). The Ashoka varieties were not
notified by the Government of India till 2005, self help groups were mobilized by GVT to
produce truthfully labeled seed from the year 2001 for further distribution among
farmers. Since then the community based seed production has increased over the years.
Various NGO’s and the Catholic Relief Services (CRS) were also further involved in
distribution of the multiplied Ashoka variety seeds across the eastern India states. The
table below shows the amount of seed distributed through GVT efforts in Eastern India
till the year 2007.
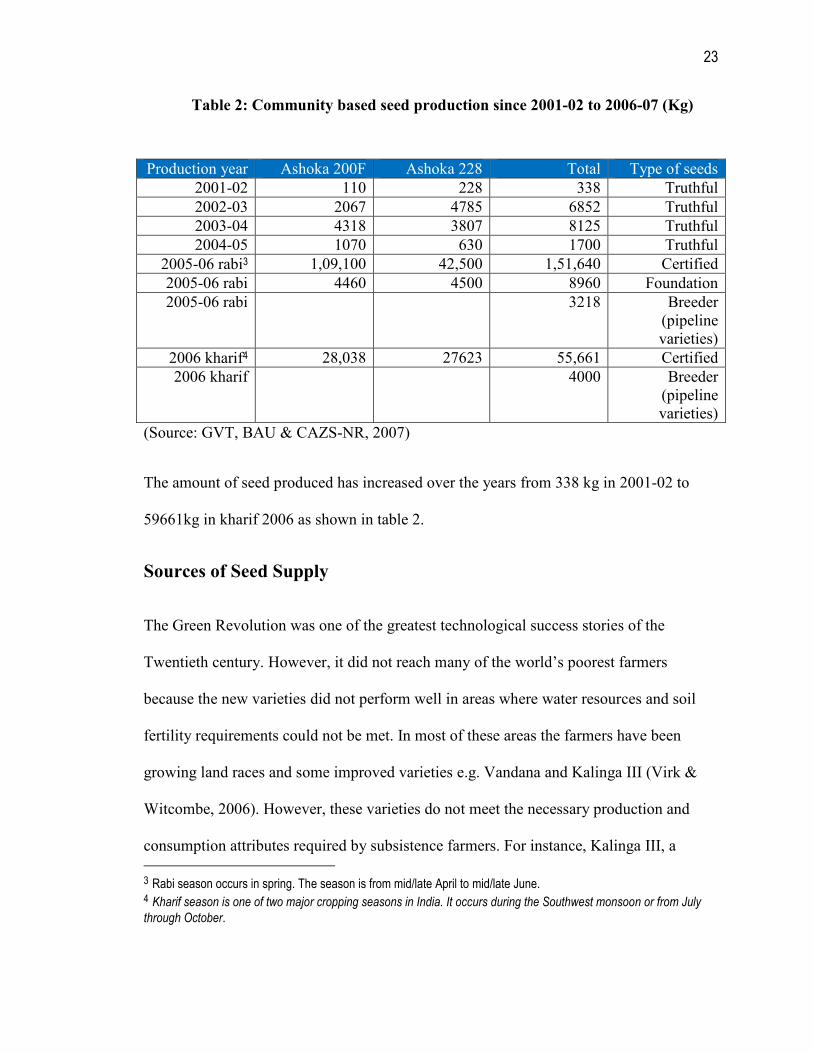
23
Table 2: Community based seed production since 2001-02 to 2006-07 (Kg)
(Source: GVT, BAU & CAZS-NR, 2007)
The amount of seed produced has increased over the years from 338 kg in 2001-02 to
59661kg in kharif 2006 as shown in table 2.
Sources of Seed Supply
The Green Revolution was one of the greatest technological success stories of the
Twentieth century. However, it did not reach many of the world’s poorest farmers
because the new varieties did not perform well in areas where water resources and soil
fertility requirements could not be met. In most of these areas the farmers have been
growing land races and some improved varieties e.g. Vandana and Kalinga III (Virk &
Witcombe, 2006). However, these varieties do not meet the necessary production and
consumption attributes required by subsistence farmers. For instance, Kalinga III, a
3 Rabi season occurs in spring. The season is from mid/late April to mid/late June. 4 Kharif season is one of two major cropping seasons in India. It occurs during the Southwest monsoon or from July
through October.
Production year Ashoka 200F Ashoka 228 Total Type of seeds
2001-02 110 228 338 Truthful
2002-03 2067 4785 6852 Truthful
2003-04 4318 3807 8125 Truthful
2004-05 1070 630 1700 Truthful
2005-06 rabi3 1,09,100 42,500 1,51,640 Certified
2005-06 rabi 4460 4500 8960 Foundation
2005-06 rabi 3218 Breeder (pipeline varieties)
2006 kharif4 28,038 27623 55,661 Certified
2006 kharif 4000 Breeder (pipeline varieties)
24
drought tolerant, upland cultivar that was released as early as 1983 but was not adopted
by the upland farmers due to poor lodging resistance. The adoption was poor not only due
to the lack of attributes but also because of the lack of proper dissemination mechanisms
e.g. role of private sector in Eastern India is very limited there are very few private
companies and the ones present are only interested in selling hybrid seeds or transplanted
varieties ( http://www.future-agricultures.org).
The collaboration of Gramin Vikas Trust (GVT), Birsa Agricultural University (BAU)
and Centre for Arid Zone Studies (CAZS) from 1997 onwards has lead to the
development of new Ashoka varieties (A200F and A228) .These varieties were officially
released in 2005 and have become popular because farmers do not have to change their
farming methods to grow them. As long as they can get the seed and save some of it they
can continue growing these varieties. The new Ashoka varieties will help farmers of these
areas because they have higher yields and good grain quality. Some of the ways in which
seed adoption and spread could take place are:
1. Farmer to farmer spread: since these varieties have the traits desired by the
farmers growing rice in upland areas, they might share them with other farmers. This
would in turn lead to adoption. However, this kind of adoption will be slow and the
varieties would not be able to reach the masses. Village surveys done in Eastern
India have shown that the amount of seed spread from farmer to farmer varied based
on area cultivated and the amount of seed harvested. But in drought years farmers
seed supply falls due to fall in total rice harvested. Also farmers consume the seed
because of good grain quality. Then they have to rely on outside sources to get seed.
25
It is important to have a seed supply to meet the rising demand (www.future-
agricultures.org).
2. Local self help groups or on Government Organizations: could take up the task
of providing seed to the farmers but they would require some kind of subsidy or
financial support in order to support such an effort. For example, Krishak Bharati
Cooperative Limited (KRIBHCO) which established Gramin Vikas Trust (GVT) to
elevate poverty and enhance livelihood of rural population, could provide money to
GVT to buy seed and give it to farmers at a nominal price. In addition, not all these
areas have a good network of NGOs or self help groups. Almost 90% Ashoka seed
has been produced by 8 Self Help Groups (4 in Dhenkanal,3 in Kheonjar and 1 in
Kalajhini in Orissa) under contract of GVT and some seed was produced by BAU in
Ranchi.(GVT report, 2003-04).
3. Government Extension System: the government has Krishi Vigyan Kendras in
these areas. One of their objectives is the spread of new technologies to farmers,
which can help in providing seed of Ashoka varieties. The government can give
subsidies to the NGOs in the area to provide seed.
4. Private seed companies: this area has private seed companies selling hybrid seed
and transplanted varieties over time they may decide to include the drought tolerant
varieties. Currently, they are not interested in selling drought tolerant varieties
because of low profit margin and the poverty of the farmers in these areas.
In this study we have attempted to quantify the impact of Ashoka varieties and its
adoption based on their yield and quality (cooking and taste) attributes. This was done
through simple cost-benefit analyses based on certain assumptions of GVT’s efforts to
26
multiply and disseminate seeds of Ashoka varieties in Eastern India through Rockefeller
Foundation funding. In the course of this study we also do a scenario analysis where we
consider two possible scenarios dissemination of Ashoka varieties with RF funding and
without RF funding for the research and specifically dissemination of the Ashoka
varieties.
Gramin Vikas Trust and other local agencies distributed seed of the two Ashoka varieties
in all the three states and some to other states. The distribution was either done by GVT
or some local agency. Till 2007 they had distributed a total of 234.41 tons of seed. Seed
distribution (in tons) of upland rice varieties (Ashoka 200F and Ashoka 228) by GVT and
other agencies from 2002 to 2007 is detailed in Table 3.In 2008 the distribution reached
255 tons (GVT report, 2007-08).
Table 3: Seed distribution by GVT and other agencies (2002 - 2007)
State By
whom
2002 2003 2004 2005 2006 2007
Jharkhand GVT 12.00 9.1 9.4 2.38 3.83 9.91 Other 4.50 7.9 9.6 0.00 88.89 171.68
Orissa GVT 12.00 8.7 32.0 1.90 0.00 8.27 Other 2.40 2.6 11.2 0.50 2.49 0.00
W. Bengal GVT 12.00 9.0 14.9 0.09 2.09 0.00 Other 2.40 0.0 5.1 0.00 0.24 0.00
Other states
0.00 0.0 0.0 12.39 58.46 44.53
Total 45.30 37.2 85.2 17.26 156.0 234.41
(Source: GVT, 2008)
The farmers as a result have not only adopted improved Ashoka varieties by replacing the
existing local land races and other cultivars but they brought additional lands (fallow)
under upland rice cultivation (Virk & Witcombe, 2006). Hence it could be seen that
27
Ashoka varieties have not only performed well under upland conditions but with proper
seed production and dissemination efforts, it would be possible to maximize their level of
adoption. In this context, the Department For International Development (DFID), UK
financed mostly the research and to some extent the dissemination efforts of University
of Wales – GVTs partnership on Ashoka varieties till the year 2005. After 2005, in
order to continue the existing as well as to extend the level of adoption, there was further
need for a new initiative on seed production and dissemination. From mid 2005,
Rockefeller Foundation project started supporting both the research and dissemination
efforts under taken by the GVT-Bangor partnerships.
Rockefeller Foundation Project
The Rockefeller Foundation project on development and dissemination of drought
tolerant varieties of rice for improving the livelihoods of marginal farmers in Eastern
India through participatory plant breeding and marker assisted selection is a unique
partnership between the public and private sector (GVT report, 2006-07) It aims at faster
delivery of seeds of the farmer preferred drought tolerant varieties thus improving the
food security and livelihood of the poor farmers of Eastern India. RF felt the need to take
up the production of upland rice varieties in Eastern India because private seed
companies are not interested in producing seed of upland rice as it is not profitable
(www.future-agricultures.org). There is less production per hectare compared to rice
varieties of other regions and ecologies. Farmers in marginal areas usually grow either
obsolete varieties (low yielding and disease susceptible varieties that were released often
more than 20 years before) or landraces (Witcombe, 1998). The farmers of upland
varieties are small farmers who own land where there is no irrigation. One of the main
28
reasons why they grow rice is because it is their staple food. The seed dissemination is
severely constrained in these areas and some NGO’s and self help groups are trying to
spread the seed. However, their reach is very limited.
Rockefeller foundation has been a part of this research and dissemination initiative since
2003 initially they contributed $23480 (2003 – 2005).The aim was to reduce loss in yield
due to drought by genes coding for drought resistance in roots and transfer of farmer
preferred traits into Kalinga III and dissemination of the new strains in target areas (GVT
report, 2003-04). The year 2005-06 Rockefeller contribution to the project increased they
contributed $50649 for research and dissemination of processed seed of Ashoka varieties.
An assessment of seed demand was done through two surveys by independent scientists
in November 2004 and August 2005. While the 2004 survey identified a seed demand of
over 600t, the 2005 survey reported that Ashoka varieties were also being grown in
medium land indicating a broad adaptability of these varieties. (GVT report, 2006-
2007).It was clear that more processed seed had to be produced to cater to the growing
demand thus three seed units were set up with RF support of $165545 in the year 2006
and 2007. These units have already started producing seed for multiplication and
distribution. In 2008 there was an increase in the production of processed seed from 190
tons to 255 tons (GVT report, 2007-08), $50017 was spent on research and
dissemination.
The type of seed produced is:
Breeder seed: is seed whose production is personally supervised by a qualified plant
breeder and which provides the source for the initial and recurring increase of foundation
seed.
29
Foundation seed: is the progeny of breeder seed and it can be clearly traced to breeder
seed.
Certified Seed: is the progeny of foundation seed. Its production should be undertaken in
a way that specific genetic identity and purity are maintained according to the standards
prescribed for the crops certification. (http://agricoop.nic.in)
Under the Rockefeller grant, production of foundation seed, certified seed and research
seed is being taken up in different states, in Orissa during rabi 2006, 21678 kg of seed
was produced. Out of this 9250 kg was certified seed, 8958 kg was foundation seed and
3200 kg was research seed. The seed was distributed to various agencies in Jharkhand,
Orissa and West Bengal.Seed was also provided to local NGO’s and Krishi Vigyan
Kendras run by the government.
The seed that was produced till 2005 was truthfully labeled because till 2005 the Ashoka
varieties had not been released officially. A part of the seed was distributed free of cost.
The beneficiaries from free seed distribution under the RF project in kharif 2006 were
farmers in various villages in different states, NGO’s, KVK’s, NABARD and BAU. A
total of 9520 kg of sees was given to 1612 beneficiaries (Source: GVT, BAU & CAZS-
NR, 2007). Most of the seed was distributed to small and marginal farmers through
various government and non government agencies.
The Rockefeller Foundation project funding helped to set up three seed processing units
two units in Jharkhand and one in Orissa.The seed processing facility also extends its
services to other seed agencies and seed growers on commercial basis at all locations in
order to meet the running cost of these units. From the year 2006, the seed production of
30
Ashoka varieties also improved dramatically from 17 tons to 150-200 tons, increased
production helped in the rapid dissemination of these varieties among the farmers,
covering nearly 3000 hectares in Eastern India by the end of 2007.
In this study, we have calculated rough estimates of the annual benefits – towards the
value of the yield increase and quality attributes due to Ashoka varieties dissemination
among the farming households in Eastern India. This is the equivalent to estimating the
consumer and producer surplus with perfectly elastic demand curves and inelastic supply
curves. We estimated these returns in terms of increased value due to yield increases as
well as improved price for the Ashoka varieties (which measures improved grain quality)
over the existing, local upland variety namely BG 102. Ashoka being a fine variety
compared to the existing BG102 also commanded higher prices in the market (12%
higher) and also yielded better (15-20%).
Further we used this estimate to quantify the impacts of RF funding in the drought
tolerance rice research in Eastern India, especially towards the dissemination of drought
tolerant rice varieties in Eastern India. For this purpose, we compared two possible
scenarios – with and without RF funding support in the introduction of these varieties.
We compared the seed production and area coverage by GVT and others for the year
2005, 2006, 2007 and 2008.
Due to the RF support in establishing the seed processing units the seed can be processed
and disseminated much faster leading to increased adoption and hence increase in farmer
yields and income.
The research has led to the development of several new varieties for both upland and
medium land. The medium land varieties are spreading in the districts where GVT,
31
CAZS & BAU are carrying out research in Eastern India. Seed production was carried
out by GVT for Barkhe and Sugandha 1, in dry season of 2004-05 and 2005-06 in Orissa
(www.researchintouse.com).
Some varieties have been identified to be tested in All India Coordinated trials, state trials
and on-farm trials.Promising entries are PY84, P170 (by MAS breeding for rainfed
upland), Navjot, Ruby (from PPB for rainfed uplands), Sugandha 1, Barkhe, Ashoka
900F, Ashoka 165 and Judi 578 (from PPB in India and Nepal for transplanted medium
land conditions).(GVT report,2007-08). Based upon the previous research papers and
literature review we chose the models we would use for our study. We decided to use the
cost benefit analysis to assess the impact of drought tolerant varieties and to see the
impact the RF project has had on the seed production and dissemination. In the following
chapter we discuss the conceptual framework for this thesis.
32
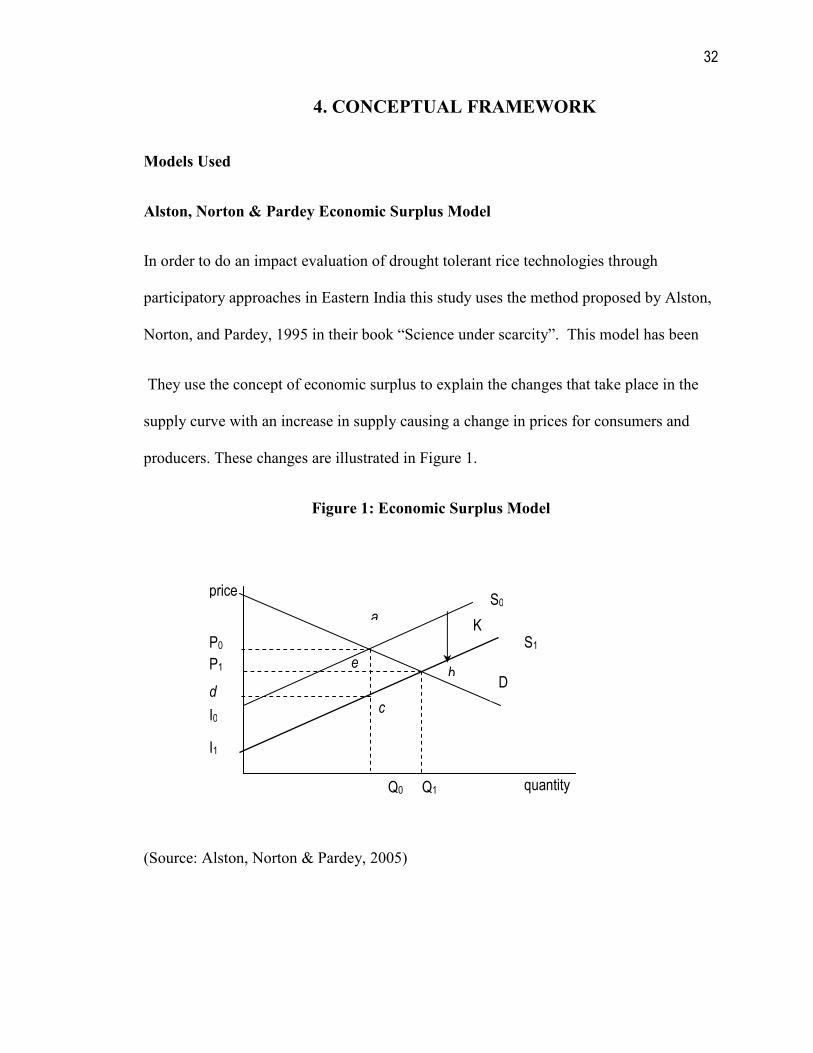
4. CO CEPTUAL FRAMEWORK
Models Used
Alston, orton & Pardey Economic Surplus Model
In order to do an impact evaluation of drought tolerant rice technologies through
participatory approaches in Eastern India this study uses the method proposed by Alston,
Norton, and Pardey, 1995 in their book “Science under scarcity”. This model has been
They use the concept of economic surplus to explain the changes that take place in the
supply curve with an increase in supply causing a change in prices for consumers and
producers. These changes are illustrated in Figure 1.
Figure 1: Economic Surplus Model
(Source: Alston, Norton & Pardey, 2005)
S0
S1
D
Q1
P0
P1
d
I0
e
I1
Q0 quantity
price
K
c
a
b
33
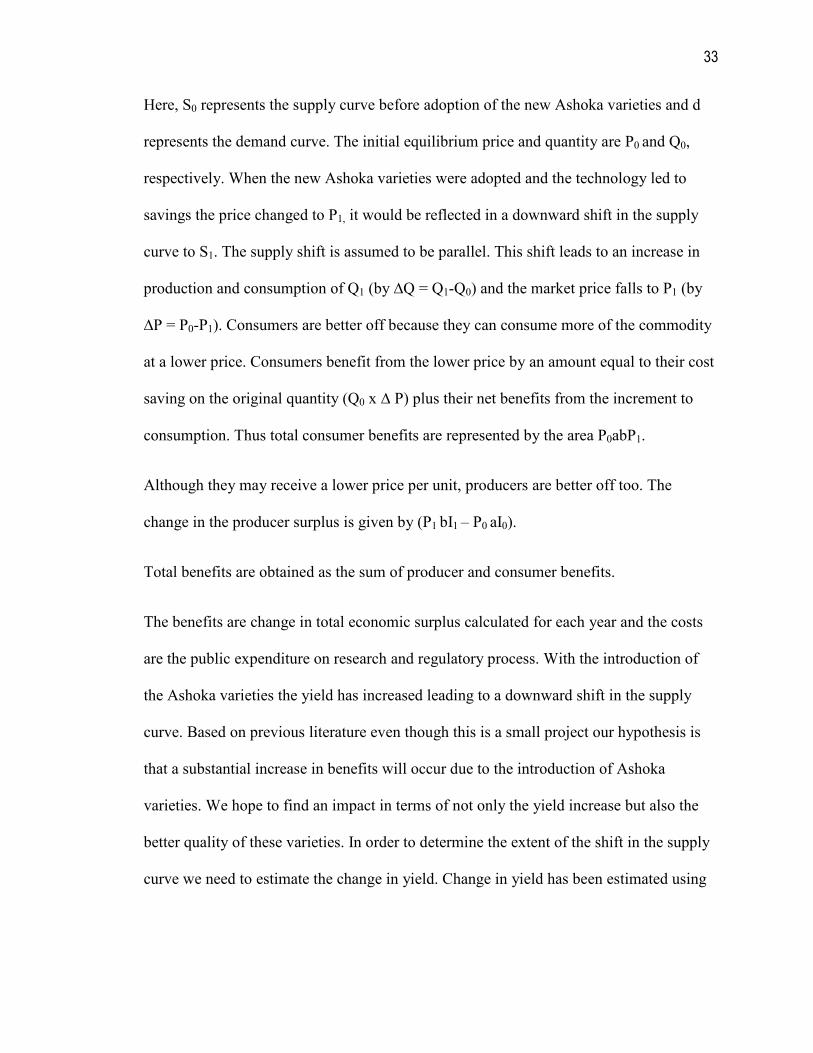
Here, S0 represents the supply curve before adoption of the new Ashoka varieties and d
represents the demand curve. The initial equilibrium price and quantity are P0 and Q0,
respectively. When the new Ashoka varieties were adopted and the technology led to
savings the price changed to P1, it would be reflected in a downward shift in the supply
curve to S1. The supply shift is assumed to be parallel. This shift leads to an increase in
production and consumption of Q1 (by ∆Q = Q1-Q0) and the market price falls to P1 (by
∆P = P0-P1). Consumers are better off because they can consume more of the commodity
at a lower price. Consumers benefit from the lower price by an amount equal to their cost
saving on the original quantity (Q0 x ∆ P) plus their net benefits from the increment to
consumption. Thus total consumer benefits are represented by the area P0abP1.
Although they may receive a lower price per unit, producers are better off too. The
change in the producer surplus is given by (P1 bI1 – P0 aI0).
Total benefits are obtained as the sum of producer and consumer benefits.
The benefits are change in total economic surplus calculated for each year and the costs
are the public expenditure on research and regulatory process. With the introduction of
the Ashoka varieties the yield has increased leading to a downward shift in the supply
curve. Based on previous literature even though this is a small project our hypothesis is
that a substantial increase in benefits will occur due to the introduction of Ashoka
varieties. We hope to find an impact in terms of not only the yield increase but also the
better quality of these varieties. In order to determine the extent of the shift in the supply
curve we need to estimate the change in yield. Change in yield has been estimated using
34
the OLS model of regression. We use farmers’ trial yield data for the regression analysis
to get a precise value for mean yield.
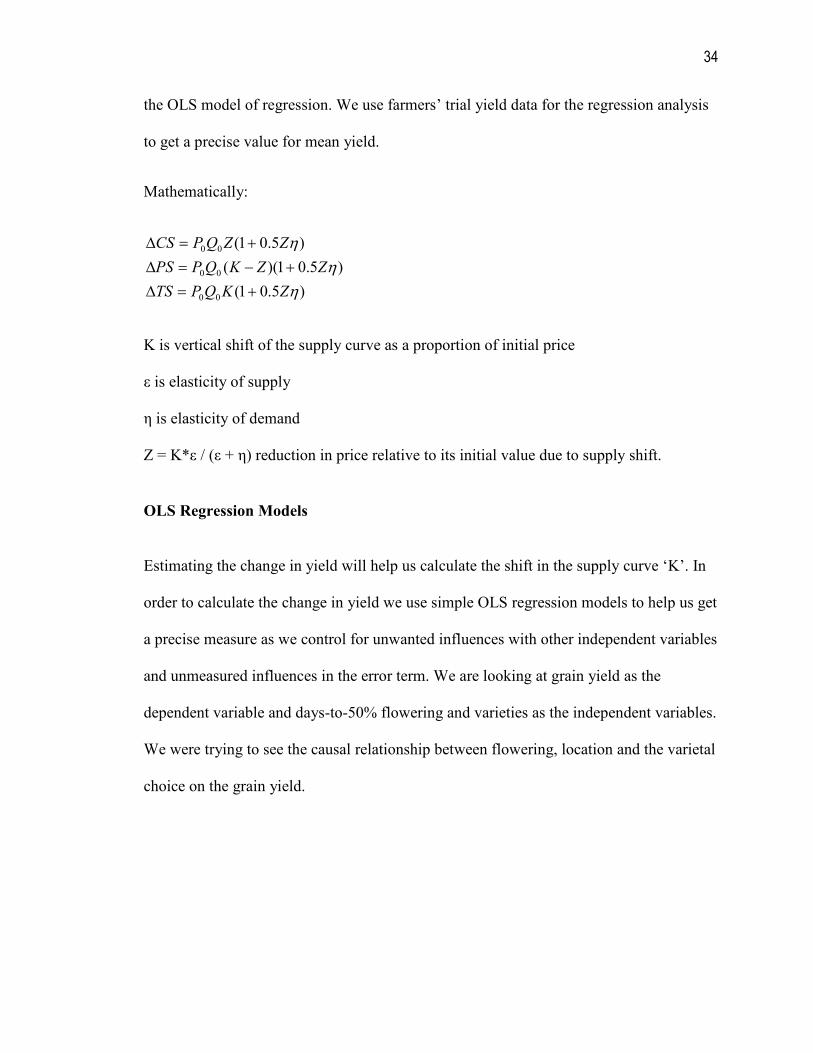
Mathematically:
)5.01(
)5.01)((
)5.01(
00
00
00
η
η
η
ZKQPTS
ZZKQPPS
ZZQPCS
+=∆
+−=∆
+=∆
K is vertical shift of the supply curve as a proportion of initial price
ε is elasticity of supply
η is elasticity of demand
Z = K*ε / (ε + η) reduction in price relative to its initial value due to supply shift.
OLS Regression Models
Estimating the change in yield will help us calculate the shift in the supply curve ‘K’. In
order to calculate the change in yield we use simple OLS regression models to help us get
a precise measure as we control for unwanted influences with other independent variables
and unmeasured influences in the error term. We are looking at grain yield as the
dependent variable and days-to-50% flowering and varieties as the independent variables.
We were trying to see the causal relationship between flowering, location and the varietal
choice on the grain yield.
35
Description of models used
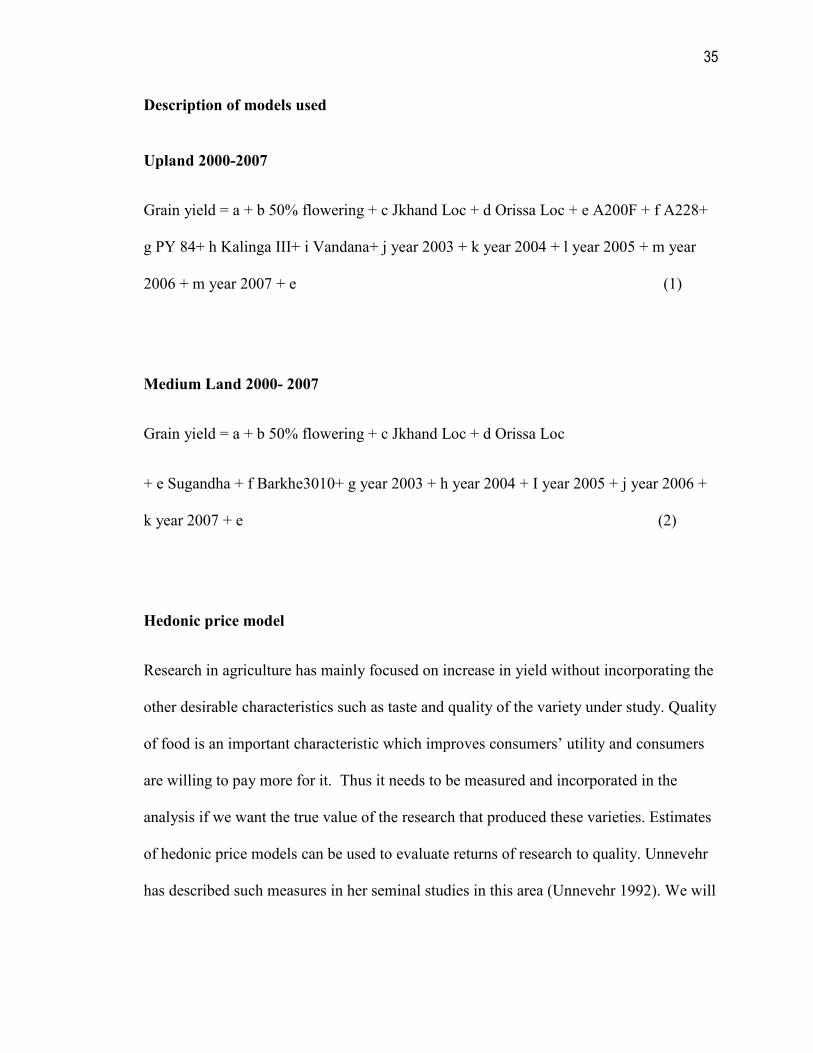
Upland 2000-2007
Grain yield = a + b 50% flowering + c Jkhand Loc + d Orissa Loc + e A200F + f A228+
g PY 84+ h Kalinga III+ i Vandana+ j year 2003 + k year 2004 + l year 2005 + m year
2006 + m year 2007 + e (1)
Medium Land 2000- 2007
Grain yield = a + b 50% flowering + c Jkhand Loc + d Orissa Loc
+ e Sugandha + f Barkhe3010+ g year 2003 + h year 2004 + I year 2005 + j year 2006 +
k year 2007 + e (2)
Hedonic price model
Research in agriculture has mainly focused on increase in yield without incorporating the
other desirable characteristics such as taste and quality of the variety under study. Quality
of food is an important characteristic which improves consumers’ utility and consumers
are willing to pay more for it. Thus it needs to be measured and incorporated in the
analysis if we want the true value of the research that produced these varieties. Estimates
of hedonic price models can be used to evaluate returns of research to quality. Unnevehr
has described such measures in her seminal studies in this area (Unnevehr 1992). We will
36
be using formulas from her model to calculate the consumer and producer surplus for the
quality traits of Ashoka varieties.
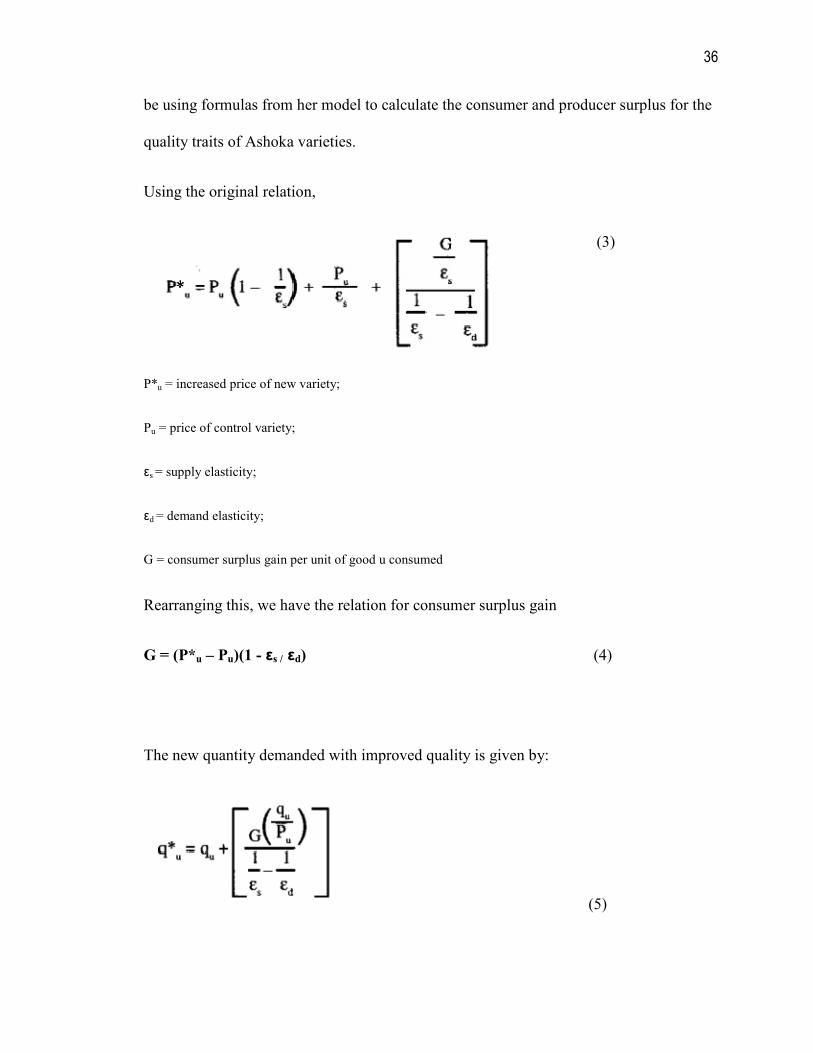
Using the original relation,
(3)
P*u = increased price of new variety;
Pu = price of control variety;
εs = supply elasticity;
εd = demand elasticity;
G = consumer surplus gain per unit of good u consumed
Rearranging this, we have the relation for consumer surplus gain
G = (P*u – Pu)(1 - εs / εd) (4)
The new quantity demanded with improved quality is given by:
(5)
37
qu = original quantity demanded
Change in Consumer Surplus due to quality incorporation is given by:
(6)
Change in Producer Surplus due to quality incorporation is given by:
(7)
Change in Total Surplus due to quality incorporation is therefore given by:
CTSq = (CS + PS)*Adoption rate (8)
Hence, change in total surplus is given by:
CTS* = CTSAP + CTSq ; (9)
where CTSAP = Change in Total Surplus from Alston-Pardey model and CTS* sums up
the benefits due to both quality and yield changes.
38
Research benefits would be computed as:
Benefit = CTS* - Cost (10)
The detailed analysis is given in the following chapter. In chapter 5 we will be describing
the sources of data, assumptions and limitations of the data being used. We will describe
in detail the methods used for our analysis.
39
5. METHODOLOGY A D A ALYSIS OF YIELD CHA GE
Sources of Data
Data set to calculate yield changes: The data was collected from the mother trials that
were held by GVT, BAU & CAZR from the year 2003 to 2007. We look at the mother
trial data as opposed to the research station data because this data is from the farmers’
fields thus similar to the actual growing experience. There is no farm level surveys done
except for the GVT surveys. Data for year 2000 was collected from the varietal release
proposals of the Ashoka varieties, PY84, Barkhe 3010 and Sugandha 1 varieties. Two
types of data sources have been used for this study to empirically describe the objectives
outlined and are segmented into the following data sets.
The farm level yield trials data on drought tolerant rice varieties was collected from trials
conducted by GVT, BAU & CAZR at different location in Orissa, West Bengal and
Jharkhand. The trials were conducted from the year 2003 to 2007. This was further used
to determine productivity of different varieties across 3 major locations in Eastern India
over multiple years. One of the major limitations is that the data is from scientists who
developed these varieties. It is credible though since it has been reviewed by technical
committees of other scientists. Trials were conducted on 50 drought tolerant varieties to
gauge their performance in low input unfavorable environments by IRRI in 2006. Table 4
lists varieties in descending order of performance; the Ashoka varieties did very well
under low input no stress environment but under short duration stress the varieties didn’t
do so well.
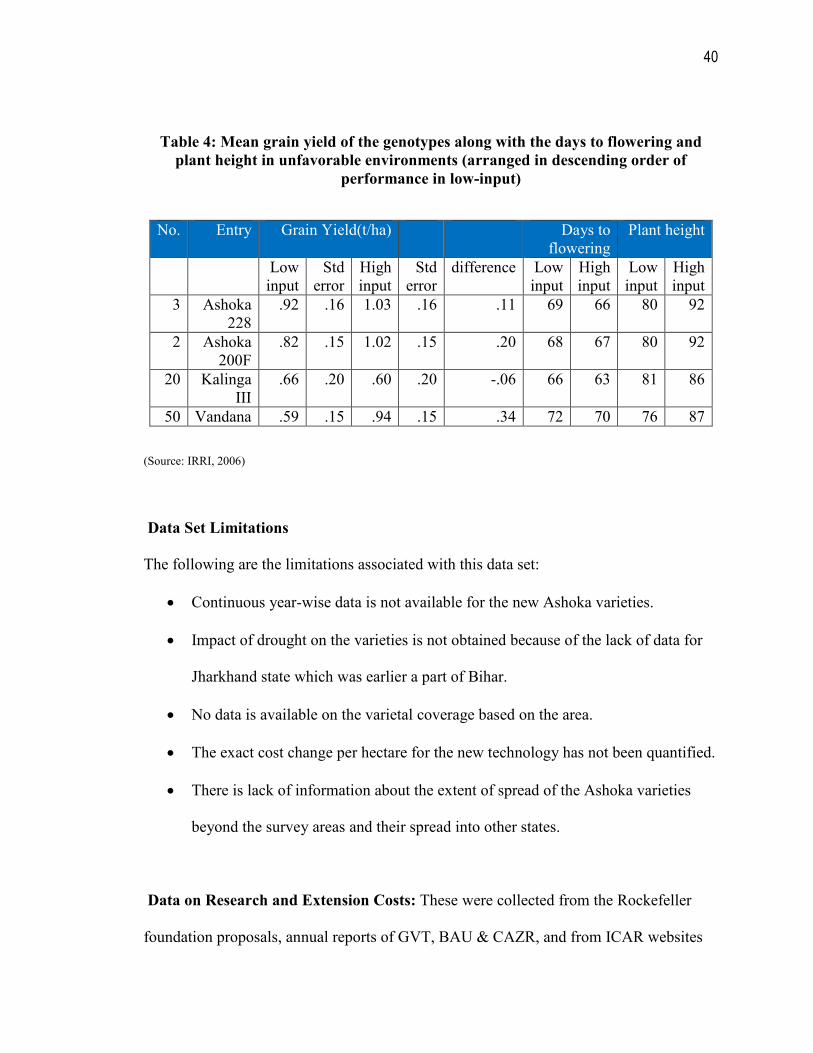
40
Table 4: Mean grain yield of the genotypes along with the days to flowering and
plant height in unfavorable environments (arranged in descending order of
performance in low-input)
(Source: IRRI, 2006)
Data Set Limitations
The following are the limitations associated with this data set:
• Continuous year-wise data is not available for the new Ashoka varieties.
• Impact of drought on the varieties is not obtained because of the lack of data for
Jharkhand state which was earlier a part of Bihar.
• No data is available on the varietal coverage based on the area.
• The exact cost change per hectare for the new technology has not been quantified.
• There is lack of information about the extent of spread of the Ashoka varieties
beyond the survey areas and their spread into other states.
Data on Research and Extension Costs: These were collected from the Rockefeller
foundation proposals, annual reports of GVT, BAU & CAZR, and from ICAR websites
No. Entry Grain Yield(t/ha) Days to flowering
Plant height
Low input
Std error
High input
Std error
difference Low input
High input
Low input
High input
3 Ashoka 228
.92 .16 1.03 .16 .11 69 66 80 92
2 Ashoka 200F
.82 .15 1.02 .15 .20 68 67 80 92
20 Kalinga III
.66 .20 .60 .20 -.06 66 63 81 86
50 Vandana .59 .15 .94 .15 .34 72 70 76 87
41
to evaluate the returns to research investments in drought tolerant rice breeding, adoption
and dissemination in Eastern India.
Data Set Limitations
The following are the limitations associated with this data set:
• Lack of research cost for the Gramin Vikas Trust NGO.
• The exact amount of seed produced and disseminated has not been quantified.
• Difficult to assess the role of KRIBCO (in expenditure terms) in GVT’s research
effort.
Data on Quality: The impact of quality on the benefits has been calculated using
formulas from Unnevehrs’ hedonic price model. We calculate the consumer and producer
surplus based on the assumption that difference in price of Ashoka and BG102 is due to
quality differences (detailed in chapter 4).
Farm Level Analysis
Farm level yield trial data from farmers participating in the mother baby trials of the PPB
technique in Jharkhand, Orissa and West Bengal has been used. This data was collected
for the multi-year multi-location testing performed by BAU, GVT and CAZR. The
farmers grew the varieties on their fields under the supervision of scientists. The trials
were conducted in years 2000, 2003, 2004, 2005, 2006 and 2007. We have attempted to
estimate if there is a significant relationship between yield, location, years of trial and
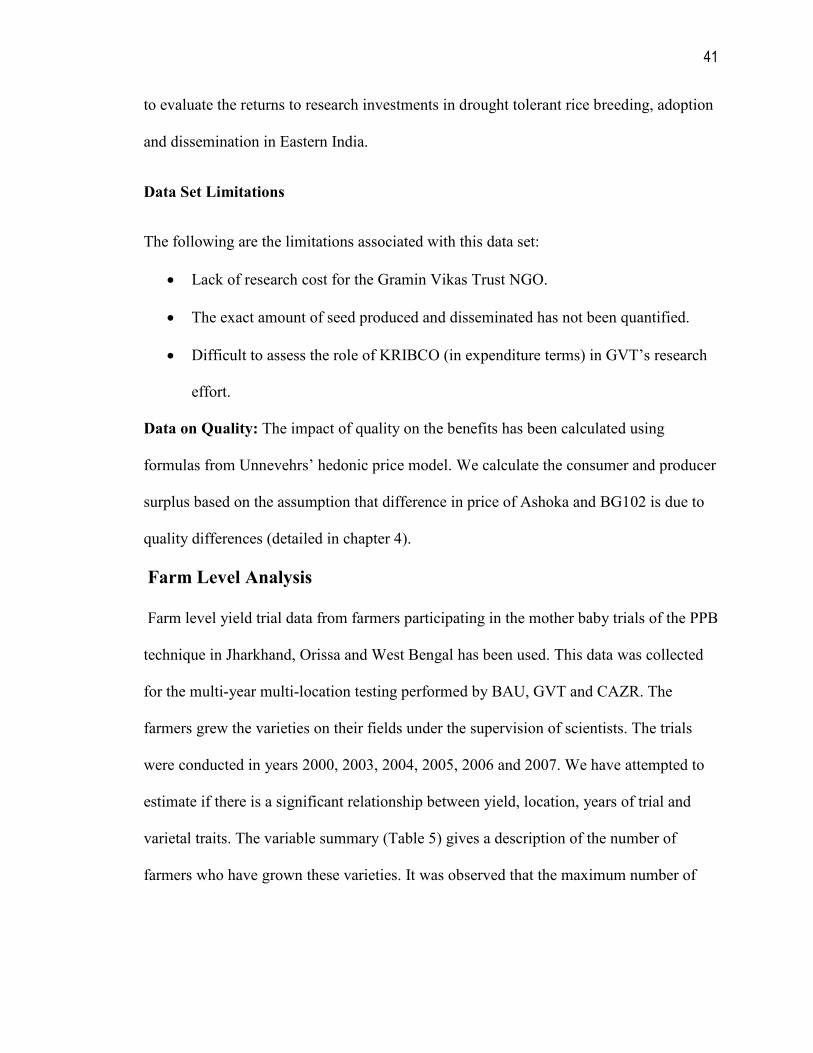
varietal traits. The variable summary (Table 5) gives a description of the number of
farmers who have grown these varieties. It was observed that the maximum number of
42
farmers grew the Ashoka varieties. By comparison, Kalinga III was grown in only two
years. Total number of trial plots used was 235.
Table 5: umber of farmers growing different varieties in upland areas
Varieties
grown
Year
2000
Year
2003
Year
2004
Year
2005
Year
2006
Year
2007
Total
A200F 17 5 6 8 6 9 51
A228 17 5 5 9 5 10 51
BG102 18 5 5 6 3 10 47
Kalinga III
18 0 5 0 0 0 23
PY84 0 4 6 8 6 10 34
Vandana 0 5 1 7 6 10 29
Total 70 24 28 38 26 49 235
(Source: GVT, BAU & CAZS-NR, 2008)
The continuous variables used in this study were grain yield and days to 50% flowering.
We created dummy variables in our study for location, years and varieties. The minimum
and maximum yields were observed to be 20 kg/ha and 3960 kg/ha, respectively. The
minimum days to 50% flowering were zero because some of the famers lost their crops.
The descriptive statistics around yield values for these are detailed in Table 6.

43
Table 6: Descriptive statistics of continuous variables used
Variable Observations Mean Std. Dev Min Max
50%
flowering
235 60.6 13.9 0 75
Grain yield 235 1713.5 801.7 20 3960
(Source: Author)
The varieties that were replaced in these areas were the local varieties like Birsa Gora
102 (BG 102) and early improved varieties like Kalinga III and Vandana. While Ashoka
varieties were the first generation of improved varieties from the project, PY 84 was the
second generation. The mean yield of the local varieties was observed to be less as
compared to the improved varieties. While the yield of Vandana variety was high it was
not preferred by farmers due to its low grain quality (Virk and Witcombe, 2006).
The summary statistics around yield values of the varieties are detailed in Table 7.
Table 7: Yield statistics of upland varieties
Variable Observations Mean Std.Dev Min Max
BG102 47 1340.3 527.4 142 2700
Kalinga III 23 1389.6 647.7 200 2166
Vandana 29 1746.7 690.3 24 2960
Ashoka 200F 51 1768.0 678.5 182 2920
Ashoka 228 51 1808.2 695.6 80 3140
PY84 34 2196.2 1234.6 20 3960
(Source: Author)
The mother trials were conducted in all the three states of Jharkhand, Orissa and West
Bengal. It was observed that the number of farmers growing rice in upland Jharkhand
area was more than those in Orissa and West Bengal. This was mainly because GVT (E)
44
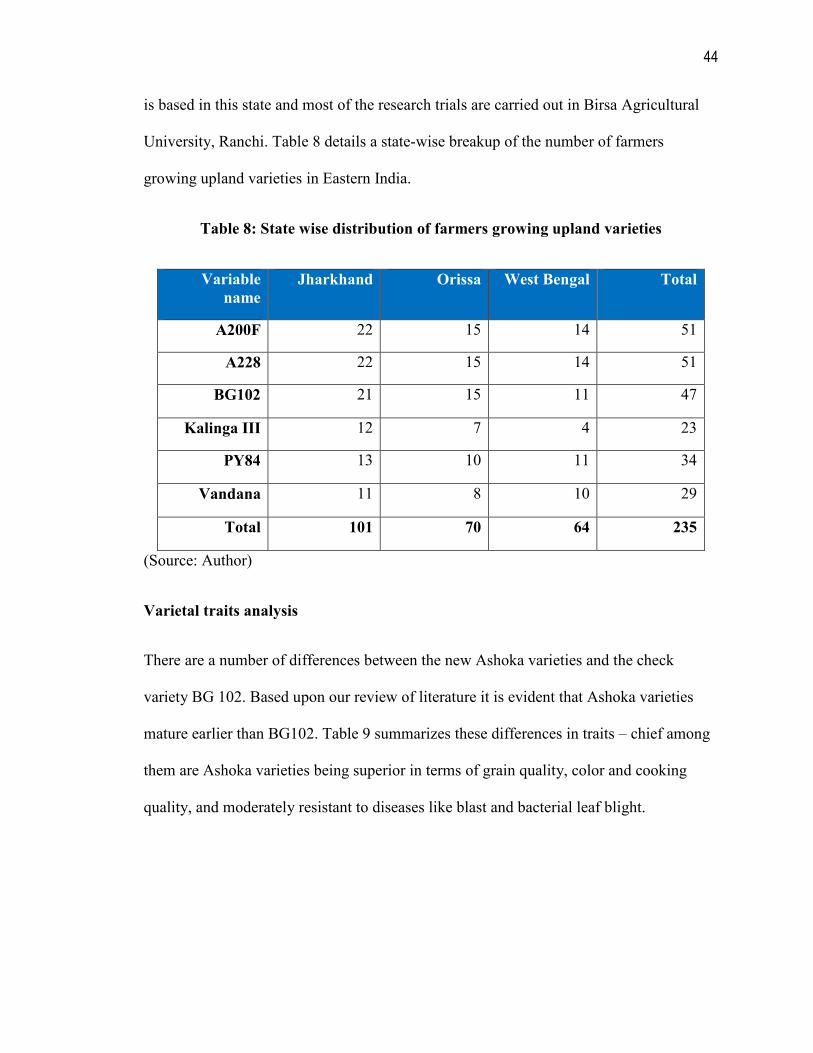
is based in this state and most of the research trials are carried out in Birsa Agricultural
University, Ranchi. Table 8 details a state-wise breakup of the number of farmers
growing upland varieties in Eastern India.
Table 8: State wise distribution of farmers growing upland varieties
Variable
name
Jharkhand Orissa West Bengal Total
A200F 22 15 14 51
A228 22 15 14 51
BG102 21 15 11 47
Kalinga III 12 7 4 23
PY84 13 10 11 34
Vandana 11 8 10 29
Total 101 70 64 235
(Source: Author)
Varietal traits analysis
There are a number of differences between the new Ashoka varieties and the check
variety BG 102. Based upon our review of literature it is evident that Ashoka varieties
mature earlier than BG102. Table 9 summarizes these differences in traits – chief among
them are Ashoka varieties being superior in terms of grain quality, color and cooking
quality, and moderately resistant to diseases like blast and bacterial leaf blight.
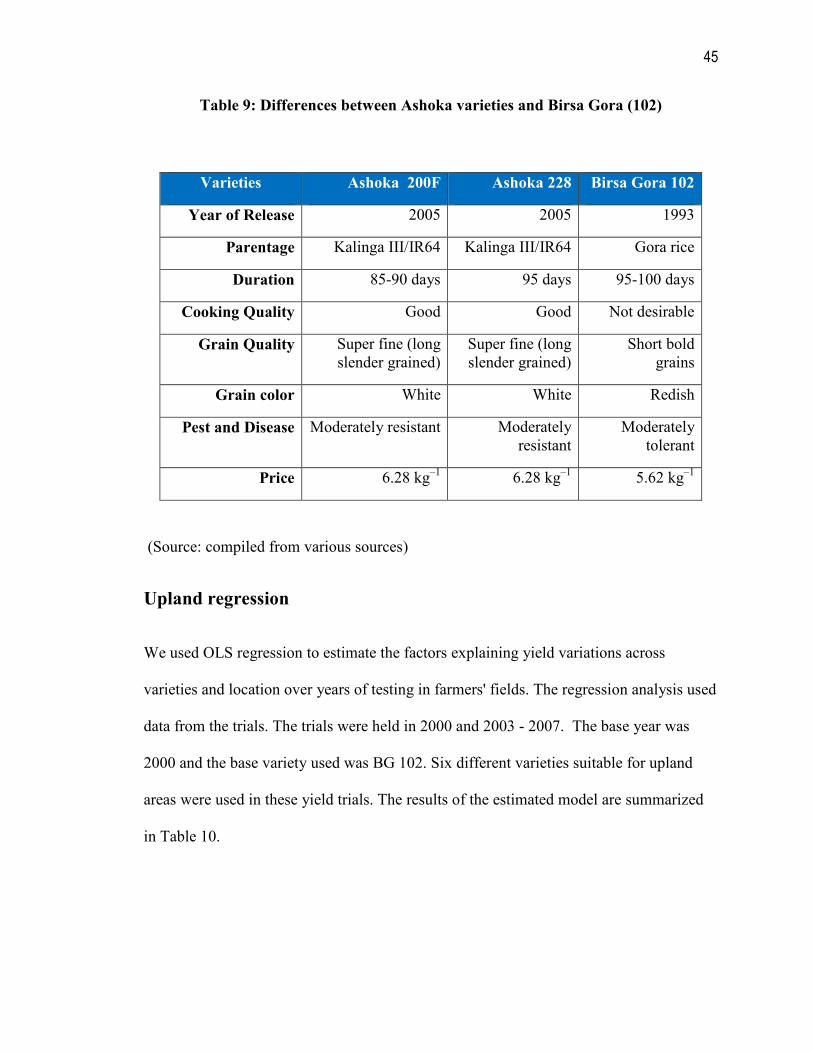
45
Table 9: Differences between Ashoka varieties and Birsa Gora (102)
(Source: compiled from various sources)
Upland regression
We used OLS regression to estimate the factors explaining yield variations across
varieties and location over years of testing in farmers' fields. The regression analysis used
data from the trials. The trials were held in 2000 and 2003 - 2007. The base year was
2000 and the base variety used was BG 102. Six different varieties suitable for upland
areas were used in these yield trials. The results of the estimated model are summarized
in Table 10.
Varieties Ashoka 200F Ashoka 228 Birsa Gora 102
Year of Release 2005 2005 1993
Parentage Kalinga III/IR64 Kalinga III/IR64 Gora rice
Duration 85-90 days 95 days 95-100 days
Cooking Quality Good Good Not desirable
Grain Quality Super fine (long slender grained)
Super fine (long slender grained)
Short bold grains
Grain color White White Redish
Pest and Disease Moderately resistant Moderately resistant
Moderately tolerant
Price 6.28 kg–1 6.28 kg–1 5.62 kg–1
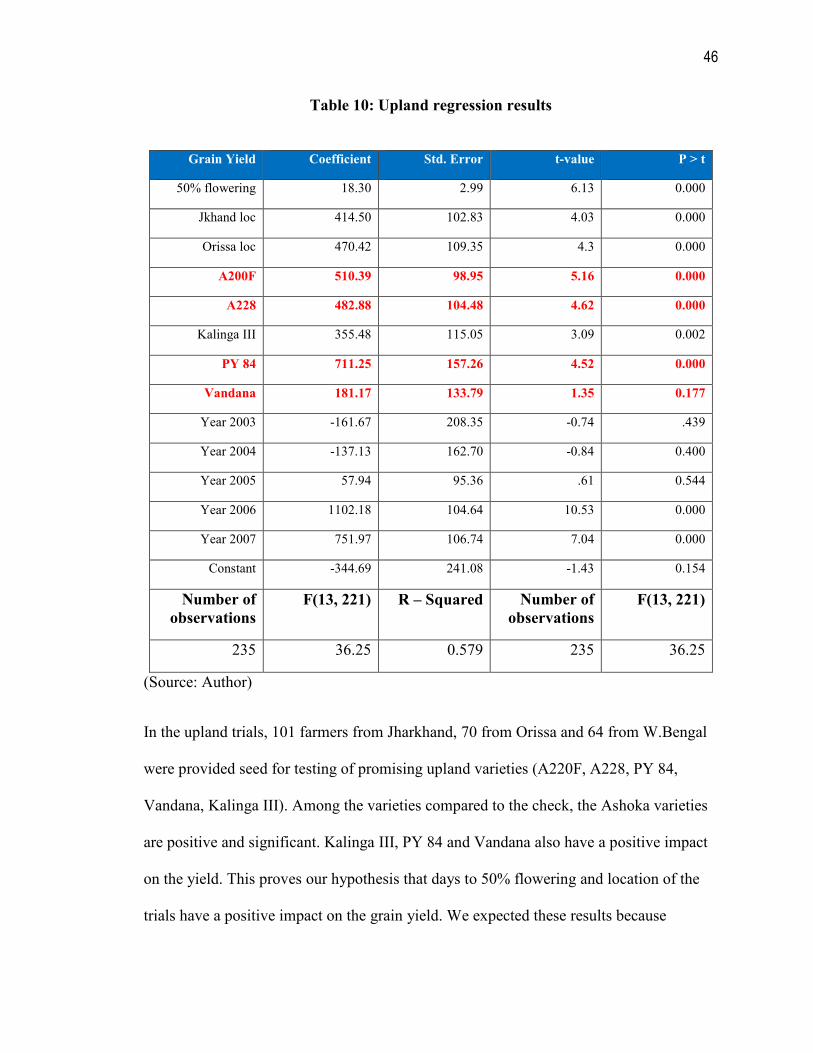
46
Table 10: Upland regression results
(Source: Author)
In the upland trials, 101 farmers from Jharkhand, 70 from Orissa and 64 from W.Bengal
were provided seed for testing of promising upland varieties (A220F, A228, PY 84,
Vandana, Kalinga III). Among the varieties compared to the check, the Ashoka varieties
are positive and significant. Kalinga III, PY 84 and Vandana also have a positive impact
on the yield. This proves our hypothesis that days to 50% flowering and location of the
trials have a positive impact on the grain yield. We expected these results because
Grain Yield Coefficient Std. Error t-value P > t
50% flowering 18.30 2.99 6.13 0.000
Jkhand loc 414.50 102.83 4.03 0.000
Orissa loc 470.42 109.35 4.3 0.000
A200F 510.39 98.95 5.16 0.000
A228 482.88 104.48 4.62 0.000
Kalinga III 355.48 115.05 3.09 0.002
PY 84 711.25 157.26 4.52 0.000
Vandana 181.17 133.79 1.35 0.177
Year 2003 -161.67 208.35 -0.74 .439
Year 2004 -137.13 162.70 -0.84 0.400
Year 2005 57.94 95.36 .61 0.544
Year 2006 1102.18 104.64 10.53 0.000
Year 2007 751.97 106.74 7.04 0.000
Constant -344.69 241.08 -1.43 0.154
umber of
observations
F(13, 221) R – Squared umber of
observations
F(13, 221)
235 36.25 0.579 235 36.25
47
Ashoka varieties are early maturing, high yielding varieties that have been bred for the
upland rice areas. The results show that the factors influencing yield such as flowering,
location and varieties are all positive and significant. We expected the flowering to be
positive because it would impact the total duration and yield of the varieties. We use the
results from the OLS regression to get the supply shift because it gives us a more precise
value for the mean yield as we control for unwanted influences in the error term. The
value for mean yield of Ashoka variety has been calculated by taking the average
difference in yield of Ashoka varieties from our regression analysis (496.64) and adding
it to the mean of the base variety BG102 (1340.3) to get the mean yield of Ashoka
varieties ( 1836.5) as opposed to (1788.1) from the data (refer table 7) the supply shift
because of yield change is used to calculate the internal rate of return. To calculate the
impact due to quality we use the formulas from hedonic price model to get the change in
total surplus explained in detail in chapter 4. We assume the price increase is only due to
better quality. We calculate consumer surplus gain per unit of good consumed (G), new
quantity demanded with improved quality (q*u), using these quantities we calculate the
change in consumer and producer surplus. The change in total surplus because of quality
comes out to be $52666. This is used to calculate CTS* [for details please refer Appendix
table G].
Medium Land Varieties
The principal varieties grown in medium land conditions are IR 64, Barkhe 3010 and
Sugandha. IR 64 is an old variety developed at the International Rice Research Institute
in the Philippines and released many years ago. It is grown in some of the low and
medium land fields in this area and has been used as the control in the research trials.
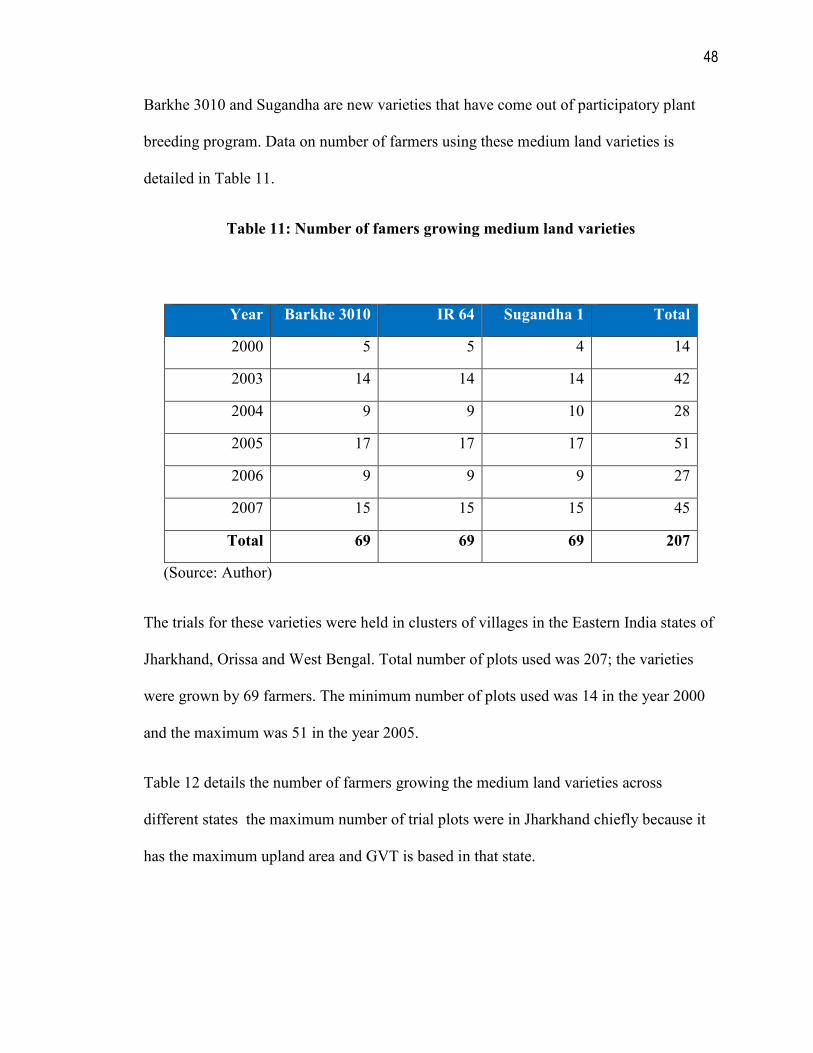
48
Barkhe 3010 and Sugandha are new varieties that have come out of participatory plant
breeding program. Data on number of farmers using these medium land varieties is
detailed in Table 11.
Table 11: umber of famers growing medium land varieties
(Source: Author)
The trials for these varieties were held in clusters of villages in the Eastern India states of
Jharkhand, Orissa and West Bengal. Total number of plots used was 207; the varieties
were grown by 69 farmers. The minimum number of plots used was 14 in the year 2000
and the maximum was 51 in the year 2005.
Table 12 details the number of farmers growing the medium land varieties across
different states the maximum number of trial plots were in Jharkhand chiefly because it
has the maximum upland area and GVT is based in that state.
Year Barkhe 3010 IR 64 Sugandha 1 Total
2000 5 5 4 14
2003 14 14 14 42
2004 9 9 10 28
2005 17 17 17 51
2006 9 9 9 27
2007 15 15 15 45
Total 69 69 69 207
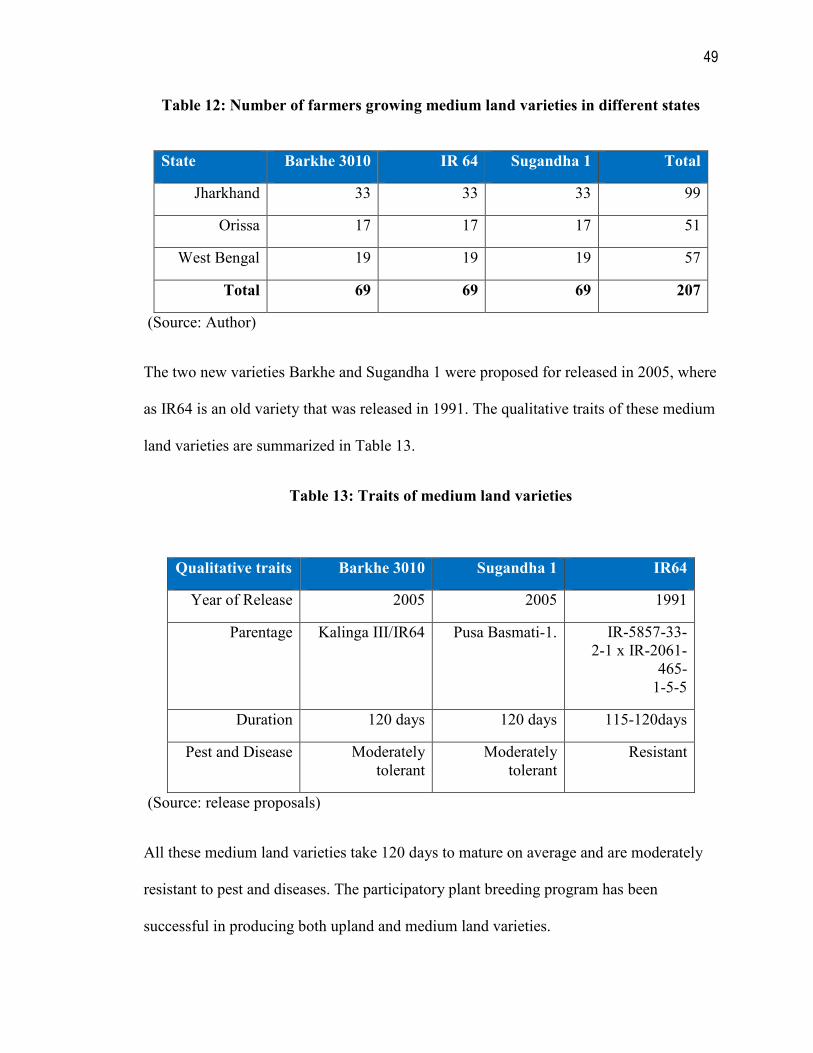
49
Table 12: umber of farmers growing medium land varieties in different states
(Source: Author)
The two new varieties Barkhe and Sugandha 1 were proposed for released in 2005, where
as IR64 is an old variety that was released in 1991. The qualitative traits of these medium
land varieties are summarized in Table 13.
Table 13: Traits of medium land varieties
(Source: release proposals)
All these medium land varieties take 120 days to mature on average and are moderately
resistant to pest and diseases. The participatory plant breeding program has been
successful in producing both upland and medium land varieties.
State Barkhe 3010 IR 64 Sugandha 1 Total
Jharkhand 33 33 33 99
Orissa 17 17 17 51
West Bengal 19 19 19 57
Total 69 69 69 207
Qualitative traits Barkhe 3010 Sugandha 1 IR64
Year of Release 2005 2005 1991
Parentage Kalinga III/IR64 Pusa Basmati-1. IR-5857-33- 2-1 x IR-2061-
465- 1-5-5
Duration 120 days 120 days 115-120days
Pest and Disease Moderately tolerant
Moderately tolerant
Resistant
50
Medium land regression
A total of 69 farmers from each of the three states were given promising medium land
varieties for testing, namely IR 64, Sugandha 1 and Barkhe 3010. Tests were conducted
for multiple periods between 2000 and 2006. In our analysis the base year was 2000 and
the check variety was IR64. The number of farmers who were given seed samples across
these years ranged from 14 to 57.
A simple OLS regression was fit to determine the factors affecting the yields across
different varieties in the 3 major rice growing states in Eastern India.
We used the following model to determine grain yield. The medium land regression
results are detailed in Table 14.
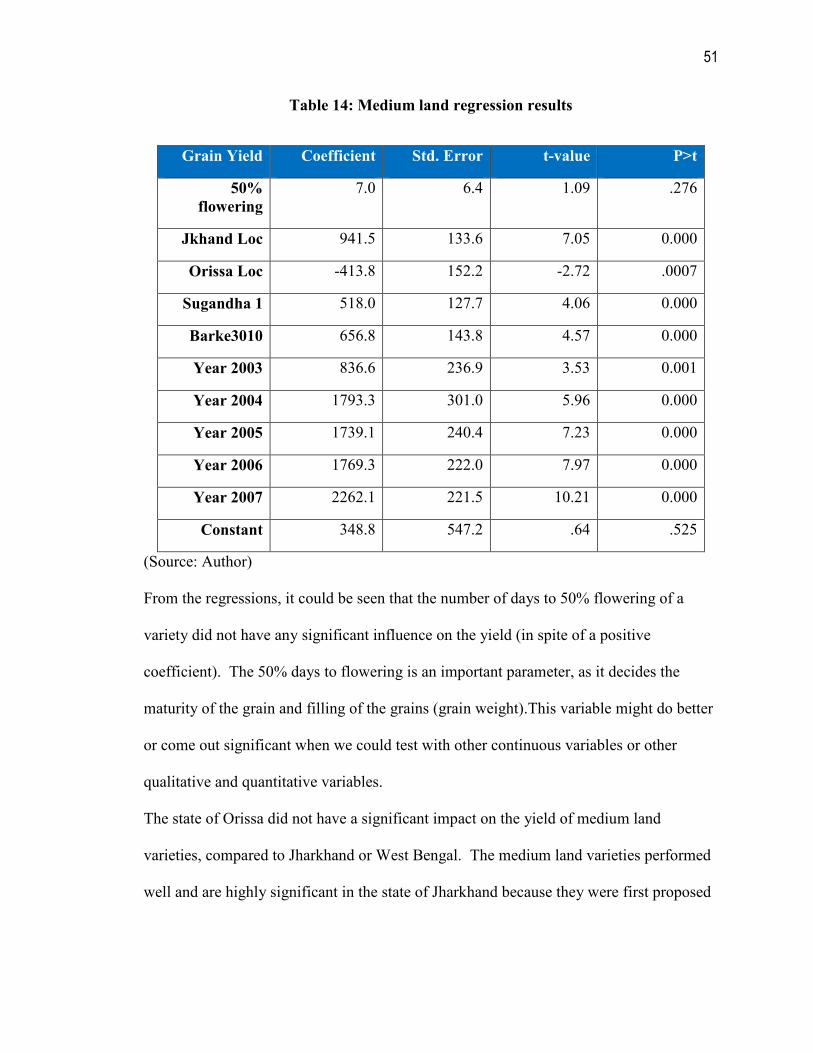
51
Table 14: Medium land regression results
Grain Yield Coefficient Std. Error t-value P>t
50%
flowering
7.0 6.4 1.09 .276
Jkhand Loc 941.5 133.6 7.05 0.000
Orissa Loc -413.8 152.2 -2.72 .0007
Sugandha 1 518.0 127.7 4.06 0.000
Barke3010 656.8 143.8 4.57 0.000
Year 2003 836.6 236.9 3.53 0.001
Year 2004 1793.3 301.0 5.96 0.000
Year 2005 1739.1 240.4 7.23 0.000
Year 2006 1769.3 222.0 7.97 0.000
Year 2007 2262.1 221.5 10.21 0.000
Constant 348.8 547.2 .64 .525
(Source: Author)
From the regressions, it could be seen that the number of days to 50% flowering of a
variety did not have any significant influence on the yield (in spite of a positive
coefficient). The 50% days to flowering is an important parameter, as it decides the
maturity of the grain and filling of the grains (grain weight).This variable might do better
or come out significant when we could test with other continuous variables or other
qualitative and quantitative variables.
The state of Orissa did not have a significant impact on the yield of medium land
varieties, compared to Jharkhand or West Bengal. The medium land varieties performed
well and are highly significant in the state of Jharkhand because they were first proposed
52
for release for the medium lands of Jharkhand. But because of their adaptability they
have also been grown in West Bengal and Orissa.
Among the varieties, compared to the check variety IR 64, both Sugandha 1 and Barkhe
3010 were positive and highly significant in determining the yield. Birsa Vikas
Sugandha1 is observed to be preferred by poor farmers because of its aromatic, medium
slender grains. The variety responds well to medium fertilizer management, has higher
yield and matures early. The plants are taller with more straw yield, have good cooking
quality, resistance to lodging and higher drought tolerance (release proposal, 2005). IR64
is the most widely grown rice variety in the tropics (www.iris.irri.org). It was released in
1991 (www.drdpat.bih.nic.in) as semi-dwarf variety, resistant to blast disease and has
white grains. It has been used as a parent in breeding new varieties. Birsa Vikas Dhan
203 or Barkhe 3010 has medium maturity; it is a semi-tall plant with medium slender
grain. It has drought escaping characteristics, is responsive to fertilizer use and can be
sown directly or transplanted. These varieties have spread in the areas where GVT,
CAZS & BAU are doing research in Eastern India. In the following chapter we describe
the cost and benefit analysis for Eastern India PPB rice research and dissemination.
53
6. COSTS A D BE EFITS OF BREEDI G A D SEED
PRODUCTIO OF DROUGHT TOLERA T RICE
This chapter combines the yield increases and changes in grain quality measured in the
previous chapter with the spread of these varieties to calculate the benefits from breeding
and disseminating these drought tolerant varieties. These benefits are compared with the
costs of the breeding and dissemination programs to calculate internal rates of return to
these programs.
Costs and Benefits of Eastern India Rice research program
This section calculates the costs and benefits of the DT breeding program carried out in
Jharkhand, Orissa and West Bengal. In order to calculate the net present value and
internal rate of return we used the annual cost of research being carried out in Eastern
India. Initially only Gramin Vikas Trust (GVT) and CAZS were involved in the research.
We take 1997 as the starting year since participatory research with regard to drought
tolerant varieties began in that year. While the research cost of GVT and CAZS was
funded by DFID the cost of CAZS was taken from an earlier study (DIFD, annual report
2002) we do not have the exact amount spent by GVT, we have assumed GVT’s research
cost to closely match DFID’s. Rockefeller foundation invested in the research and
dissemination of Ashoka varieties from the year 2003 onwards. The yearly costs of
Rockefeller foundation were taken from GVT’s annual project reports [Appendix Table
D].
The two key elements of the benefit calculations are the yield per ha and grain quality
improvements. We have several measurements of yield improvements. Ideally we would
54
like the change in yields in the fields of adopting farmers. However, that will be
measured in a future study. At present, we have data on yields from farmers who grew
these varieties under the supervision of GVT/Wales scientists. The differences in the
mean yields between the local variety (Birsa Gora102) and the Ashoka varieties in
AICRIP trials & GVT BAU (99-01) was 560 kg/ha the trials were held in Jharkhand.
We have opted for the increase of Ashoka varieties over local varieties from the
regression analysis the difference in yield of Ashoka varieties and BG102 was 497 kg/ha.
The yield advantage of the second generation of GVT/Wales variety PY84 is 712 kg/ha.
The area over which the Ashoka varieties spread is calculated as follows. In Eastern
India the total area of rice is 11,884,000 ha and the area of upland rice is 6,352,000 ha.
Based on our literature review (DFID Annual report, 2002) we assumed a maximum
adoption rate of 40% of the upland area in Eastern India with adoption starting in the year
the trials of Ashoka varieties began.
We used the Economic Surplus Model for closed economy because the Ashoka varieties
are being produced for poor farmers of upland areas who do not produce enough to
participate in the market, most of the production is for self consumption. The supply is
inelastic for the upland areas and most of the varieties grown there did not have high
yields. The introduction of the higher yielding and better quality Ashoka varieties will
enable the farmers to take some of their produce to the market. A similar study performed
by Selvaraj (Selvaraj, 2007) on impact of drought and salinity tolerant rice in Tamil Nadu
was utilized for the elasticity data. We use the Alston Norton and Pardey model
assumption for proportionate input cost change per hectare for our analysis because
55
change in cost has not been quantified. We performed scenario analysis for participatory
plant breeding method - the assumptions for the analysis are detailed in Table 15.
Table 15: Assumption for scenario analysis
Assumption Participatory Plant
Breeding
Supply Elasticity .35
Demand Elasticity .40
Maximum adoption rate 40%
Minimum adoption rate 8%
Discount Rate 5%
Prop. input cost change/ha .10
CAZS expenditure $71,684
GVT annual expenditure $70,000
(Source: Compiled from various sources)
Based upon these assumptions we used the spread sheet approach by Alston, Norton &
Pardey for calculating the net present value and internal rate of return for the research and
dissemination of Ashoka varieties in Eastern. The benefits over time for the varieties are
shown in figure 2.
Figure 2: Benefits over time for different varieties
(Source: Author)
We can see that PY84 a second generation upland PPB variety has very high benefits.
The Ashoka varieties lead to more benefits than Vandana.
NPV ($ 888,268) for the research that developed the Ashoka varieties has been
calculated using the formula:
� �ΔTS – Research�� � ��
����
������
and IRR (1.67) is calculated when the NPV function is zero or IRR is given by ‘rate’ in
Figure 2: Benefits over time for different varieties
We can see that PY84 a second generation upland PPB variety has very high benefits.
The Ashoka varieties lead to more benefits than Vandana.
NPV ($ 888,268) for the research that developed the Ashoka varieties has been
calculated using the formula:
Research Cost����
and IRR (1.67) is calculated when the NPV function is zero or IRR is given by ‘rate’ in
56
We can see that PY84 a second generation upland PPB variety has very high benefits.
NPV ($ 888,268) for the research that developed the Ashoka varieties has been
and IRR (1.67) is calculated when the NPV function is zero or IRR is given by ‘rate’ in
57
� �ΔTS – Research Cost���� � ���
����
������= 0
j: year
r: the discount rate which in our study is 5% based on previous studies.
In case of participatory plant breeding the time to adoption is less because of the
collaboration of scientists and farmers from the beginning [APPENDIX G]. Based on our
analysis the Net present value of the research being carried out in Eastern India (PPB 1)
is ($888,268). The NPV is positive indicating that the project is profitable. The research
being done in Eastern India is beneficial. The NPV for the PPB generation II (PY 84)
variety is also high ($894,018) indicating that research efforts in Eastern India continues
to successfully develop better varieties for upland areas. Our results indicate that the IRR
167% from 1997-2017 for the research being carried out in Eastern India. The project is
successful and the investments made by RF in the research effort in Eastern India have a
positive impact on drought prone areas of Eastern India.
We change the maximum adoption rate to 10% then to 40% to see the impact it would
have on the NPV and IRR of the research and dissemination project in Eastern India we
can see from table 17 that adoption rate has a major impact on NPV and IRR.
Table 16 indicates that adoption rate does have a significant impact on the benefits
derived from research. The benefits from Vandana are too low to yield a rate of return.
When we compare our results to other studies done on economic impact evaluation we
can see that our study fits in the IRR of research and extension projects range (min -100
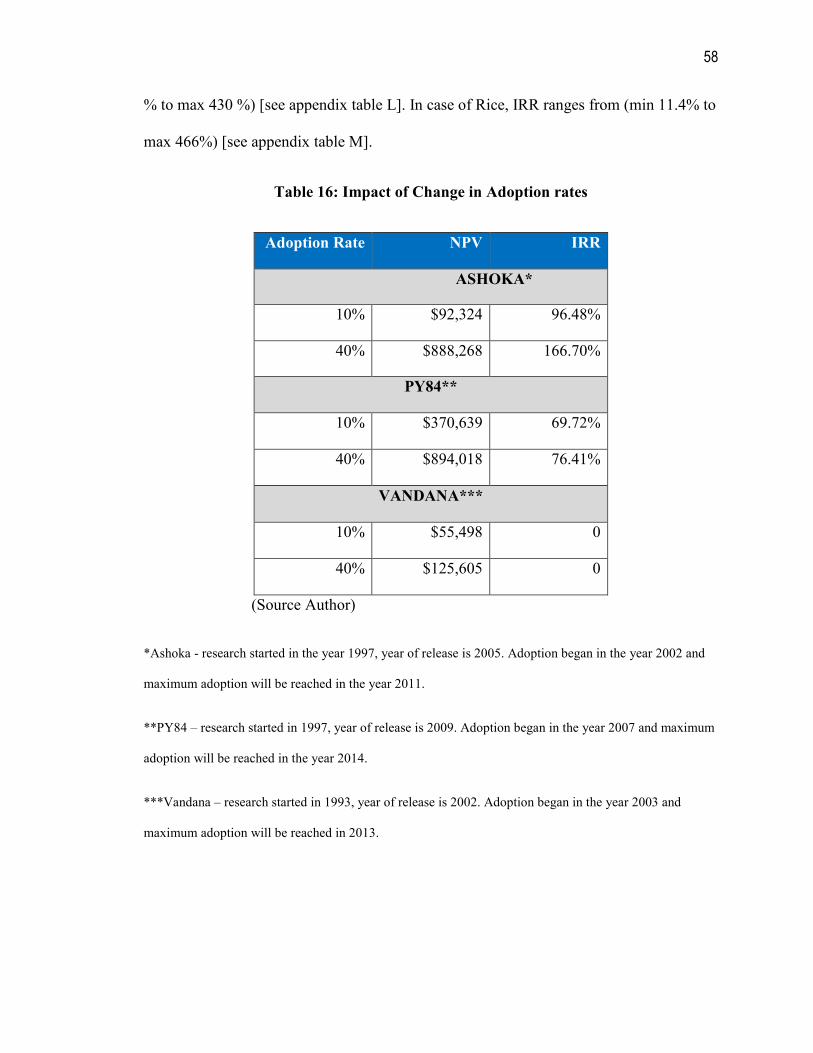
58
% to max 430 %) [see appendix table L]. In case of Rice, IRR ranges from (min 11.4% to
max 466%) [see appendix table M].
Table 16: Impact of Change in Adoption rates
Adoption Rate PV IRR
ASHOKA*
10% $92,324 96.48%
40% $888,268 166.70%
PY84**
10% $370,639 69.72%
40% $894,018 76.41%
VA DA A***
10% $55,498 0
40% $125,605 0
(Source Author)
*Ashoka - research started in the year 1997, year of release is 2005. Adoption began in the year 2002 and
maximum adoption will be reached in the year 2011.
**PY84 – research started in 1997, year of release is 2009. Adoption began in the year 2007 and maximum
adoption will be reached in the year 2014.
***Vandana – research started in 1993, year of release is 2002. Adoption began in the year 2003 and
maximum adoption will be reached in 2013.
59
Costs and Benefits of Rockefeller Foundation’s seed production project
In the following section, we calculated the benefits in terms of the value of the yield
increase and grain quality due to the Rockefeller funded program to disseminate Ashoka
varieties among the farming households in eastern India. RF started funding GVT seed
distribution in 2003 as the DFID funding for seed distribution was declining and then
picked up the entire program in 2005 when DFID stopped funding this program. RF
invested a total of $289,691 in this program.
The benefits of this program are based on the same yield gains and grain quality
improvements of the Ashoka varieties over the existing, local upland variety namely BG
102. Ashoka being a fine grain quality variety compared to the existing BG102
commanded higher prices in the market (12% higher) and also yielded (15-20%) more.
In this case unlike the previous section we actually have some data on the spread of the
varieties – the amounts of seed the GVT, NGOs, and government agencies distributed
each year. These amounts are found in Table 3. They grew from a low of 17.26 in 2005
the transition year – to a high of 255t in 2008.
However, in addition to the seed sold by GVT and its collaborators, farmers saved some
seed and replanted some of it as well as giving or selling some to their neighbors. This
means that the seed had a multiplier effect - in the second year the beneficiaries were not
only the farmers who planted and saved the new varieties but also the farmers who got
seed from other farmers. Unfortunately, we do not have very good evidence on how
much of the seed was saved and replanted.
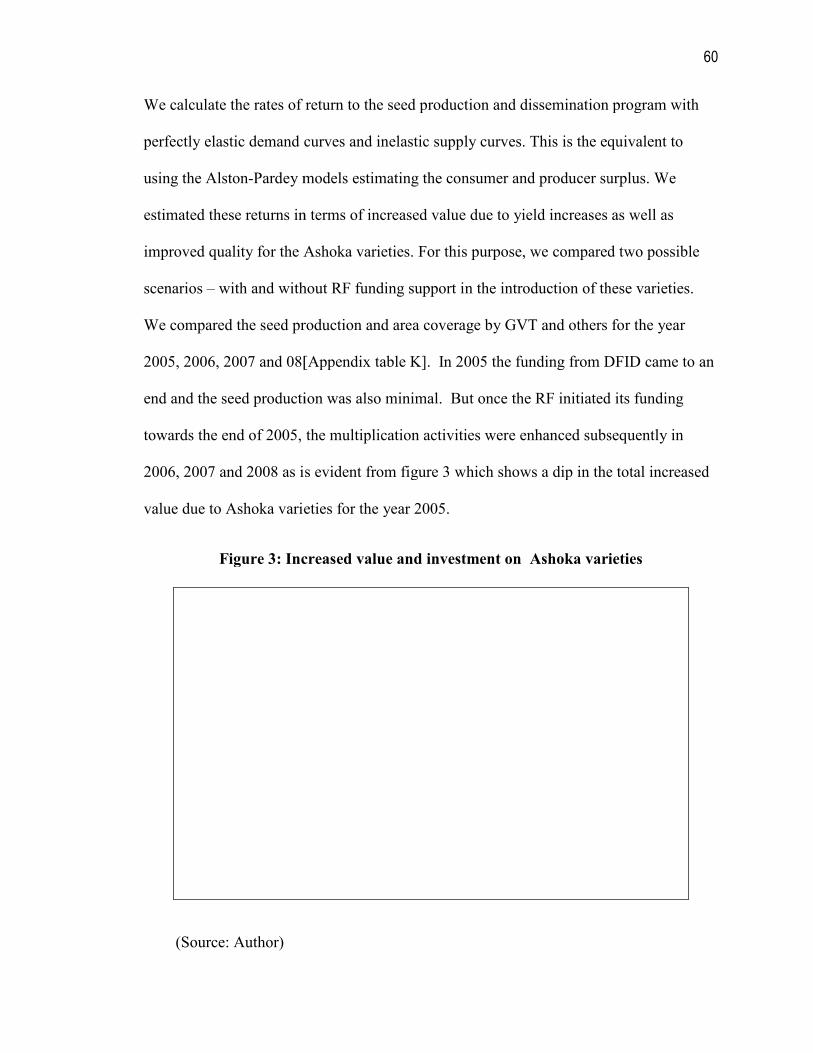
We calculate the rates of return to the seed production and dissemination program with
perfectly elastic demand curves and inelastic supply curves. This is the e
using the Alston-Pardey models estimating the consumer and producer surplus. We
estimated these returns in terms of increased value due to yield increases as well as
improved quality for the Ashoka varieties. For this purpose, we compared two
scenarios – with and without RF funding support in the introduction of these varieties.
We compared the seed production and area coverage by GVT and others for the year
2005, 2006, 2007 and 08[Appendix table K]. In 2005 the funding from DFID cam
end and the seed production was also minimal. But once the RF initiated its funding
towards the end of 2005, the multiplication activities were enhanced subsequently in
2006, 2007 and 2008 as is evident from figure 3 which shows a dip in the total
value due to Ashoka varieties for the year 2005.
Figure 3: Increased value and investment on Ashoka varieties
(Source: Author)
We calculate the rates of return to the seed production and dissemination program with
perfectly elastic demand curves and inelastic supply curves. This is the equivalent to
Pardey models estimating the consumer and producer surplus. We
estimated these returns in terms of increased value due to yield increases as well as
improved quality for the Ashoka varieties. For this purpose, we compared two
with and without RF funding support in the introduction of these varieties.
We compared the seed production and area coverage by GVT and others for the year
2005, 2006, 2007 and 08[Appendix table K]. In 2005 the funding from DFID cam
end and the seed production was also minimal. But once the RF initiated its funding
towards the end of 2005, the multiplication activities were enhanced subsequently in
2006, 2007 and 2008 as is evident from figure 3 which shows a dip in the total
value due to Ashoka varieties for the year 2005.
Figure 3: Increased value and investment on Ashoka varieties
60
We calculate the rates of return to the seed production and dissemination program with
quivalent to
Pardey models estimating the consumer and producer surplus. We
estimated these returns in terms of increased value due to yield increases as well as
improved quality for the Ashoka varieties. For this purpose, we compared two possible
with and without RF funding support in the introduction of these varieties.
We compared the seed production and area coverage by GVT and others for the year
2005, 2006, 2007 and 08[Appendix table K]. In 2005 the funding from DFID came to an
end and the seed production was also minimal. But once the RF initiated its funding
towards the end of 2005, the multiplication activities were enhanced subsequently in
2006, 2007 and 2008 as is evident from figure 3 which shows a dip in the total increased
Figure 3: Increased value and investment on Ashoka varieties
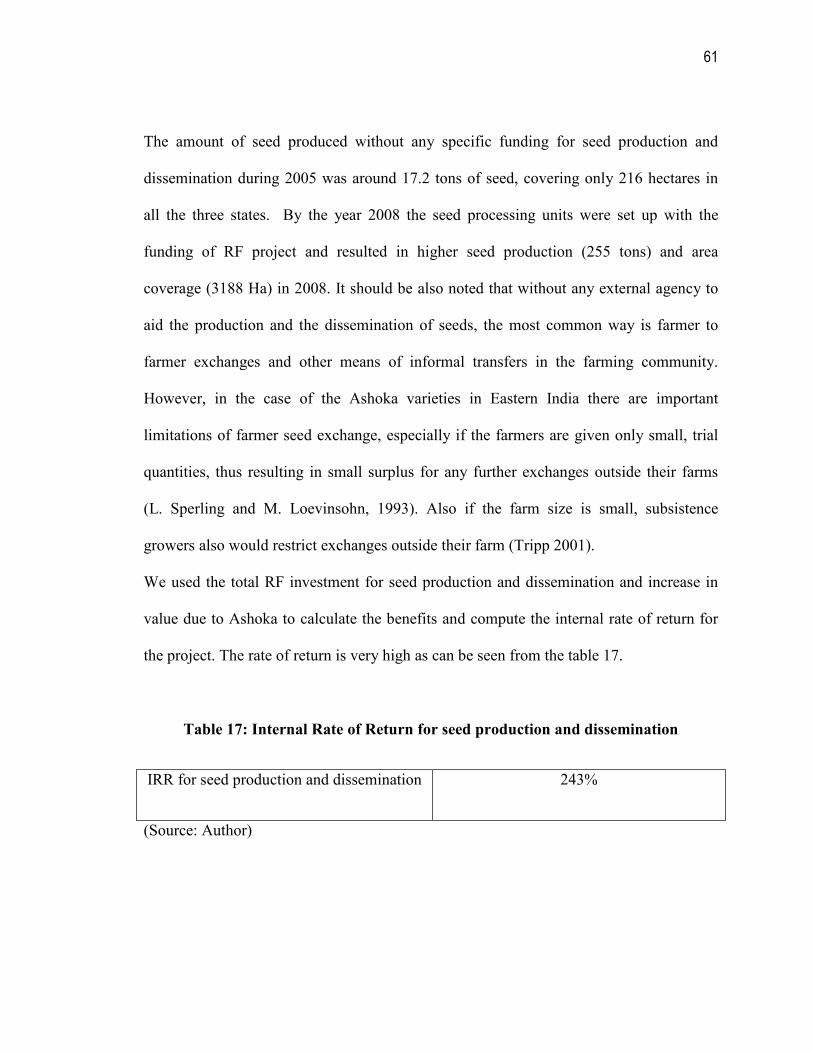
61
The amount of seed produced without any specific funding for seed production and
dissemination during 2005 was around 17.2 tons of seed, covering only 216 hectares in
all the three states. By the year 2008 the seed processing units were set up with the
funding of RF project and resulted in higher seed production (255 tons) and area
coverage (3188 Ha) in 2008. It should be also noted that without any external agency to
aid the production and the dissemination of seeds, the most common way is farmer to
farmer exchanges and other means of informal transfers in the farming community.
However, in the case of the Ashoka varieties in Eastern India there are important
limitations of farmer seed exchange, especially if the farmers are given only small, trial
quantities, thus resulting in small surplus for any further exchanges outside their farms
(L. Sperling and M. Loevinsohn, 1993). Also if the farm size is small, subsistence
growers also would restrict exchanges outside their farm (Tripp 2001).
We used the total RF investment for seed production and dissemination and increase in
value due to Ashoka to calculate the benefits and compute the internal rate of return for
the project. The rate of return is very high as can be seen from the table 17.
Table 17: Internal Rate of Return for seed production and dissemination
IRR for seed production and dissemination 243%
(Source: Author)
62
This clearly shows that there are very high social returns to R&D investment in seed
distribution activities, with minimal effort from the existing extension services.
We do a sensitivity analysis with the seed production assuming one third of the farmers
who bought Ashoka were replacing it, there is 1/3 fall in increased value due to Ashoka.
The internal rate of return falls to 95.32%.
63
7. CO CLUSIO S
In this study an attempt has been made to assess the economic impact of the drought
tolerant rice varieties using cost benefit analysis. The quality impact has been measured
using formulas from hedonic price model. We evaluated the Ashoka varieties with regard
to their contribution towards increased yield and improved quality aspects and thus on the
farmer welfare in upland rice growing regions of Eastern India. This study clearly shows
that the research is beneficial. A spill over benefit has been the successful development of
new pipeline varieties - some of these have been released or are in the process of being
released (GVT report, 2008).
Major findings of the research include:
1. The internal rate of return of drought tolerant rice research efforts in Eastern India
is 167%. This is very high indicating that the research being done in Eastern India
is very efficient and the project is worth investing.
2. Based on our literature review we can say that among breeding methods, PPB
seems to be much more efficient than conventional and biotech breeding. In our
scenario analysis, the Net Present Value of investments in PPB research in
Eastern India is $888,268. A high net present value indicates that the project is
successful. Investments made in the project will result in benefits of $888,268.
With Biotech breeding the benefits could be higher but the initial cost of
investment (mostly infrastructure) is much higher when compared to both
conventional and PPB methods (Selvaraj, 2006). In addition, the regulatory costs
involved in the approval of biotech varieties are higher and the overall time
64
involved longer. As an example, Bt rice remains in trials for eight years in India
before they are ready for release (http://www.business-standard.com).
3. The internal rate of return using cost benefit analysis for the seed production and
dissemination program of Rockefeller foundation is 243%. The high rate of return
indicates that the RF project is making a big difference in the spread of the
Ashoka varieties in Eastern India. The program has been successful in increasing
the area under Ashoka varieties enabling more marginal farmers to have access to
better varieties of rice.
Implications
One of the major hurdles in improving the livelihood of poor farmers growing upland
rice in Eastern India had been the lack of varieties with good quality and yield
characteristics. Before the PPB approach had been used in Eastern India the farmers
had limited choice and were mostly growing landraces (Virk & Witcombe, 2006).
PPB is a good approach for breeding and adoption for varieties grown by semi-
subsistence households because it incorporates the desired traits very early in the
breeding process. The development and adoption of varieties takes place much faster
than conventional methods.
The success of PPB has resulted in the development of improved upland cultivar like
Ashoka with farmer desired qualities. The success of research will only be beneficial
if the farmers are able to access the drought tolerant varieties. To make Ashoka
varieties reach maximum level of adoption it has to be backed by a good seed supply
mechanism e.g KVK’s and state seed corporations.
65
The internal rate of return for the seed dissemination effort is very high in Eastern
India. Adoption can be even more widespread if public investment is made for
increasing seed multiplication and large scale adoption. Government agencies need
to play an active role in the production and dissemination efforts being undertaken in
Eastern India. Efforts need to be made to encourage private sector companies to have
a greater role in the marketing and sale of drought tolerant rice seed. PPB has proven
to be a very good example of public and private partnership.
Future Work
Based on our study there will be losses experienced due to drought. However, this
study takes a very concentrated focus of the drought situation since we do not have
the data to calculate the actual loss due to drought in these areas.
It would be very interesting to be able to assess the extent of spread of the Ashoka
varieties in Eastern India and in other states where these varieties are being grown.
There is very little information on the spread of the Ashoka varieties in areas outside
the GVT, BAU & CAZR trial areas. We expect to obtain more information when a
more detailed survey will be done to overcome this limitation.
One of the major aspects in the success of the Ashoka varieties is the production and
dissemination of seed. It is evident that the seed companies are not interested in
selling these varieties because selling them is not profitable. The Indian government
can provide subsidies to the firms to interest them in selling the seed of these varieties
or companies like KRIBKO can provide financial backing to GVT to further the
spread of these varieties to improve the livelihood of poor farmers of Eastern India.
66
LIST OF REFERE CES CITED
Alston, J M, G W Norton, and P G Pardey. Science under Scarcity: Principles and
Practice for Agricultural Research and Evaluation and Priority Setting. Ithaca, NY: Cornell University Press, 1995.
Ashby, J.A, and N. Lilja. Participatory research: Does it work? Evidence from
participatory breeding. In: New directions for a diverse planet. Proceedings of the 4th
International Crop Science Congress, Brisbane, Australia, 26 Sep – 1 Oct 2004.
Babu R.C., B.D. Nguyen, V. Chamarerk, P. Shanmugasundaram, P. Chezhian, P. Jeyaprakash, S.K. Ganesh, A. Palchamy, S. Sadasivam, S. Sarkarung, L.J. Wade, and H.T. Nguyen. Genetic analysis of drought resistance in rice by molecular markers: Association between secondary traits and field performance. Crop Science 43: 1457-1469, 2003. Bourai VA, Choudhary A, Misra M. Participatory crop improvement in Eastern India: a preliminary impact assessment.PSP Annual Report, 2002. Section I: Introduction and General Overview, Research Outcomes, pp 25–33, 2002. Business Standard “India to wait 8 years for Bt rice commercialization”. February 20, 2009. http://www.business-standard.com/india/news/india-to-wait-8-years-for-bt-rice-commercialisation/20/07/349549/. Byerlee, D., and T. Husain. Agricultural Research Strategies for Favoured and Marginal Areas, The Experience of Farming System Research in Pakistan. Experimental Agriculture 29, 155-171, 1993. Ceccarelli, S.S.Grando and M.Baum.Participatory plant breeding in water-limited environments .Experimental Agriculture, 43:4:411-435,Cambridge University Press, 2007. Department For International Development, plant science research programme, Annual report 2002. http://www.research4development.info/PDF/Outputs/RLPSRAnnRepHigh13.pdf - Biotechnology Information System Network, Department of Biotechnology Government of India, provides latest information about biotechnology sector (accessed Feb 2009). http://www.business-standard.comtisnet.gov.in/uniquepage.asp FAOSTAT, 2007. Food and Agriculture Organization, rice conference, International Year Of Rice 2004. http://www.fao.org/rice2004
67
Fischer, K.S.,R.Laffitte, S.Fukai, G.Atlin and B, Hardy (editors).Breeding rice for
drought prone environments. Los Banos, Phillipines: International Rice Research Institute, 98p, 2003. Fredericksen, H.D., Berkoff, J., and Barber, W. Water resources management in Asia. Vol. 1. Main Report. World Bank Technical Paper No. 212. World Bank, Washington, D.C. 1993. GVT Annual report of R F project (2003– 2004)
GVT Annual report of R F project (2004– 2005)
GVT Annual report of R F project (2006– 2007)
GVT Annual report of R F project (2007– 2008) GVT Annual report of R F project (2007– 2008) Hemamalini, G.S., H.E. Shashidhar, S. Hittalmani. Molecular marker assisted tagging of root morphological traits under two contrasting moisture regimes at peak vegetative stage in rice (Oryza sativa L.). Euphytica 112: 69-78, 2000. Hittalmani, S., A. Parco, T.V. Mew,R.S. Zeigler, and N. Huang.Fine mapping and DNA marker-assisted pyramiding of the three major genes for blast ressistance in rice. Theoratical. Applied. Genetics. 100: 1121-1128, 2000. International Rice Research Institute. Developing and Disseminating Resilient and Productive Rice Varieties for Drought-prone Environments in India. Semiannual report, submitted to generation challenge program Rockefeller foundation, IRRI Ref. DPPC2004-32, May 2006. IRRI, 1997 . International Rice Information System database provides information on genetic resources and crop cultivars. www.iris.irri.org International Rice Research Institute, 2007, World Rice Statistics http://bhttp://solutions.irri.org/index.php?option=com_content&task=view&id=250&Itemid=192. Joshi, A. & J.R. Witcombe, Farmer participatory crop improvement II: Participatory varietal selection, a case study in India. Experimental Agriculture 32: 461–477, 1996. Kornegay, J., Beltran, J.A.,and J. Ashby. Farmer selections within segregation populations of common bean in Colombia. pps. 151-159 in P. Eyzaguirre and M. Iwanaga (eds.). Wageningen, Netherlands. International Plant Genetic Resources, Proceedings workshop on participatory plant breeding, 26-29 July 1995. Institute (IPGRI), Rome, Italy, 1996. Oryza.com downloaded from www.oryza.com – global rice news portal.
68
Pal.S, Byerlee.D. The funding and organization of agricultural research in India: evolution and emerging policy issues. Policy paper number 16.New Delhi (India); National Center for Agricultural Economics and Policy Research (ICAR).53p , 2003. Pandey Sushil. Increasing Production and Sustainability in Rainfed Rice: A Focus on
drought‐Prone Environments. Los Banos International Rice Research Institute, (2005). Poland, D., M. Sawkins, J.M. Ribaut, and D. Hoisington (editors). Progress toward
developing resilient crops for drought-prone areas- abstracts of the workshop. Los Banos, Philippines, May 27-30, 2002. Pray, C E, P Bengali, and B Ramaswami. "The cost of biosafety regulations: The Indian experience." Quarterly Journal of International Agriculture 44, no. 3, 267-289, 2005. Ramasamy C., Selvaraj.N.K., Norton George.Economic and Environmental Benefits and Costs of Developing and Commercializing Transgenic Crops – The case of Drought and Salinity Tolerant Rice. ABSPII, Tamil Nadu Agricultural University,India, 2006. Samra JS. Review and Analysis of drought monitoring, declaration, and impact management in India. International Water Management Institute (IWMI) working paper number 84- Drought Series Paper Number 2. Colombo, Sri Lanka: IWMI, 2004. Segelken. R.Stress relief: Engineering rice plants with sugar-producing gene helps them tolerate drought, salt and low temperatures, Cornell biologists report, Cornell News. p.30, 2002.
Sperling L and M. Loevinsohn, The dynamics of adoption: Distribution and mortality of
bean varieties among small farmers in Rwanda, Agricultural Systems 41: 441-53, 1993.
Tripp, R. Seed provision and agricultural development: London, Overseas Development Institute, 2001.
Toennissen, G.H., J.C. O’Toole, J.DeVries. Advances in plant biotechnology and its adoption in developing countries. Current Opinion in Plant Biology 6: 191-198, 2003. Toole ’ O. C. John. Rice and Water: The Final Frontier. The first international conference on rice for the future held at Bangkok Thailand, 31 August-2 September, 2004. Unnevher L,Duff B,Juliano O.B, editors Consumer demand for rice grain
quality,Terminal report for IDRC projects,National grain quality Asia and International grain quality economics (Asia), Los Banos, Phillipines: International Rice Reserch Institute, 1992. USDA, 2007 downloaded from http://www.irri.org/science/ricestat/data/may2008/WRS2008-Table01-USDA.pdf - International Rice Research Institutes information on rice statistics.
69
Pandey, S, H Bhandari, and B Hardy, . Economic Costs of Drought and Rice Farmers'
Coping Mechanisms: A cross-country comparitive analysis. Los Banos, Phillipines: International Rice Reserch Institute, 2007. Venuprasad, R., H.E. Shashidhar, S. Hittalmani and G.S. Hemamalini.Tagging quantitative trait loci associated with grant yield and root morphology traits in rice (Oryza sativa L.) under contrasting moisture regimes. Euphytica 128:293-300, 2002. Virk, D.S., D.N. Singh, K. Kumar, S.C. Prasad, J.S. Gangwar and J.R. Witcombe. Participatory plant breeding in rice in eastern India. In J.R. Witcombe, L.B. Parr and G.N. Atlin (eds) 2002. Breeding rainfed rice for drought-prone environments: Integrating conventional and participatory plant breeding in South and Southeast Asia.Proceedings of a DFID Plant Sciences Research Prorgamme (PSP)/IRRI Conference, IRRI Los Banos, Philippines. DFID-PSP and IRRI,Bangor and Los Banos, 104 p, 12-15 March 2002. Virk,.S.D .N. Singh, S.C. Prasad, J.S. Gangwar & J.R. Witcombe Collaborative and consultative participatory plant breeding of rice for the rainfed uplands of Eastern India. Euphytica 132:95-138, 2003. Virk .S.D. and J.R. Witcombe .Trade-offs between on-farm varietal diversity and highly client-oriented breeding – a case study of upland rice in India. Genetic Resources and
Crop Evolution 54: 823-835,2006. Rosenzweig MR, Stark O. Consumption smoothing, migration, and marriage: evidence from rural India. Journal of Political Economy 97:905–926,1989. Virk DS, Bourai VA, Choudhary A, Misra M, Witcombe JR Participatory crop improvement in Eastern India: an impact assessment. PSP Annual Report, 2003.Section I: Introduction and General Overview, Research Outcomes, pp 19–28, (2003a). Virk, D.S. & J.R. Witcombe. Introduction – an analysis of varietal testing. In: J.R. Witcombe, D.S. Virk & J. Farrington (editors.), Seeds of Choice – Making the Most of New Varieties for Small Farmers, pp. 3–6. Oxford IBH Publishing Co. New Delhi and Intermediate Technology Publications, London, 1998.
Walker.S. Thomas. Background paper World Developmental Report. Participatory Varietal Selection, Participatory Plant Breeding, and Varietal Change, 2006. Witcombe, J.R., L.B. Parr and G.N. Atlin (editors). Breeding rainfed rice for drought-prone environments: Integrating conventional and participatory plant breeding in South and Southeast Asia. Proceedings of DFID Plant Sciences, Research Prorgamme (PSP)/IRRI Conference, IRRI Los Banos, Philippines. DFID-PSP and IRRI, Bangor and Los Banos, 104 p, 12-15 March 2002.
70
Witcombe, J.R., A. Joshi, K.D. Joshi, and B.R. Sthapit. Farmer participatory crop improvement. 1. Varietal selection and breeding methods and their impact on biodiversity. Experimental Agriculture,32 number 4:445-460,1996.
Witcombe, J.R. Decentralization versus farmer participation in plant breeding: some methodology issues. In: New Frontiers in Participatory Research and Gender Analysis. Proc. Int. Seminar on Participatory Research and Gender Analysis for Technology Development. September 9–14 1996. CGIAR System wide Program on Participatory Research and Gender analysis for Technology Development and Institutional Innovation. 1997.
Witcombe, J.R., D.S. Virk ,K.P.Devkota ,K.B. Rawal S.C. Prasad, V. Kumar and K.D. Joshi. Client-Oriented Breeding and Seed Supply. http://www.future-agricultures.org/farmerfirst/files/T3a_Witcombe.pdf Directorate of Rice Development in Patna, Bihar tries to introduce high yielding varieties of rice among the farmers of different rice growing eco-systems (assessed in January 2009). www.drdpat.bih.nic.in
71
APPE DIX
TABLE A: Administrative districts chronically affected by drought conditions in
Eastern India
STATES DISTRICTS
Bihar Munger, Nawadah, Rohtas, Bhojpur, Aurangabad, Gaya
Orissa
Phulbani, Kalahandi, Bolangir, Kendrapada
West Bengal Bankura, Midnapore, Purulia
Jharkhand Palamau
(Adapted from Pandey, 2005)
72
TABLE B: Probability of occurrence of drought in different meteorological
sub‐‐‐‐divisions, India
Meteorological sub‐‐‐‐division Frequency of deficient rainfall
(75% of normal or less)
Assam Very rare, once in 15 years
West Bengal, Madhya Pradesh, Konkan, Bihar, and Orissa
Once in 5 years
South Interior Karnataka, Eastern Uttar Pradesh, and Vidarbha
Once in 4 years
Gujarat, East Rajasthan, western Uttar Pradesh
Once in 3 years Tamil Nadu,
Tamil Nadu, Jammu and Kashmir, and Telengana
Once in 2.5 years
West Rajasthan Once in 2.5 years
Adapted from Pandey, 2005
73
TABLE C: RF cost incurred in production of Ashoka varieties (2003 – 08)
Year Cost Incurred (USD)
2003 11,740
2004 11,740
2005 50,649
2006 112,234
2007 53,311
2008 50,017
Adapted from Gramin Vikas Trust Reports 2003-04, 2004-05, 2006-07
Assumptions:
1. Total research cost from 2003-05 is $23,480. Hence annual cost over this period
is assumed to be an average value of $23,480/2 = $11,740
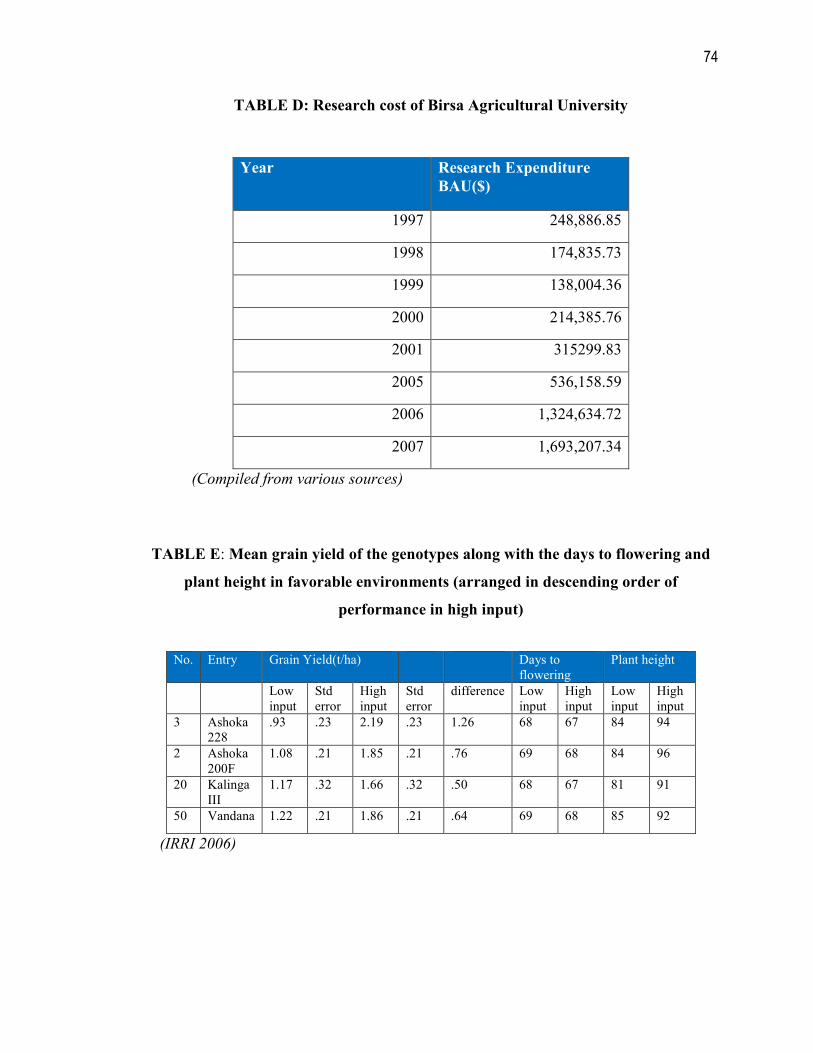
74
TABLE D: Research cost of Birsa Agricultural University
Year Research Expenditure
BAU($)
1997 248,886.85
1998 174,835.73
1999 138,004.36
2000 214,385.76
2001 315299.83
2005 536,158.59
2006 1,324,634.72
2007 1,693,207.34
(Compiled from various sources)
TABLE E: Mean grain yield of the genotypes along with the days to flowering and
plant height in favorable environments (arranged in descending order of
performance in high input)
(IRRI 2006)
No. Entry Grain Yield(t/ha) Days to flowering
Plant height
Low input
Std error
High input
Std error
difference Low input
High input
Low input
High input
3 Ashoka 228
.93 .23 2.19 .23 1.26 68 67 84 94
2 Ashoka 200F
1.08 .21 1.85 .21 .76 69 68 84 96
20 Kalinga III
1.17 .32 1.66 .32 .50 68 67 81 91
50 Vandana 1.22 .21 1.86 .21 .64 69 68 85 92
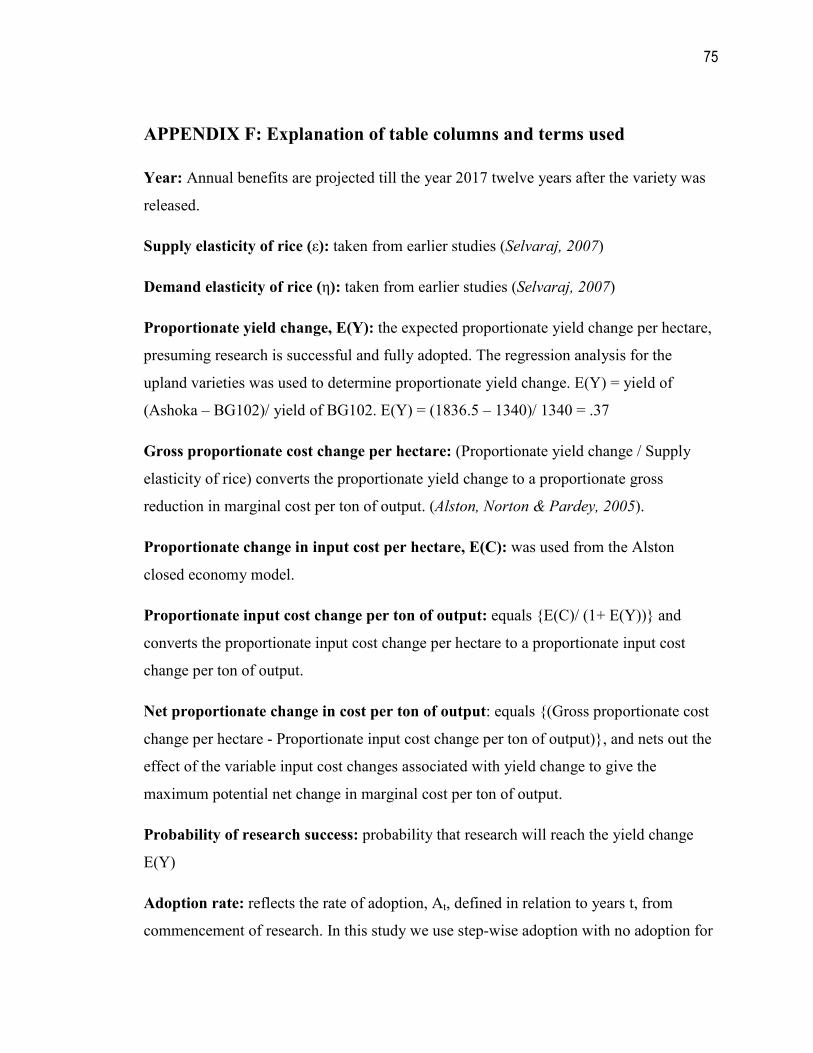
75
APPE DIX F: Explanation of table columns and terms used
Year: Annual benefits are projected till the year 2017 twelve years after the variety was
released.
Supply elasticity of rice (ε): taken from earlier studies (Selvaraj, 2007)
Demand elasticity of rice (η): taken from earlier studies (Selvaraj, 2007)
Proportionate yield change, E(Y): the expected proportionate yield change per hectare,
presuming research is successful and fully adopted. The regression analysis for the
upland varieties was used to determine proportionate yield change. E(Y) = yield of
(Ashoka – BG102)/ yield of BG102. E(Y) = (1836.5 – 1340)/ 1340 = .37
Gross proportionate cost change per hectare: (Proportionate yield change / Supply
elasticity of rice) converts the proportionate yield change to a proportionate gross
reduction in marginal cost per ton of output. (Alston, <orton & Pardey, 2005).
Proportionate change in input cost per hectare, E(C): was used from the Alston
closed economy model.
Proportionate input cost change per ton of output: equals {E(C)/ (1+ E(Y))} and
converts the proportionate input cost change per hectare to a proportionate input cost
change per ton of output.
et proportionate change in cost per ton of output: equals {(Gross proportionate cost
change per hectare - Proportionate input cost change per ton of output)}, and nets out the
effect of the variable input cost changes associated with yield change to give the
maximum potential net change in marginal cost per ton of output.
Probability of research success: probability that research will reach the yield change
E(Y)
Adoption rate: reflects the rate of adoption, At, defined in relation to years t, from
commencement of research. In this study we use step-wise adoption with no adoption for
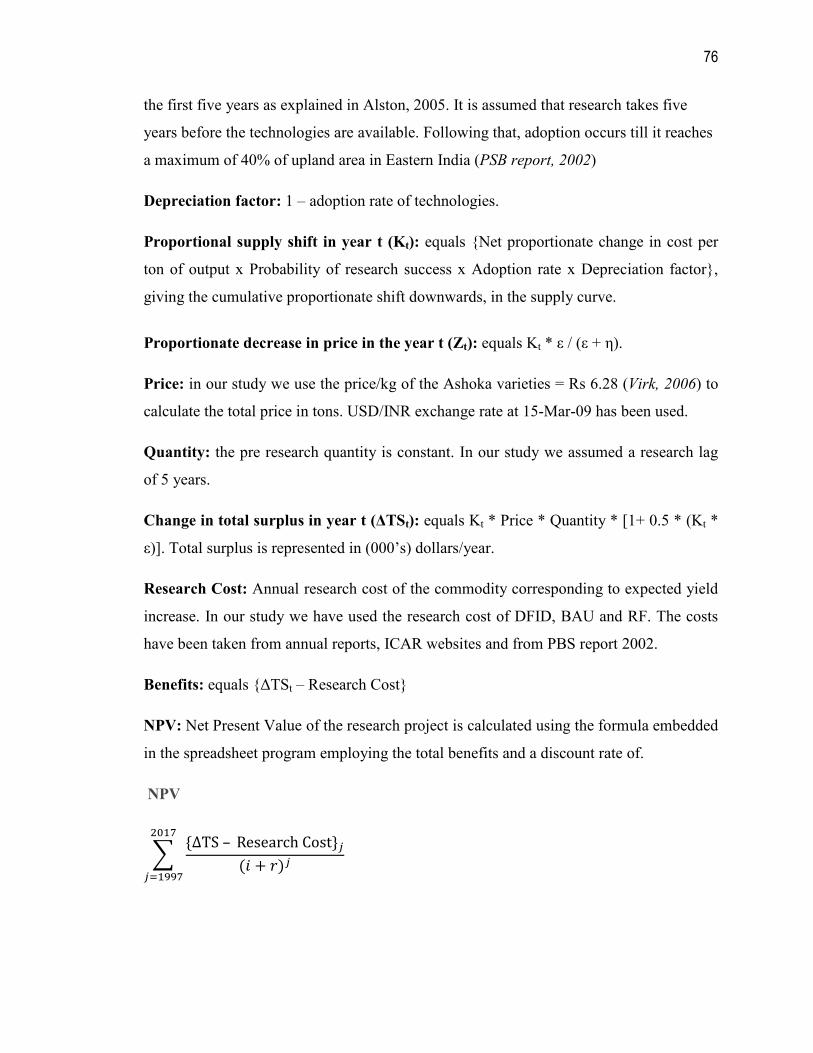
76
the first five years as explained in Alston, 2005. It is assumed that research takes five
years before the technologies are available. Following that, adoption occurs till it reaches
a maximum of 40% of upland area in Eastern India (PSB report, 2002)
Depreciation factor: 1 – adoption rate of technologies.
Proportional supply shift in year t (Kt): equals {Net proportionate change in cost per
ton of output x Probability of research success x Adoption rate x Depreciation factor},
giving the cumulative proportionate shift downwards, in the supply curve.
Proportionate decrease in price in the year t (Zt): equals Kt * ε / (ε + η).
Price: in our study we use the price/kg of the Ashoka varieties = Rs 6.28 (Virk, 2006) to
calculate the total price in tons. USD/INR exchange rate at 15-Mar-09 has been used.
Quantity: the pre research quantity is constant. In our study we assumed a research lag
of 5 years.
Change in total surplus in year t (∆TSt): equals Kt * Price * Quantity * [1+ 0.5 * (Kt *
ε)]. Total surplus is represented in (000’s) dollars/year.
Research Cost: Annual research cost of the commodity corresponding to expected yield
increase. In our study we have used the research cost of DFID, BAU and RF. The costs
have been taken from annual reports, ICAR websites and from PBS report 2002.
Benefits: equals {∆TSt – Research Cost}
PV: Net Present Value of the research project is calculated using the formula embedded
in the spreadsheet program employing the total benefits and a discount rate of.
PV
� �ΔTS – Research Cost���� � ���
����
������
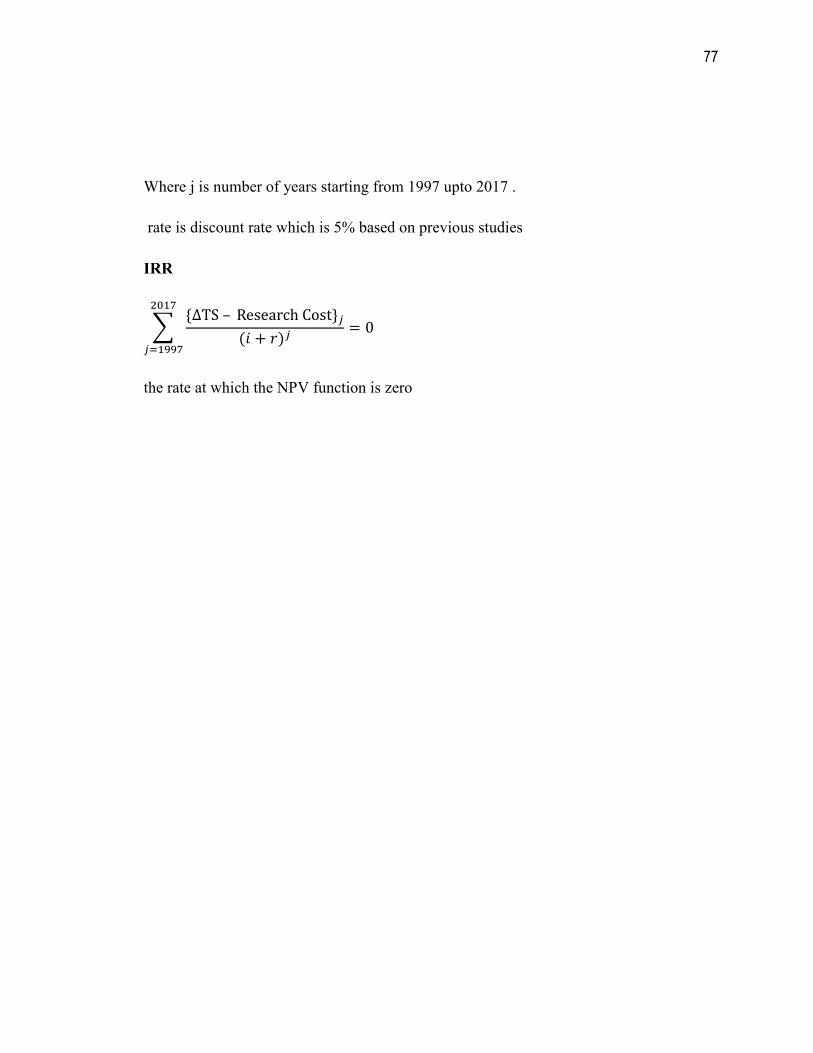
77
Where j is number of years starting from 1997 upto 2017 .
rate is discount rate which is 5% based on previous studies
IRR
� �ΔTS – Research Cost���� � ���
����
������= 0
the rate at which the NPV function is zero
78
APPE DIX G: Data & Assumptions used
Average Yield (BG102): 1340.3 kg/ha from the sample.
Average Yield (A200F): 1850 kg/ha from the sample.
Average Yield (A228): 1823 kg/ha from the sample.
Average Mean Yield: 1836.5 kg/ha from the regression.
Total Upland area in Eastern India: 6352000.0 ha (Annual report, 2003)
Research cost:
• from 2011 to 2017 is extrapolated to be minimum over the research project.
• from 2003 to 2005 averaged to a total $23,480.
• from 1997-2001 is taken from www.iasri.res.in
• from 2005-2007 is taken from http://www.iasri.res.in/agridata/HOME.HTML
• CAZS expenditure assumed to be: $71,694.30 based on PSB annual report 2002
• GVT annual expenditure assumed to be: $70,000
Quantity produced: from 2010 onwards is extrapolated to be the maximum value over
the research period.
Adoption rate: upto 40% has been assumed and adoption starts after five years.
USD/GBP exchange rate: as at 18-Mar-09.
Proportionate input cost change per hectare: .10 using Alston Pardey closed economy
model.
Discount rate of: 5% based on previous studies.
USD/I R exchange rate: as at 15-Mar-09.
Price of Ashoka varieties: Rs 6.28 /kg ( Virk & Witcomeb, 2006)
Price of BG102 variety: Rs 5.62 /kg ( Virk & Witcomeb, 2006)
Quantity produced from 2010 onwards equated to maximum value until that year.
Research cost in ‘000s of dollars as per Alston Pardey Model
Fraction of total research expenditure allocated to rice assumed to be .33
Simulations based on the Alston Pardey Model
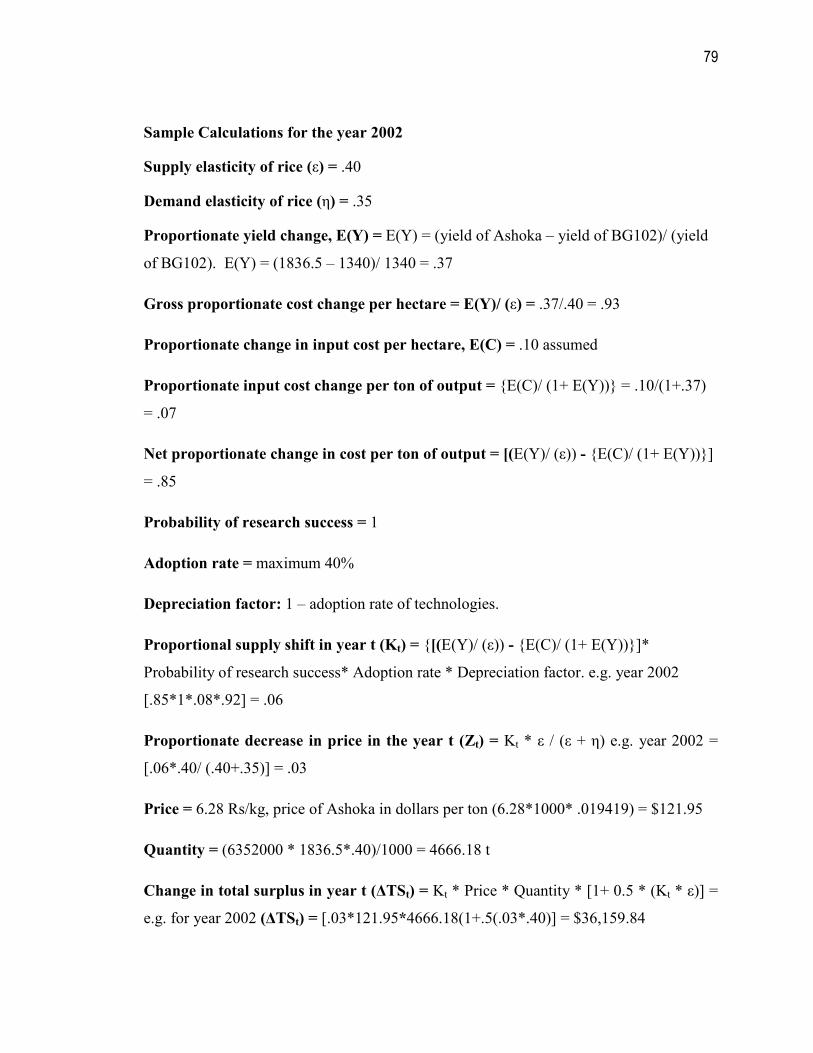
79
Sample Calculations for the year 2002
Supply elasticity of rice (ε) = .40
Demand elasticity of rice (η) = .35
Proportionate yield change, E(Y) = E(Y) = (yield of Ashoka – yield of BG102)/ (yield
of BG102). E(Y) = (1836.5 – 1340)/ 1340 = .37
Gross proportionate cost change per hectare = E(Y)/ (ε) = .37/.40 = .93
Proportionate change in input cost per hectare, E(C) = .10 assumed
Proportionate input cost change per ton of output = {E(C)/ (1+ E(Y))} = .10/(1+.37)
= .07
et proportionate change in cost per ton of output = [(E(Y)/ (ε)) - {E(C)/ (1+ E(Y))}]
= .85
Probability of research success = 1
Adoption rate = maximum 40%
Depreciation factor: 1 – adoption rate of technologies.
Proportional supply shift in year t (Kt) = {[(E(Y)/ (ε)) - {E(C)/ (1+ E(Y))}]*
Probability of research success* Adoption rate * Depreciation factor. e.g. year 2002
[.85*1*.08*.92] = .06
Proportionate decrease in price in the year t (Zt) = Kt * ε / (ε + η) e.g. year 2002 =
[.06*.40/ (.40+.35)] = .03
Price = 6.28 Rs/kg, price of Ashoka in dollars per ton (6.28*1000* .019419) = $121.95
Quantity = (6352000 * 1836.5*.40)/1000 = 4666.18 t
Change in total surplus in year t (∆TSt) = Kt * Price * Quantity * [1+ 0.5 * (Kt * ε)] =
e.g. for year 2002 (∆TSt) = [.03*121.95*4666.18(1+.5(.03*.40)] = $36,159.84
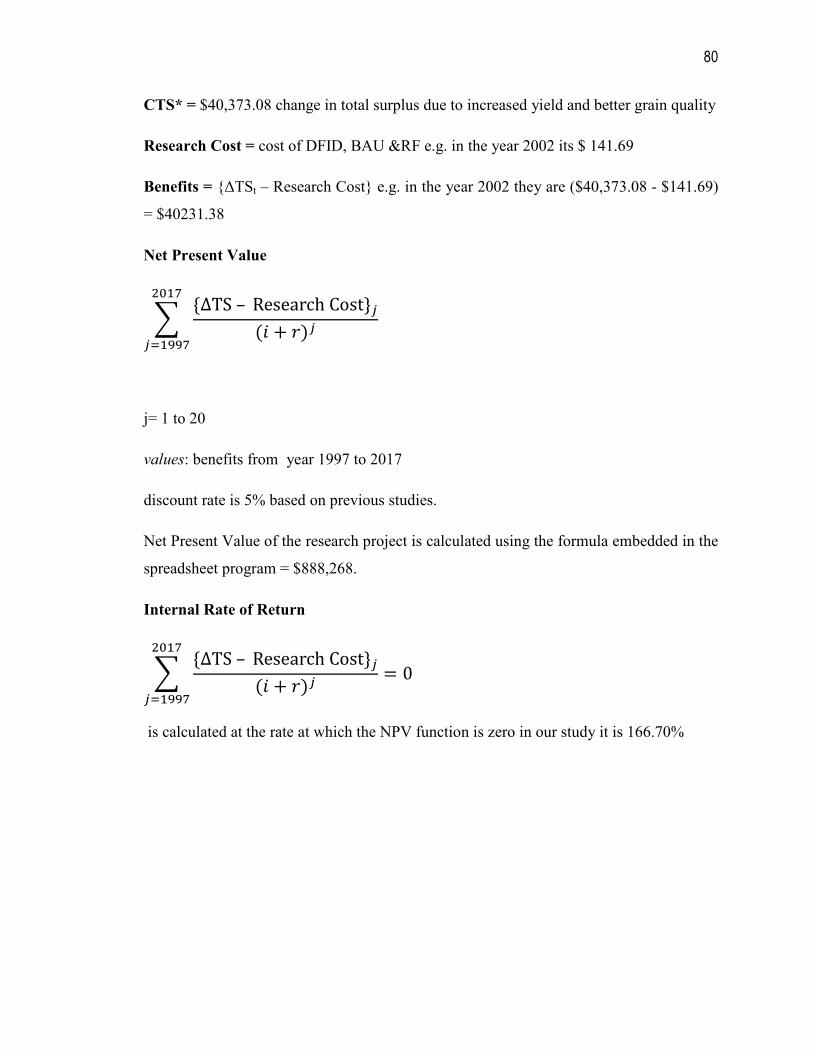
80
CTS* = $40,373.08 change in total surplus due to increased yield and better grain quality
Research Cost = cost of DFID, BAU &RF e.g. in the year 2002 its $ 141.69
Benefits = {∆TSt – Research Cost} e.g. in the year 2002 they are ($40,373.08 - $141.69)
= $40231.38
et Present Value
� �ΔTS – Research Cost���� � ���
����
������
j= 1 to 20
values: benefits from year 1997 to 2017
discount rate is 5% based on previous studies.
Net Present Value of the research project is calculated using the formula embedded in the
spreadsheet program = $888,268.
Internal Rate of Return
� �ΔTS – Research Cost���� � ���
����
������= 0
is calculated at the rate at which the NPV function is zero in our study it is 166.70%
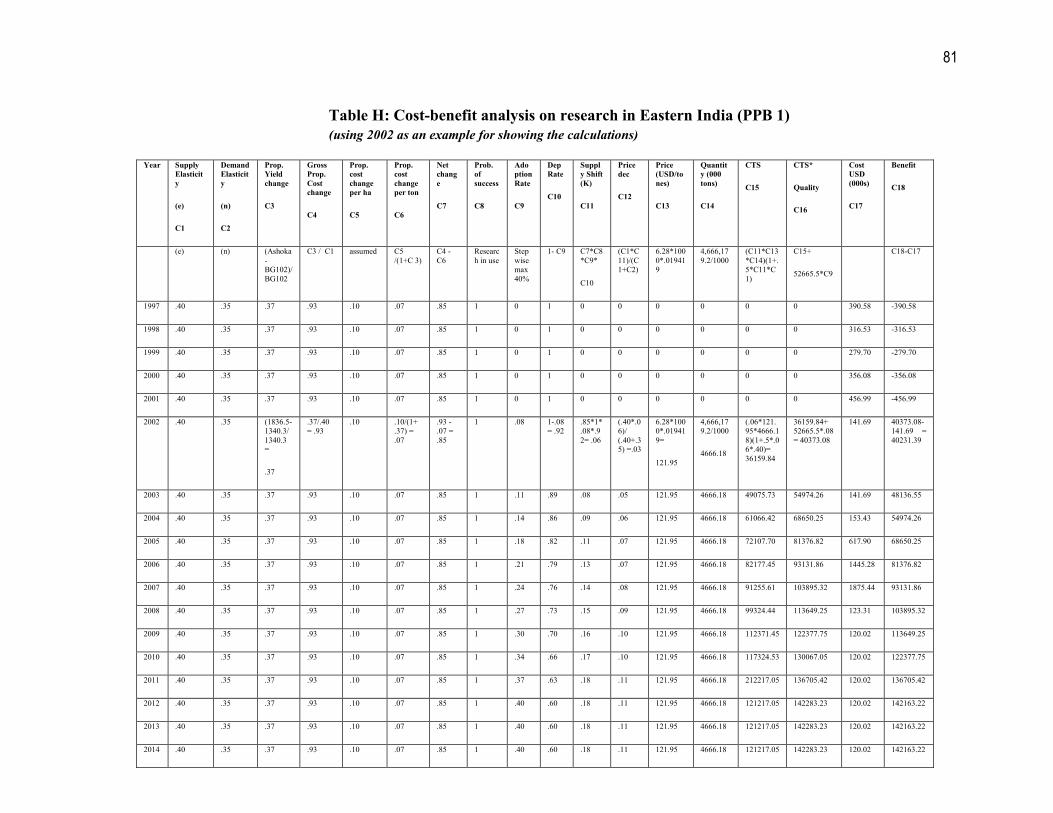
81
Year
Supply
Elasticit
y
(e)
C1
Demand
Elasticit
y
(n)
C2
Prop.
Yield
change
C3
Gross
Prop.
Cost
change
C4
Prop.
cost
change
per ha
C5
Prop.
cost
change
per ton
C6
et
chang
e
C7
Prob.
of
success
C8
Ado
ption
Rate
C9
Dep
Rate
C10
Suppl
y Shift
(K)
C11
Price
dec
C12
Price
(USD/to
nes)
C13
Quantit
y (000
tons)
C14
CTS
C15
CTS*
Quality
C16
Cost
USD
(000s)
C17
Benefit
C18
(e) (n) (Ashoka-BG102)/BG102
C3 / C1 assumed C5 /(1+C 3)
C4 - C6
Research in use
Step wise max 40%
1- C9 C7*C8*C9*
C10
(C1*C11)/(C1+C2)
6.28*1000*.019419
4,666,179.2/1000
(C11*C13*C14)(1+.5*C11*C1)
C15+
52665.5*C9
C18-C17
1997 .40 .35 .37 .93 .10 .07 .85 1 0 1 0 0 0 0 0 0 390.58 -390.58
1998 .40 .35 .37 .93 .10 .07 .85 1 0 1 0 0 0 0 0 0 316.53 -316.53
1999 .40 .35 .37 .93 .10 .07 .85 1 0 1 0 0 0 0 0 0 279.70 -279.70
2000 .40 .35 .37 .93 .10 .07 .85 1 0 1 0 0 0 0 0 0 356.08 -356.08
2001 .40 .35 .37 .93 .10 .07 .85 1 0 1 0 0 0 0 0 0 456.99 -456.99
2002 .40 .35 (1836.5-1340.3/ 1340.3 =
.37
.37/.40 = .93
.10 .10/(1+ .37) = .07
.93 -
.07 =
.85
1 .08 1-.08 = .92
.85*1*
.08*.92= .06
(.40*.06)/ (.40+.35) =.03
6.28*1000*.019419=
121.95
4,666,179.2/1000
4666.18
(.06*121.95*4666.18)(1+.5*.06*.40)= 36159.84
36159.84+ 52665.5*.08= 40373.08
141.69 40373.08- 141.69 = 40231.39
2003 .40 .35 .37 .93 .10 .07 .85 1 .11 .89 .08 .05 121.95 4666.18 49075.73 54974.26 141.69 48136.55
2004 .40 .35 .37 .93 .10 .07 .85 1 .14 .86 .09 .06 121.95 4666.18 61066.42 68650.25 153.43 54974.26
2005 .40 .35 .37 .93 .10 .07 .85 1 .18 .82 .11 .07 121.95 4666.18 72107.70 81376.82 617.90 68650.25
2006 .40 .35 .37 .93 .10 .07 .85 1 .21 .79 .13 .07 121.95 4666.18 82177.45 93131.86 1445.28 81376.82
2007 .40 .35 .37 .93 .10 .07 .85 1 .24 .76 .14 .08 121.95 4666.18 91255.61 103895.32 1875.44 93131.86
2008 .40 .35 .37 .93 .10 .07 .85 1 .27 .73 .15 .09 121.95 4666.18 99324.44 113649.25 123.31 103895.32
2009 .40 .35 .37 .93 .10 .07 .85 1 .30 .70 .16 .10 121.95 4666.18 112371.45 122377.75 120.02 113649.25
2010 .40 .35 .37 .93 .10 .07 .85 1 .34 .66 .17 .10 121.95 4666.18 117324.53 130067.05 120.02 122377.75
2011 .40 .35 .37 .93 .10 .07 .85 1 .37 .63 .18 .11 121.95 4666.18 212217.05 136705.42 120.02 136705.42
2012 .40 .35 .37 .93 .10 .07 .85 1 .40 .60 .18 .11 121.95 4666.18 121217.05 142283.23 120.02 142163.22
2013 .40 .35 .37 .93 .10 .07 .85 1 .40 .60 .18 .11 121.95 4666.18 121217.05 142283.23 120.02 142163.22
2014 .40 .35 .37 .93 .10 .07 .85 1 .40 .60 .18 .11 121.95 4666.18 121217.05 142283.23 120.02 142163.22
Table H: Cost-benefit analysis on research in Eastern India (PPB 1)
(using 2002 as an example for showing the calculations)
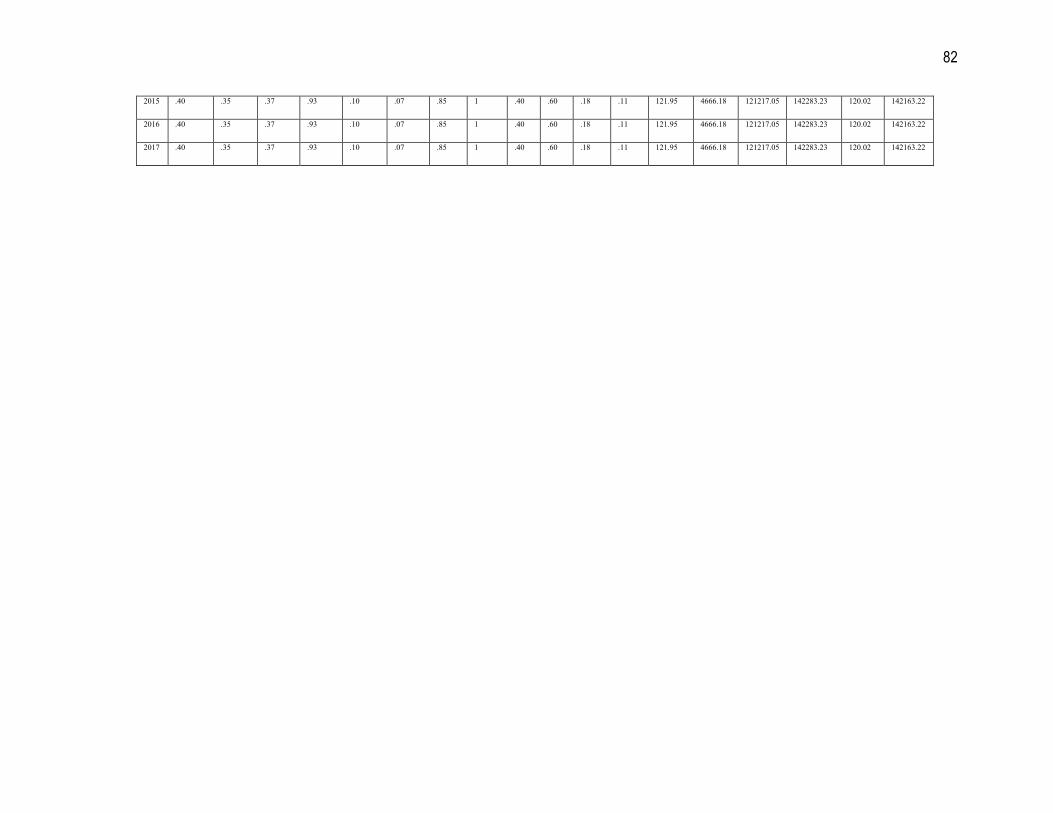
82
2015 .40 .35 .37 .93 .10 .07 .85 1 .40 .60 .18 .11 121.95 4666.18 121217.05 142283.23 120.02 142163.22
2016 .40 .35 .37 .93 .10 .07 .85 1 .40 .60 .18 .11 121.95 4666.18 121217.05 142283.23 120.02 142163.22
2017 .40 .35 .37 .93 .10 .07 .85 1 .40 .60 .18 .11 121.95 4666.18 121217.05 142283.23 120.02 142163.22
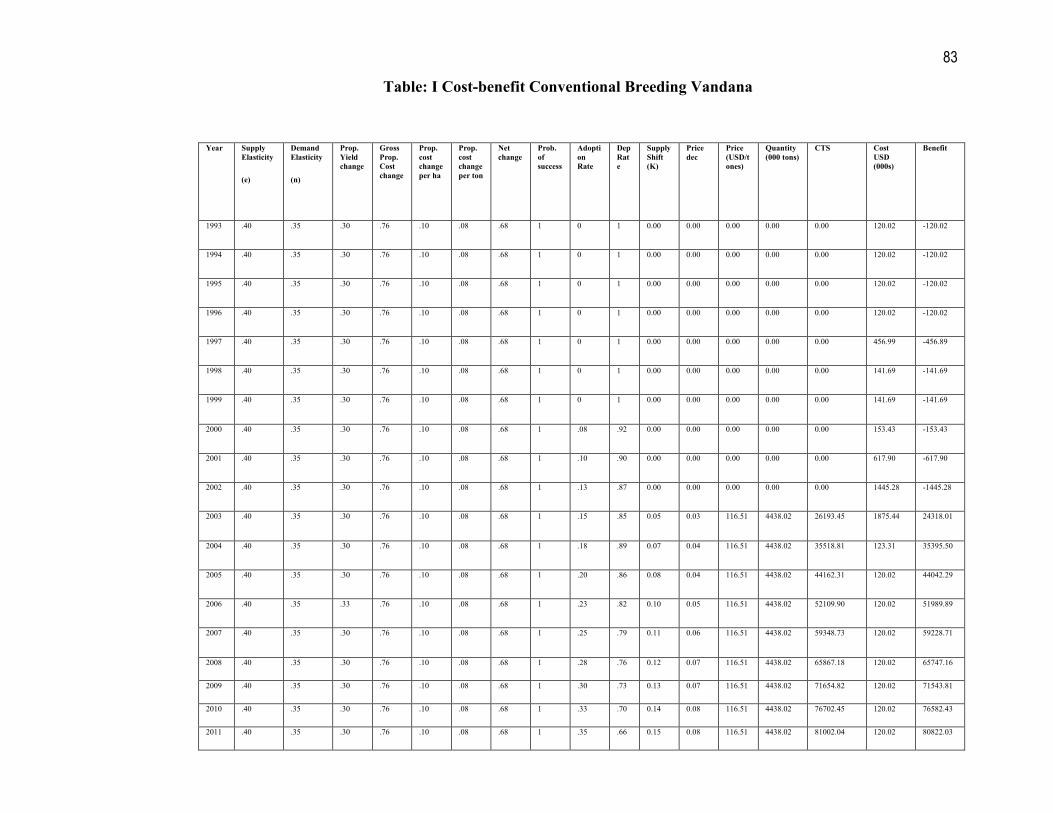
83
Year
Supply
Elasticity
(e)
Demand
Elasticity
(n)
Prop.
Yield
change
Gross
Prop.
Cost
change
Prop.
cost
change
per ha
Prop.
cost
change
per ton
et
change
Prob.
of
success
Adopti
on
Rate
Dep
Rat
e
Supply
Shift
(K)
Price
dec
Price
(USD/t
ones)
Quantity
(000 tons)
CTS Cost
USD
(000s)
Benefit
1993 .40 .35 .30 .76 .10 .08 .68 1 0 1 0.00 0.00 0.00 0.00 0.00 120.02 -120.02
1994 .40 .35 .30 .76 .10 .08 .68 1 0 1 0.00 0.00 0.00 0.00 0.00 120.02 -120.02
1995 .40 .35 .30 .76 .10 .08 .68 1 0 1 0.00 0.00 0.00 0.00 0.00 120.02 -120.02
1996 .40 .35 .30 .76 .10 .08 .68 1 0 1 0.00 0.00 0.00 0.00 0.00 120.02 -120.02
1997 .40 .35 .30 .76 .10 .08 .68 1 0 1 0.00 0.00 0.00 0.00 0.00 456.99 -456.89
1998 .40 .35 .30 .76 .10 .08 .68 1 0 1 0.00 0.00 0.00 0.00 0.00 141.69 -141.69
1999 .40 .35 .30 .76 .10 .08 .68 1 0 1 0.00 0.00 0.00 0.00 0.00 141.69 -141.69
2000 .40 .35 .30 .76 .10 .08 .68 1 .08 .92 0.00 0.00 0.00 0.00 0.00 153.43 -153.43
2001 .40 .35 .30 .76 .10 .08 .68 1 .10 .90 0.00 0.00 0.00 0.00 0.00 617.90 -617.90
2002 .40 .35 .30 .76 .10 .08 .68 1 .13 .87 0.00 0.00 0.00 0.00 0.00 1445.28 -1445.28
2003 .40 .35 .30 .76 .10 .08 .68 1 .15 .85 0.05 0.03 116.51 4438.02 26193.45 1875.44 24318.01
2004 .40 .35 .30 .76 .10 .08 .68 1 .18 .89 0.07 0.04 116.51 4438.02 35518.81 123.31 35395.50
2005 .40 .35 .30 .76 .10 .08 .68 1 .20 .86 0.08 0.04 116.51 4438.02 44162.31 120.02 44042.29
2006 .40 .35 .33 .76 .10 .08 .68 1 .23 .82 0.10 0.05 116.51 4438.02 52109.90 120.02 51989.89
2007 .40 .35 .30 .76 .10 .08 .68 1 .25 .79 0.11 0.06 116.51 4438.02 59348.73 120.02 59228.71
2008 .40 .35 .30 .76 .10 .08 .68 1 .28 .76 0.12 0.07 116.51 4438.02 65867.18 120.02 65747.16
2009 .40 .35 .30 .76 .10 .08 .68 1 .30 .73 0.13 0.07 116.51 4438.02 71654.82 120.02 71543.81
2010 .40 .35 .30 .76 .10 .08 .68 1 .33 .70 0.14 0.08 116.51 4438.02 76702.45 120.02 76582.43
2011 .40 .35 .30 .76 .10 .08 .68 1 .35 .66 0.15 0.08 116.51 4438.02 81002.04 120.02 80822.03
Table: I Cost-benefit Conventional Breeding Vandana
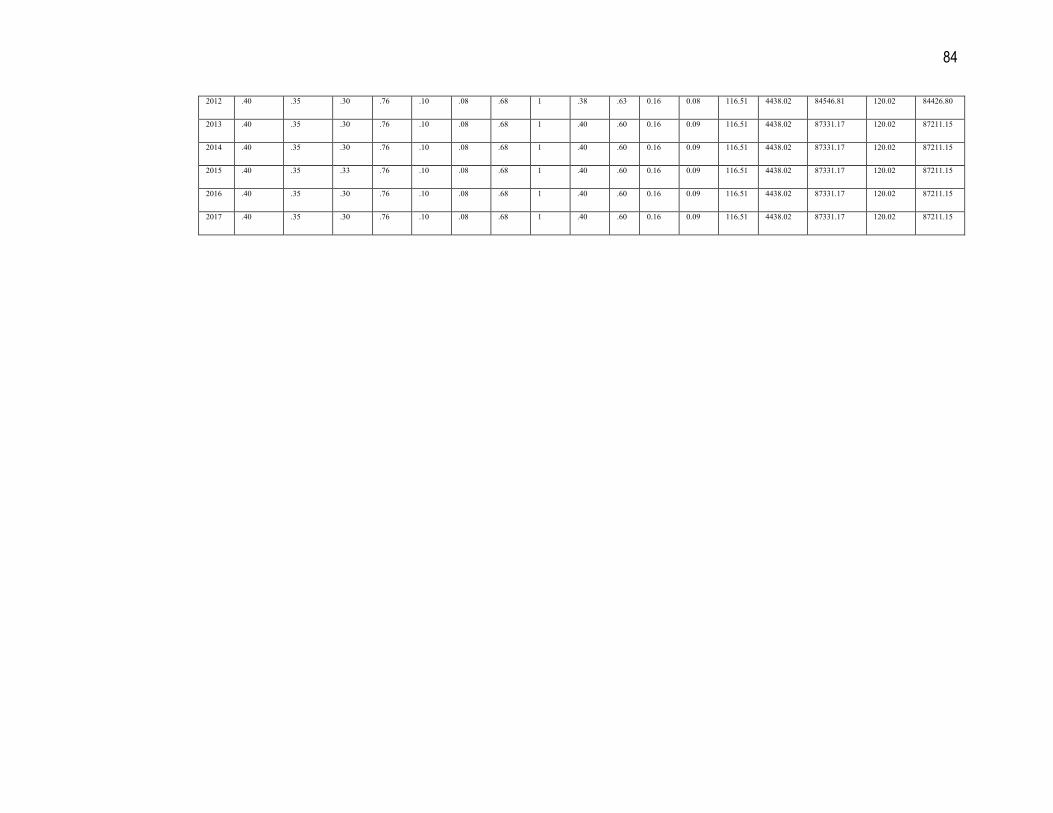
84
2012 .40 .35 .30 .76 .10 .08 .68 1 .38 .63 0.16 0.08 116.51 4438.02 84546.81 120.02 84426.80
2013 .40 .35 .30 .76 .10 .08 .68 1 .40 .60 0.16 0.09 116.51 4438.02 87331.17 120.02 87211.15
2014 .40 .35 .30 .76 .10 .08 .68 1 .40 .60 0.16 0.09 116.51 4438.02 87331.17 120.02 87211.15
2015 .40 .35 .33 .76 .10 .08 .68 1 .40 .60 0.16 0.09 116.51 4438.02 87331.17 120.02 87211.15
2016 .40 .35 .30 .76 .10 .08 .68 1 .40 .60 0.16 0.09 116.51 4438.02 87331.17 120.02 87211.15
2017 .40 .35 .30 .76 .10 .08 .68 1 .40 .60 0.16 0.09 116.51 4438.02 87331.17 120.02 87211.15
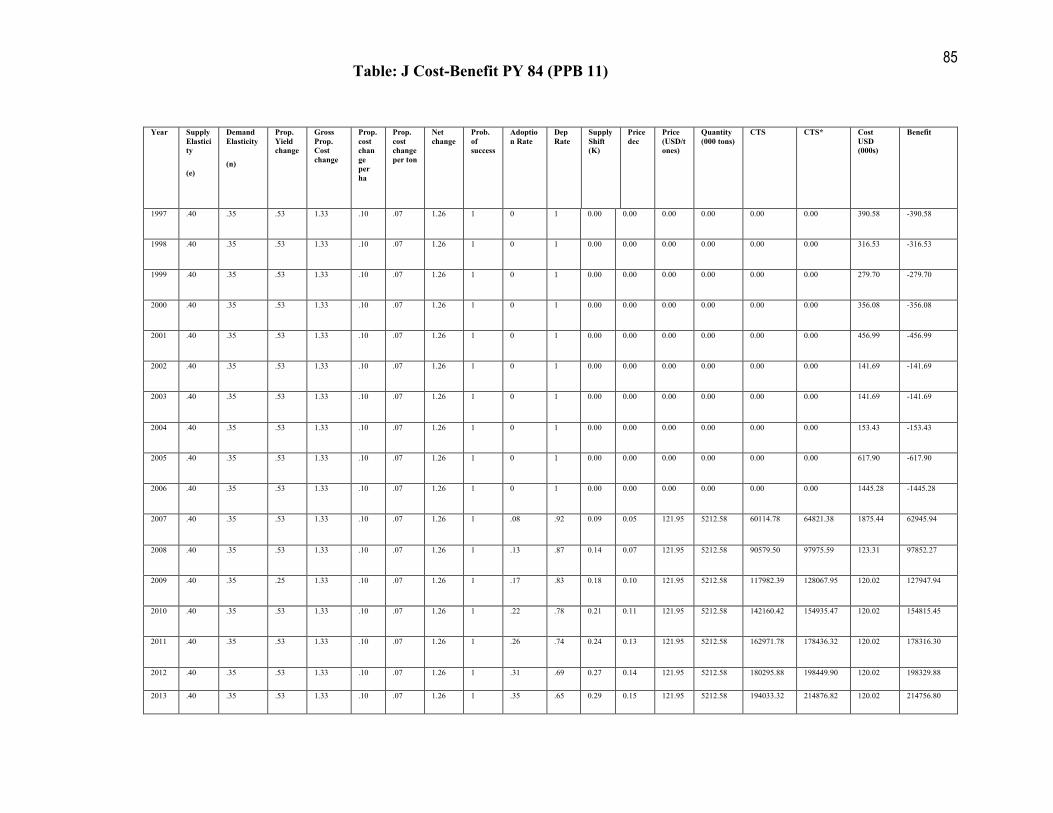
85
Year
Supply
Elastici
ty
(e)
Demand
Elasticity
(n)
Prop.
Yield
change
Gross
Prop.
Cost
change
Prop.
cost
chan
ge
per
ha
Prop.
cost
change
per ton
et
change
Prob.
of
success
Adoptio
n Rate
Dep
Rate
Supply
Shift
(K)
Price
dec
Price
(USD/t
ones)
Quantity
(000 tons)
CTS CTS* Cost
USD
(000s)
Benefit
1997 .40 .35 .53 1.33 .10 .07 1.26 1 0 1 0.00 0.00 0.00 0.00 0.00 0.00 390.58 -390.58
1998 .40 .35 .53 1.33 .10 .07 1.26 1 0 1 0.00 0.00 0.00 0.00 0.00 0.00 316.53 -316.53
1999 .40 .35 .53 1.33 .10 .07 1.26 1 0 1 0.00 0.00 0.00 0.00 0.00 0.00 279.70 -279.70
2000 .40 .35 .53 1.33 .10 .07 1.26 1 0 1 0.00 0.00 0.00 0.00 0.00 0.00 356.08 -356.08
2001 .40 .35 .53 1.33 .10 .07 1.26 1 0 1 0.00 0.00 0.00 0.00 0.00 0.00 456.99 -456.99
2002 .40 .35 .53 1.33 .10 .07 1.26 1 0 1 0.00 0.00 0.00 0.00 0.00 0.00 141.69 -141.69
2003 .40 .35 .53 1.33 .10 .07 1.26 1 0 1 0.00 0.00 0.00 0.00 0.00 0.00 141.69 -141.69
2004 .40 .35 .53 1.33 .10 .07 1.26 1 0 1 0.00 0.00 0.00 0.00 0.00 0.00 153.43 -153.43
2005 .40 .35 .53 1.33 .10 .07 1.26 1 0 1 0.00 0.00 0.00 0.00 0.00 0.00 617.90 -617.90
2006 .40 .35 .53 1.33 .10 .07 1.26 1 0 1 0.00 0.00 0.00 0.00 0.00 0.00 1445.28 -1445.28
2007 .40 .35 .53 1.33 .10 .07 1.26 1 .08 .92 0.09 0.05 121.95 5212.58 60114.78 64821.38 1875.44 62945.94
2008 .40 .35 .53 1.33 .10 .07 1.26 1 .13 .87 0.14 0.07 121.95 5212.58 90579.50 97975.59 123.31 97852.27
2009 .40 .35 .25 1.33 .10 .07 1.26 1 .17 .83 0.18 0.10 121.95 5212.58 117982.39 128067.95 120.02 127947.94
2010 .40 .35 .53 1.33 .10 .07 1.26 1 .22 .78 0.21 0.11 121.95 5212.58 142160.42 154935.47 120.02 154815.45
2011 .40 .35 .53 1.33 .10 .07 1.26 1 .26 .74 0.24 0.13 121.95 5212.58 162971.78 178436.32 120.02 178316.30
2012 .40 .35 .53 1.33 .10 .07 1.26 1 .31 .69 0.27 0.14 121.95 5212.58 180295.88 198449.90 120.02 198329.88
2013 .40 .35 .53 1.33 .10 .07 1.26 1 .35 .65 0.29 0.15 121.95 5212.58 194033.32 214876.82 120.02 214756.80
Table: J Cost-Benefit PY 84 (PPB 11)
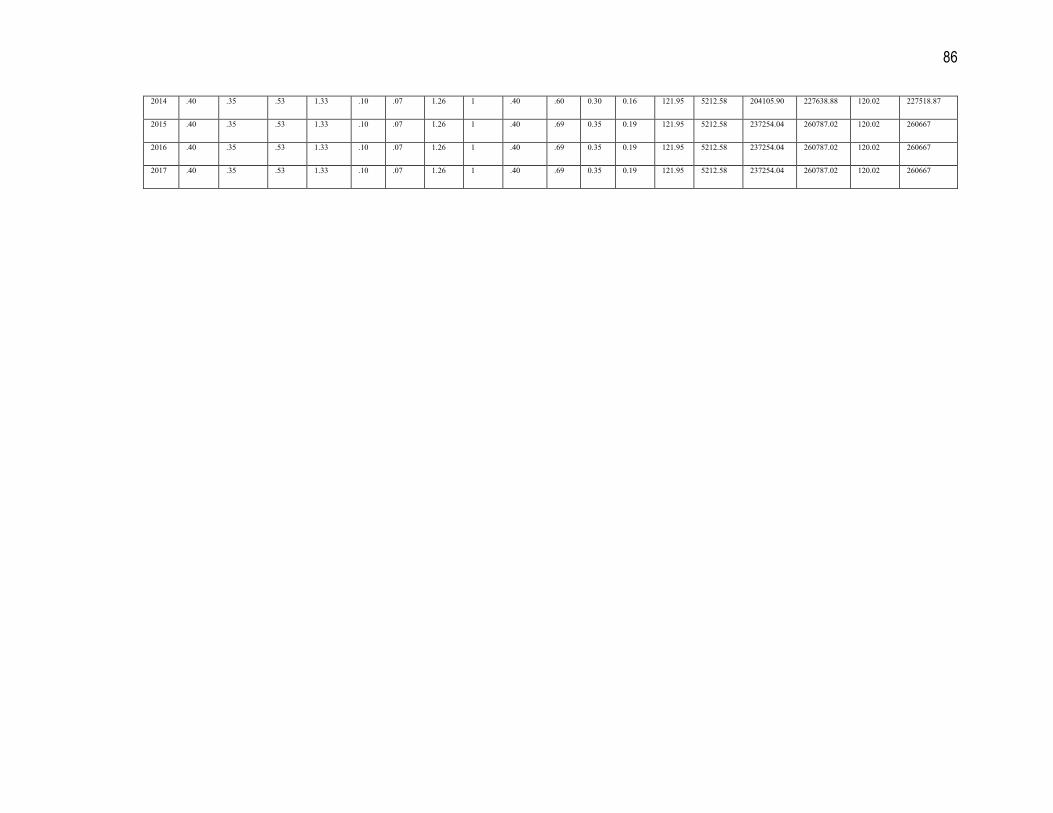
86
2014 .40 .35 .53 1.33 .10 .07 1.26 1 .40 .60 0.30 0.16 121.95 5212.58 204105.90 227638.88 120.02 227518.87
2015 .40 .35 .53 1.33 .10 .07 1.26 1 .40 .69 0.35 0.19 121.95 5212.58 237254.04 260787.02 120.02 260667
2016 .40 .35 .53 1.33 .10 .07 1.26 1 .40 .69 0.35 0.19 121.95 5212.58 237254.04 260787.02 120.02 260667
2017 .40 .35 .53 1.33 .10 .07 1.26 1 .40 .69 0.35 0.19 121.95 5212.58 237254.04 260787.02 120.02 260667
87
TABLE K: SCE ARIO A ALYSIS (UPLA D) – ASHOKA VARIETIES
Ashoka varieties 2003 2004 2005 2006 2007 2008
Particulars (@exchrate
Rs.50/US$) In Rs. US$ In Rs. US$ In Rs. US$ In Rs. US$ In Rs. US$ In Rs. US$
Annual RF investment 587,000 11,740 587,000 11,740 2,532,450 50,649 5,611,700 112,234 2,665,550 53,311 2,500,850 50,017
Total seed produced (kg) 37,200
85,200
17,260
156,000
234,410
255,000
Total area covered (Ha) 465
1,065
216
1,950
2,930
3,188
BG 102 yield 1340 kg/ha 1,340
1,340
1,340
1,340
1,340
1,340
Avg yield of DT variety (Ashoka) per ha.
1,837
1,837
1,837
1,837
1,837
1,837
Difference in yields 497
497
497
497
497
497
Total output (grains) Kg 854,205
1,956,405
396,333
3,582,150
5,420,500
5,855,438
Increase in output due to Ashoka
231,105
529,305
107,228
969,150
1,456,210
1,584,188
Average price of Ashoka varieties (Rs/Kg)
6.28
6.28
6.28
6.28
6.28
6.28
Average price of BG 102 5.62
5.62
5.62
5.62
5.62
5.62
Increased price due to improved quality
0.66
0.66
0.66
0.66
0.66
0.66
Total value realized
(as grain and seed)
Increased value due to yield increase
1,298,810 25,976 2,974,694 59,494 602,620 12,052 5,446,623 108,932 8,183,900 163,678 8,903,134 178,063
increased value due to price increase
563,775 11,276 1,291,227 25,825 261,580 5,232 2,364,219 47,284 3,577,530 71,551 3,864,589 77,292
Total increased value
due to Ashoka varieties 1,862,585 37,252 4,265,921 85,318 864,200 17,284 7,810,842 156,217 11,761,430 235,229 12,767,723 255,354
Total value of the output 5,364,407 107,288 12,286,223 245,724 2,488,970 49,779 22,495,902 449,918 34,040,740 680,815 36,772,148 735,443
88
TABLE L: RA GES OF RATES OF RETUR
89
TABLE M: RATES OF RETUR BY COMMODITY ORIE TATIO
Notes: Standard deviations are given in parentheses. Sample excludes two extreme outliers and includes only returns to research only and combined research and extension, so that the maximum sample size is 1,772. In some instances further observations were lost owing to incomplete information on the specific characteristics of interests. a includes research identified as all agriculture or crops and livestock, as well as unspecified. bIncludes estimates that did not explicitly identify the commodity focus of the research cIncludes all crops, barley, beans, cassava, sugar cane, groundnuts, maize, millet, other crops, pigeon pea or chickpea,potato, rice sesame, sorghum and wheat. dIncludes beef, swine, poultry, sheep or goats, all livestock, dairy, other livestock, pasture, dairy and beef. eIncludes other tree and fruit and nuts. fIncludes fishery and forestry. Source: Alston et al., 2000a.