Embed Size (px)
Citation preview
1
Impact of Cartosat-1 orography on weather prediction in the
high resolution NCMRWF Unified Model
Jisesh Sethunadh1, A. Jayakumar1, Saji Mohandas1, E. N. Rajagopal1 and A. Subbu
Nagulu2
1 National Centre for Medium Range Weather Forecasting (NCMRWF), Ministry of
Earth Sciences, NOIDA, INDIA
2 National Remote Sensing Centre (NRSC), Balanagar, Hyderabad, INDIA
Corresponding author: Jisesh Sethunadh
E-mail: [email protected]
Manuscript Click here to view linked References
1 2 3 4 5 6 7 8 9 10 11 12 13 14 15 16 17 18 19 20 21 22 23 24 25 26 27 28 29 30 31 32 33 34 35 36 37 38 39 40 41 42 43 44 45 46 47 48 49 50 51 52 53 54 55 56 57 58 59 60 61 62 63 64 65
2
Impact of Cartosat-1 orography on weather prediction in the
high resolution NCMRWF Unified Model
Abstract The current study reports for the first time an application of orography
generated from Cartosat-1 satellite digital elevation model (DEM) generated with a
source resolution 30 m in a convection‐permitting numerical weather prediction model.
The effects of improvements in the representation of orography have been examined in
the high resolution regional National Centre for Medium Range Weather Forecasting
Unified Model (NCUM-R) predictions for a heavy rainfall event over the city of
Chennai. A time-lagged ensemble method is employed to account for the uncertainties
associated with initial conditions, which can better forecast extreme weather events than
single forecasts. The simulations reveal that the predictions based on Cartosat-1 DEM
capture the local details of the rainfall distribution better than the NASA Shuttle Radar
Topography Mission (SRTM) DEM based predictions, and better represent the
orographic and thermal uplifting. The spatio-temporal patterns of the simulated rainfall
over Chennai are superior in Cartosat-1 DEM based simulations mainly due to the
enhanced wind convergence and moisture transport. The present study reveals the role
of mountains in the enhancement of heavy rainfall event over the coastal cities and
highlights the potential use of high resolution orography in the improvement of the
operational weather forecasting skill of NCUM-R.
Keywords. orography; modelling; Cartosat-1; extreme rainfall; clouds; weather
forecasting.
1. Introduction
Sporadic extreme rainfall events followed by devastating floods hit the South Indian
city of Chennai on 01 December 2015, causing extensive damage to property and loss
of life (Nagalakshmi and Prasanna 2016). Under synoptic conditions favourable to deep
convective events, coastal cities near mountainous regions can experience intense
rainfall events. Accurate high spatial-resolution predictions are needed for such cities
for flood risk assessments and disaster management.
1 2 3 4 5 6 7 8 9 10 11 12 13 14 15 16 17 18 19 20 21 22 23 24 25 26 27 28 29 30 31 32 33 34 35 36 37 38 39 40 41 42 43 44 45 46 47 48 49 50 51 52 53 54 55 56 57 58 59 60 61 62 63 64 65
3
An improved representation of mean orography field in the model will better
simulate the effects of orography on flow fields, which will result in an improvement in
the prediction skill of the model (Webster et al. 2003). These effects are largely due to
the changes in the representation of the height, width, and slope steepness of the
mountains, which in turn affect the updraft speed in the simulations. Chennai city is
located in the windward side of Jawadi hills of the Eastern Ghats, which modulates the
north-easterly monsoon flow under the substantial influence of orography. The effects
of mountains in the vicinity of the coastal cities play a major role in determining the
intensity and spatial pattern of heavy rainfall events (Houze 2012). Studies performed
by Chen et al. (2012) over the northeastern Taiwan have also shown the importance of
mountains in the enhancement of rainfall over the coastal regions. A detailed study
performed by Phadtare (2018) highlight the role of Eastern Ghats in the enhancement of
extreme rainfall events over Chennai city. Hence, it is not possible to fully attribute the
observed organisation and the extreme rainfall intensities over Chennai city to the
intensity of the prevailing synoptic systems only (Krishnamurti et al. 2016; Chakraborty
2016; Van Oldenborgh et al. 2016; Phadtare 2018), as it is not sufficient to fully
explain the observed heavy rainfall intensity over Chennai. The present study
investigates the effects of improvements in the orography in an operational high
resolution regional weather forecasting model, which can substantially improve the skill
of the numerical weather prediction (NWP) models. In order to accurately simulate the
spatio-temporal structure of the extreme rainfall events, the regional weather prediction
models should be able to reproduce the localised orographic effects in the simulations
through the incorporation of high resolution orography data sets.
Remote sensing techniques for gathering information about the orography have
improved rapidly over the last few years, which offer several advantages like higher
accuracy and increase in horizontal resolution. The mean elevation is the most
fundamental field to represent orography in the models, which is explicitly resolved by
the model grids. Here we have employed the National Centre for Medium Range
Weather Forecasting (NCMRWF) version of the UK Met Office Unified Model
(NCUM-R) to simulate the extreme rainfall event. The NCUM-R is a high resolution
convective-scale model and the orographic effect in a high resolution model is mainly
felt through the resolved orography only (Webster et al. 2003). Hence the main purpose
of this paper is to elucidate the impact of resolved orography in an NWP model forecast
1 2 3 4 5 6 7 8 9 10 11 12 13 14 15 16 17 18 19 20 21 22 23 24 25 26 27 28 29 30 31 32 33 34 35 36 37 38 39 40 41 42 43 44 45 46 47 48 49 50 51 52 53 54 55 56 57 58 59 60 61 62 63 64 65
4
over the coastal cities through the implementation of high resolution Cartosat-1 DEM
(Version-3R1with 30 m horizontal source resolution) in the NCUM-R and by
performing a case study of Chennai flood using the ensemble technique.
2. Data and Methodology
2.1 NCUM-R orography from Cartosat DEM
In this study, the predictions of global NCUM model (N768) at a resolution of 17 km
were downscaled to 1.5 km horizontal resolution using the high resolution regional
model (NCUM-R), setup over a domain 73.25E to 87.25E and 9.5N to 23.5N. In the
blending zone, the NCUM global model orography is slowly relaxed to the high
resolution NCUM-R grid by applying linear interpolation. GCMs using grid-boxes of
the order of tens of kilometres require orographic parameterizations to resolve the
effects of sub-grid scale orography, whereas very high resolution NCUM-R simulation
can better resolve them explicitly, which reduce the requirement of sub-grid scale
parameterisation. In the present study, the mean orography in the NCUM-R is
represented using two data sets, NASA SRTM DEM (here after SRTM DEM) and
Indian Space Research Organization (ISRO) Cartosat-1 DEM (here after Cartosat
DEM). Simulations of NCUM-R are performed using SRTM DEM (source resolution
of 90m) and high resolution Cartosat DEM (source resolution of approximately 30 m).
SRTM DEM is available from the USGS website: www.usgs.org. Cartosat DEM high
resolution data sets have been digitally generated from Cartosat satellite observations by
ISRO and these high resolution Cartosat DEM (spatial resolution of 1 arc sec
(approximately 30m)) data sets are available in 1º×1º tile size on Bhuvan-geoportal of
ISRO (http://bhuvan3.nrsc.gov.in/applications/bhuvanstore.php). From these raster tile
files, the orography for NCUM-R domain was generated by performing the following
procedures.
The Cartosat-1 data is in the World Geodetic System 1984 (WGS 84) and the geoid
undulations are computed (Rapp 1997) using Spherical Harmonic Coefficients for
Earth's Gravitational Potential data from the U.S. National Geospatial-Intelligence
Agency (NGA) web portal. These undulations are the separations between the geoid and
1 2 3 4 5 6 7 8 9 10 11 12 13 14 15 16 17 18 19 20 21 22 23 24 25 26 27 28 29 30 31 32 33 34 35 36 37 38 39 40 41 42 43 44 45 46 47 48 49 50 51 52 53 54 55 56 57 58 59 60 61 62 63 64 65
5
WGS 84 ellipsoid, whose surface is equipotential. The geoid undulations corresponding
to the latitude and longitude of each Cartosat-1 data points were used to correct the
Cartosat-1 data values. The corrected data are then bi-linearly interpolated to the model
grid. In the NCUM-R, the mean orography is improved by removing sinks and spikes in
the DEM by employing 1-2-1 filtering, which will help to avoid numerical instability
and vertically coherent localised motions due to grid-scale spurious forcing (Webster et
al. 2003; Sironi et al. 2015). The net effect of the applied smoother is a uniform weight
over a 2 x 2 grid area. The same method has been applied for both SRTM DEM and
Cartosat DEM. In addition to this, the default land-sea mask was also applied on both
data sets.
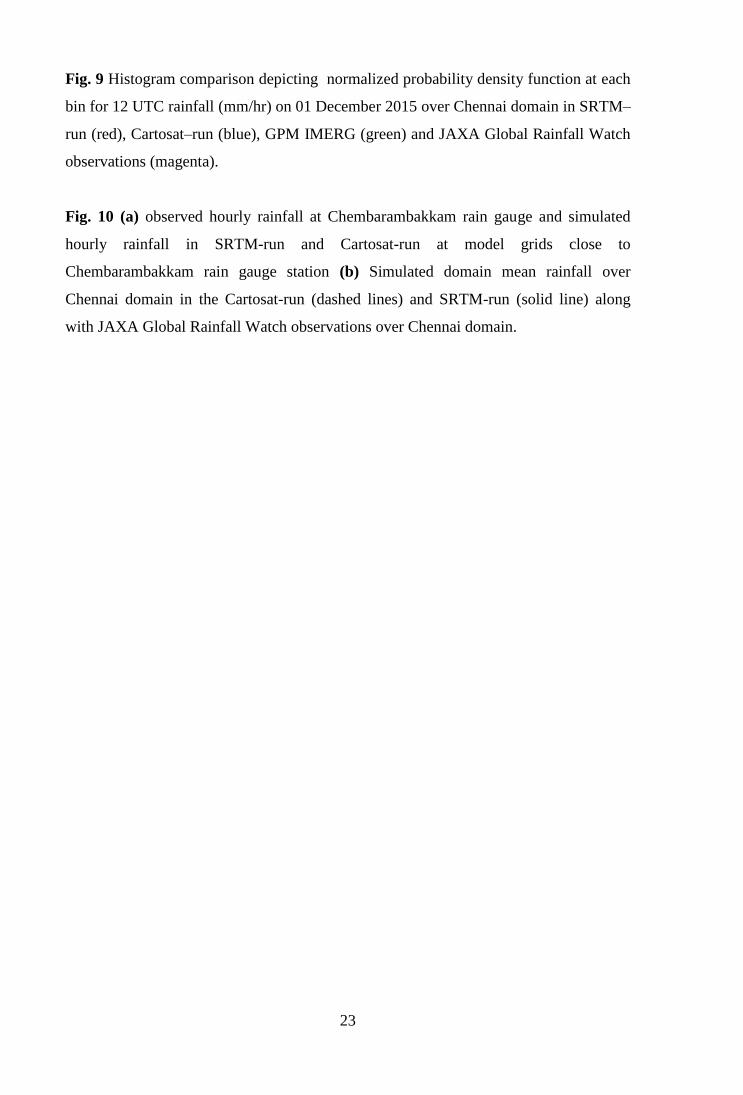
There are many advantages of using Cartosat high resolution orography data
(horizontal resolution of 30 m) over relatively lower resolution SRTM orography data
(horizontal resolution of 90 m), as the incorporation of high resolution data can better
reproduce the orographic effects in the NWP models. Cartosat DEM and deviations of
Cartosat DEM from SRTM DEM over the model domain are depicted in Fig. 1a and 1b
respectively. Few studies have inter compared both DEMs, which show that Cartosat
DEM has higher accuracies in highly rugged terrains and valleys over the Indian
domain (Yarrakula et al. 2013; Arun et al. 2016; Baral et al 2016). Fig. 1b clearly
shows large areas having significant difference in between Cartosat DEM and SRTM
DEM over Chennai city, which can have a direct impact on the precipitation simulated
over these regions. The mean errors of the DEMs generally increase with increase in the
elevation value (Yadav and Indu 2016), which also have a dependence on the land use
and land cover (LULC) characteristics of the region. The mountain peaks in the Jawadi
hills region and Western Ghats region in both DEMs in the model grids are depicted in
Fig. 2, which clearly show the finer details resolved in Cartosat DEM. Spot heights
comparison studies performed by Baral et al. (2016) have found that SRTM DEM
shows significant deviations in the rugged terrains (e.g., Kanchenjunga area (27.70° N,
88.14° E)). Similar to this, the SRTM DEM is showing significant deviations from
Cartosat DEM over the hilly regions in the model domain (see Fig. 1b). The present
study focuses on the orographic effects of the Jawadi hills (12.15o to 12.40o N and 78.2o
to 79.10oE) of the Eastern Ghats, lying south-west of Chennai city at a distance of
approximately 200 km. These hills have a length of about 60 km and width of about 25
km with an average height of 1053 m above the mean-sea-level. A special feature of
1 2 3 4 5 6 7 8 9 10 11 12 13 14 15 16 17 18 19 20 21 22 23 24 25 26 27 28 29 30 31 32 33 34 35 36 37 38 39 40 41 42 43 44 45 46 47 48 49 50 51 52 53 54 55 56 57 58 59 60 61 62 63 64 65
6
these hills is that there is a plateau at the top with an extent of 10 km. The extent of the
hills and the slope of the plateau at the top also play a role in the generation of rainfall
over the regions near to hills (Sato 2013). SRTM DEM can represent the mountains in
the model domain, but the higher resolution Cartosat DEM is better representing the
mountain peaks and slopes in the model domain.
2.2 Modelling and Verification Strategy
In the present study, we have employed the NCUM-R (Jayakumar et al. 2017) to
simulate the extreme rainfall event occurred over Chennai city. The model is based on
END Game (Even Newer Dynamics for General Atmospheric Modelling of the
Environment) dynamical core (Wood et al. 2014) with radiation scheme based on
Edwards and Slingo (1996), precipitation/microphysics based on modified Wilson and
Ballard (1999) scheme (Walters et al. 2017) and has a cloud scheme based on Wilson et
al. (2008). The convection-Permitting NCUM-R allows to explicitly resolve the mid
and deep level convection, and the shallow convection in the model is parameterized
using Gregory and Rowntree (1990) scheme. A grey-zone blended planetary boundary
layer (PBL) scheme (Boutle et al. 2014) is used in the NCUM-R and the land surface
characteristics over the model domain are generated from Indian Space Research
Organisation (ISRO) land use and land cover (LULC) data (C.K. et al. 2016). In the
present study, the improvement in the representation of the resolved mean orography in
the model is achieved by the implementation of high resolution Cartosat DEM and its
implications on the predictions of rainfall, wind, and cloud systems are discussed in the
following sections.
In order to assess ability of NCUM-R to simulate extreme rainfall events, time-
lagged ensemble technique (Hoffmann and Kalnay 1982) with different forecast lead
times is used in this study. Short-range predictions generally show a strong dependency
on initial conditions. The variations in initial conditions in the ensemble simulation
represent the uncertainty in the initial conditions and approximations in the
deterministic forecast. The time-lag ensemble technique decrease the inconsistencies
present in the simulations. Nevertheless, the selected case is a single high impact
extreme rainfall event with a prevailing cyclonic system, the time-lagged ensemble
technique will provide a better understanding of the mechanism behind the enhanced
1 2 3 4 5 6 7 8 9 10 11 12 13 14 15 16 17 18 19 20 21 22 23 24 25 26 27 28 29 30 31 32 33 34 35 36 37 38 39 40 41 42 43 44 45 46 47 48 49 50 51 52 53 54 55 56 57 58 59 60 61 62 63 64 65
7
rainfall event occurred on 01 December 2015 than performing another case study of
heavy rainfall event occurred over Chennai with a much different synoptic situation.
The use of ensemble technique would allow us to increase the robustness of the results
of this study by addressing the uncertainty in the model simulation through variations in
initial conditions. In the present study, we have used the operational configuration of
NCUM-R at NCMRWF and produced a five member ensemble of three day predictions
with the initialisation cycles separated sequentially at 6 hours (00 UTC, 06UTC, 12
UTC and 18 UTC) from November 29, 2015, 18 UTC. Here we did not consider the
ensemble members with initial conditions less than 12 hour lead time as it will not allow
the model to evolve properly and the forecasting skill will be less. This is justifiable as
earlier studies employing operational weather models with three ensemble members
were found to be showing improved forecasting skills (Vogel et al. 2014). Time-lagged
ensemble simulations using both SRTM DEM (hereafter SRTM-run) and Cartosat DEM
(hereafter Cartosat-run) orography data sets were performed and predictions from each
ensemble members were examined. We have produced ensemble mean for the
diagnosis, which will help to average out the effects of natural variability (the chaotic
nature of the atmosphere) from independent runs and will help to elucidate the impact
of orography.
Verification of NCUM-R forecasts against hourly rainfall data from Japan Aerospace
Exploration Agency (JAXA) Global Satellite Mapping of Precipitation (GSMaP)
observations (hereafter JAXA) and Integrated Multi-satellite Retrievals for GPM
(IMERG) (hereafter IMERG) were performed to assess the forecasting skill of SRTM-
run and Cartosat-run. In addition, the model forecasts were also verified using rain
gauge observations at Chembarambakkam station (13.00°N, 80.03°E) (Narasimhan et
al. 2016) located near Chennai city (hereafter rain gauge) to increase the confidence in
the results.
3. Synoptic situations
During northeast monsoon season, south-eastern coast of India experience extreme
rainfall events due to the formation of cyclonic storms over the Bay of Bengal. On
November 30, 2015, a well-marked low pressure area was observed over the Bay of
1 2 3 4 5 6 7 8 9 10 11 12 13 14 15 16 17 18 19 20 21 22 23 24 25 26 27 28 29 30 31 32 33 34 35 36 37 38 39 40 41 42 43 44 45 46 47 48 49 50 51 52 53 54 55 56 57 58 59 60 61 62 63 64 65
8
Bengal and it quickly intensified into a cyclonic storm on 01 December 2015, resulting
heavy rainfall over the south-eastern coastal regions of India. Precipitation amounts up
to 60 mm/hr were recorded at Chembarambakam rain gauge station. The ERA-Interim
reanalysis data illustrated in Fig. 3a shows the synoptic situation prevailed over Chennai
city on 01 December 2015 at 12 UTC. The Era-Interim 850 hPa geopotential height
shown in Fig. 3a clearly shows a cyclonic system associated with a low pressure system
over the Bay of Bengal indicated by lower values of geopotential. It is evident from the
figure that the prevailing winds over Chennai city were easterly, which transport
moisture to the Chennai region. The heavy rainfall occurred over Chennai was related to
this persistent cyclonic system and associated moisture transport from the Bay of
Bengal. Heavy rainfall associated with orographic enhancement of precipitation is quite
often seen over coastal regions, where mountains/hills present in the vicinity of coast
(Chen et al. 2013).
4. Results and discussions
4.1 Impacts of orography on weather prediction
The orographic effects are known to influence the magnitude and distribution of
precipitation in mountainous regions, which are highly dependent on the characteristics
of the mountain ranges. There exists a number of modelling studies about the sensitivity
of simulated orographic rainfall to the horizontal resolution of the model, and earlier
studies have already shown that the rainfall simulation over the windward side of slopes
improve with improvements in the representation and resolution of the model orography
(Dimri 2004, Smith et al. 2015). In the present study, the effects of representation of
mean orography using SRTM DEM and Cartosat DEM were studied, which show large
differences in heights and slopes of mountains in the domain of interest (Figs. 1b and 2).
The domain has a very rugged orography characterized by closely spaced mountains
with wide-range of scales and shapes, which favours the formation of different types of
clouds. The Presence of rugged orography can affect the spatio-temporal structure of the
precipitation near the hilly regions as the intensity of orographic precipitation due to
low height mountain ranges is roughly proportional to the altitude of the hills and
prevailing wind speed (Jiang, 2003). It is evident from the Fig. 3b that the difference in
Cartosat DEM and SRTM DEM has high impact on low level (50m) wind. The figure
clearly shows Jawadi hills (over the region 79.5 E and 12.75 N) as a source of wind
1 2 3 4 5 6 7 8 9 10 11 12 13 14 15 16 17 18 19 20 21 22 23 24 25 26 27 28 29 30 31 32 33 34 35 36 37 38 39 40 41 42 43 44 45 46 47 48 49 50 51 52 53 54 55 56 57 58 59 60 61 62 63 64 65
9
diversion near the Jawadi hills region. This leads to a wind convergence over Chennai
city from south westerly direction and north-easterly direction from the Bay of Bengal,
which can modify the local weather over the Chennai region. In addition, small changes
in orography can be seen all over the domain which can alter the channelling of air flow
and contributes to the improvement in simulations.
The NCUM-R model employed in this study has explicit convection, which very
well represents the transport of heat, moisture and momentum associated with the
convective motions. Figs.4a and b show the model surface temperatures at 1.5m
(shaded) and 850 mb wind (vectors) from SRTM-run and Cartosat-run respectively on
01 December 2015 at 6 UTC. The differences in between these fields from SRTM-run
and Cartosat-run from 6 UTC to 12 UTC are depicted in the rest of the panels. In
addition to the prevailing easterlies in the domain, Cartosat-run produce enhanced
moisture transport towards the region 12.5 N to 13.5 N and 79.0 E to 80.3 E (here
after Chennai domain). This causes wind convergence near the domain, and a fluid
parcel which converges horizontally becomes more cyclonic. As a result, a cyclonic
vortex starts to form north east of the Chennai domain. Figs. 4d, e and f show the
temporal evolution of the cyclonic vortex and a gradual intensification of the cyclonic
system can be clearly seen in Figs. 4d-f, which has a maximum at 9 UTC. The
formation of low pressure system during the heavy rainfall event is in synergy with the
results of the study performed by Phadtare 2018. The difference in Cartosat-run and
SRTM-run shown in Figs. 4g, h and i clearly show the weakening of the cyclonic
vorticity from 10 UTC onwards over the North-East part of the Chennai domain as the
precipitation over these regions intensify. The weakening of cyclonic vorticity is mainly
due to the decrease in wind convergence and moisture transport near the Chennai
domain. In addition to wind convergence, Figs. 4c-f reveals that Cartosat-run produced
higher surface temperatures near the Chennai city when compared to SRTM-run, and
the Figs. 4g-i show that the difference in temperature decreases as the amount of rainfall
increases over the domain (see Fig. 10). Higher surface temperatures will enhance the
convection associated with surface heating, and leads to the formation of clouds as it
causes air mass to lift, expand, and cool until it reaches saturation. The latent heat
released due to moisture condensation enables many flows to rise over mountains
(Jiang, 2003). In addition to increase in surface temperatures, reduction in temperatures
can also be seen over the region near to 78o E to 15o N, which can be attributed to the
1 2 3 4 5 6 7 8 9 10 11 12 13 14 15 16 17 18 19 20 21 22 23 24 25 26 27 28 29 30 31 32 33 34 35 36 37 38 39 40 41 42 43 44 45 46 47 48 49 50 51 52 53 54 55 56 57 58 59 60 61 62 63 64 65
10
lapse-rate associated with increase in mountain height in Cartosat DEM when
compared to SRTM DEM. Furthermore, the cloud formation due to mountain uplifts
also lead to the reduction in surface temperatures on the slopes (Kitoh 1997). Studies
have also shown that the magnitude of cyclone-induced moisture transport has strong
dependence on the meridional temperature gradient (Boutle et al. 2011), which in this
case also help to intensify the cyclonic vorticity developed near the Chennai domain.
The improvements in orographic representation over the domain have a direct effect
on the water vapour transport over the Chennai domain. The magnitude of moisture flux
transport in the simulations with SRTM DEM and Cartosat DEM are illustrated in Figs.
5a and 5b respectively, where the magnitude of Vertically Integrated Moisture
Transport (VIMT) from surface to 500 hPa is illustrated as shaded regions and
Vertically Integrated Moisture Flux (VIMF) as vectors. The vertically integrated zonal
and meridional flux components can be calculated as
Q𝑢 =1
𝑔∫ q 𝑢
p𝑠
p dp (1)
Q𝑣 =1
𝑔∫ q 𝑣
p𝑠
p dp (2)
Where g is gravity, q is specific humidity, 𝑢 is zonal component of the wind, 𝑣 is
meridional component of the wind, ps is surface pressure and p is 500 hpa pressure
here. Fig. 5c shows the difference in VIMT and VIMF in Cartosat-run and SRTM-run.
The differences in VIMT vectors overlaid in Fig. 5c depict enhanced north-easterly
moisture transport towards Chennai city in Cartosat-run compared to SRTM-run.
Studies performed by Chen et al. (2013) have shown that the amount of low-level
moisture and orographic effects are equally important for a heavy rainfall event near
mountains. It is clear that low-level convergences occurred in this case and the
predominant north-easterly winds transported moisture to Chennai region, which caused
thunderstorms and sporadic heavy rainfall events. Fig. 2 clearly illustrates that the
Cartosat DEM has more number of higher peaks than that of SRTM DEM, which
improve the simulated wind patterns and moisture transport over mountainous regions.
Changes in slopes and altitude of elevated landform in the model can cause a change in
the air flow and moisture transport. This will eventually alter the convergence of air and
frontal lifting in the model, which directly affect the rainfall prediction over the domain.
1 2 3 4 5 6 7 8 9 10 11 12 13 14 15 16 17 18 19 20 21 22 23 24 25 26 27 28 29 30 31 32 33 34 35 36 37 38 39 40 41 42 43 44 45 46 47 48 49 50 51 52 53 54 55 56 57 58 59 60 61 62 63 64 65
11
The magnitude VIMT and VIMF vectors at 9 UTC on 01 December 2015 illustrated
in Figs. 5a and b reveals that the rainfall peaks observed over Chennai city are
associated with the orographic uplifting in the vicinity of the coastal city due to the
prevailing north-easterly winds and anomalous cyclonic systems present over the Bay of
Bengal. Since the peak rainfall in the model is found to be around 12 UTC, we have
performed detailed analysis of VIMT and VIMF with a lead time of 3 hours (9UTC) as
the synoptic-scale low pressure systems that is prevalent over the Bay of Bengal can
draw moisture from regions within a distance of about 3–5 times the radius of the
system (Trenberth et al. 2003). Figs. 5a and 5b show regions with major moisture
transport and high wind speed pathways associated with the cyclonic system, which are
directed to the Chennai domain. A vector analysis indicates that the moisture transport
from the Bay of Bengal that converged over the eastern parts of the Chennai domain is
bringing moisture to the Chennai domain. It is evident from Fig. 5c that Cartosat-run
produces higher values VIMT over the coastal regions of the Chennai domain and
shows stronger flow patterns of VIMF towards the coastal regions of the Chennai
domain (the continual flow pattern of VIMF towards the Chennai domain is indicated
by a green arrow). These conditions favour the cloud formation as the type of cloud that
formed depends on the availability of moisture and stability of the atmosphere, which
would cause enhanced rainfall over the domain. Hence the observed heavy rainfall
event can be better predicted with improved orographic representation, which will result
in an enhanced moisture transport (Fig. 5c) and associated cloud formation over the
domain. A comparison of Figs. 5a and 5b indicate that the improvement in orography
have contributed to an intensification of moisture availability over the southwest Bay of
Bengal by perturbing the prevailing synoptic scale system, which also contributed to the
shifting of rainfall patterns from the ocean to land as seen in Fig. 5c.
The difference in ensemble mean of 850 hPa geopotential heights over the Chennai
domain at 6 UTC (left panel) and 12 UTC (right panel) on 01 December 2015 shown in
Figs. 6a and b display an increase in the geopotential height in Cartosat-run when
compared with SRTM-run, depicting an increase in easterly wind towards the Chennai
region with time. The increase in geopotential height in Cartosat-run (Fig. 6b) over
Chennai region shows the presence of warm air masses. The signatures of the cyclonic
vorticity formed over the North-Eastern side of the Chennai domain can be seen as a
blue colour patch in Fig. 6a at 6 UTC, which indicates a decrease in geopotential height
1 2 3 4 5 6 7 8 9 10 11 12 13 14 15 16 17 18 19 20 21 22 23 24 25 26 27 28 29 30 31 32 33 34 35 36 37 38 39 40 41 42 43 44 45 46 47 48 49 50 51 52 53 54 55 56 57 58 59 60 61 62 63 64 65
12
in Cartosat-run when compared with SRTM-run. At 12 UTC, the difference in
geopotential over the Channai domain increases, which clearly shows the presence of
warm air masses over the domain. The changes in orography have an effect on the
vertical velocity as shown in the Figs. 6c and d, which show regions with higher values
of vertical velocity indicating enhanced vertical velocity in Cartosat-run in comparison
with SRTM-run. Though the high values of vertical velocity seen in individual
ensemble members are not well reproduced in Figs. 6c and d due to the ensemble mean
calculation, the figures clearly show spatial correlation between geopotential difference
and vertical velocity difference over the Chennai domain. The difference in orography
height in Cartosat-run and SRTM-run is shown in Fig. 6e which indicate a weak
positive correlation with positive vertical velocity shown in Figs. 6c and d.
In order to find out the effect of orography on simulated clouds in NCUM-R, we
have performed a histogram comparison of clouds simulated in SRTM-run and
Cartosat-run over the Chennai domain and the results are depicted in Fig.7. The low
level cloud cover (surface-6000ft) simulated in Cartosat-run show a significant increase
in the cloud fraction in the bins between 0.5 and 0.9, which indicate the supremacy of
Cartosat-runs in simulating enhanced cloud cover over the Chennai domain. This result
is in synergy with the histogram analysis of rainfall shown in Fig. 9, as the enhanced
cloud cover under favourable conditions positively correlate with the amount of rainfall.
Earlier works have identified that the cloud cover has a positive correlation with relative
humidity and vertical velocity (Walcek, 1994). The larger values of vertical velocity
seen in Figs. 6c and d cause the air mass to be lifted and cooled to its dew point, and
eventually become saturated with cloud droplets and enhance the cloud formation. As
the air mass cools down adiabatically, the relative humidity increases and forms cloud
when it reaches 100%. A detailed analysis of relative humidity in the simulations
(figures not shown) shows an increase in relative humidity over the Chennai domain in
Cartosat-run when compared with SRTM-run. The cloud size is also linked to the
vertical velocity through entrainment process, which has a strong dependence on the
vertical velocity present below the cloud base and has a direct effect on the precipitation
patterns. These factors support enhanced cloud formation in Cartosat-run than in
SRTM-run over the Chennai domain. This enhanced cloud formation also caused an
increase the precipitation over the Chennai domain at 12 UTC. Hence Cartosat-run is
better reproducing the heavy rainfall events over the Chennai domain, favoured by the
1 2 3 4 5 6 7 8 9 10 11 12 13 14 15 16 17 18 19 20 21 22 23 24 25 26 27 28 29 30 31 32 33 34 35 36 37 38 39 40 41 42 43 44 45 46 47 48 49 50 51 52 53 54 55 56 57 58 59 60 61 62 63 64 65
13
cyclonic circulation formed over the north-eastern parts of Chennai domain due to
combined effects of improvements in the orographic uplifting and thermal forcing.
Histogram comparisons of mid-level clouds (~ 6000ft – 18000 ft) and high level
clouds (above 18000 ft) are showing a maximum in the higher cloud fraction bins. The
midlevel clouds simulated using Cartosat-run and SRTM-run during the heavy rainfall
event show significant differences in the bins ranging from 0.8 to 0.9, which indicate
that there could be significant differences in the simulated Mixed-Phase Clouds (MPCs)
causing a difference in mid-level cloud fraction. MPCs consist of supercooled liquid
water droplets and ice crystals. Earlier studies have shown that the orographic MPCs are
frequently observed in mountainous regions (Henneberg et al. 2017). MPCs are
supposed to be short lived because the difference in saturation vapour pressure of ice
crystals and water droplets causes rapid growth of ice crystals at the expense of water
droplets and enhances precipitation. Studies performed by Jayakumar et al. (2017) have
already shown that the MPCs are not well simulated in the NCUM-R. Furthermore, high
level clouds in Cartosat-run and SRTM-run are not showing any significant differences
over the Chennai domain. Hence a detailed study of NCUM-R using CFMIP
Observation Simulator Package (COSP) and its verification using satellite observations
is required to get a deep insight into the effects of orography on Mixed-phase clouds
(MPCs) in NCUM-R, which is beyond the scope of this study.
4.2 Simulation of heavy rainfall event using NCUM-R
The impact of orography on the heavy rainfall event which occurred over Chennai
city on 01 December 2015 is examined in this section. Fig. 8 shows the spatial
distribution of ensemble mean rainfall based on SRTM-run and Cartosat-run (Figs. 8c
and d) along with IMERG and JAXA observations in (Figs. 8a and b). The JAXA
observations in general have issues in measuring precipitation over the ocean (Aonashi
et al. 2009), which could be the reason for high values of precipitation seen over the
ocean in Fig. 8b when compared to Fig. 8a. Evaluation studies performed by Ning et al.
2017 have shown that JAXA observations have a tendency to overestimate light rainfall,
whilst IMERG observations have a tendency to underestimate 8 to 64 mm/day rainfall.
A comparison of simulated rainfall in Cartosat-run and SRTM-run shows that the
Cartosat-run is in better agreement with the rainfall observations over the coastal
regions of Chennai city, especially over the region near to 14.0 N and 80.0 E, where
1 2 3 4 5 6 7 8 9 10 11 12 13 14 15 16 17 18 19 20 21 22 23 24 25 26 27 28 29 30 31 32 33 34 35 36 37 38 39 40 41 42 43 44 45 46 47 48 49 50 51 52 53 54 55 56 57 58 59 60 61 62 63 64 65
14
the SRTM-run shows very little rainfall when compared with the observations. This is
in agreement with the increase in mountain heights seen in Cartosat DEM over the
northern and western sides of the Chennai domain (see Fig. 6e). Earlier studies have
shown that an enhancement in rainfall can occur over hundreds of km away from
mountains when orographically blocked flow occur (Houze 2012, Phadtare 2018). The
SRTM-run shows a shift in moderate to heavy rainfall patterns over the ocean, which is
very much improved in Cartosat-run. The heavy rainfall patterns simulated in NCUM-R
over Chennai city in Cartosat-run is in better match with observations, which is in good
agreement with high amount of clouds seen over Chennai city in the Cartosat-run (Fig.
7). Moreover, the bias in rainfall over the ocean is less in Cartosat-run when compared
with SRTM-run (e.g. region near 14.5 N and 82.5 E). Spatial Correlations (SC)
between the simulations with GPM IMERG (SC IMERG) and JAXA (SC JAXA) over
the Chennai domain (black box) are also tabulated in respective figures (see Fig. 8.c and
d). As the observed maximum of accumulated rainfall over land was found to be near
Chennai city, we have computed spatial correlation over the Chennai domain. The SC
of SRTM-run and Cartosat-run against IMERG over the Chennai domain at 12 UTC is
found to be 0.47 and 0.55 respectively. Similarly, against JAXA, SC gives about 0.50
and 0.63. Verification against both observational data sets shows the supremacy of
Cartosat-run over SRTM-run. Further analysis shows that the localised features of
rainfall over the Chennai domain are more evident in Cartosat-run, which is largely
contributed by the shift in rainfall from the ocean to the land over the eastern coast of
Chennai city. Histograms of the simulated rainfall data provide considerably more
information about the distribution of the rainfall amount (Fig. 9). The histogram
comparison of Catosat-run and SRTM-run with IMERG and JAXA observations over
the domain 12.0 N to 15.0 N and 79.0 E to 82.0 E shows a marginal improvement in
rainfall simulation in Cartosat-run below 11 mm/hr and a significant improvement in
rainfall prediction above 11 mm/hr bins. The number of occurrences of moderate-heavy
rainfall (11-16 mm/hr) amount over the domain is found to be more in Cartosat-run
when compared with SRTM-run. This clearly indicates that there is an enhancement of
rainfall over the Chennai domain due to the implementation of high resolution Cartosat
DEM in NCUM-R. Conversely, 5-6 mm/hr rainfall comparison shows that it is slightly
over estimated in Cartosat-run. The light rainfall (4-5 mm/hr) occurrences are also
better simulated in Cartosat-run than SRTM-run.
1 2 3 4 5 6 7 8 9 10 11 12 13 14 15 16 17 18 19 20 21 22 23 24 25 26 27 28 29 30 31 32 33 34 35 36 37 38 39 40 41 42 43 44 45 46 47 48 49 50 51 52 53 54 55 56 57 58 59 60 61 62 63 64 65
15
Time series of the hourly accumulated rainfall amount from ensemble mean of
simulations using SRTM DEM and Cartosat DEM are compared with available rain
gauge observations from Chembarambakkam station, which is depicted in Fig. 10a. The
amount of rainfall during the peak spell period (9 UTC to 15 UTC) from SRTM-run and
Cartosat-run is found to be 12.42 mm/hr and 17.28 mm/hr respectively, whereas the
observed amount is 29.85 mm/hr. Rainfall prediction at this gauge location is found to
be improved by ~4.79 mm/hr and the correlation between two time series (C), is
improved by 0.3452 in Cartosat-run when compared to SRTM-run. Hence it can be
concluded from Fig. 10a that there is a significant improvement in the phase and
magnitude of the extreme rainfall prediction with the implementation of Cartosat DEM
in NCUM-R. In addition to the rain gauge observation, we compared the domain
averaged rainfall over Chennai with the satellite observation also (Fig. 10b). It can be
seen from Fig. 10b that the Intensity of ensemble mean rainfall forecast is better
simulated in Cartosat-run when compared to SRTM-run during the peak hours and the
figure also illustrates significant improvements in the phase of the simulated rainfall in
Cartosat-run when compared with SRTM-run on 01 December 2015.
5. Conclusions
Present study reports, for the first time, the use of Cartosat-1 satellite DEM for
generating orography for NCMRWF Regional Model (NCUM-R), and the effects of
orography on rainfall, wind, and cloud systems are studied. The study is focussed on the
impact of mean orography generated from high resolution Cartosat-1 DEM and SRTM
DEM on the NCUM-R simulation of an extreme rainfall event occurred over Chennai
city under prevailing cyclonic condition during the north-east monsoon period. Time-
lagged ensemble method with varying initialisation cycles were used to average out the
effects of natural variability and to elucidate the impact of orography on the rainfall
prediction. Spatial and temporal correlation analysis against rain gauge and satellite
observations showed that there is significant improvement in the phase and magnitude
of heavy rainfall episodes in Cartosat-run and it captures the local details of the rainfall
distribution over the Chennai domain better than SRTM-run. The simulations revealed
that the orographic effects of Jawadi hills have significantly contributed to the
1 2 3 4 5 6 7 8 9 10 11 12 13 14 15 16 17 18 19 20 21 22 23 24 25 26 27 28 29 30 31 32 33 34 35 36 37 38 39 40 41 42 43 44 45 46 47 48 49 50 51 52 53 54 55 56 57 58 59 60 61 62 63 64 65
16
localisation and enhancement of rainfall. A histogram analysis of simulated and
observed rainfall amount showed that the number of occurrences of moderate to heavy
rainfall is better predicted in Cartosat-run. Enhanced moisture transport with changes in
the uplift upstream have resulted in an enhanced rainfall on the windward side of the
Jawadi hills, and lead to a reduction in the moisture availability on the leeward side. It
was also found that a positive moisture transport in Cartosat-run triggered a localised
meso-scale system by creating surface instability in the boundary layer, which in turn
caused an enhancement in precipitation.
The study also revealed that the extreme rainfall event was not necessarily a
manifestation of the synoptic system only, but the perturbation of synoptic system by
orography through wind diversion and uplifting, which brought more warm moist air to
the land and contributed to the enhancement of rainfall. As a result of this synoptic scale
perturbation, the rainfall over the ocean was shifted slightly into the land. Results show
that a change in wind caused by change in mountain dimension can perturb the large
scale synoptic systems, which can in turn change the rainfall patterns associated with
the cyclonic system, and ultimately lead to a reduction in land-ocean rainfall bias in the
model. At larger scales, a change in mean orographic slope can cause a change in wind
direction to conserve potential vorticity of the flow (Lott 1999). The predominant large
scale low level winds were north-easterly and this indicates that the moisture transport
from the Bay of Bengal to the land will change with change in orographic slope and
result in an increased orographic rainfall under right conditions. The model has a terrain
following geometric height based vertical co-ordinate system, hence the pressure
gradient will change with the surface slope and results in modified flow fields. These
effects also play a major role in rainfall forecast, which were improved in the model by
the use of high-resolution Cartosat DEM. Hence, the prediction of heavy rainfall events
in the vicinity of mountains using NCUM-R demands high accuracy in mountain
heights and slopes in the orography. As a result of the incorporation of high resolution
Cartosat-1 DEM in the NCUM-R, the simulations show more clouds over the Chennai
region than SRTM-run. This is mainly due to the enhanced wind convergence and
moisture transport over the Chennai domain due to the improvements in orographic
uplift and thermal uplift. These improvements lead to a better prediction of rainfall over
the Chennai domain. This is evident from the correlation calculations with satellite
1 2 3 4 5 6 7 8 9 10 11 12 13 14 15 16 17 18 19 20 21 22 23 24 25 26 27 28 29 30 31 32 33 34 35 36 37 38 39 40 41 42 43 44 45 46 47 48 49 50 51 52 53 54 55 56 57 58 59 60 61 62 63 64 65
17
observations, which show higher spatial correlation in Cartosat-run when compared
with SRTM-run. Furthermore, rainfall forecast verification using Chembarambakkam
rain gauge station shows an improvement of ~ 4.79 mm/hr and a histogram analysis
reveals that the number of occurrences of moderate-heavy rainfall over the Chennai
domain has improved in Cartosat-run, which is in synergy with histogram analysis of
simulated cloud fractions. Therefore, we may hypothesize that the amount, location and
phase of the rainfall patterns over the model domain are highly improved by the
improvements in the mountain dimensions and slope, which in turn resulted in an
improvement in the prediction skill of NCUM-R. This improvement in prediction skill
of NCUM-R will help to improve the disaster management and flood area assessments
in India.
The skill of the currently employed ensemble prediction method can be improved by
the use of convective scale ensemble prediction system, which accounts for the model
errors such as the errors introduced by initial condition (IC), lateral boundary condition
(LBC), model physics etc. However, such an ensemble system at high resolution
regional scale was not available at NCMRWF during the study period. It is envisaged
that future work will employ the convective scale ensemble prediction systems, include
sub-grid scale orographic effects using Cartosat-1 DEM and evaluate mixed phase
clouds simulated using COSP with satellite observations.
Acknowledgments
The authors gratefully acknowledge Dr. Stuart Webster, Met Office, UK for his
valuable comments and discussions. We acknowledge the data source CartoDEM
Version-3 R1, National Remote Sensing Centre, ISRO, Government of India,
Hyderabad, India. Acknowledge the NASA for the SRTM and GPM IMERG products
and the JAXA GSMaP Rainfall Product.
1 2 3 4 5 6 7 8 9 10 11 12 13 14 15 16 17 18 19 20 21 22 23 24 25 26 27 28 29 30 31 32 33 34 35 36 37 38 39 40 41 42 43 44 45 46 47 48 49 50 51 52 53 54 55 56 57 58 59 60 61 62 63 64 65
18
References
Aonashi K, Awaka J, Hirose M, Kozu T, Kubota T, Liu G, Shige S, Kida S, Seto S,
Takahashi N, and Takayabu Y N 2009 GSMaP passive microwave precipitation
retrieval algorithm: Algorithm description and validation; J. Meteorol. Soc. Jpn. Ser.
II 87A 119–136, doi:https://doi.org/10.2151/jmsj.87A.119.
Arun Patel, Katiyar S K and Prasad V 2016 Performances evaluation of different open
source DEM using Differential Global Positioning System (DGPS); The Egypt. J.
Remot. Sens. Space Sci. 19(1) 7-16, doi: http://dx.doi.org/10.1016/j.ejrs.2015.12.004.
Baral S S, Das J, Saraf A K, Borgohain S and Singh G 2016 Comparison of Cartosat,
ASTER and SRTM DEMs of Different Terrains; Asian J. Geoinformatics 16(1) 1-7.
Boutle I A, Belcher S E and Plant R S 2011 Moisture transport in midlatitude cyclones;
Q. J. Roy. Meteor. Soc. 137 360-373, doi:10.1002/qj.783.
Boutle I A, Eyre J E J and Lock A P 2014 Seamless Stratocumulus Simulation across
the Turbulent Grey Zone; Mon. Weather Rev. 142 1655-1668.
Chakraborty A 2016 A synoptic-scale perspective of heavy rainfall over Chennai in
November 2015; Curr. Sci. 111(1) 201-207, doi:10.18520/cs/v111/i1/201-207.
Chen C-S, Lin Y-L, Zeng H-T, Chen C-Y and Liu C-L 2013 Orographic effects on
heavy rainfall events over northeastern Taiwan during the northeasterly monsoon
season; Atmos. Res. 122 310-335, doi:
https://doi.org/10.1016/j.atmosres.2012.10.008.
C.K. U., Gharai B. , Mohandas S. , Mamgain A. , Rajagopal E. N., Iyengar G. R. and
Rao P. V. 2016 Recent changes on land use/land cover over Indian region and its
impact on the weather prediction using Unified model; Atmos. Sci. Lett. 17 294-300,
doi:10.1002/asl.658.
Dimri A P 2004 Impact of horizontal model resolution and orography on the simulation
of a western disturbance and its associated precipitation; Meteorol. Appl. 11 115-127,
doi:10.1017/S1350482704001227.
Edwards J M and Slingo A 1996 Studies with a Flexible New Radiation Code. I:
Choosing a Configuration for a Large-Scale Model; Q. J. Roy. Meteor. Soc. 122 689-
719.
Gregory D. and Rowntree P.R. 1990 A Mass Flux Convection Scheme with
Representation of Cloud Ensemble Characteristics and Stability-Dependent Closure;
1 2 3 4 5 6 7 8 9 10 11 12 13 14 15 16 17 18 19 20 21 22 23 24 25 26 27 28 29 30 31 32 33 34 35 36 37 38 39 40 41 42 43 44 45 46 47 48 49 50 51 52 53 54 55 56 57 58 59 60 61 62 63 64 65
19
Mon. Wea. Rev. 118 1483-1506, https://doi.org/10.1175/1520-
0493(1990)118<1483:AMFCSW>2.0.CO;2
Henneberg O, Henneberger J and Lohmann U 2017 Formation and Development of
Orographic Mixed-Phase Clouds; J. Atmos. Sci. 74(11) 3703-3724.
Hoffman R N and Kalnay E 1983 Lagged average forecasting, an alternative to Monte
Carlo forecasting; Tellus A. 35A 100-118, doi:10.1111/j.1600-0870.1983.tb00189.x.
Houze R A Jr. 2012 Orographic effects on precipitating clouds; Rev. Geophys. 50
RG1001, doi:10.1029/2011RG000365.
Jayakumar A, Sethunadh J, Rakhi R, Arulalan T, Mohandas S, Iyengar G R and
Rajagopal E N 2017 Behavior of predicted convective clouds and precipitation in the
high-resolution Unified Model over the Indian summer monsoon region; Earth and
Space Sci. 4 303-313, doi:10.1002/2016EA000242.
Jiang Q 2003 Moist dynamics and orographic precipitation; Tellus A. 55 301-316,
doi:10.1034/j.1600-0870.2003.00025.x
Kirshbaum D J and Smith R B 2008 Temperature and moist-stability effects on
midlatitude orographic precipitation; Q. J. Roy. Meteor. Soc. 134 1183-1199,
doi:10.1002/qj.274.
Kitoh A 1997 Mountain uplift and surface temperature changes; Geophys. Res. Lett.
24(2) 185-188, doi: 10.1029/96GL03953.
Krishnamurti T N, Dubey S, Kumar V, Deepa R and Bhardwaj A 2017 Scale Interaction
during an extreme rain event over South-East India; Q. J. Roy. Meteor. Soc. 143
1442-1458, doi:10.1002/qj.3016
Lott F 1999 Alleviation of Stationary Biases in a GCM through a Mountain Drag
Parameterization Scheme and a Simple Representation of Mountain Lift Forces;
Mon. Weather Rev. 127 788-801, doi: 10.1175/1520-
0493(1999)127<0788:AOSBIA>2.0.CO;2.
Nagalakshmi R and Prasanna K 2016 2015 FLOOD ASSESSMENT IN
KANCHIPURAM DISTRICT OF TAMILNADU USING GIS; Rsayan journal of
chemistry 9 798-805.
Narasimhan B, Murty Bhallamudi S, Mondal A, Ghosh S and Mujumdar P 2016
Chennai Floods 2015 - A Rapid Assessment. Interdisciplinary Centre for Water
Research, Indian Institute of Science, Bangalore, 49 pp.
1 2 3 4 5 6 7 8 9 10 11 12 13 14 15 16 17 18 19 20 21 22 23 24 25 26 27 28 29 30 31 32 33 34 35 36 37 38 39 40 41 42 43 44 45 46 47 48 49 50 51 52 53 54 55 56 57 58 59 60 61 62 63 64 65
20
Ning S, Song F, Udmale P, Jin J, Thapa B R and Ishidaira H 2017 Error Analysis and
Evaluation of the Latest GSMap and IMERG Precipitation Products over Eastern
China; Adv. Meteorol. 2017 (11) 1-16, doi:10.1155/2017/1803492
Phadtare J 2018 Role of Eastern Ghats Orography and Cold Pool in an Extreme Rainfall
Event over Chennai on 1 December 2015; Mon. Weather Rev. 146 943-965, doi:
https://doi.org/10.1175/MWR-D-16-0473.1
Rapp R 1997 Use of potential coefficient models for geoid undulation determinations
using a spherical harmonic representation of the height anomaly/geoid undulation
difference; J. Geodesy 71 282-289, doi: https://doi.org/ 10.1007/s001900050096.
Sato T 2013 Mechanism of Orographic Precipitation around the Meghalaya Plateau
Associated with Intraseasonal Oscillation and the Diurnal Cycle; Mon. Wea. Rev.
141 2451–2466, https://doi.org/10.1175/MWR-D-12-00321.1
Sironi A, Tekin B, Rigamonti R, Lepetit V and Fua P 2015 Learning Separable Filters;
IEEE Pattern Anal. 37(1) 94-106, doi: 10.1109/TPAMI.2014.2343229.
Smith S A, Vosper S B and Field P R 2015 Sensitivity of orographic precipitation
enhancement to horizontal resolution in the operational Met Office Weather
forecasts; Met.Apps. 22 14-24, doi:10.1002/met.1352.
Trenberth KE, Dai A, Rasmussen RM, and Parsons DB 2003 The Changing Character
of Precipitation; Bull. Amer. Meteor. Soc. 84 1205-1218,
https://doi.org/10.1175/BAMS-84-9-1205
Van Oldenborgh G, Otto F L, Haustein K and Achuta Rao K 2016 The Heavy
Precipitation Event of December 2015 in Chennai, India; B. Am. Meteorol. Soc.
97(12) S87-S91, doi: 10.1175/BAMS-D-16-0129.1.
Vogel H, Förstner J, Vogel B, Hanisch T, Mühr B, Schättler U and Schad T 2014 Time-
lagged ensemble simulations of the dispersion of the Eyjafjallajökull plume over
Europe with COSMO-ART; Atmos. Chem. Phys., 14 7837-7845.
Walcek C J 1994 Cloud Cover and Its Relationship to Relative Humidity during a
Springtime Midlatitude Cyclone; Mon. Weather Rev. 122(6) 1021-1035, doi:
10.1175/1520-0493(1994)122<1021:CCAIRT>2.0.CO;2
Walters D, Boutle I and Brooks M et al. 2017 The Met Office Unified Model Global
Atmosphere 6.0/6.1 and JULES Global Land 6.0/6.1 configurations; Geo.Sci. Model
Dev. 10(4) 1487-1520, doi:10.5194/gmd-10-1487-2017.
1 2 3 4 5 6 7 8 9 10 11 12 13 14 15 16 17 18 19 20 21 22 23 24 25 26 27 28 29 30 31 32 33 34 35 36 37 38 39 40 41 42 43 44 45 46 47 48 49 50 51 52 53 54 55 56 57 58 59 60 61 62 63 64 65
21
Webster S, Brown A R, Cameron D R and Jones C P 2003 Improvements to the
representation of orography in the Met Office Unified Model; Q. J. Roy. Meteor.
Soc. 129 1989-2010, doi:10.1256/qj.02.133.
Wilson D R and Ballard S P 1999 Amicrophysically based precipitation scheme for the
UK meteorological office unified model; Q. J. Roy. Meteor. Soc. 125 1607-1636,
doi:10.1002/qj.49712555707.
Wilson D R, Bushell A C, Kerr‐Munslow A M, Price J D and Morcrette C J 2008 PC2:
A prognostic cloud fraction and condensation scheme. I: Scheme description; Q. J.
Roy. Meteor. Soc. 134 2093-2107, doi:10.1002/qj.333.
Wood N, Staniforth A, White A, Allen T, Diamantakis M, Gross M, Melvin T, Smith C,
Vosper S,Zerroukat M and Thuburn J 2014 An inherently mass-conserving semi-
implicit semi-Lagrangian discretization of the deep-atmosphere global non-
hydrostatic equations; Q. J. Roy. Meteor. Soc. 140 1505-1520, doi:10.1002/qj.2235.
Yadav S and Indu J 2016 Estimation of vertical accuracy of Digital Elevation Models
over complex terrains of Indian subcontinent; Int. Geosci. Remote Se. 6036-6039,
doi:10.1109/IGARSS.2016.7730577.
Yarrakula K, Deb D and Samanta B 2013 Comparative evaluation of Cartosat-1 and
SRTM imageries for digital elevation modelling; Geo-spatial Information Sci. 16(2)
75-82, doi: 10.1080/10095020.2012.747645.
Fig. 1 The orography representation over the model domain (a) Cartosat-1 DEM data
and (b) the difference in between Cartosat-1DEM and SRTM DEM. The colour scale
shows terrain elevations in meters.
Fig. 2 Depicts the NCUM-R model grid orography of Jawadi hills using (a) SRTM
DEM and (b) Cartosat-1 DEM, and Western Ghats using (c) SRTM DEM and (d)
Cartosat-1 DEM.
Fig. 3 (a) ERA-Interim reanalysis of 850 hpa winds (vector, m/s) overlaid by
geopotential heights (shaded, gpm) for 01 December 2015 at 12:00 UTC. The Chennai
domain (black box), location of Jawadi hills (red box) and Chennai city location
(marked 'X' in magenta) are also given (b) The difference in magnitude of orography
1 2 3 4 5 6 7 8 9 10 11 12 13 14 15 16 17 18 19 20 21 22 23 24 25 26 27 28 29 30 31 32 33 34 35 36 37 38 39 40 41 42 43 44 45 46 47 48 49 50 51 52 53 54 55 56 57 58 59 60 61 62 63 64 65
22
generated in the NCUM-R using Cartosat-1 DEM and SRTM DEM (only positive
values are shown here) (shaded, m) and the difference in ensemble mean of 50m wind
(streamlines) simulated in the NCUM-R over Chennai city (Chennai city location is
marked as 'X').
Fig. 4 Surface temperatures (shaded, K) and 850mb winds (vectors, m/s) at 6 UTC on
01 December 2015 in SRTM-run and Cartosat-run are shown in (a) and (b)
respectively. The differences in Cartosat-run and SRTM-run at 6 UTC, 7 UTC, 8 UTC,
9 UTC, 10 UTC, 11 UTC and 12 UTC are shown in (c), (d), (e), (f), (g), (h) and (i)
respectively.
Fig. 5 Magnitude of Vertically Integrated Moisture Transport (VIMT) from surface to
500 hPa and moisture transport (shaded, kg m-1 s-1) (values above 700 kg m-1 s-1 are
shown here) and Vertically Integrated Moisture Flux (VIMF) vectors (kg m-1 s-1) in the
time-lagged ensemble forecast at 9 UTC on 01 December 2015 in (a) SRTM-run, (b)
Cartosat-run and (c) the difference in magnitude of VIMT (shaded) and VIMT vectors
in Cartosat–run and SRTM-run.
Fig. 6 Difference in ensemble mean of simulations at 6 UTC (left panel) and 12 UTC
(right panel) on 01 December 2015 in CARTOSAT-run and SRTM-run at 850 hpa.
Panel (a) and (b) show geopotential height (gpm), and panel (c) and (d) show vertical
velocity (m/s) (only positive values of vertical velocity are shown here for clarity).
Panel (e) shows the difference in Cartosat-1 DEM and SRTM DEM.
Fig. 7 Histogram comparison shows normalized probability density function of low
level, mid level and high level cloud fraction over Chennai domain at 12 UTC on 01
December 2015 in SRTM-run and Cartosat-run.
Fig. 8 Observed hourly rainfall valid at 12 UTC on 01 December 2015 from (a) IMERG
and (b) JAXA, and time-lagged ensemble predictions in (c) SRTM-run and (d)
Cartosat-run data. Spatial correlation between the simulations with GPM IMERG (SC
IMERG) and JAXA (SC JAXA) over the Chennai domain (black box) are also given.
1 2 3 4 5 6 7 8 9 10 11 12 13 14 15 16 17 18 19 20 21 22 23 24 25 26 27 28 29 30 31 32 33 34 35 36 37 38 39 40 41 42 43 44 45 46 47 48 49 50 51 52 53 54 55 56 57 58 59 60 61 62 63 64 65
23
Fig. 9 Histogram comparison depicting normalized probability density function at each
bin for 12 UTC rainfall (mm/hr) on 01 December 2015 over Chennai domain in SRTM–
run (red), Cartosat–run (blue), GPM IMERG (green) and JAXA Global Rainfall Watch
observations (magenta).
Fig. 10 (a) observed hourly rainfall at Chembarambakkam rain gauge and simulated
hourly rainfall in SRTM-run and Cartosat-run at model grids close to
Chembarambakkam rain gauge station (b) Simulated domain mean rainfall over
Chennai domain in the Cartosat-run (dashed lines) and SRTM-run (solid line) along
with JAXA Global Rainfall Watch observations over Chennai domain.
1 2 3 4 5 6 7 8 9 10 11 12 13 14 15 16 17 18 19 20 21 22 23 24 25 26 27 28 29 30 31 32 33 34 35 36 37 38 39 40 41 42 43 44 45 46 47 48 49 50 51 52 53 54 55 56 57 58 59 60 61 62 63 64 65
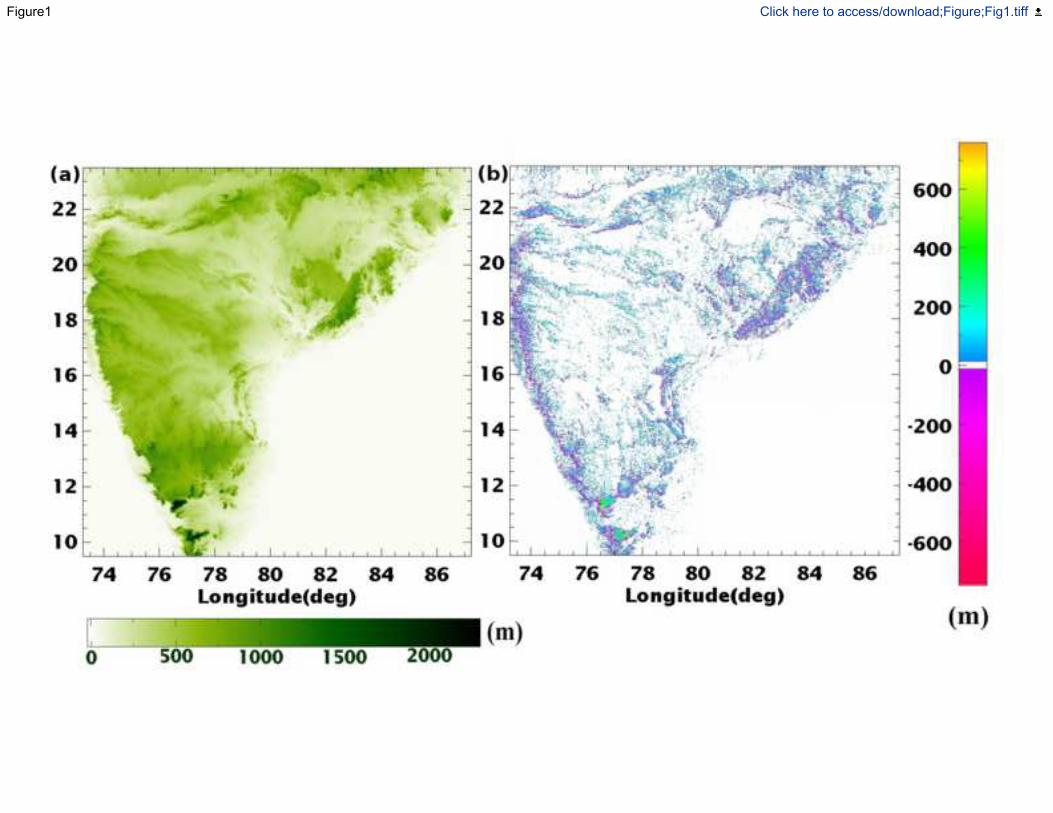
Figure1 Click here to access/download;Figure;Fig1.tiff
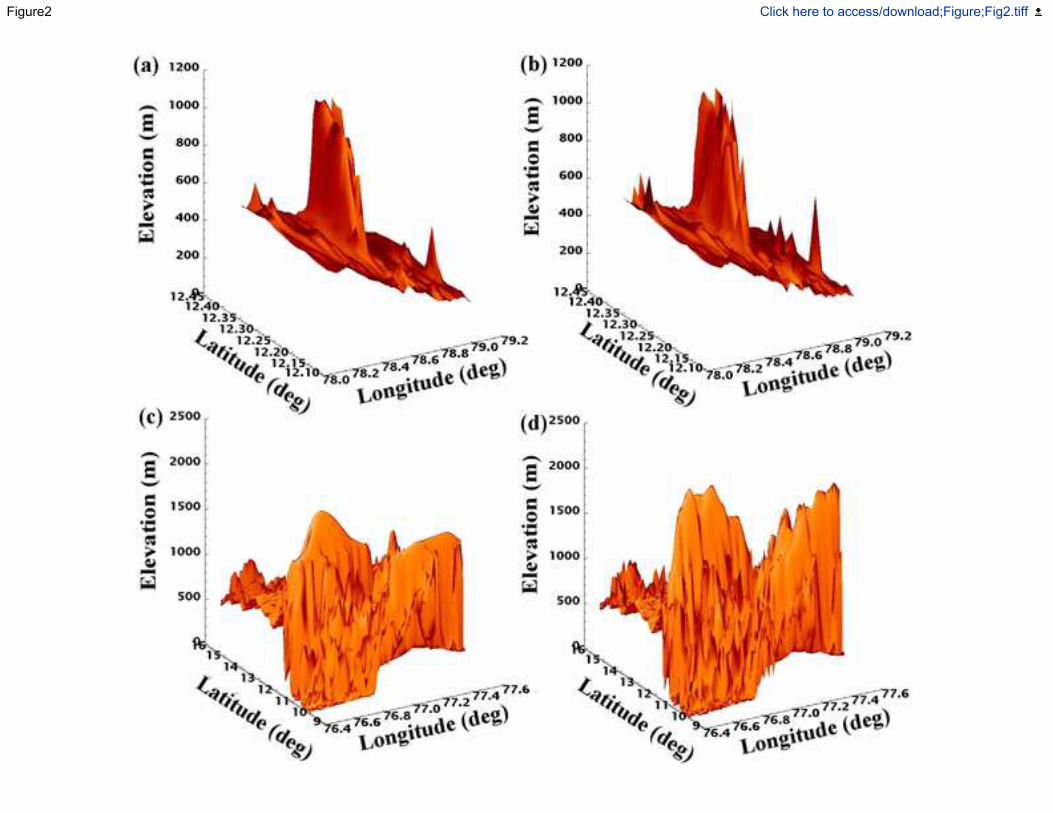
Figure2 Click here to access/download;Figure;Fig2.tiff
Figure3 Click here to access/download;Figure;Fig3.tiff
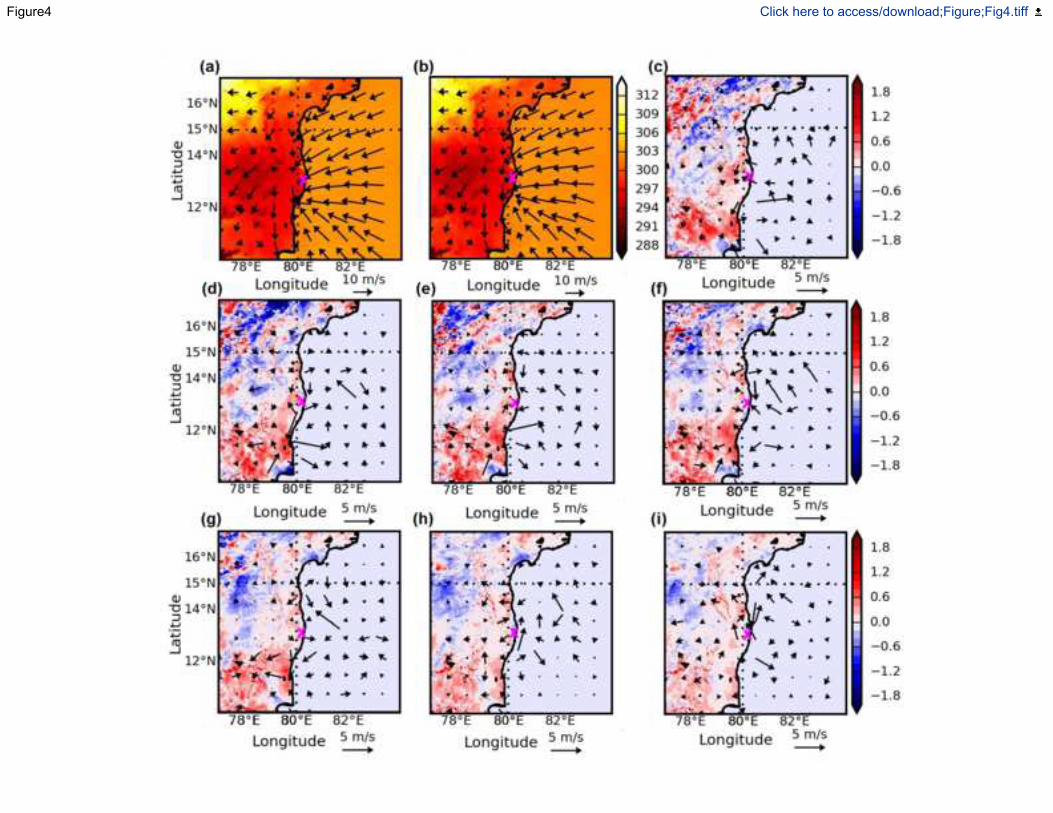
Figure4 Click here to access/download;Figure;Fig4.tiff
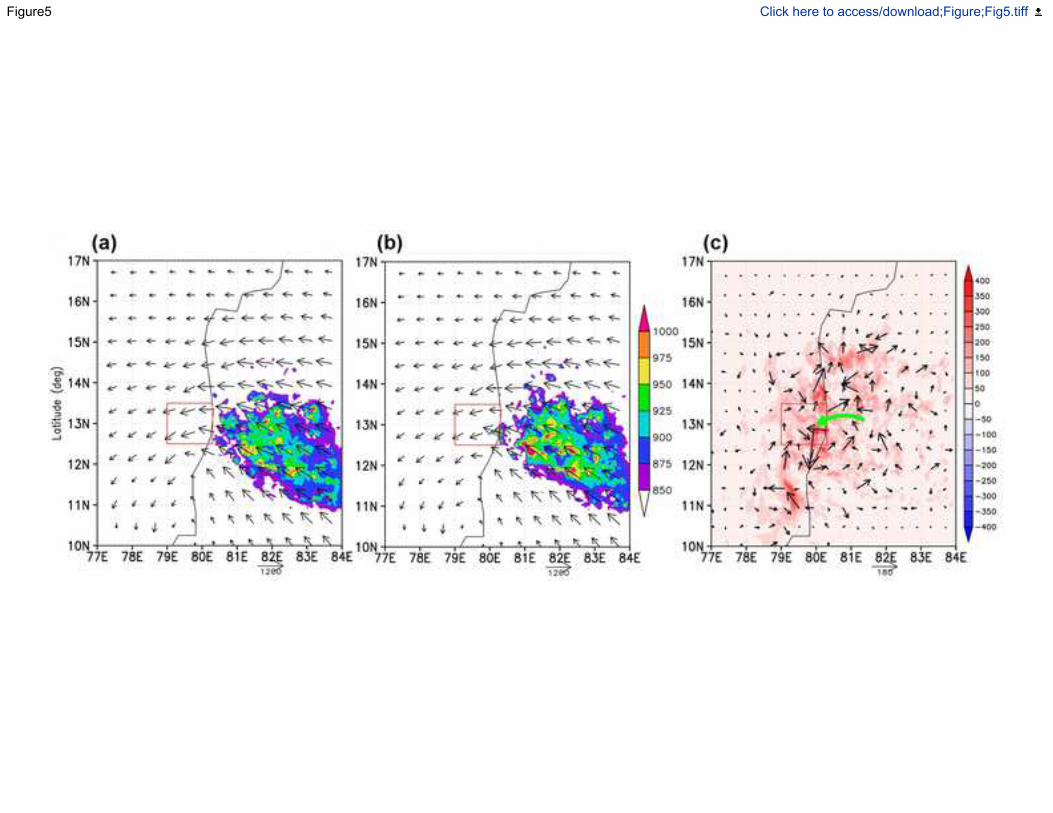
Figure5 Click here to access/download;Figure;Fig5.tiff
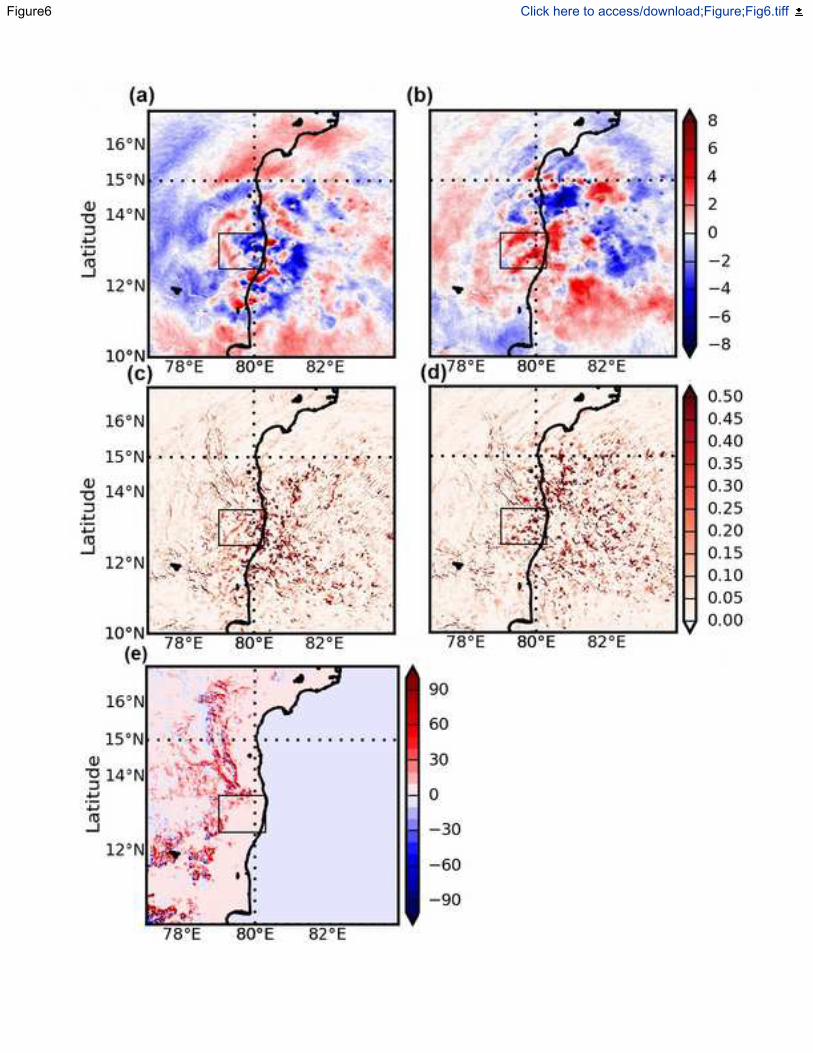
Figure6 Click here to access/download;Figure;Fig6.tiff

Figure7 Click here to access/download;Figure;Fig7.tiff
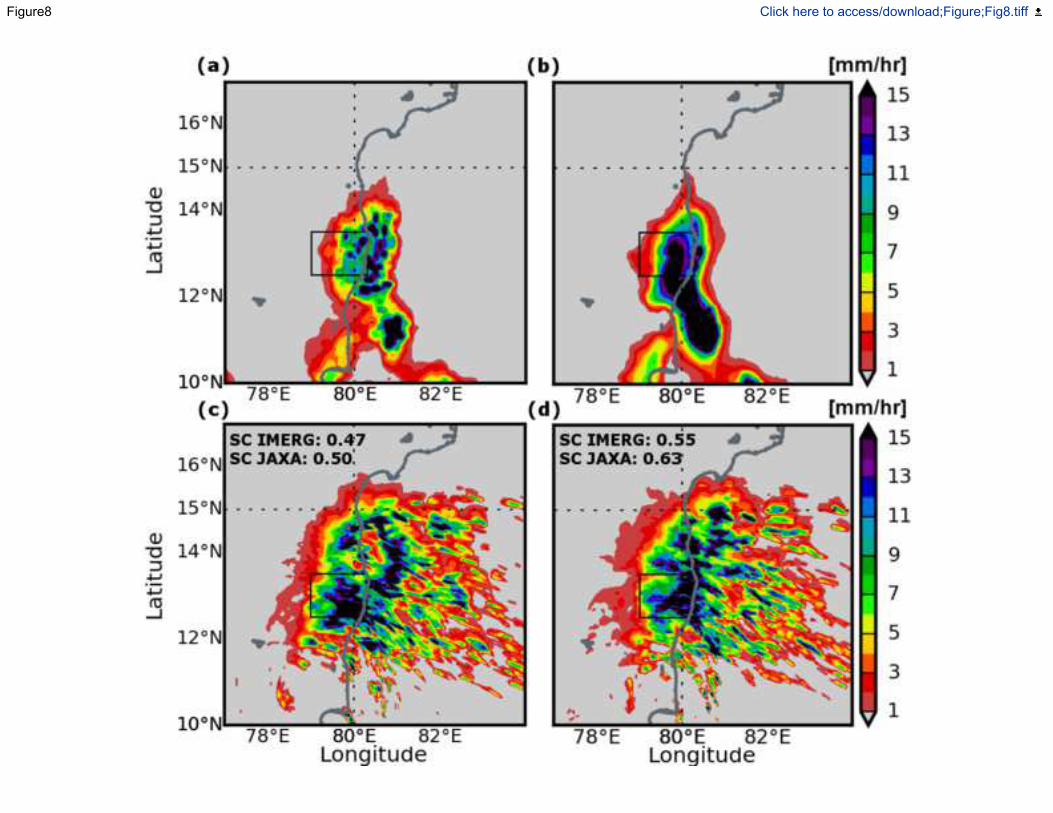
Figure8 Click here to access/download;Figure;Fig8.tiff
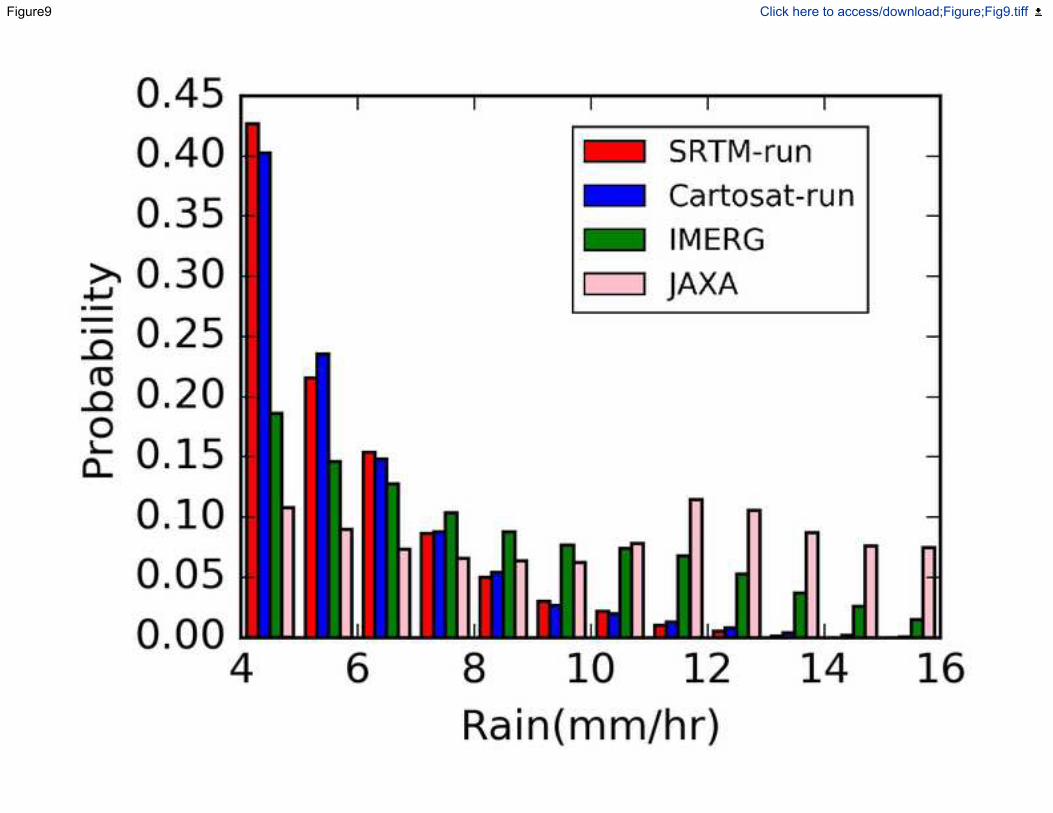
Figure9 Click here to access/download;Figure;Fig9.tiff
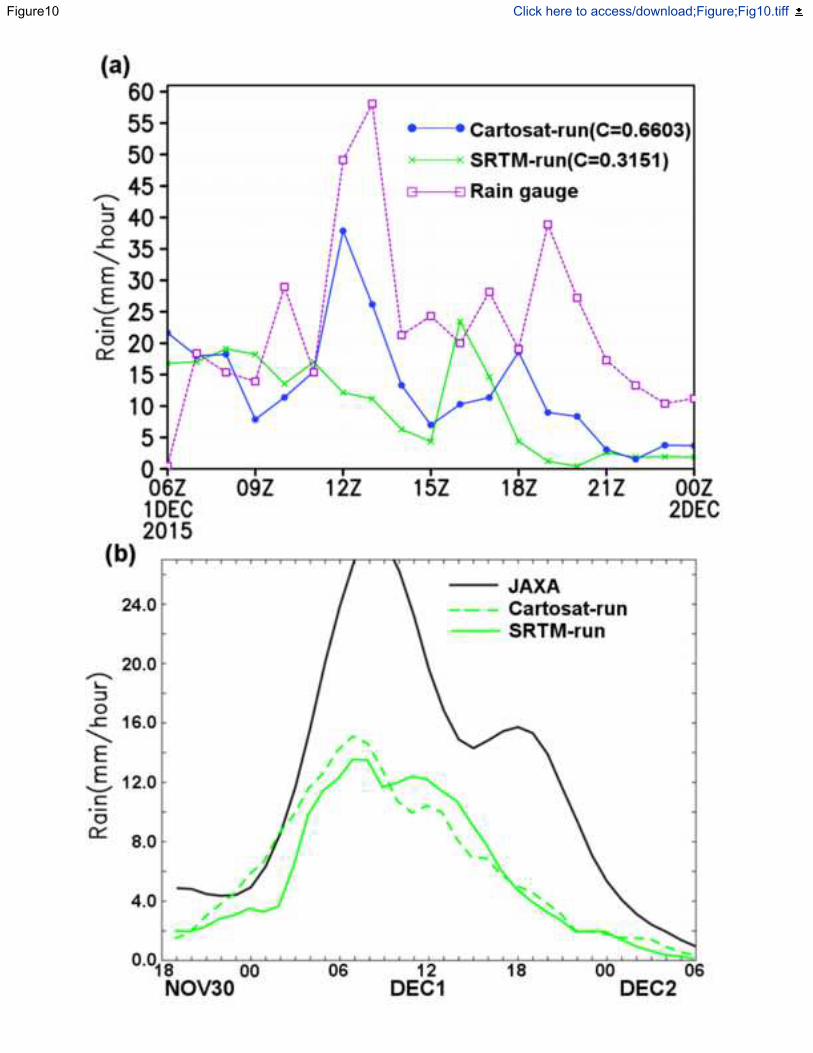
Figure10 Click here to access/download;Figure;Fig10.tiff


![arXiv:2002.10392v2 [cs.CV] 6 Mar 2020data and a new real-world uncertain emotion dataset (WebEmotion) collected from the Internet. Our SCN also achieves performance 88.14% on RAF-DB,](https://img.pdfslide.net/doc/110x75/60066f2231ca59555906800f/arxiv200210392v2-cscv-6-mar-2020-data-and-a-new-real-world-uncertain-emotion.jpg)