Embed Size (px)
Citation preview

International Journal of Research in Advent Technology, Vol.2, No.6, June 2014 E-ISSN: 2321-9637
133
Seamless Slope Generation from Cartosat-1 Stereo DEM of Noamundi of Jharkhand and its Surrounding
Areas Using Geospatial Technology
Surajit Panda1*, Krishnendu Banerjee2, Dr. Manish Kumar Jain3, Ratnesh Kr.Sharma4 1*, 2, 4 Jharkhand Space Applications Center, Dept. of Information Technology, Govt. of Jharkhand, Ranchi-
834004, Jharkhand, India. 3 Indian School of Mines, Dhanbad-826004, Jharkhand, India.
Email: [email protected] 1*, [email protected], [email protected], [email protected] Abstract- Now a days the developing countries like India, where the population is over one billion, one-sixth of the world’s population, affects the natural & commercial resources. Natural resources and structures are indicating the sustainability of an area. These natural resources and structures are water, geology, topography, LULC (Land use and land cover), slope etc. Slope study was carried out using remote sensing and GIS technique that could help in groundwater exploration, planning management and sustainability study. In this study the technique of remote sensing data and GIS were used to describe the slope generation from Cartosat-1 stereo DEM (Digital elevation model) of the study area for sustainability analysis. The 2.052068 Km2 areas lie in Odisha state out of total areas of the buffer is113.061 Km2 base on Noamundi location, West singhbhum district of Jharkhand state. Maximum areas (42.72 % is fall in class 3 and 0.160069 % areas is falling in class 7, is high slope areas. The slope of this area indicates that the area has high influence of runoff. A further this Slope generation technique will help us to analysis the sustainability of the area.
Index Terms- DEM, Slope, CARTOSAT-1, Neighborhood etc.
1. INTRODUCTION
A DEM is not a true representation of a ground surface, but a model of the digital earth’s surface that is commonly used to produce topographic maps, Slope, orthorectified image product, Hydrological planning and different type of engineering work etc. So Indian Space Research Organization (ISRO) realized the importance of DEMs and launched CARTOSAT-1 satellite into circular (altitude is 618 km) near-polar sun-synchronous orbit on May 5, 2005 [1]. CARTOSAT-1 is equipped with two panchromatic cameras capable of simultaneous acquisition of images of 2.5 meters spatial resolution. One of them is looking at +26 degrees forward and another looks at –5 degrees backward to acquire stereoscopic imagery with base to height ratio of 0.62 [2]. This study was carried out the slope that has been generated using CARTOSAT -1 stereo DEM image. The level and details of the surface topography depends on DEM resolution. Slope is the one of parameter to analysis the surface topography. The slope is the angular distance between two places. Slope is a number that tells us how quickly a line rises or falls [6]. The logic behind the slope calculation is shown in Fig. 2.
2. OBJECTIVES
The main objectives of the present study are mentioned as follows: Smooth seamless slope generation from CARTOSAT-1 stereo DEM and Classification of slope using GIS technique.
3. ABOUT STUDY AREA
Geologically the study area is situated at Noamundi, West singhbhum district of Jharkhand state in India. The main highlighted geographical location is Noamundi place and its 6 km. Buffer areas. This area is gradually changing due to Mining (Iron ore) activities. The deposit is located on the hill top at about 400 m to 650m above Mean Sea level. The deposit is now being mined by TATA Steel.
4. DATA USED AND METHODOLOGY
The CARTOSAT-1 Stereo DEM covering the moderate undulating terrain of West Singhbhum district of Jharkhand State was considered for the present study with the help of Jharkhand Space Application Center. Step-I The seamless DEM has been generated from Cartosat-1 stereo pair in ERDAS IMAGINE, 2011 software and integrated LPS Project Manager module [5]. The
International Journal of Research in Advent Technology, Vol.2, No.6, June 2014 E-ISSN: 2321-9637
134
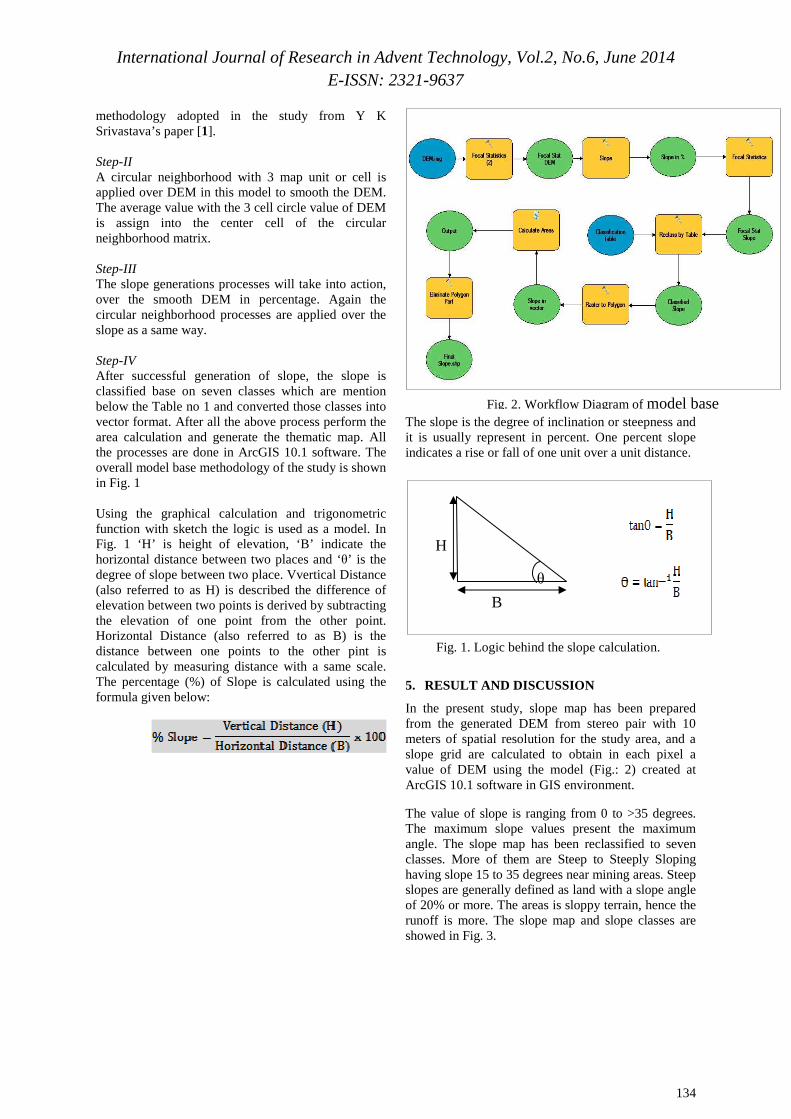
methodology adopted in the study from Y K Srivastava’s paper [1]. Step-II A circular neighborhood with 3 map unit or cell is applied over DEM in this model to smooth the DEM. The average value with the 3 cell circle value of DEM is assign into the center cell of the circular neighborhood matrix. Step-III The slope generations processes will take into action, over the smooth DEM in percentage. Again the circular neighborhood processes are applied over the slope as a same way. Step-IV After successful generation of slope, the slope is classified base on seven classes which are mention below the Table no 1 and converted those classes into vector format. After all the above process perform the area calculation and generate the thematic map. All the processes are done in ArcGIS 10.1 software. The overall model base methodology of the study is shown in Fig. 1
Using the graphical calculation and trigonometric function with sketch the logic is used as a model. In Fig. 1 ‘H’ is height of elevation, ‘B’ indicate the horizontal distance between two places and ‘θ’ is the degree of slope between two place. Vvertical Distance (also referred to as H) is described the difference of elevation between two points is derived by subtracting the elevation of one point from the other point. Horizontal Distance (also referred to as B) is the distance between one points to the other pint is calculated by measuring distance with a same scale. The percentage (%) of Slope is calculated using the formula given below:
The slope is the degree of inclination or steepness and it is usually represent in percent. One percent slope indicates a rise or fall of one unit over a unit distance.
5. RESULT AND DISCUSSION
In the present study, slope map has been prepared from the generated DEM from stereo pair with 10 meters of spatial resolution for the study area, and a slope grid are calculated to obtain in each pixel a value of DEM using the model (Fig.: 2) created at ArcGIS 10.1 software in GIS environment.
The value of slope is ranging from 0 to >35 degrees. The maximum slope values present the maximum angle. The slope map has been reclassified to seven classes. More of them are Steep to Steeply Sloping having slope 15 to 35 degrees near mining areas. Steep slopes are generally defined as land with a slope angle of 20% or more. The areas is sloppy terrain, hence the runoff is more. The slope map and slope classes are showed in Fig. 3.
Fig. 2. Workflow Diagram of model base
Fig. 1. Logic behind the slope calculation.
B
H
θ

International Journal of Research in Advent Technology, Vol.2, No.6, June 2014 E-ISSN: 2321-9637
135
According to the Table no.1, the highest slope from this study is more than 45% that cover 0.177691 sq km areas. To have a better presentation of the slope we used smoothening and eliminate the less than 5 hector in our calculation. The lowest slope value represents the flatter terrain and the higher slope value indicating the steeper terrain. The output slope raster has calculated as percentage. The 45o angular slope indicates 100 percent slope and 90o angular slope indicate infinity. The statistics of the slope values obtained are shown in Table 1.
Table 1. Detail of slope of Noamundi buffer areas. Slope in Percentage (%)
Classes Areas in Km2
Percentage (%) of areas
From To 0 1 1 2.50636 2.2578 1 3 2 21.4634 19.33484 3 8 3 47.418701 42.71611 8 15 4 24.9023 22.4327 15 30 5 13.1661 11.86.4 30 45 6 1.37438 1.238081 45 >45 7 0.177691 0.160069 Total 111.008932 100
6. CONCLUSION
Integration of GIS and Remote sensing provides the techniques to derive the slope from Cartosat-1 stereo DEM images. Slope is the steepness of a line. Slope is the vertical rise over the horizontal run. This technique helps us to mapping the slope distribution on providing the necessary map (Fig. 3) of the study areas by the given model (Fig. 2). The Slope analysis helped us to understand the hydro-morphological condition such as the topographic steepness, water flow direction, surface runoff, infiltration capacity, runoff etc of the study area. Another benefit is that the degree of slope angle also represents the
corresponding overland flow direction [3]. The use of neighborhood statistics of slope and aspects, or slope/aspect measured at a coarser scale to increase the resolution of slope classifications [7]. A further Slope study in this area will help us to analysis the sustainability of the area.
Acknowledgments
The authors are grateful to Dr. Jatisankar Bandyopadhyay, Assistant Professor, Department of Remote Sensing & GIS, Vidyasagar University, West Bengal, India, for giving valuable suggestions during this study. The authors are grateful to
Fig. 3. Spatial distribution of slope of Noamundi and its surrounding with buffer areas.
International Journal of Research in Advent Technology, Vol.2, No.6, June 2014 E-ISSN: 2321-9637
136
Jharkhand Space Application Center (JSAC) to involving us and our thanks are also due to colleagues spatially Mr. Najmul Hoda of Jharkhand Space Applications Center, Ranchi, Jharkhand who have helped at various stages of this study. REFERENCES [1] Y K Srivastava, Arati Paul, V M Chowdary, A
Jeyaram, Surajit Panda (2012): Adaptive Image Contrast Enhancement Technique on CARTOSAT - 1 Stereo pair for DEM quality improvement, Inca international congress cartography for sustainable earth resource management, Indian Cartographer, Vol. XXXII, 2012.
[2] D. Giribabu, Pramod Kumar, John Mathew, K.P. Sharma and Y.V.N. Krishna Murthy, (2013). DEM generation using Cartosat-1 stereo data: issues and complexities in Himalayan terrain, European Journal of Remote Sensing - 2013, 46: pp. 431-443.
[3] Dunn, M. and Hickey, R. (1998) The Effect of Slope Algorithms on Slope Estimates within a GIS. Cartography, v. 27, no. 1, pp. 9 – 15.
[4] (ESRI) ArcGIS Desktop, version 10.1, Online Users Guide.
[5] ERDAS IMAGIN field guide (2011).
[6] Section 3.2 Slope (2007),
http://msenux.redwoods.edu/IntAlgText/chapter3/section2.pdf
[7] Topographic Position and Landforms Analysis Andrew D. Weiss, the Nature Conservancy. Director: Ecoregional Data Management Team, the Nature Conservancy, Northwest Division, 217 Pine St. Suite 1100, Seattle WA 98103.