Embed Size (px)
Citation preview

Impact of Dose Selection Strategies on the Probability of
Success in the Phase III
Zoran AntonijevicSenior Director
Strategic Development, Biostatistics
Quintiles, Inc.

Other Contributors
Frank Bretz, Novartis
Alex Dmitrienko, Ely Lilly and Company
Vlad Dragalin, Wyeth
Parvin Fardip, Wyeth
Chyi-Hung Hsu, Novartis
Tom Parke, Tessella
Jose Pinheiro, Novartis

1. Introduction
2. Design/Methods
3. Results/Discussion
4. Conclusions

Introduction
• Selection of dose(s) to advance into the Phase III is one of the most challenging decisions during drug development
• It is believed by many that high attrition rate in the Phase III is largely driven by inadequate dose selection

Introduction
• Adaptive Dose-Ranging Studies (ADRS) group formed within PhRMA to develop new and evaluate existing adaptive dose-ranging methods and strategies
• This workstreem was formed within the ADRS with a task to assess the impact of dose-selection methods/strategies on the success of the Phase III program
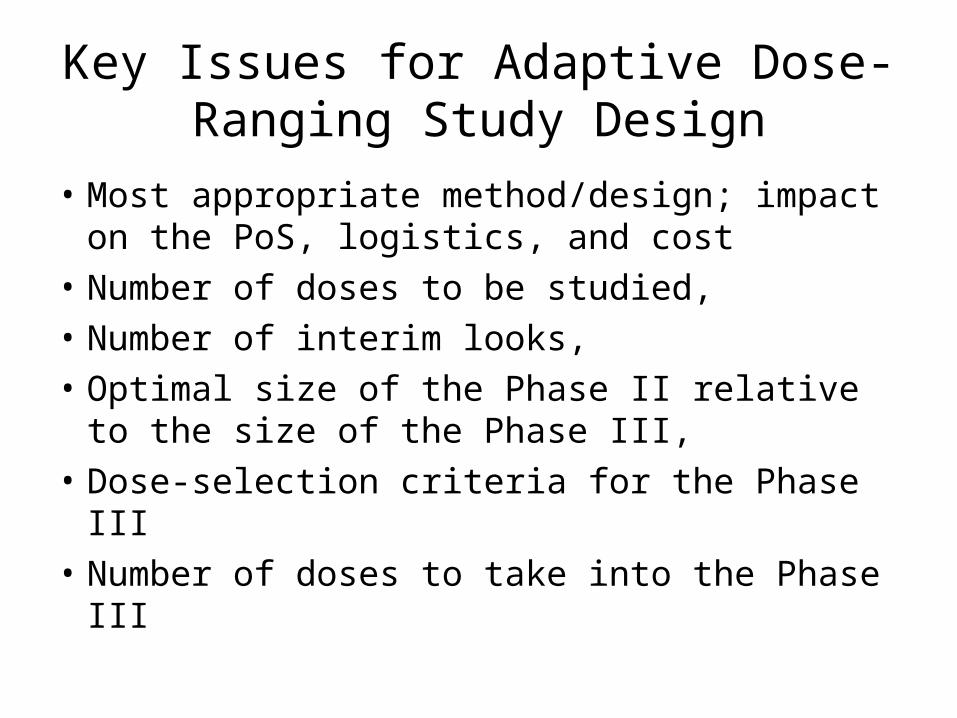
Key Issues for Adaptive Dose-Ranging Study Design
• Most appropriate method/design; impact on the PoS, logistics, and cost
• Number of doses to be studied,
• Number of interim looks,
• Optimal size of the Phase II relative to the size of the Phase III,
• Dose-selection criteria for the Phase III
• Number of doses to take into the Phase III

Approach
• Compare designs/strategies based on the Phase III outcome • Measured as the probability of regulatory
approval• Measured as the Net Present Value (NPV), or
some other financial measurement

Objectives• Assess the impact of different dose-
selection methods in the Phase II trials on the PoS in the Phase III • PoS defined as probability of drug approval
• Assess the impact of the Phase II sample size, and number of doses studied on the PoS in the Phase III
• Compare the performance of Phase III studies with one vs. two active arms

1. Introduction
2. Design/Methods
3. Results/Discussion
4. Conclusions

Endpoint
• Change from baseline to Week 6 in a VAS scale of pain.
• The VAS takes values between 0 (no pain) and 10 (highest pain) on a continuous scale.

Phase II Design and Assumptions
• 5 or 9 equally spaced dose levels• 0=placebo; 2, 4, 6, and 8 active• 0=placebo; 1, 2,…, 8=active
• Dose-response profiles • Linear• Logistic • Quadratic• Emax
• Sample sizes of 150 and 250 total

Efficacy Dose-Response Profiles
-1.5
-1.0
-0.5
0.0
0 2 4 6 8
Linear Logistic
Umbrella
-1.5
-1.0
-0.5
0.0
0 2 4 6 8
Emax
Dose
Exp
ect
ed
ch
an
ge
fro
m b
ase
line
in V
AS
at
We
ek
6

Safety Penalty Function
6
8
10
12
2 4 6 8
Linear Logistic
Umbrella
6
8
10
12
2 4 6 8
Emax
Dose
Pro
ba
bili
ty o
f S
AE
(%
)

Dose Selection Methods
• ANOVA with Dunnett’s adjustment• Flexible design (response-adaptive allocation)
• GADA: Bayesian adaptive dose allocation method• D-opt: adaptive dose allocation based on the D-opt
criterion• Flexible analysis
• MCP-Mod; combination of modeling and multiple comparison procedure
• Multiple Trend Test• Bayesian model averaging• Nonparametric linear regression fitting

Phase III Design
• Designs with one or two arms of the test drug were considered
• Success measured as one positive pivotal trial at two sided α=0.05
• For design with two active dose arms Dunnett’s procedure applied to control for multiplicity
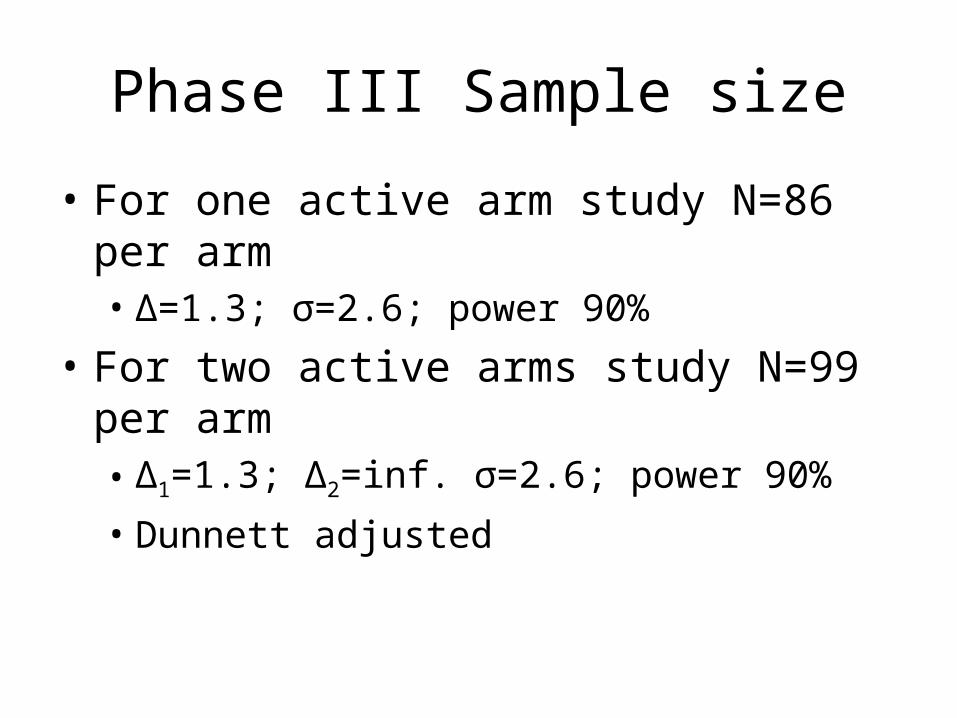
Phase III Sample size
• For one active arm study N=86 per arm• ∆=1.3; σ=2.6; power 90%
• For two active arms study N=99 per arm• ∆1=1.3; ∆2=inf. σ=2.6; power 90%
• Dunnett adjusted

Dose Selection Strategy
• For Phase III design with one active dose, select dose closest to the target efficacy (∆=1.3)
• For Phase III design with two doses of active, the first dose was selected as described above
• Second dose selected is the one closer to the target efficacy between doses immediately above and below the first selected dose

Methods - Efficacy
• For each selected dose and dose response model we know the “true” treatment effect.
• For a given design of the Phase III program (sample size, sig. level for test…) we can determine the associated power corresponding to the “true” effect
Methods - Safety
• Likewise, for an assumed safety dose-response model (probability of having unacceptable safety in the trial) we can also determine the probability of failing for safety for each dose.

Methods - PoS
• Assuming that efficacy and safety successes are independent the probability of a successful Phase III program for a given dose/model combination is: Prob(success|d,m) = [(power(dose,m) * (1 - safety.prob(dose))]

1. Introduction
2. Design/Methods
3. Results/Discussion
4. Conclusions

Probability of Success for Efficacy
ANOVA
Dopt
GADA
MCPMod
MTT
BMA
LOCFIT
70 80 90
logisticN = 150
umbrellaN = 150
70 80 90
linearN = 150
EmaxN = 150
ANOVA
Dopt
GADA
MCPMod
MTT
BMA
LOCFIT
logisticN = 250
70 80 90
umbrellaN = 250
linearN = 250
70 80 90
EmaxN = 250
Average power (%)
1 dose 2 doses

Probability of Acceptable Safety Profile
ANOVA
Dopt
GADA
MCPMod
MTT
BMA
LOCFIT
75 80 85 90
logisticN = 150
umbrellaN = 150
75 80 85 90
linearN = 150
EmaxN = 150
ANOVA
Dopt
GADA
MCPMod
MTT
BMA
LOCFIT
logisticN = 250
75 80 85 90
umbrellaN = 250
linearN = 250
75 80 85 90
EmaxN = 250
Average safety probability (%)
1 dose 2 doses

Overall Probability of Success
ANOVA
Dopt
GADA
MCPMod
MTT
BMA
LOCFIT
55 60 65 70 75 80
logisticN = 150
umbrellaN = 150
55 60 65 70 75 80
linearN = 150
EmaxN = 150
ANOVA
Dopt
GADA
MCPMod
MTT
BMA
LOCFIT
logisticN = 250
55 60 65 70 75 80
umbrellaN = 250
linearN = 250
55 60 65 70 75 80
EmaxN = 250
Average success probability (%)
1 dose 2 doses
Discussion
• PoS slightly (but consistently) better for Phase II design with 250 patients vs. 150 patients
• Methods with response-adaptive randomization component, particularly GADA, consistently outperform other designs on the overall PoS• These designs are also generally less
affected by the Phase II sample size

Discussion
• Design with two doses improves the probability of a positive efficacy result• This is not surprising given the sample size
calculation method
• This design also improves the chance of selecting at least one safe arm due to the “distribution of risk”
• Resulting PoS for two active doses improved over design with one active dose

Probability of Success for Efficacy
ANOVA
Dopt
GADA
MCPMod
MTT
BMA
LOCFIT
70 80 90
logistic1 dose
umbrella1 dose
70 80 90
linear1 dose
Emax1 dose
ANOVA
Dopt
GADA
MCPMod
MTT
BMA
LOCFIT
logistic2 doses
70 80 90
umbrella2 doses
linear2 doses
70 80 90
Emax2 doses
Average power (%)
nDose = 5 nDose = 9

Probability of Acceptable Safety Profile
ANOVA
Dopt
GADA
MCPMod
MTT
BMA
LOCFIT
70 75 80 85 90
logistic1 dose
umbrella1 dose
70 75 80 85 90
linear1 dose
Emax1 dose
ANOVA
Dopt
GADA
MCPMod
MTT
BMA
LOCFIT
logistic2 doses
70 75 80 85 90
umbrella2 doses
linear2 doses
70 75 80 85 90
Emax2 doses
Average safety probability (%)
nDose = 5 nDose = 9

Overall Probability of Success
ANOVA
Dopt
GADA
MCPMod
MTT
BMA
LOCFIT
55 60 65 70 75 80
logistic1 dose
umbrella1 dose
55 60 65 70 75 80
linear1 dose
Emax1 dose
ANOVA
Dopt
GADA
MCPMod
MTT
BMA
LOCFIT
logistic2 doses
55 60 65 70 75 80
umbrella2 doses
linear2 doses
55 60 65 70 75 80
Emax2 doses
Average success probability (%)
nDose = 5 nDose = 9

Discussion
• For a fixed sample size (N=250) design with 5 doses performed better on the overall PoS than design with 9 doses, other than for response-adaptive designs (GADA & Dopt)
• For GADA & Dopt designs with 5 and 9 doses performed similarly

Discussion
• Power for efficacy, safety, as well as the overall PoS better for the Phase III design with two active doses, whether 5 or 9 doses were studied in the Phase II

Distribution of Selected Dose
0
20
40
60
2 4 6 8
ANOVA5 doses
Dopt5 doses
2 4 6 8
GADA5 doses
MCPMod5 doses
2 4 6 8
MTT5 doses
BMA5 doses
2 4 6 8
LOCFIT5 doses
ANOVA9 doses
2 4 6 8
Dopt9 doses
GADA9 doses
2 4 6 8
MCPMod9 doses
MTT9 doses
2 4 6 8
BMA9 doses
0
20
40
60
LOCFIT9 doses
Dose selected
% T
ria
ls
Logistic, N = 250

Distribution of Selected Dose
0
10
20
30
40
2 4 6 8
ANOVA5 doses
Dopt5 doses
2 4 6 8
GADA5 doses
MCPMod5 doses
2 4 6 8
MTT5 doses
BMA5 doses
2 4 6 8
LOCFIT5 doses
ANOVA9 doses
2 4 6 8
Dopt9 doses
GADA9 doses
2 4 6 8
MCPMod9 doses
MTT9 doses
2 4 6 8
BMA9 doses
0
10
20
30
40
LOCFIT9 doses
Dose selected
% T
ria
ls
Linear, N = 250

Distribution of Selected Dose
0
10
20
30
40
50
2 4 6 8
ANOVA5 doses
Dopt5 doses
2 4 6 8
GADA5 doses
MCPMod5 doses
2 4 6 8
MTT5 doses
BMA5 doses
2 4 6 8
LOCFIT5 doses
ANOVA9 doses
2 4 6 8
Dopt9 doses
GADA9 doses
2 4 6 8
MCPMod9 doses
MTT9 doses
2 4 6 8
BMA9 doses
0
10
20
30
40
50
LOCFIT9 doses
Dose selected
% T
ria
ls
Umbrella, N = 250

Distribution of Selected Dose
0
10
20
30
40
50
2 4 6 8
ANOVA5 doses
Dopt5 doses
2 4 6 8
GADA5 doses
MCPMod5 doses
2 4 6 8
MTT5 doses
BMA5 doses
2 4 6 8
LOCFIT5 doses
ANOVA9 doses
2 4 6 8
Dopt9 doses
GADA9 doses
2 4 6 8
MCPMod9 doses
MTT9 doses
2 4 6 8
BMA9 doses
0
10
20
30
40
50
LOCFIT9 doses
Dose selected
% T
ria
ls
Emax, N = 250

Discussion
• With exception of the logistic response profile our dose-selection criterion misses (usually stops short of) the dose with highest PoS.
• Similar distributions have been observed regardless of the method used, or the number of doses studied.

1. Introduction
2. Design/Methods
3. Results/Discussion
4. Conclusions

Conclusions
• Methods with response-adaptive randomization component, particularly GADA, consistently outperform other designs on the overall PoS
• Only a small gain in the Phase III PoS is observed if the Phase II sample size is increased from 150 to 250

Conclusions
• Design with smaller number of doses performed better
• The overall PoS for a design with two active doses is consistently much higher than that of a design with one active dose

Conclusions
• Increasing the sample size generally results in an improved PoS.
• Increasing the sample size also results in the increased costs. It is therefore important to study when and by how much to increase investments in the program.

Conclusions
• Our current dose-selection criteria (focused on MED) usually fails to detect the optimal dose for the Phase III• Future research to include different dose
selection approaches, including approaches based on the utility (safety + efficacy) criterion.