Embed Size (px)
Citation preview

Impacts of small scale rainfall variability in urban areas: a case study with 2D/1D hydrological model in a multifractal
framework A. Gires, A. Giangola-Murzyn, I. Tchiguirinskaia,
D. Schertzer, S. Lovejoy
EGU General Assembly, Vienna, 22-27 April 2012
Chair “Hydrology for Resilient Cities”
(sponsored by Véolia) (EU FP 7) (EU INTER-REG NEW)

Introduction
Basic features of hydrological processes at stake in urban hydrology flooding (rainfall, surface runoff, sewer flow, and sub-surface flow): - Non linear - Different characteristic spatial and temporal scales Numerous studies suggest that rainfall variability, which is extreme over wide ranges of spatial and temporal scales, has a significant impact in hydrology and moreover in urban hydrology (greater coeff. of imper. And shorter response time) What is the impact of small scale (< 1 km x 5 min, usually unmeasured) rainfall variability in urban hydrology ? What should be the spatial resolution of the model used to take it into account ? A case study : - Kodak Catchment (1.44 km2 urban near Paris) - Two models : a fully distributed one and a semi distributed one - One rainfall event : 9th February, 2009

Overall description: - Multi-hydro is a numerical platform developed at LEESU (v1, El Tabach et al, 2008, v2, A. Giangola-Murzyn et al., 2012) in the framework of SMARTesT. It is currently in a validation and demonstration (Heywood site, Manchester; Villecresnes site, Val-de-Marne) phase.
- It a is core that makes interact different modules, each representing a portion of the water cycle in urban hydrology.
Main goals: - taking into account small scales fully distributed model
- physically based model (no calibration)
- easily transportable a conversion module to generate inputs from available GIS data
- open access software packages to benefit from the feedback of a large community and frequent update.
The Multi-Hydro model
(see Giangola-Murzyn et al. paper at this conference)
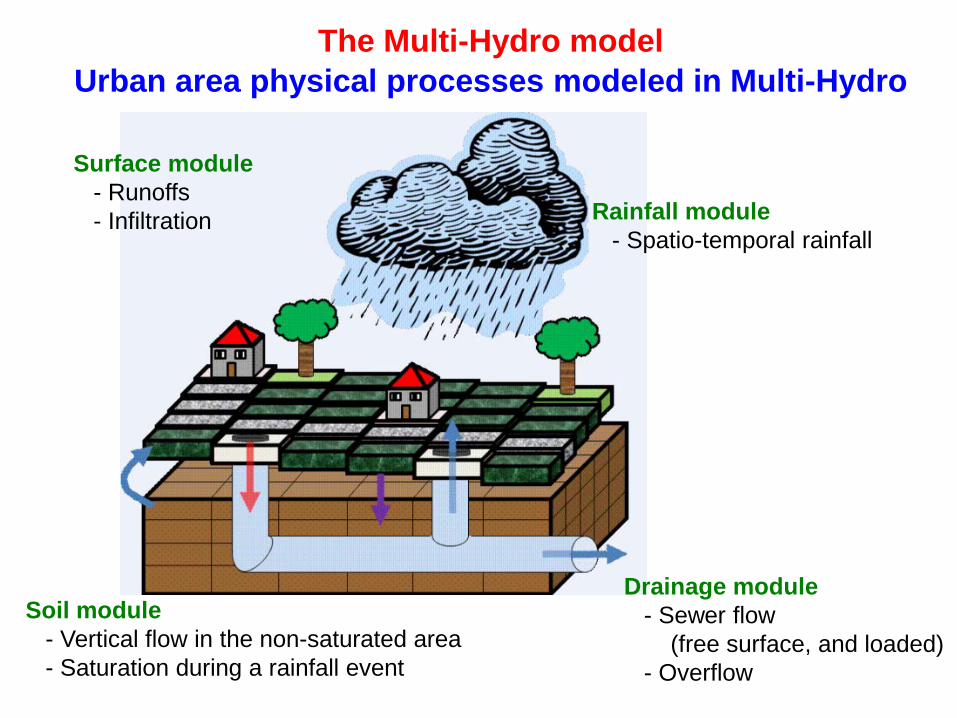
Urban area physical processes modeled in Multi-Hydro
Surface module - Runoffs - Infiltration
Soil module - Vertical flow in the non-saturated area - Saturation during a rainfall event
Drainage module - Sewer flow (free surface, and loaded) - Overflow
Rainfall module - Spatio-temporal rainfall
The Multi-Hydro model
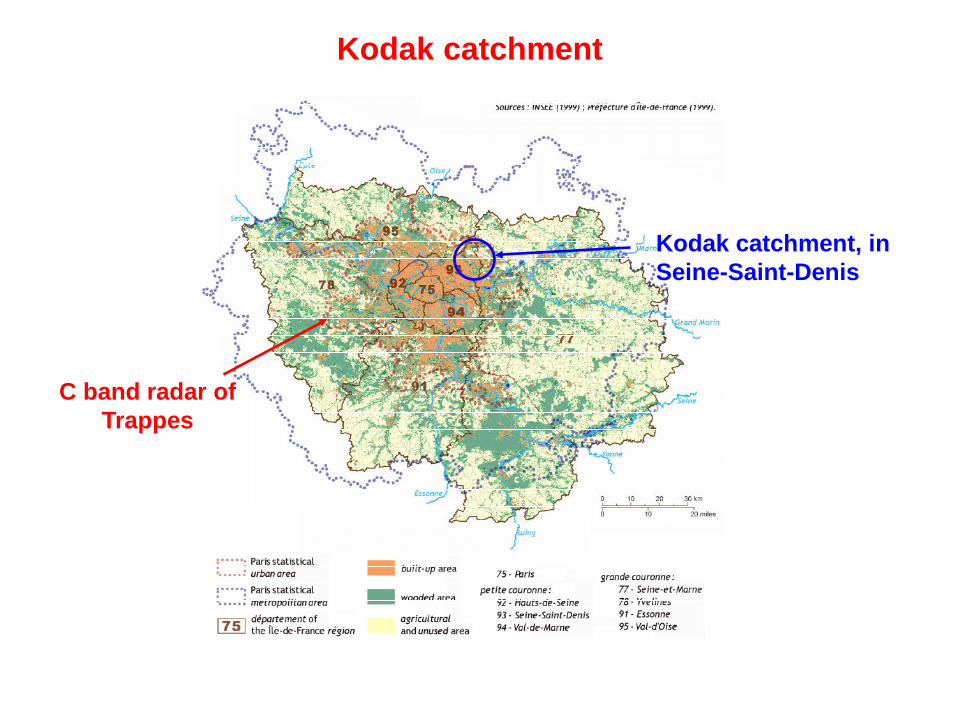
Kodak catchment
Kodak catchment, in Seine-Saint-Denis
C band radar of Trappes

Kodak catchment
- 1.44 km2
- Known for regular overflow - Project to build a storm water storage basin
Outlet Flow measurement

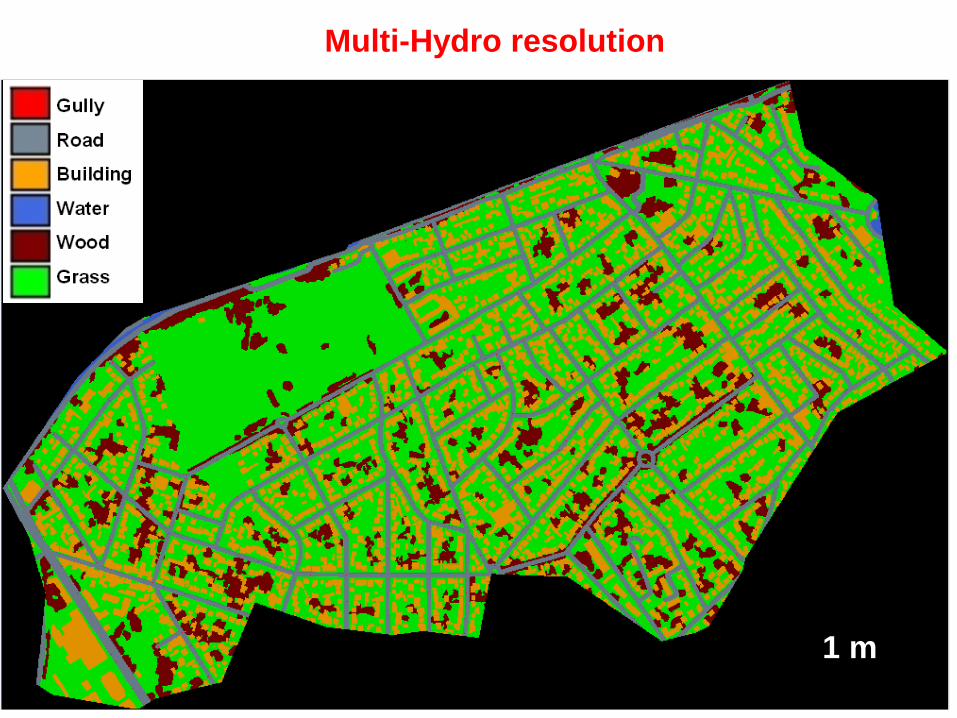
Multi-Hydro resolution
Snapshot of MH AssimTool
Raster data
Only one land use class per pixel …

20 m
Multi-Hydro resolution

15 m
Multi-Hydro resolution

10 m
Multi-Hydro resolution

5 m
Multi-Hydro resolution

3 m
Multi-Hydro resolution

2 m
Multi-Hydro resolution
Multi-Hydro resolution
1 m

Multi-Hydro resolution
Example of hydrological consequences:
Size of pixel (m) % of impervious area
20 87
15 83
10 77
5 63
3 53
2 47
1 40
How to explain these figures with a unique notion ?

Fractal tools which are commonly used in geophysics can also be helpful in urban environment.
Multi-Hydro resolution
Notion of fractal dimension of a set A:
Nλ = number of boxes of size l needed to cover the set A of outer scale L
Fractal dimension of the impervious area :
FDN λλ ≈
lL
=λResolution =

Kodak catchment Multi-Hydro : 10 m resolution Semi-distributed 1D model
- Modelled with semi-distributed 1D model Canoe (lumped model for each sub-catchment and Saint-Venant equations in the links) - 16 sub-catchments (considered homogeneous) with size ranging from 4 to 14.5 ha - Calibrated by DEA 93

Rainfall event of February 9th 2009
Météo-France radar mosaic, provided by Méteo-France
Resolution : 1 km * 1 km * 5 min
Time evolution of the rain rate for the studied catchment
Data : Météo-France radar mosaic
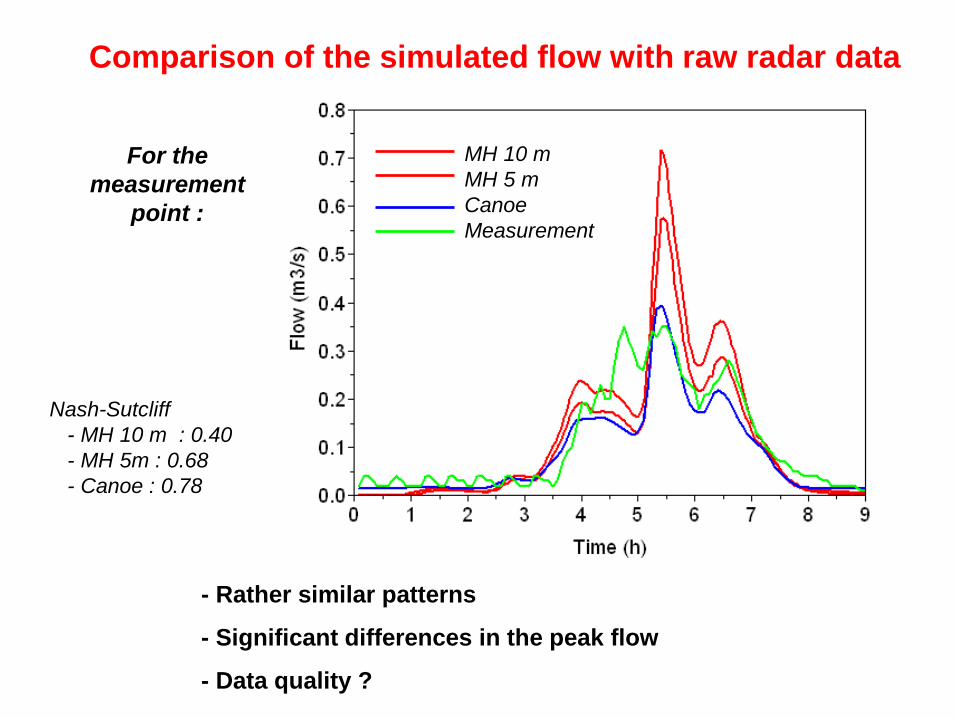
Comparison of the simulated flow with raw radar data
For the measurement
point :
- Rather similar patterns
- Significant differences in the peak flow
- Data quality ?
Nash-Sutcliff - MH 10 m : 0.40 - MH 5m : 0.68 - Canoe : 0.78
MH 10 m MH 5 m Canoe Measurement

Quantifying the uncertainty associated with small scale rainfall variability
(i) Generation of an ensemble of realistic downscaled rainfall fields :
- Multifractal analysis of rainfall data
- Downscaling with the help of discrete universal multifractals cascades
(ii) Simulation of the corresponding ensembles of hydrographs :
- Use of operational hydrological/hydraulic urban models
(iii) Analysis of the ensembles :
Variability among the 100 samples
Uncertainty due to the unknown high resolution
rainfall variability
Methodology : stochastic ensemble approach

333 m
5 min
2.5 min
1.25 min
1 km
111 m
Measured or deterministically nowcasted
Multifractal analysis two relevant parameters of the cascade process
Stochastic spatio-temporal downscaling for each pixel
Performed with the help of discrete Universal Multifractal cascades
Rainfall downscaling technique
Quantifying the uncertainty associated with small scale rainfall variability
Two more cascade steps… 11 m x 19 s

Rainfall downscaling technique
Quantifying the uncertainty associated with small scale rainfall variability
Temporal evolution of the avg rain rate over the studied area
Potential hydrological effects are due to disparities of spatio-temporal distribution, not total amount.
Total rainfall amount :
- Raw radar : 7.34 mm
- Simulated ensemble : 7.37 ± 0.21 mm (CV=2.9%)

Semi-distributed 1D model
Quantifying the uncertainty associated with small scale rainfall variability
Uncertainty on the simulated flow for the outlet
Multi-Hydro 10m
radar
radarPFradarPF
PFtQtQ
CV*2
)()(' ,1.0,9.0 −=
CV’ = 15 % CV’ = 8 %

Quantifying the uncertainty associated with small scale rainfall variability
Upstream / downstream influence
CV’ = 15 %
CV’ = 19 % CV’ = 22 %
CV’ = 29 %
CV’ = 60 %

Conclusion Quantifying the uncertainty associated with unmeasured small scale rainfall variability : - It cannot be neglected (CV’ reaches 60% for up-stream links and 15% for the outlet, and power law fall-off for probability distribution for both discharge and rainfall). - A need to implement X band-radars (which provide an hectometric resolution) in urban area Comparison of a fully distributed model (10 m resolution) with semi-distributed one (300 m resolution) - Much more uncertainty is unveiled with the fully distributed / Even moderate rainfalls are affected. - Semi-distributed models would be unable to take advantage of an improved data resolution. Small scale phenomenon must be taken into account in urban hydrology Limits / further investigations : - Perform similar study with other inputs - More heaviest rainfall, actually generating floods should be tested