Embed Size (px)
Citation preview
Application ReportSLAA203C–June 2004–Revised April 2009
Implementing An Electronic Watt-Hour Meter WithMSP430FE42x(A)/FE42x2
Stefan Schauer, Kripasagar Venkat ......................................................................... MSP430 Applications
ABSTRACTThis report shows how to implement an electronic watt-hour meter with theMSP430FE42x(A)/FE42x2 devices. It contains guidelines and recommendations foruse of the MSP430FE42x(A) and MSP430FE42x2 devices. In addition, a referenceboard with hardware details and software examples are included.
Contents1 Introduction .......................................................................................... 32 Hardware ............................................................................................ 3
2.1 Getting Started with the Reference Board ............................................. 32.2 Shunt as Current Sensor ................................................................. 42.3 CT as Current Sensor..................................................................... 52.4 CT and Shunt as Current Sensor for Tamper Detection (Not Applicable for
FE42x2 Devices) .......................................................................... 62.5 CT for the US 1-Phase 3-Wire E-Meter Solution ...................................... 72.6 Voltage Input Connections ............................................................... 72.7 Current Input Connections ............................................................... 72.8 Anti-Aliasing Filter ......................................................................... 82.9 Unused ADC Inputs ....................................................................... 8
3 Calculation of the ESP430CE Meter Constants ................................................ 83.1 Voltage Ratio ............................................................................... 83.2 Current Ratio for Shunt ................................................................... 83.3 Current Ratio for Current Transformer.................................................. 83.4 Interrupt Level for Energy ................................................................ 8
4 Meter Calibration ................................................................................... 94.1 Calibration With Continuous Measurement........................................... 104.2 Calibration With a Host Computer ..................................................... 124.3 Self Calibration ........................................................................... 13
5 Capacitor Power Supply.......................................................................... 145.1 Power Line Voltage On/Off Detection ................................................. 14
6 Layout Recommendations ....................................................................... 156.1 Grounding ................................................................................. 156.2 EMI Sensitivity ............................................................................ 16
7 Demo Software .................................................................................... 177.1 Analog Front-End Initialization ......................................................... 177.2 E-Meter Initialization ..................................................................... 177.3 Demo 1 Software......................................................................... 177.4 Energy Pulse Generation ............................................................... 187.5 Temperature Compensation for CT Phase Shift ..................................... 197.6 Controls.................................................................................... 197.7 Demo 2 .................................................................................... 20
8 References......................................................................................... 23Appendix A Reference Board Schematic and Layout ............................................. 24
SLAA203C–June 2004–Revised April 2009 Implementing An Electronic Watt-Hour Meter With MSP430FE42x(A)/FE42x2 1Submit Documentation Feedback
www.ti.com
Appendix B Frequently Asked Questions ........................................................... 30
List of Figures
1 Block Diagram for the Connection of a Shunt for Single Phase, 2-Wire .................... 42 Block Diagram for the Connection of a CT for Single Phase, 2-Wire........................ 53 Block Diagram for Connection of a Shunt and CT With Tamper Detection for Single
Phase, 2-Wire ....................................................................................... 64 Block Diagram for the ANSI Single-Phase 3-Wire E-Meter Solution ........................ 75 MSP430 Electronic Electricity Meter With External Terminals ............................... 96 Electricity Meter Calibration With a Host Computer .......................................... 127 Self-Calibration for Electricity Meters........................................................... 138 Capacitor Supply .................................................................................. 149 Power Detection................................................................................... 1410 Analog-to-Digital Converter Grounding......................................................... 1511 Routing Sensitive to External EMI .............................................................. 1612 Routing for Minimum EMI Sensitivity ........................................................... 1613 Software Flow ..................................................................................... 18A-1 Components on the Reference Board.......................................................... 24A-2 Schematics (1 of 3) ............................................................................... 25A-3 Schematics (2 of 3) ............................................................................... 26A-4 Schematics (3 of 3) ............................................................................... 27A-5 Components on Top Side........................................................................ 28A-6 Components on Bottom Side .................................................................... 28
List of Tables
1 Demo 1 Files....................................................................................... 172 Demo 2 Additional Files .......................................................................... 20A-1 Bill of Materials .................................................................................... 28
Implementing An Electronic Watt-Hour Meter With MSP430FE42x(A)/FE42x22 SLAA203C–June 2004–Revised April 2009Submit Documentation Feedback
1 Introduction
2 Hardware
2.1 Getting Started with the Reference Board
www.ti.com Introduction
This application report shows a hardware reference design and software routines for implementing anelectronic electricity meter with the MSP430FE42x(A)/FE42x2 devices. It is intended to be used as asupplement to the ESP430CE1, ESP430CE1A, ESP430CE1B Peripheral Modules User's Guide(SLAU134), which describes the ESP430CE1/1A/1B modules.
The MSP430FE42x(A) and MSP430FE42x2 with the ESP430CE1(A) and ESP430CE1B respectively havebeen specifically developed for energy metering applications. The Embedded Signal Processor (ESP) withan integrated analog front end and temperature sensor is designed for single phase energy metering. TheESP430CE does most of the work for the energy measurement automatically, without needing resourcesof the main CPU. This keeps the main CPU free for other tasks such as communication. The ESP430CEoffers wide flexibility for current sensors, so that it is possible to use shunts or current transformers(including dc-tolerant CTs with high phase shift) without additional hardware. All parameters can beadjusted via software, and the calibration parameters can be stored in the MSP430 flash memory andpassed to the ESP430CE during the system initialization.
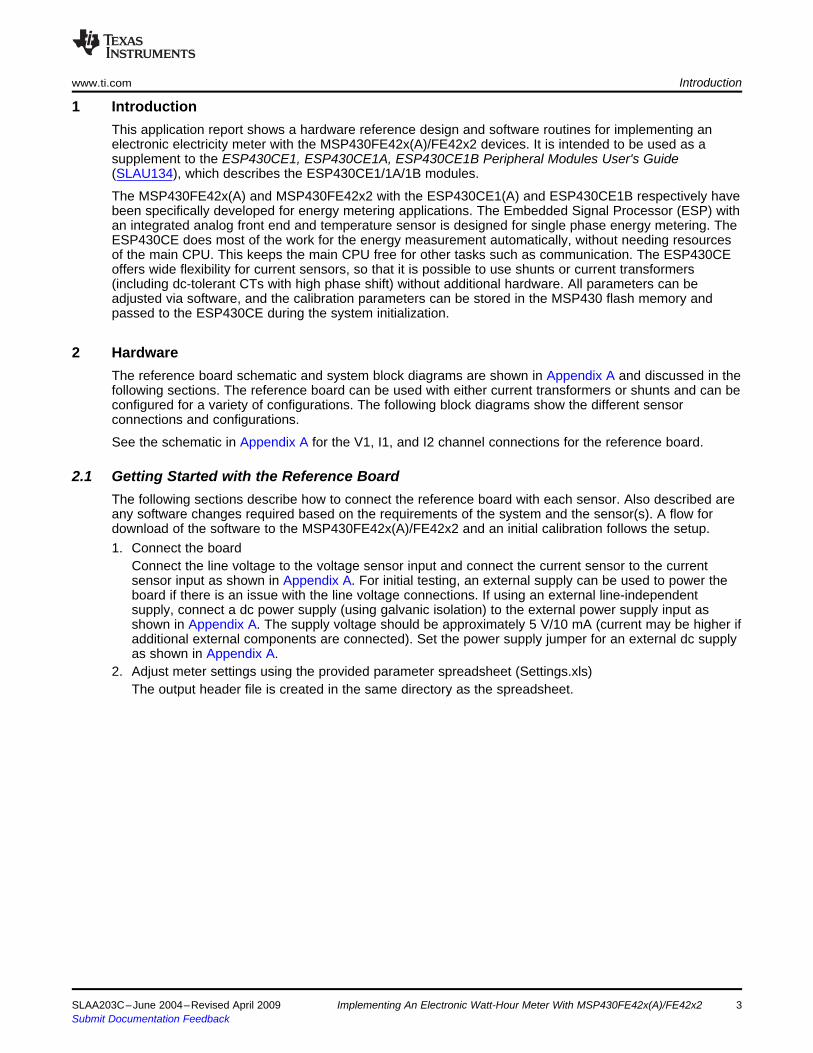
The reference board schematic and system block diagrams are shown in Appendix A and discussed in thefollowing sections. The reference board can be used with either current transformers or shunts and can beconfigured for a variety of configurations. The following block diagrams show the different sensorconnections and configurations.
See the schematic in Appendix A for the V1, I1, and I2 channel connections for the reference board.
The following sections describe how to connect the reference board with each sensor. Also described areany software changes required based on the requirements of the system and the sensor(s). A flow fordownload of the software to the MSP430FE42x(A)/FE42x2 and an initial calibration follows the setup.1. Connect the board
Connect the line voltage to the voltage sensor input and connect the current sensor to the currentsensor input as shown in Appendix A. For initial testing, an external supply can be used to power theboard if there is an issue with the line voltage connections. If using an external line-independentsupply, connect a dc power supply (using galvanic isolation) to the external power supply input asshown in Appendix A. The supply voltage should be approximately 5 V/10 mA (current may be higher ifadditional external components are connected). Set the power supply jumper for an external dc supplyas shown in Appendix A.
2. Adjust meter settings using the provided parameter spreadsheet (Settings.xls)The output header file is created in the same directory as the spreadsheet.
SLAA203C–June 2004–Revised April 2009 Implementing An Electronic Watt-Hour Meter With MSP430FE42x(A)/FE42x2 3Submit Documentation Feedback
2.2 Shunt as Current Sensor
LOAD
From Utility
MSP430FE42x(A)/FE42x2 Reference Board
UTXD0
Sx,COMx
V1-/V ref(O)
Px.x
Vref(I)
URXD0
32,768 HzXIN
XOUT
R33
R03
ESP430CE1/1A/1B
IIN
VIN
V1+
I1+
I1-
I2+ (see Note)
I2- (see Note)
RST
VSS
VCC
MSP430FE42x(A)/FE42x2
V1-
VREF
MAXCUM
A
B
C
D
E
kWhREACTEST kW
N L
Hardware www.ti.com
Note: I2+ and I2– are not present on the FE42x2 devices.
Figure 1. Block Diagram for the Connection of a Shunt for Single Phase, 2-Wire
Implementing An Electronic Watt-Hour Meter With MSP430FE42x(A)/FE42x24 SLAA203C–June 2004–Revised April 2009Submit Documentation Feedback
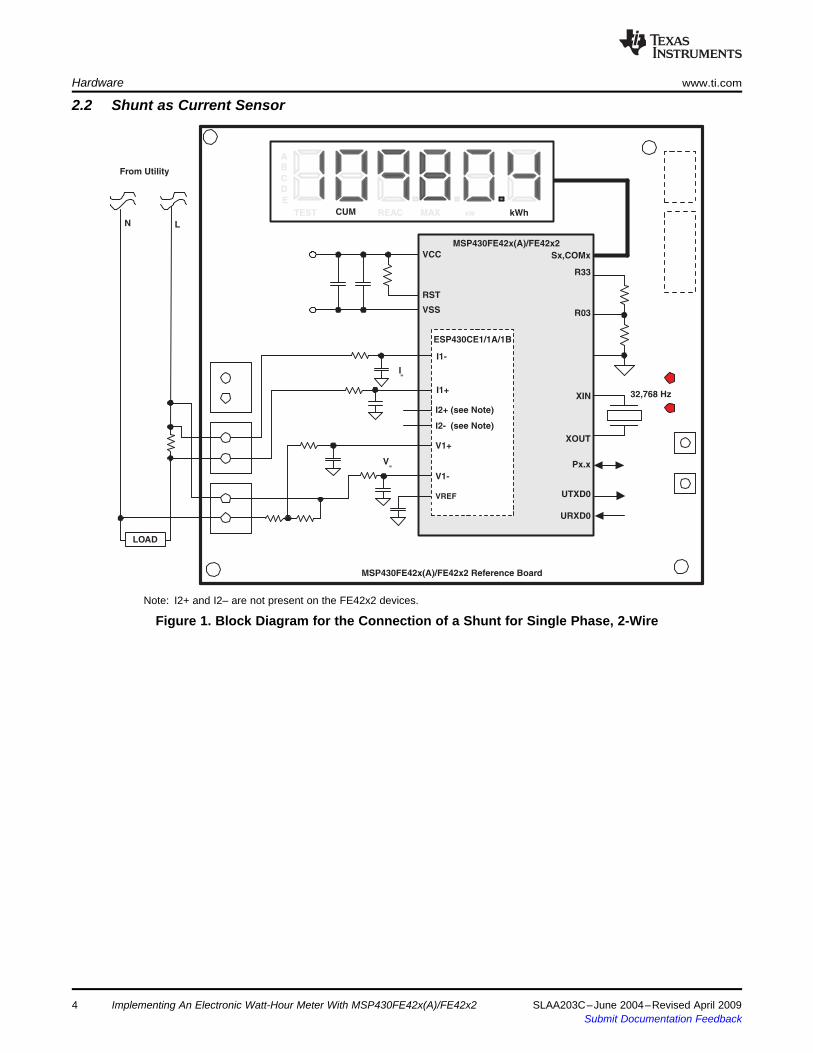
2.3 CT as Current Sensor
LOAD
From Utility
UTXD0
Sx,COMx
V1-/V ref(O)
Px.x
Vref(I)
URXD0
32,768 HzXIN
XOUT
R33
R03
V1+
I1+
I1-
I2+ (see Note)
I2- (see Note)
RST
VSS
VCC
V1-
VREF
MAXCUM
A
B
C
D
E
kWhREACTEST kW
CT
IIN
VIN
N L
MSP430FE42x(A)/FE42x2 Reference Board
ESP430CE1/1A/1B
MSP430FE42x(A)/FE42x2
www.ti.com Hardware
Note: I2+ and I2– are not present on the FE42x2 devices.
Figure 2. Block Diagram for the Connection of a CT for Single Phase, 2-Wire
SLAA203C–June 2004–Revised April 2009 Implementing An Electronic Watt-Hour Meter With MSP430FE42x(A)/FE42x2 5Submit Documentation Feedback
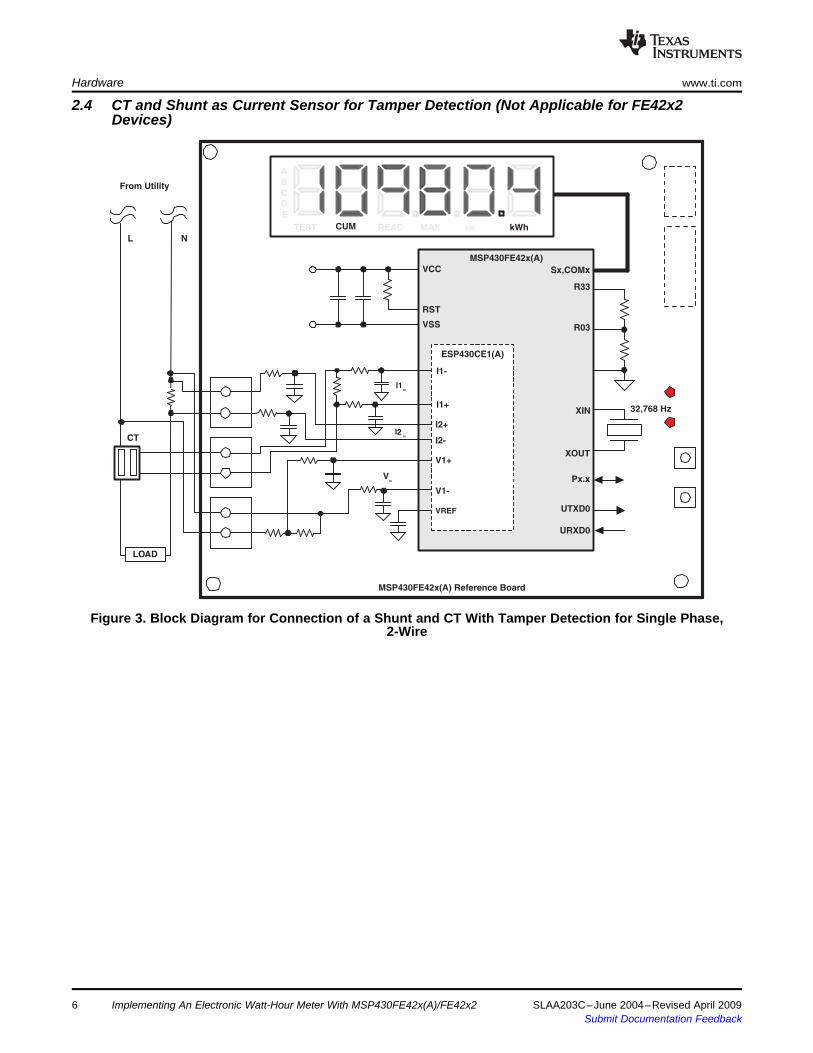
2.4 CT and Shunt as Current Sensor for Tamper Detection (Not Applicable for FE42x2
LOAD
From Utility
NL
UTXD0
Sx,COMx
V1-/V ref(O)
Px.x
Vref(I)
URXD0
32,768 HzXIN
XOUT
R33
R03
I1IN
VIN
V1+
I1+
I1-
I2+
I2-
RST
VSS
VCC
V1-
VREF
MAXCUM
A
B
C
D
E
kWhREACTEST kW
CTI2
IN
MSP430FE42x(A) Reference Board
ESP430CE1(A)
MSP430FE42x(A)
Hardware www.ti.com
Devices)
Figure 3. Block Diagram for Connection of a Shunt and CT With Tamper Detection for Single Phase,2-Wire
Implementing An Electronic Watt-Hour Meter With MSP430FE42x(A)/FE42x26 SLAA203C–June 2004–Revised April 2009Submit Documentation Feedback
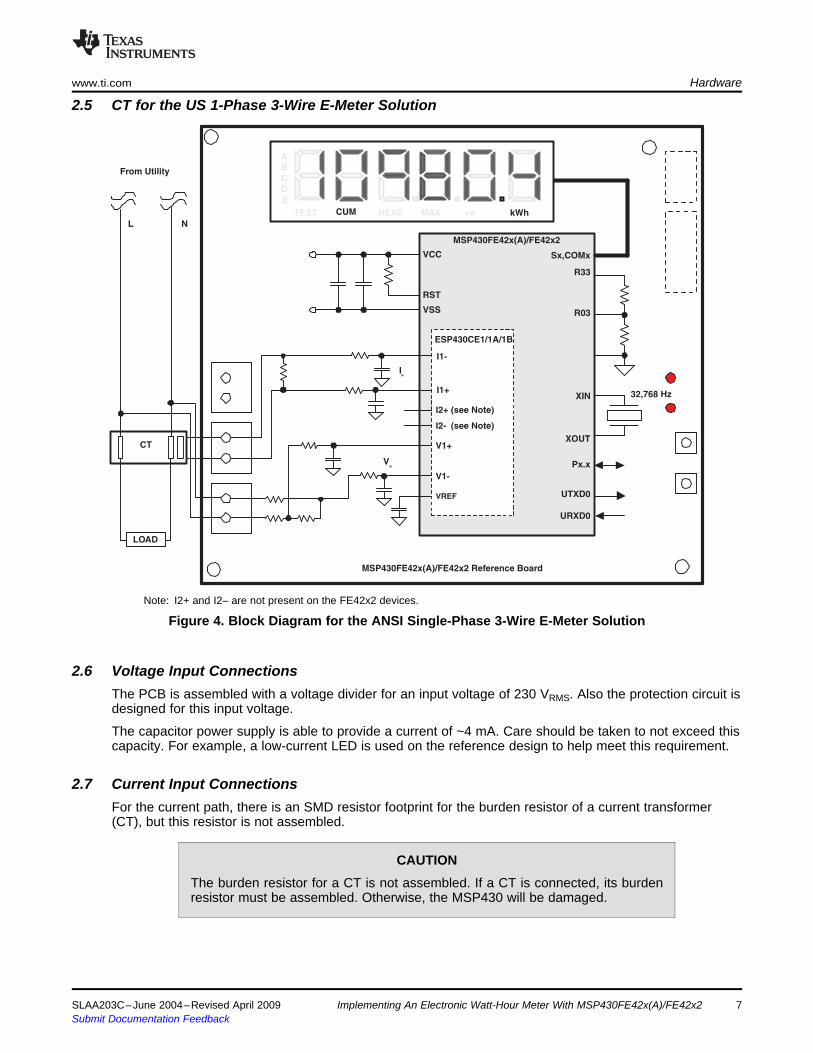
2.5 CT for the US 1-Phase 3-Wire E-Meter Solution
LOAD
From Utility
NL
MSP430FE42x(A)/FE42x2 Reference Board
UTXD0
Sx,COMx
V1-/V ref(O)
Px.x
Vref(I)
URXD0
32,768 HzXIN
XOUT
R33
R03
ESP430CE1/1A/1B
IIN
VIN
V1+
I1+
I1-
I2+ (see Note)
I2- (see Note)
RST
VSS
VCC
MSP430FE42x(A)/FE42x2
V1-
VREF
MAXCUM
A
B
C
D
E
kWhREACTEST kW
CT
2.6 Voltage Input Connections
2.7 Current Input Connections
www.ti.com Hardware
Note: I2+ and I2– are not present on the FE42x2 devices.
Figure 4. Block Diagram for the ANSI Single-Phase 3-Wire E-Meter Solution
The PCB is assembled with a voltage divider for an input voltage of 230 VRMS. Also the protection circuit isdesigned for this input voltage.
The capacitor power supply is able to provide a current of ~4 mA. Care should be taken to not exceed thiscapacity. For example, a low-current LED is used on the reference design to help meet this requirement.
For the current path, there is an SMD resistor footprint for the burden resistor of a current transformer(CT), but this resistor is not assembled.
CAUTIONThe burden resistor for a CT is not assembled. If a CT is connected, its burdenresistor must be assembled. Otherwise, the MSP430 will be damaged.
SLAA203C–June 2004–Revised April 2009 Implementing An Electronic Watt-Hour Meter With MSP430FE42x(A)/FE42x2 7Submit Documentation Feedback
2.8 Anti-Aliasing Filter
2.9 Unused ADC Inputs
3 Calculation of the ESP430CE Meter Constants
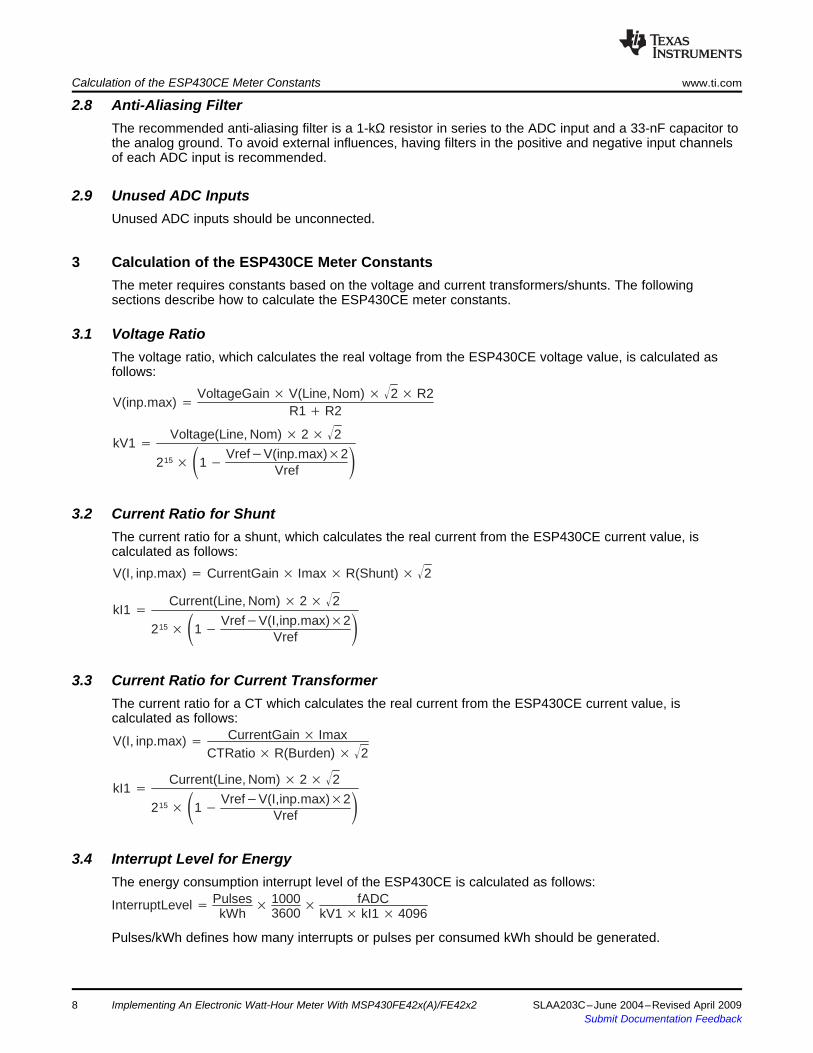
3.1 Voltage Ratio
V(inp.max) VoltageGain V(Line, Nom) 2 R2
R1 R2
kV1 Voltage(Line, Nom) 2 2
215 1 VrefV(inp.max)2
Vref
3.2 Current Ratio for Shunt
V(I, inp.max) CurrentGain Imax R(Shunt) 2
kI1 Current(Line, Nom) 2 2
215 1 VrefV(I,inp.max)2
Vref
3.3 Current Ratio for Current Transformer
V(I, inp.max) CurrentGain ImaxCTRatio R(Burden) 2
kI1 Current(Line, Nom) 2 2
215 1 VrefV(I,inp.max)2
Vref
3.4 Interrupt Level for Energy
InterruptLevel PulseskWh
10003600
fADC
kV1 kI1 4096
Calculation of the ESP430CE Meter Constants www.ti.com
The recommended anti-aliasing filter is a 1-kΩ resistor in series to the ADC input and a 33-nF capacitor tothe analog ground. To avoid external influences, having filters in the positive and negative input channelsof each ADC input is recommended.
Unused ADC inputs should be unconnected.
The meter requires constants based on the voltage and current transformers/shunts. The followingsections describe how to calculate the ESP430CE meter constants.
The voltage ratio, which calculates the real voltage from the ESP430CE voltage value, is calculated asfollows:
The current ratio for a shunt, which calculates the real current from the ESP430CE current value, iscalculated as follows:
The current ratio for a CT which calculates the real current from the ESP430CE current value, iscalculated as follows:
The energy consumption interrupt level of the ESP430CE is calculated as follows:
Pulses/kWh defines how many interrupts or pulses per consumed kWh should be generated.
Implementing An Electronic Watt-Hour Meter With MSP430FE42x(A)/FE42x28 SLAA203C–June 2004–Revised April 2009Submit Documentation Feedback
4 Meter Calibration
Interface
Er
ror
K
WkWh
Mains Load
MSP430FE42x(A)/FE42x2
Calibration Terminal:
Switch open: CalibrationSwitch closed: Normal Use
Current Voltage
Live Live
Neutral Neutral
Transmit
ReceiveWs Pulse
www.ti.com Meter Calibration
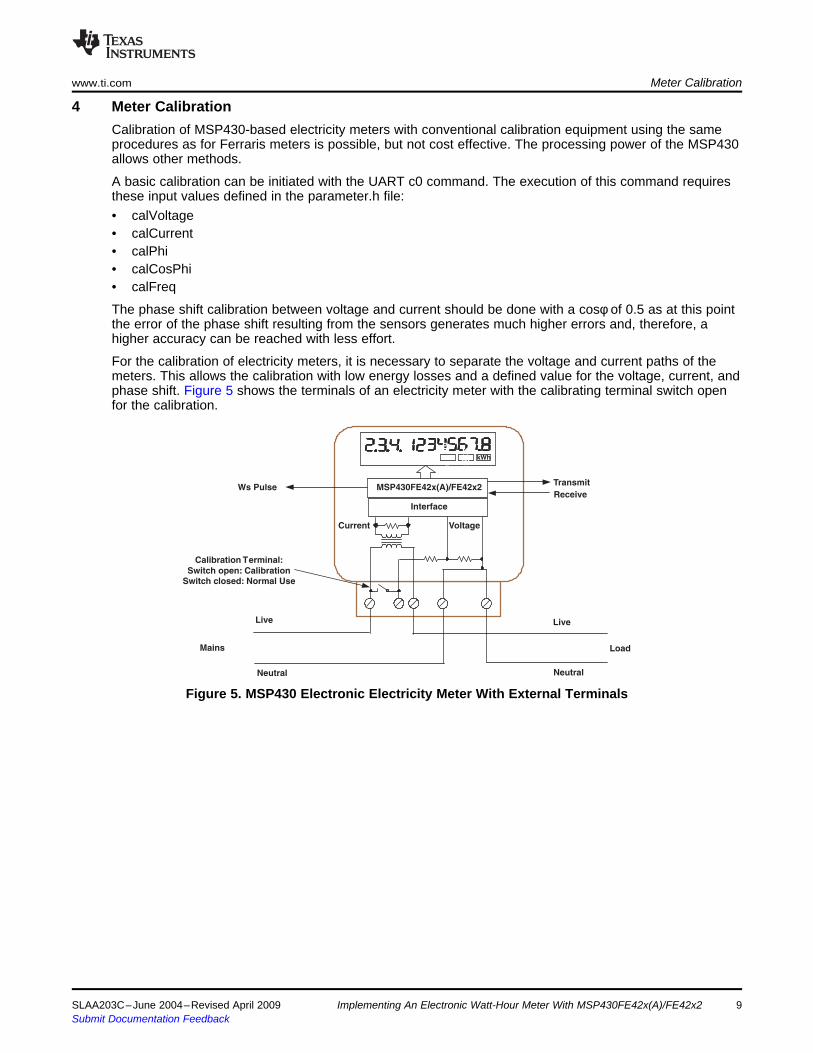
Calibration of MSP430-based electricity meters with conventional calibration equipment using the sameprocedures as for Ferraris meters is possible, but not cost effective. The processing power of the MSP430allows other methods.
A basic calibration can be initiated with the UART c0 command. The execution of this command requiresthese input values defined in the parameter.h file:• calVoltage• calCurrent• calPhi• calCosPhi• calFreq
The phase shift calibration between voltage and current should be done with a cosφ of 0.5 as at this pointthe error of the phase shift resulting from the sensors generates much higher errors and, therefore, ahigher accuracy can be reached with less effort.
For the calibration of electricity meters, it is necessary to separate the voltage and current paths of themeters. This allows the calibration with low energy losses and a defined value for the voltage, current, andphase shift. Figure 5 shows the terminals of an electricity meter with the calibrating terminal switch openfor the calibration.
Figure 5. MSP430 Electronic Electricity Meter With External Terminals
SLAA203C–June 2004–Revised April 2009 Implementing An Electronic Watt-Hour Meter With MSP430FE42x(A)/FE42x2 9Submit Documentation Feedback
4.1 Calibration With Continuous Measurement
4.1.1 Formulas
nHIcalc CZ1 I1HI V1 cos1nper
fmains
fADC
4096[steps2]
nLOcalc CZ1 I1LO V1 cos1nper
fmains
fADC
4096[steps2]
Slope : GAINCORR1 nHIcalc nLOcalc
nHImeas nLOmeas 214
Offset : POFFSET1 nHImeas nLOcalc nLOmeas nHIcalc
nHImeas nLOmeas
fmains
nper
4096fADC
Meter Calibration www.ti.com
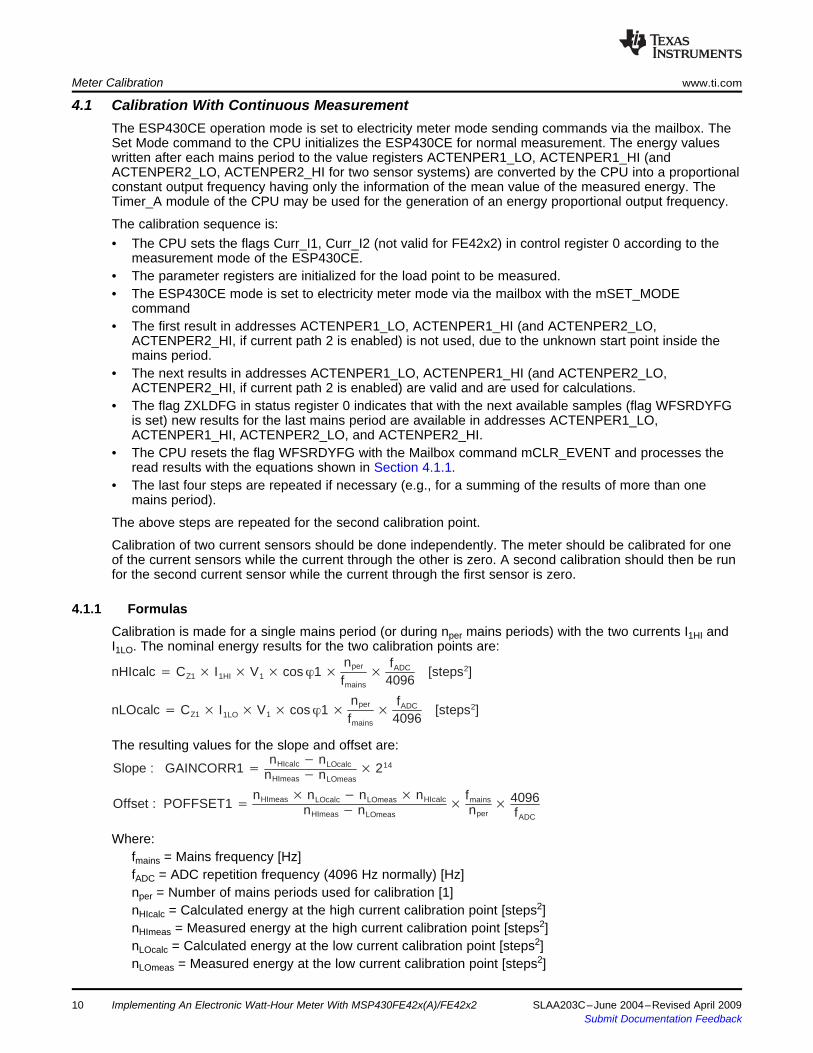
The ESP430CE operation mode is set to electricity meter mode sending commands via the mailbox. TheSet Mode command to the CPU initializes the ESP430CE for normal measurement. The energy valueswritten after each mains period to the value registers ACTENPER1_LO, ACTENPER1_HI (andACTENPER2_LO, ACTENPER2_HI for two sensor systems) are converted by the CPU into a proportionalconstant output frequency having only the information of the mean value of the measured energy. TheTimer_A module of the CPU may be used for the generation of an energy proportional output frequency.
The calibration sequence is:• The CPU sets the flags Curr_I1, Curr_I2 (not valid for FE42x2) in control register 0 according to the
measurement mode of the ESP430CE.• The parameter registers are initialized for the load point to be measured.• The ESP430CE mode is set to electricity meter mode via the mailbox with the mSET_MODE
command• The first result in addresses ACTENPER1_LO, ACTENPER1_HI (and ACTENPER2_LO,
ACTENPER2_HI, if current path 2 is enabled) is not used, due to the unknown start point inside themains period.
• The next results in addresses ACTENPER1_LO, ACTENPER1_HI (and ACTENPER2_LO,ACTENPER2_HI, if current path 2 is enabled) are valid and are used for calculations.
• The flag ZXLDFG in status register 0 indicates that with the next available samples (flag WFSRDYFGis set) new results for the last mains period are available in addresses ACTENPER1_LO,ACTENPER1_HI, ACTENPER2_LO, and ACTENPER2_HI.
• The CPU resets the flag WFSRDYFG with the Mailbox command mCLR_EVENT and processes theread results with the equations shown in Section 4.1.1.
• The last four steps are repeated if necessary (e.g., for a summing of the results of more than onemains period).
The above steps are repeated for the second calibration point.
Calibration of two current sensors should be done independently. The meter should be calibrated for oneof the current sensors while the current through the other is zero. A second calibration should then be runfor the second current sensor while the current through the first sensor is zero.
Calibration is made for a single mains period (or during nper mains periods) with the two currents I1HI andI1LO. The nominal energy results for the two calibration points are:
The resulting values for the slope and offset are:
Where:fmains = Mains frequency [Hz]fADC = ADC repetition frequency (4096 Hz normally) [Hz]nper = Number of mains periods used for calibration [1]nHIcalc = Calculated energy at the high current calibration point [steps2]nHImeas = Measured energy at the high current calibration point [steps2]nLOcalc = Calculated energy at the low current calibration point [steps2]nLOmeas = Measured energy at the low current calibration point [steps2]
Implementing An Electronic Watt-Hour Meter With MSP430FE42x(A)/FE42x210 SLAA203C–June 2004–Revised April 2009Submit Documentation Feedback
4.1.2 Calibration Example
nHIcalc CZ1 I1HI V1 cos1nper
fmains
fADC
4096 29, 322.80806 20 230 1 1
50
20484096
nHIcalc 1, 348, 849.171 14, 94F1h [steps2]
nLOcalc 67, 442.458 1, 0772h
nLOcalc CZ1 I1LO V1 cos1nper
fmains
fADC
4096 29, 322.80806 1 230 1 1
50
20484096
GAINCORR1 nHIcalc nLOcalc
nHImeas nLOmeas 214
14, 94F1h 1, 0772h14, 6040h 1, 0CB7h
214 1.01171 214
40C0h
POFFSET1 nHImeas nLOcalc nLOmeas nHIcalc
nHImeas nLOmeas
fmains
nper
4096fADC
POFFSET1 14, 6040h 1, 0770h 1, 0CB7h 14, 94F1h
14, 6040h 1, 0CB7h
501
40962048
−215,489 FFFC, B63Fh
ncorr (nmeas GAINCORR1) 2−14 POFFSET1
nper
fmains
fADC
4096
nHIcorr (14, 6040h 40C0h) 2−14 FFFC, B63Fh
150
20484096
1, 348, 890 14, 951Ah
nLOcorr (1, 0CB7h 40C0h) 2−14 FFFC, B63Fh
150
20484096
67, 441 1, 0771h
www.ti.com Meter Calibration
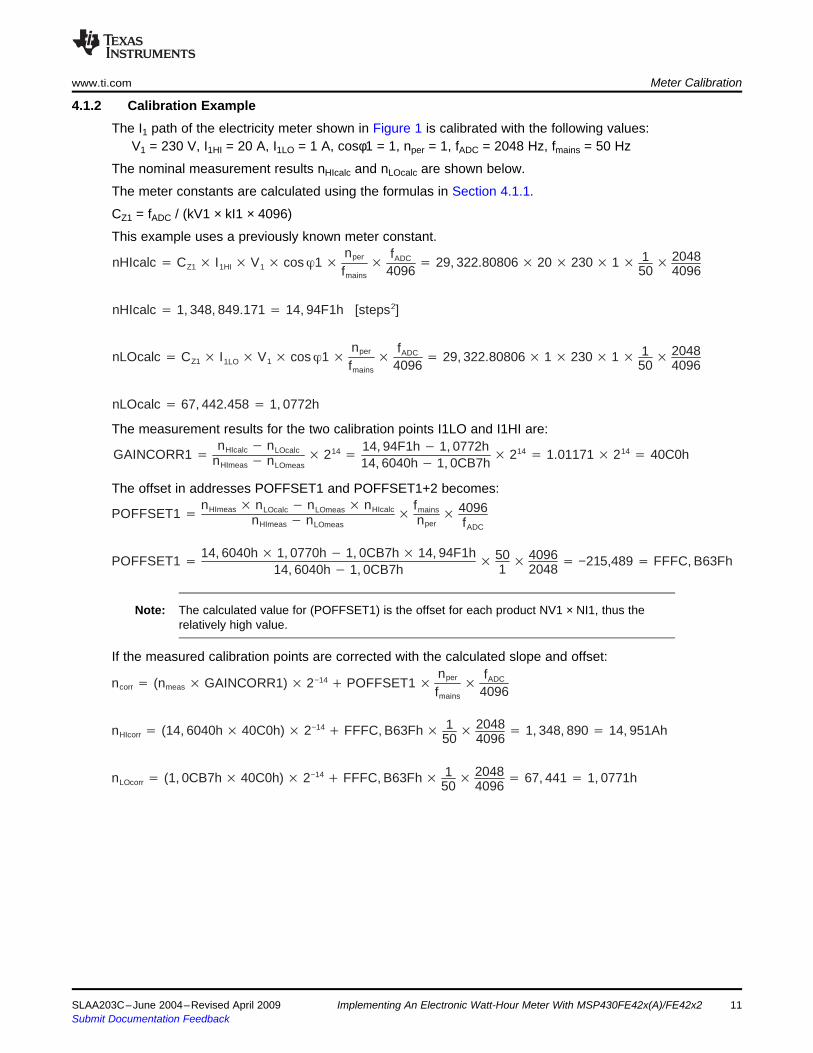
The I1 path of the electricity meter shown in Figure 1 is calibrated with the following values:V1 = 230 V, I1HI = 20 A, I1LO = 1 A, cosφ1 = 1, nper = 1, fADC = 2048 Hz, fmains = 50 Hz
The nominal measurement results nHIcalc and nLOcalc are shown below.
The meter constants are calculated using the formulas in Section 4.1.1.
CZ1 = fADC / (kV1 × kI1 × 4096)
This example uses a previously known meter constant.
The measurement results for the two calibration points I1LO and I1HI are:
The offset in addresses POFFSET1 and POFFSET1+2 becomes:
Note: The calculated value for (POFFSET1) is the offset for each product NV1 × NI1, thus therelatively high value.
If the measured calibration points are corrected with the calculated slope and offset:
SLAA203C–June 2004–Revised April 2009 Implementing An Electronic Watt-Hour Meter With MSP430FE42x(A)/FE42x2 11Submit Documentation Feedback
4.2 Calibration With a Host Computer
Reference Meter
I-
Gen.
V-
Gen.
j
Control
Host
Interface
Reference
Meter 1 Meter 2 Meter nHost Computer
Calibration Equipment
Control
Ws Pulses
Transmit/Receive
(UART or SPI)
n
2n
Meter Calibration www.ti.com
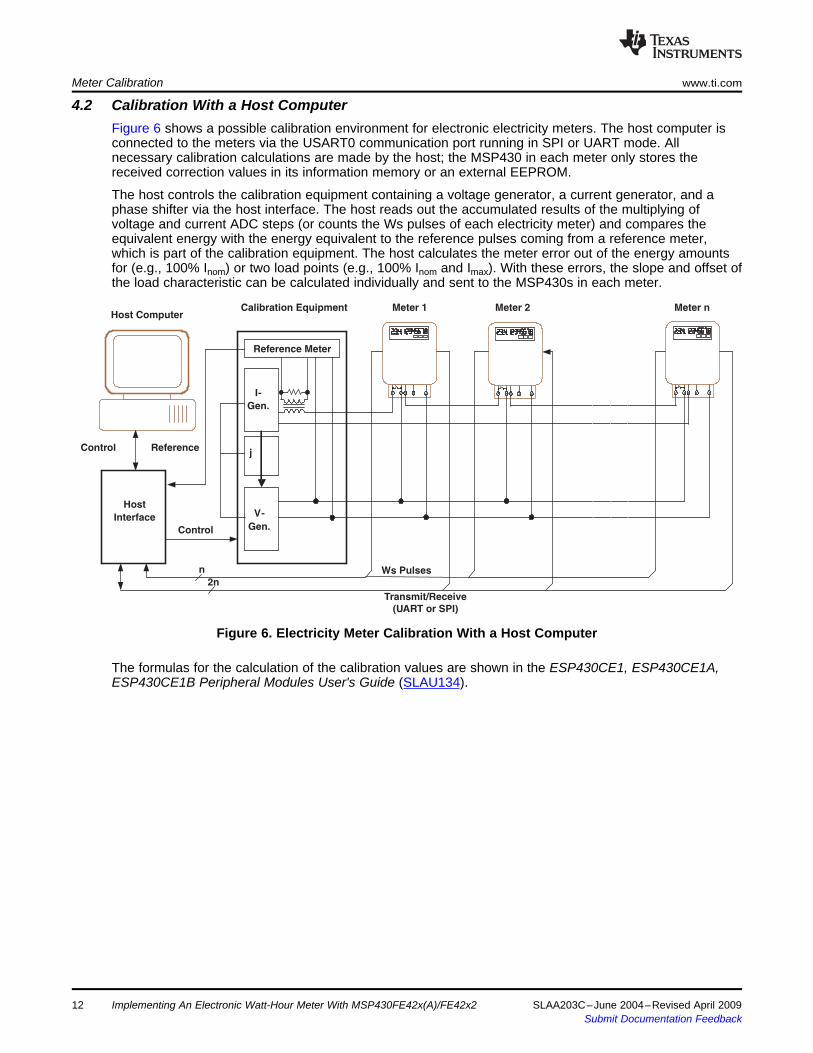
Figure 6 shows a possible calibration environment for electronic electricity meters. The host computer isconnected to the meters via the USART0 communication port running in SPI or UART mode. Allnecessary calibration calculations are made by the host; the MSP430 in each meter only stores thereceived correction values in its information memory or an external EEPROM.
The host controls the calibration equipment containing a voltage generator, a current generator, and aphase shifter via the host interface. The host reads out the accumulated results of the multiplying ofvoltage and current ADC steps (or counts the Ws pulses of each electricity meter) and compares theequivalent energy with the energy equivalent to the reference pulses coming from a reference meter,which is part of the calibration equipment. The host calculates the meter error out of the energy amountsfor (e.g., 100% Inom) or two load points (e.g., 100% Inom and Imax). With these errors, the slope and offset ofthe load characteristic can be calculated individually and sent to the MSP430s in each meter.
Figure 6. Electricity Meter Calibration With a Host Computer
The formulas for the calculation of the calibration values are shown in the ESP430CE1, ESP430CE1A,ESP430CE1B Peripheral Modules User's Guide (SLAU134).
Implementing An Electronic Watt-Hour Meter With MSP430FE42x(A)/FE42x212 SLAA203C–June 2004–Revised April 2009Submit Documentation Feedback
4.3 Self Calibration
Reference Meter
I-
Gen.
V-
Gen.
j
Control
Host
Interface
Reference
Meter 1 Meter 2 Meter nHost Computer
Calibration Equipment
Control
www.ti.com Meter Calibration
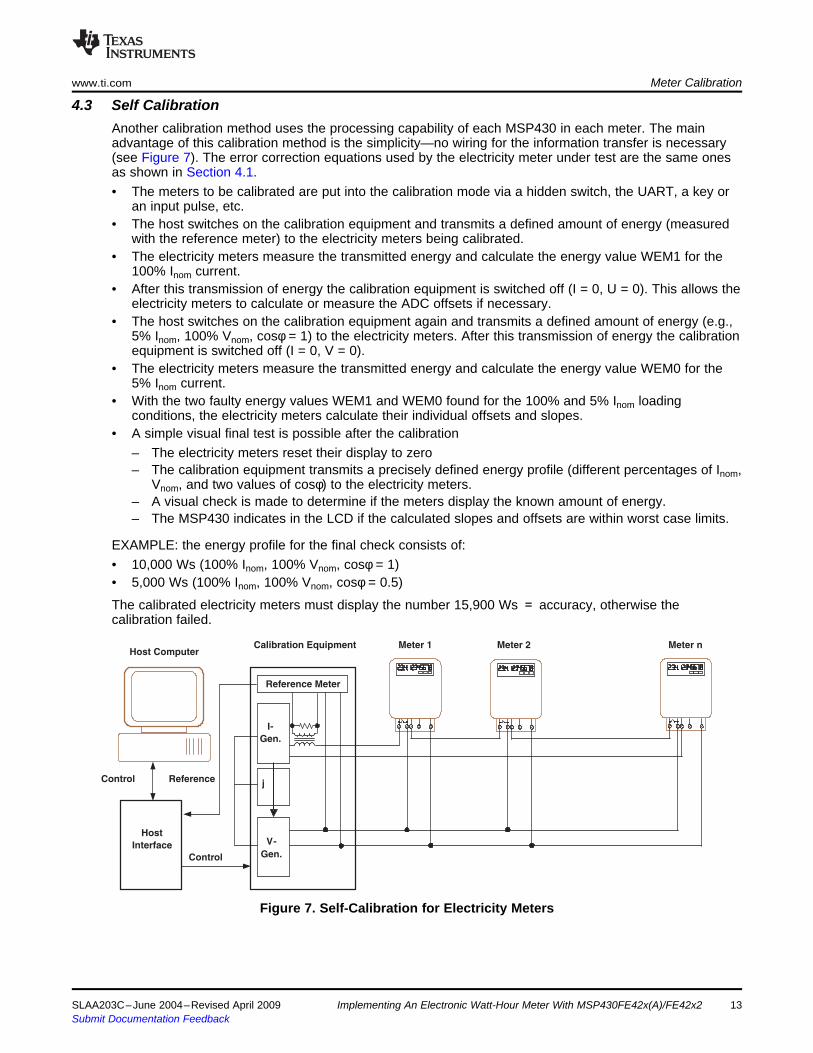
Another calibration method uses the processing capability of each MSP430 in each meter. The mainadvantage of this calibration method is the simplicity—no wiring for the information transfer is necessary(see Figure 7). The error correction equations used by the electricity meter under test are the same onesas shown in Section 4.1.• The meters to be calibrated are put into the calibration mode via a hidden switch, the UART, a key or
an input pulse, etc.• The host switches on the calibration equipment and transmits a defined amount of energy (measured
with the reference meter) to the electricity meters being calibrated.• The electricity meters measure the transmitted energy and calculate the energy value WEM1 for the
100% Inom current.• After this transmission of energy the calibration equipment is switched off (I = 0, U = 0). This allows the
electricity meters to calculate or measure the ADC offsets if necessary.• The host switches on the calibration equipment again and transmits a defined amount of energy (e.g.,
5% Inom, 100% Vnom, cosφ = 1) to the electricity meters. After this transmission of energy the calibrationequipment is switched off (I = 0, V = 0).
• The electricity meters measure the transmitted energy and calculate the energy value WEM0 for the5% Inom current.
• With the two faulty energy values WEM1 and WEM0 found for the 100% and 5% Inom loadingconditions, the electricity meters calculate their individual offsets and slopes.
• A simple visual final test is possible after the calibration– The electricity meters reset their display to zero– The calibration equipment transmits a precisely defined energy profile (different percentages of Inom,
Vnom, and two values of cosφ) to the electricity meters.– A visual check is made to determine if the meters display the known amount of energy.– The MSP430 indicates in the LCD if the calculated slopes and offsets are within worst case limits.
EXAMPLE: the energy profile for the final check consists of:• 10,000 Ws (100% Inom, 100% Vnom, cosφ = 1)• 5,000 Ws (100% Inom, 100% Vnom, cosφ = 0.5)
The calibrated electricity meters must display the number 15,900 Ws = accuracy, otherwise thecalibration failed.
Figure 7. Self-Calibration for Electricity Meters
SLAA203C–June 2004–Revised April 2009 Implementing An Electronic Watt-Hour Meter With MSP430FE42x(A)/FE42x2 13Submit Documentation Feedback
5 Capacitor Power Supply
VoltageRegulator
~230 V 3 V / 4 mA
470 nF /
~200 V
560R / 5W
4.1 V 220 µF
5.1 Power Line Voltage On/Off Detection
Power line
Px.x
Capacitor Power Supply www.ti.com
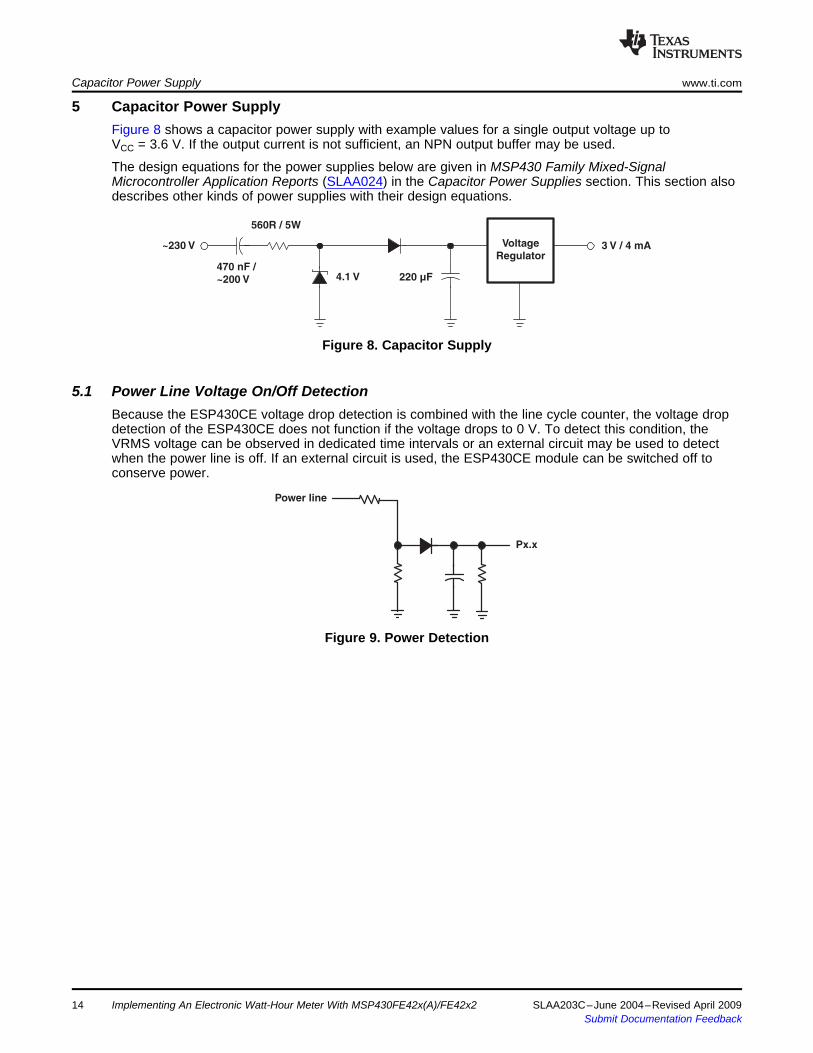
Figure 8 shows a capacitor power supply with example values for a single output voltage up toVCC = 3.6 V. If the output current is not sufficient, an NPN output buffer may be used.
The design equations for the power supplies below are given in MSP430 Family Mixed-SignalMicrocontroller Application Reports (SLAA024) in the Capacitor Power Supplies section. This section alsodescribes other kinds of power supplies with their design equations.
Figure 8. Capacitor Supply
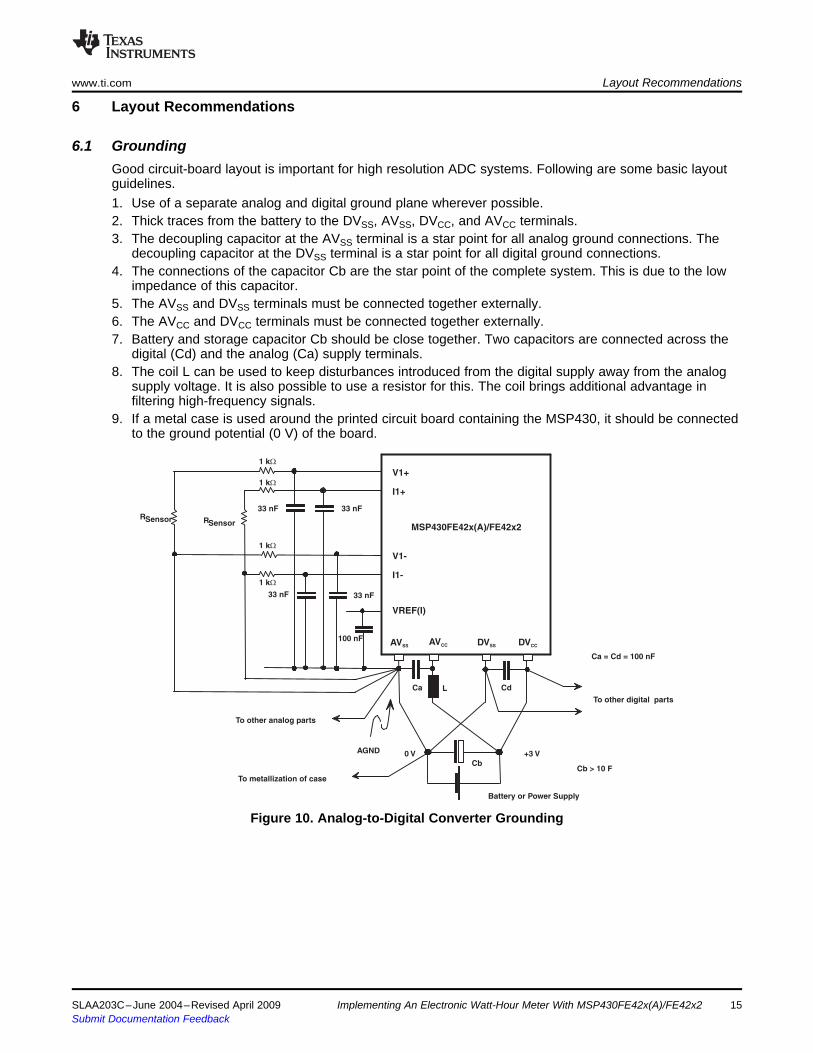
Because the ESP430CE voltage drop detection is combined with the line cycle counter, the voltage dropdetection of the ESP430CE does not function if the voltage drops to 0 V. To detect this condition, theVRMS voltage can be observed in dedicated time intervals or an external circuit may be used to detectwhen the power line is off. If an external circuit is used, the ESP430CE module can be switched off toconserve power.
Figure 9. Power Detection
Implementing An Electronic Watt-Hour Meter With MSP430FE42x(A)/FE42x214 SLAA203C–June 2004–Revised April 2009Submit Documentation Feedback
6 Layout Recommendations
6.1 Grounding
AVSS
V1-
I1-
MSP430FE42x(A)/FE42x2
+3 V
To other digital parts
DVSSAVCC DVCC
0 VAGND
To other analog parts
L CdCa
Cb
Battery or Power Supply
To metallization of case
VREF(I)
100 nF
Ca = Cd = 100 nF
Cb > 10 F
V1+
I1+
33 nF 33 nF
RSensor
33 nF 33 nF
RSensor
1 kW
1 kW
1 kW
1 kW
www.ti.com Layout Recommendations
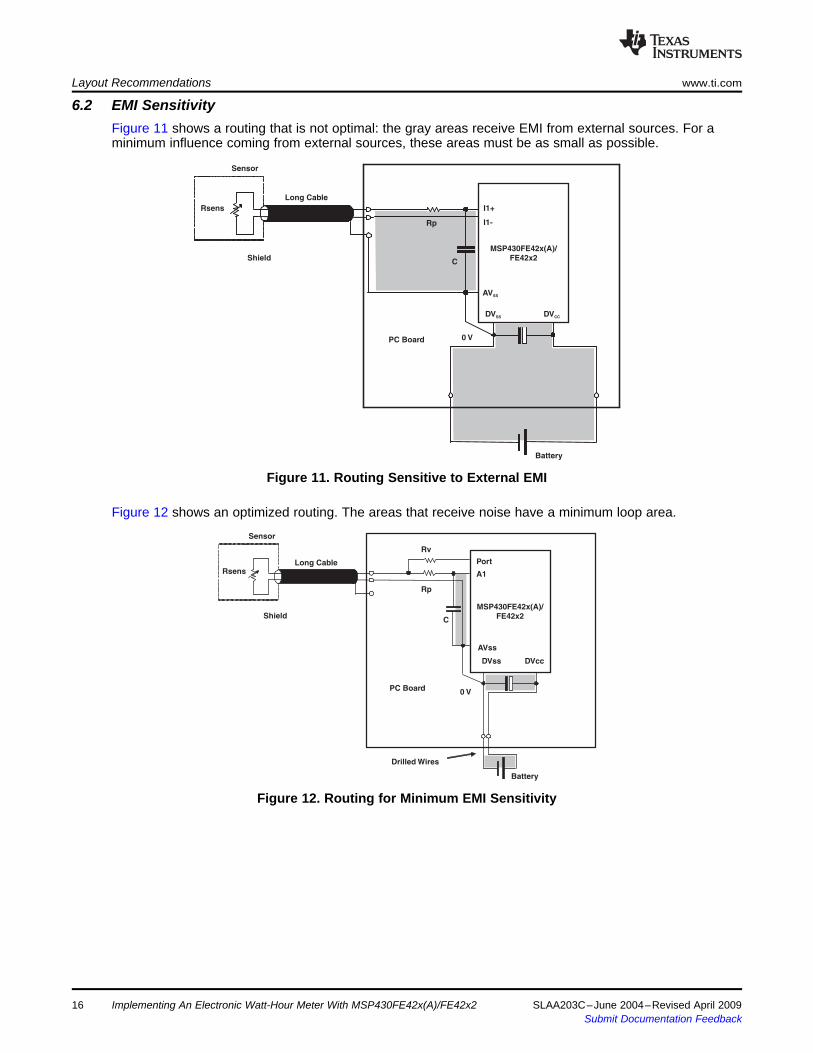
Good circuit-board layout is important for high resolution ADC systems. Following are some basic layoutguidelines.1. Use of a separate analog and digital ground plane wherever possible.2. Thick traces from the battery to the DVSS, AVSS, DVCC, and AVCC terminals.3. The decoupling capacitor at the AVSS terminal is a star point for all analog ground connections. The
decoupling capacitor at the DVSS terminal is a star point for all digital ground connections.4. The connections of the capacitor Cb are the star point of the complete system. This is due to the low
impedance of this capacitor.5. The AVSS and DVSS terminals must be connected together externally.6. The AVCC and DVCC terminals must be connected together externally.7. Battery and storage capacitor Cb should be close together. Two capacitors are connected across the
digital (Cd) and the analog (Ca) supply terminals.8. The coil L can be used to keep disturbances introduced from the digital supply away from the analog
supply voltage. It is also possible to use a resistor for this. The coil brings additional advantage infiltering high-frequency signals.
9. If a metal case is used around the printed circuit board containing the MSP430, it should be connectedto the ground potential (0 V) of the board.
Figure 10. Analog-to-Digital Converter Grounding
SLAA203C–June 2004–Revised April 2009 Implementing An Electronic Watt-Hour Meter With MSP430FE42x(A)/FE42x2 15Submit Documentation Feedback
6.2 EMI Sensitivity
DVSS DVCC
AVSS
I1+
MSP430FE42x(A)/FE42x2
0 V
Rsens
Rp
C
Long Cable
Shield
PC Board
Battery
Sensor
I1-
DVss DVcc
AVss
Port
A1
MSP430FE42x(A)/FE42x2
0 V
Rv
Rsens
Rp
C
Long Cable
Shield
PC Board
Battery
Sensor
Drilled Wires
Layout Recommendations www.ti.com
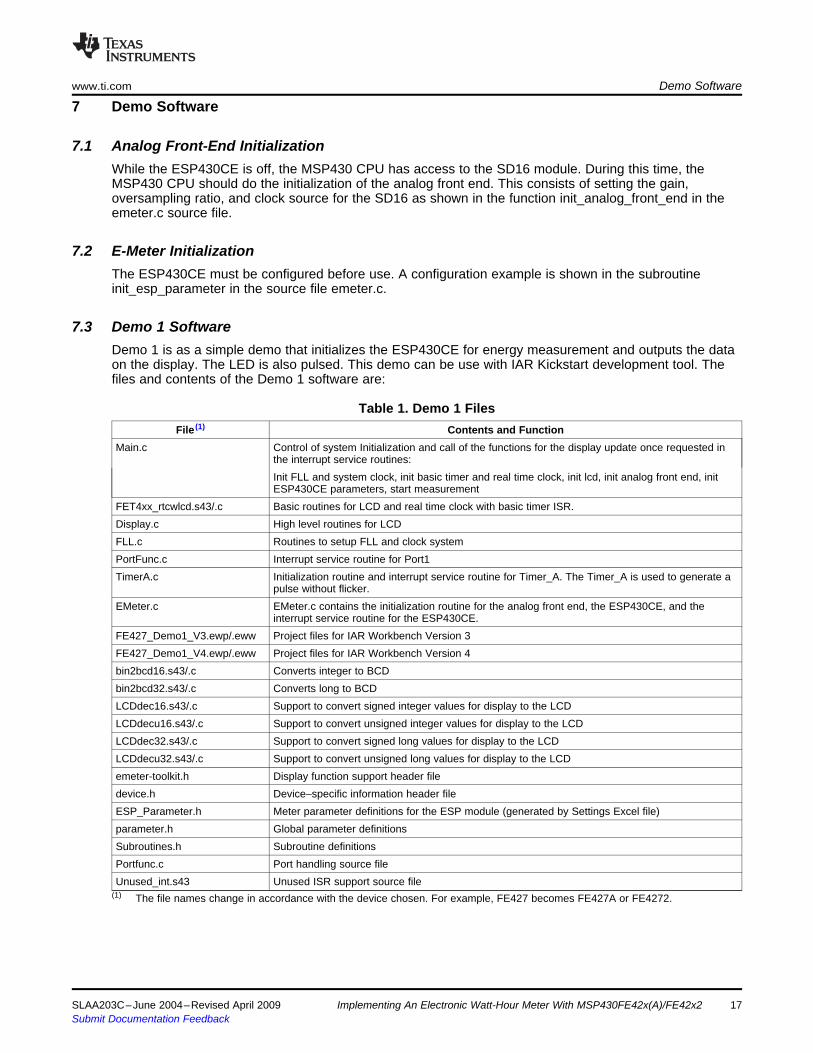
Figure 11 shows a routing that is not optimal: the gray areas receive EMI from external sources. For aminimum influence coming from external sources, these areas must be as small as possible.
Figure 11. Routing Sensitive to External EMI
Figure 12 shows an optimized routing. The areas that receive noise have a minimum loop area.
Figure 12. Routing for Minimum EMI Sensitivity
Implementing An Electronic Watt-Hour Meter With MSP430FE42x(A)/FE42x216 SLAA203C–June 2004–Revised April 2009Submit Documentation Feedback
7 Demo Software
7.1 Analog Front-End Initialization
7.2 E-Meter Initialization
7.3 Demo 1 Software
www.ti.com Demo Software
While the ESP430CE is off, the MSP430 CPU has access to the SD16 module. During this time, theMSP430 CPU should do the initialization of the analog front end. This consists of setting the gain,oversampling ratio, and clock source for the SD16 as shown in the function init_analog_front_end in theemeter.c source file.
The ESP430CE must be configured before use. A configuration example is shown in the subroutineinit_esp_parameter in the source file emeter.c.
Demo 1 is as a simple demo that initializes the ESP430CE for energy measurement and outputs the dataon the display. The LED is also pulsed. This demo can be use with IAR Kickstart development tool. Thefiles and contents of the Demo 1 software are:
Table 1. Demo 1 FilesFile (1) Contents and Function
Main.c Control of system Initialization and call of the functions for the display update once requested inthe interrupt service routines:Init FLL and system clock, init basic timer and real time clock, init lcd, init analog front end, initESP430CE parameters, start measurement
FET4xx_rtcwlcd.s43/.c Basic routines for LCD and real time clock with basic timer ISR.Display.c High level routines for LCDFLL.c Routines to setup FLL and clock systemPortFunc.c Interrupt service routine for Port1TimerA.c Initialization routine and interrupt service routine for Timer_A. The Timer_A is used to generate a
pulse without flicker.EMeter.c EMeter.c contains the initialization routine for the analog front end, the ESP430CE, and the
interrupt service routine for the ESP430CE.FE427_Demo1_V3.ewp/.eww Project files for IAR Workbench Version 3FE427_Demo1_V4.ewp/.eww Project files for IAR Workbench Version 4bin2bcd16.s43/.c Converts integer to BCDbin2bcd32.s43/.c Converts long to BCDLCDdec16.s43/.c Support to convert signed integer values for display to the LCDLCDdecu16.s43/.c Support to convert unsigned integer values for display to the LCDLCDdec32.s43/.c Support to convert signed long values for display to the LCDLCDdecu32.s43/.c Support to convert unsigned long values for display to the LCDemeter-toolkit.h Display function support header filedevice.h Device–specific information header fileESP_Parameter.h Meter parameter definitions for the ESP module (generated by Settings Excel file)parameter.h Global parameter definitionsSubroutines.h Subroutine definitionsPortfunc.c Port handling source fileUnused_int.s43 Unused ISR support source file
(1) The file names change in accordance with the device chosen. For example, FE427 becomes FE427A or FE4272.
SLAA203C–June 2004–Revised April 2009 Implementing An Electronic Watt-Hour Meter With MSP430FE42x(A)/FE42x2 17Submit Documentation Feedback
Init System
Init ESP
StartMeasurement
RTCInterrupt
Exit
ESP Interrupt
Dump Valuesinitiate additional
Calculations
Toggle Poweroutput LED
Background Foreground
Update Display
Check Port
Process UART
Exit
UART Interrupt
Add received Charto buffer
Switch CPU toactive Mode if
Frame received
Exit
Port Interrupt
Check Port Flags
Switch CPU toactive Mode
Exit
Update Clock
Switch CPU toactive Mode if
Display Update isrequested
Set CPU to LowPower Mode
7.4 Energy Pulse Generation
7.4.1 Direct Output With Interrupt Level
7.4.2 Timer_A Output
Demo Software www.ti.com
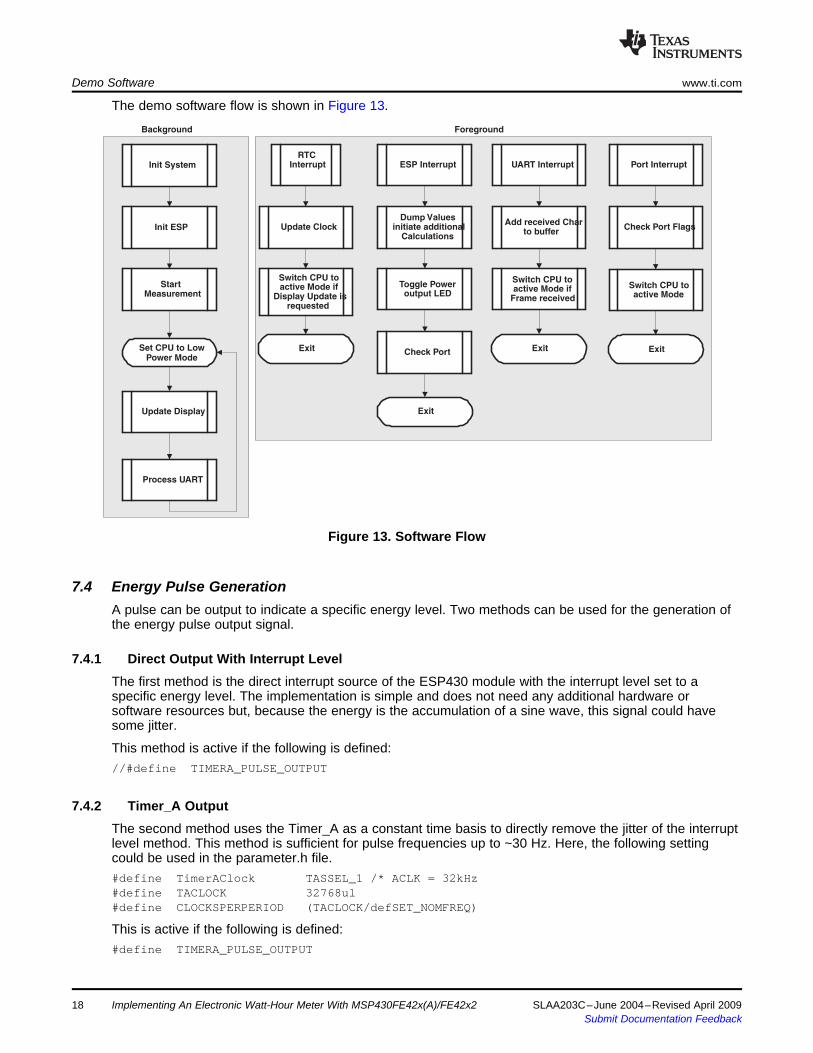
The demo software flow is shown in Figure 13.
Figure 13. Software Flow
A pulse can be output to indicate a specific energy level. Two methods can be used for the generation ofthe energy pulse output signal.
The first method is the direct interrupt source of the ESP430 module with the interrupt level set to aspecific energy level. The implementation is simple and does not need any additional hardware orsoftware resources but, because the energy is the accumulation of a sine wave, this signal could havesome jitter.
This method is active if the following is defined://#define TIMERA_PULSE_OUTPUT
The second method uses the Timer_A as a constant time basis to directly remove the jitter of the interruptlevel method. This method is sufficient for pulse frequencies up to ~30 Hz. Here, the following settingcould be used in the parameter.h file.#define TimerAClock TASSEL_1 /* ACLK = 32kHz#define TACLOCK 32768ul#define CLOCKSPERPERIOD (TACLOCK/defSET_NOMFREQ)
This is active if the following is defined:#define TIMERA_PULSE_OUTPUT
Implementing An Electronic Watt-Hour Meter With MSP430FE42x(A)/FE42x218 SLAA203C–June 2004–Revised April 2009Submit Documentation Feedback
7.5 Temperature Compensation for CT Phase Shift
7.6 Controls
7.6.1 Parameter.h file
www.ti.com Demo Software
The ESP430 can measure device temperature using the integrated temperature sensor. The MSP430CPU can update the ESP430 parameters accordingly without stopping the operation of the ESP. This canbe used to provide a change in the phase shift parameter for a current transformer based on themeasured temperature using a coefficient table.
This functionality is enabled in the demo software by defining:#define withTempCorrection
in the parameter.h file and setting the correct values of the correction either with the function:#define PHI_Temp_Ratio 0.01 /* 0.01 Degree Phase shift per 1 Degree C */
/* From CT Datasheet *//* if this is not linear it could be modified or/* entered directly in the emeter.c file */
or by modifying the function in the emeter.c file.
The two buttons are used for following functions:• S_A: Switch the ESP430CE off and set the MSP430 into low power mode. The real-time clock
continues to run.• S_B: Selects one of various evaluated parameters by the ESP430 for display.
All configuration settings are done within the parameter.h file including the settings for:• Pulse output level• Voltage and current ratio• Configuration settings for the ESP430CE
The #defines for withUARTComm, withCalibration, and withDisplay allow scaling the code for differentfunction and sizes. The code uses floating point functions for these functions and including any one ofthem increases the code size.
Commenting or uncommenting of the following line in the parameter.h file configures the software to use ashunt or CT on the I1 input:#define shunt
To do a precalculation of the parameters, the following formulas can be used:• defVRatio = kV1 / 1000 (for kV1 see Section 3.1)• defIRatio = kI1 / 1000 (for kI1 see Section 3.2)• defEnergyRatio = (defVRatio × defIRatio)
For an easier calculation of the main parameters defined in the parameter.h file, the Excel filesFE427_Settings.xls, FE427A_Settings.xls, or FE4272_Settings.xls could be used. After entering therequired information into the white colored cells, the parameters are calculated and displayed. By clickingthe Save Parameter to File button, the parameters are saved into the file 'ESP_Parameter.h'.
This file with the calculated parameters should be included in the source directory. Section 7.6.2 describesthe usage of the Settings Excel file (see the Excel sheet that is included with the source code).
SLAA203C–June 2004–Revised April 2009 Implementing An Electronic Watt-Hour Meter With MSP430FE42x(A)/FE42x2 19Submit Documentation Feedback
7.6.2 Using Settings Excel file
7.7 Demo 2
7.7.1 UART Communication
Demo Software www.ti.com
Enter values into the white and blue colored cells as needed to meet application-specific requirements forthe meter. Blue cells are dropdown boxes that contain fixed selections. Yellow cells provide informationand intermediate calculation results. Green cells provide the calculated parameters for use by the ESP430based on the application-specific user inputs for the energy meter design.
Clicking the 'Save Parameters to File' button saves the parameters in green cells to the file'ESP_Parameter.h'. This header file must be copied into the source file folder of the applicableMSP430FE427(A)/FE4272 demo project.
Note: If the Calculation values in the Hex columns are not updated in the spreadsheet, verify thatthe "Analysis ToolPak" is installed and enabled under the Tools | Add-Ins... menu.
Demo 2 is setup as a complex application including UART communication and some auto-calibrationroutines that store the parameters back into the flash memory. For the energy calculation, the energyvalues reported from the ESP430CE are used instead of the interrupt level function. The initialization ofthe ESP430CE, the data output on the display, and the LED usage is included as in the Demo 1. Demo 2is too large to be used with IAR KickStart version, and the full version must be used.
Demo 2 contains all the files in Demo 1 plus the files shown in Table 2:
Table 2. Demo 2 Additional FilesFile Contents and FunctionUART0.c Interrupt handler for UART receivecomms_uart.c UART communication routines
• Init UART• UART send functions• UART receive function: Process_UART (This routine processes a received UART command.)
SendData.c Conversion routines for the data which should be sent by the UARTcalibration.c Some simple calibration functions which could be used to do a basic calibration. These functions are
executed by commands sent via the UART.flash_xxxx.c Files used to erase, write, and replace information in the MSP430 flash memory space
The baud rate is 57600, 8N1. Each command should be terminated with a carriage return 'CR'.
The 'h' command displays the help list in the terminal window, as shown below.MSP430FE427/FE427A/FE4272 Firmware Version: xxxxUART Commands:SHxx: set hourSMxx: set minutesSSxx: set secondsSDxx: set daySOxx: set monthSYxx: set yearSIxx: set calibration currentSVxx: set calibration voltage
20 Implementing An Electronic Watt-Hour Meter With MSP430FE42x(A)/FE42x2 SLAA203C–June 2004–Revised April 2009Submit Documentation Feedback
www.ti.com Demo Software
Dx: Set Display mode1: Off2: Time3: Date4: Voltage (V)5: Current (A)6: Peak Voltage (V)7: Peak Current (A)8: Frequency (Hz)9: CosPhi10: Temp11: Power (kW)12: Energy (kWh)
Vx: Value of single measurement1: Off2: Time3: Date4: Voltage (V)5: Current (A)6: Peak Voltage (V)7: Peak Current (A)8: Frequency (Hz)9: CosPhi10: Temp11: Power (kW)12: Energy (kWh)
H : Show help testTx: Set test dump modeQx: Query dumpR : Reset systemWxx: Write message to LCD displayMx: Execute calibration measurement over x*50 cyclesI : InitC0: auto calibration of U / I / P / Phase ShiftC1: calibration of Interrupt LevelC2: calibration of Phase correction 1C3: calibration of Phase correction 2C4: calibration of V1 OffsetC5: calibration of I1 OffsetC6: calibration of I2 OffsetC7: calibration of Gain correction 1C8: calibration of Gain correction 2C9: save settings to flashC10: calibration of V RatioC11: calibration of I RatioC12: calibration of Energy RatioC13: calibration of Power1 offsetC14: calibration of Power2 offset+xxx: inc values for calibration-xxx: dec values for calibration
SLAA203C–June 2004–Revised April 2009 Implementing An Electronic Watt-Hour Meter With MSP430FE42x(A)/FE42x2 21Submit Documentation Feedback
7.7.2 Calibration
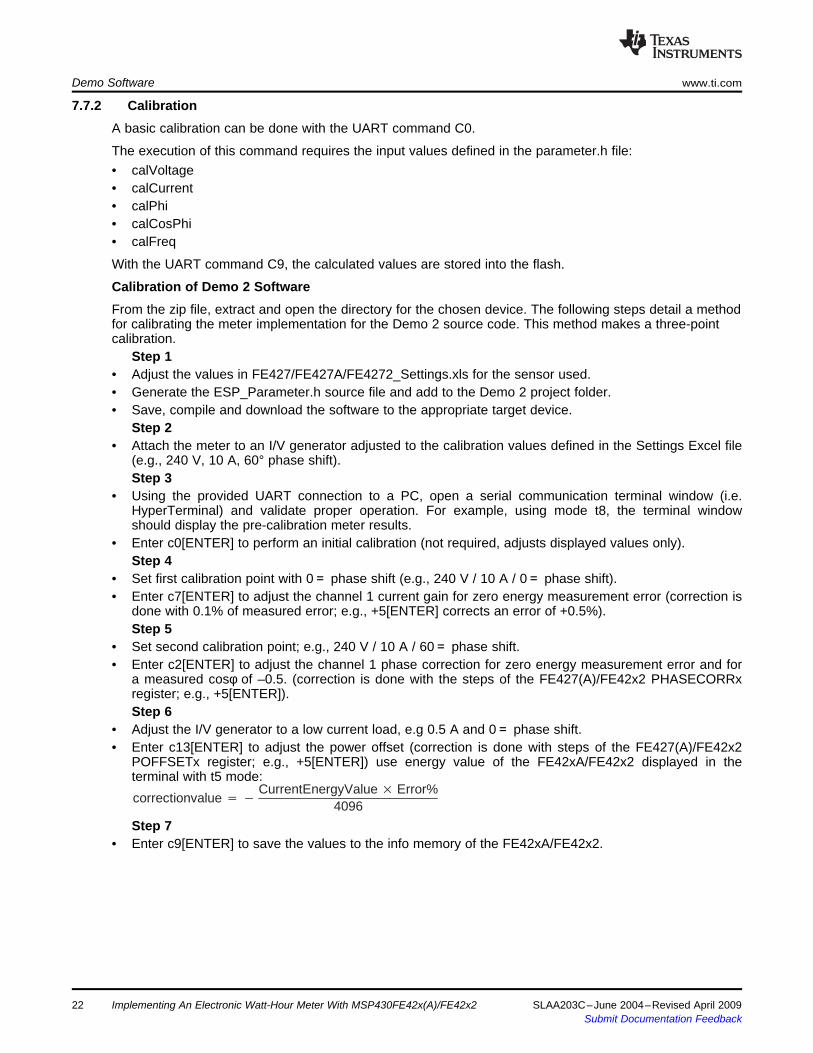
correctionvalue CurrentEnergyValue Error%
4096
Demo Software www.ti.com
A basic calibration can be done with the UART command C0.
The execution of this command requires the input values defined in the parameter.h file:• calVoltage• calCurrent• calPhi• calCosPhi• calFreq
With the UART command C9, the calculated values are stored into the flash.
Calibration of Demo 2 SoftwareFrom the zip file, extract and open the directory for the chosen device. The following steps detail a methodfor calibrating the meter implementation for the Demo 2 source code. This method makes a three-pointcalibration.
Step 1• Adjust the values in FE427/FE427A/FE4272_Settings.xls for the sensor used.• Generate the ESP_Parameter.h source file and add to the Demo 2 project folder.• Save, compile and download the software to the appropriate target device.
Step 2• Attach the meter to an I/V generator adjusted to the calibration values defined in the Settings Excel file
(e.g., 240 V, 10 A, 60° phase shift).Step 3
• Using the provided UART connection to a PC, open a serial communication terminal window (i.e.HyperTerminal) and validate proper operation. For example, using mode t8, the terminal windowshould display the pre-calibration meter results.
• Enter c0[ENTER] to perform an initial calibration (not required, adjusts displayed values only).Step 4
• Set first calibration point with 0= phase shift (e.g., 240 V / 10 A / 0= phase shift).• Enter c7[ENTER] to adjust the channel 1 current gain for zero energy measurement error (correction is
done with 0.1% of measured error; e.g., +5[ENTER] corrects an error of +0.5%).Step 5
• Set second calibration point; e.g., 240 V / 10 A / 60= phase shift.• Enter c2[ENTER] to adjust the channel 1 phase correction for zero energy measurement error and for
a measured cosφ of –0.5. (correction is done with the steps of the FE427(A)/FE42x2 PHASECORRxregister; e.g., +5[ENTER]).Step 6
• Adjust the I/V generator to a low current load, e.g 0.5 A and 0= phase shift.• Enter c13[ENTER] to adjust the power offset (correction is done with steps of the FE427(A)/FE42x2
POFFSETx register; e.g., +5[ENTER]) use energy value of the FE42xA/FE42x2 displayed in theterminal with t5 mode:
Step 7• Enter c9[ENTER] to save the values to the info memory of the FE42xA/FE42x2.
22 Implementing An Electronic Watt-Hour Meter With MSP430FE42x(A)/FE42x2 SLAA203C–June 2004–Revised April 2009Submit Documentation Feedback
correctionvalue CurrentEnergyValue Error%
4096
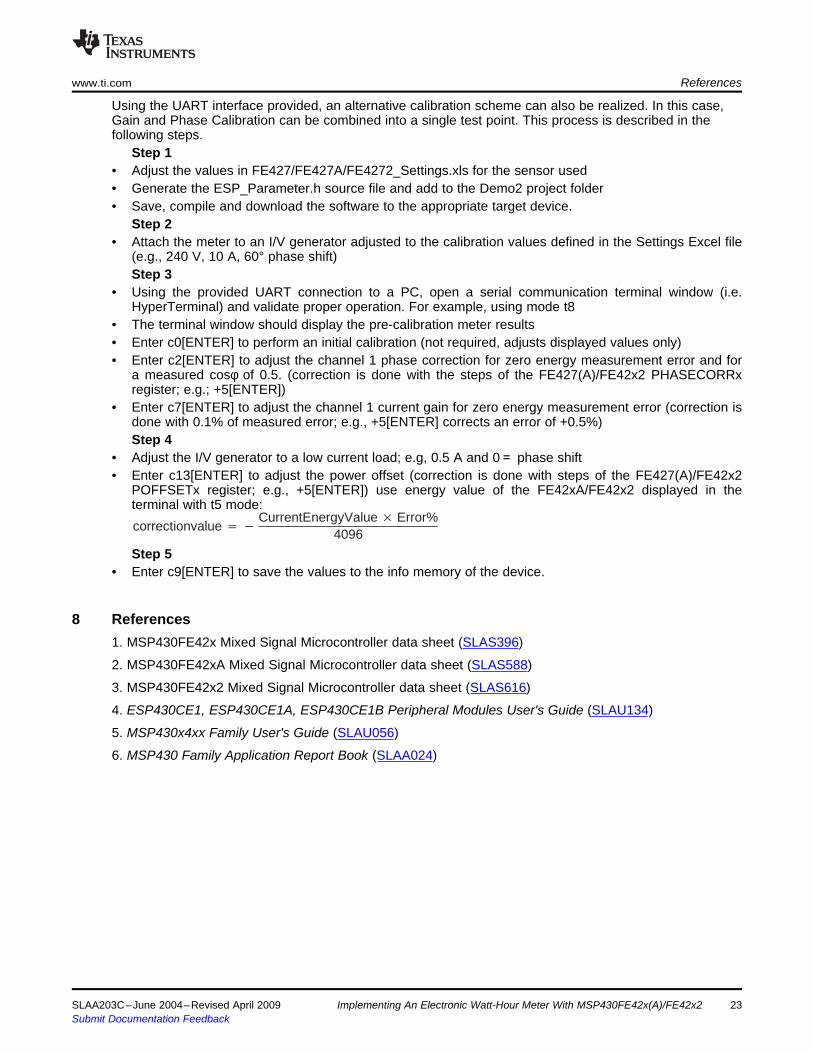
8 References
www.ti.com References
Using the UART interface provided, an alternative calibration scheme can also be realized. In this case,Gain and Phase Calibration can be combined into a single test point. This process is described in thefollowing steps.
Step 1• Adjust the values in FE427/FE427A/FE4272_Settings.xls for the sensor used• Generate the ESP_Parameter.h source file and add to the Demo2 project folder• Save, compile and download the software to the appropriate target device.
Step 2• Attach the meter to an I/V generator adjusted to the calibration values defined in the Settings Excel file
(e.g., 240 V, 10 A, 60° phase shift)Step 3
• Using the provided UART connection to a PC, open a serial communication terminal window (i.e.HyperTerminal) and validate proper operation. For example, using mode t8
• The terminal window should display the pre-calibration meter results• Enter c0[ENTER] to perform an initial calibration (not required, adjusts displayed values only)• Enter c2[ENTER] to adjust the channel 1 phase correction for zero energy measurement error and for
a measured cosφ of 0.5. (correction is done with the steps of the FE427(A)/FE42x2 PHASECORRxregister; e.g.; +5[ENTER])
• Enter c7[ENTER] to adjust the channel 1 current gain for zero energy measurement error (correction isdone with 0.1% of measured error; e.g., +5[ENTER] corrects an error of +0.5%)Step 4
• Adjust the I/V generator to a low current load; e.g, 0.5 A and 0= phase shift• Enter c13[ENTER] to adjust the power offset (correction is done with steps of the FE427(A)/FE42x2
POFFSETx register; e.g., +5[ENTER]) use energy value of the FE42xA/FE42x2 displayed in theterminal with t5 mode:
Step 5• Enter c9[ENTER] to save the values to the info memory of the device.
1. MSP430FE42x Mixed Signal Microcontroller data sheet (SLAS396)
2. MSP430FE42xA Mixed Signal Microcontroller data sheet (SLAS588)
3. MSP430FE42x2 Mixed Signal Microcontroller data sheet (SLAS616)
4. ESP430CE1, ESP430CE1A, ESP430CE1B Peripheral Modules User's Guide (SLAU134)
5. MSP430x4xx Family User's Guide (SLAU056)
6. MSP430 Family Application Report Book (SLAA024)
SLAA203C–June 2004–Revised April 2009 Implementing An Electronic Watt-Hour Meter With MSP430FE42x(A)/FE42x2 23Submit Documentation Feedback
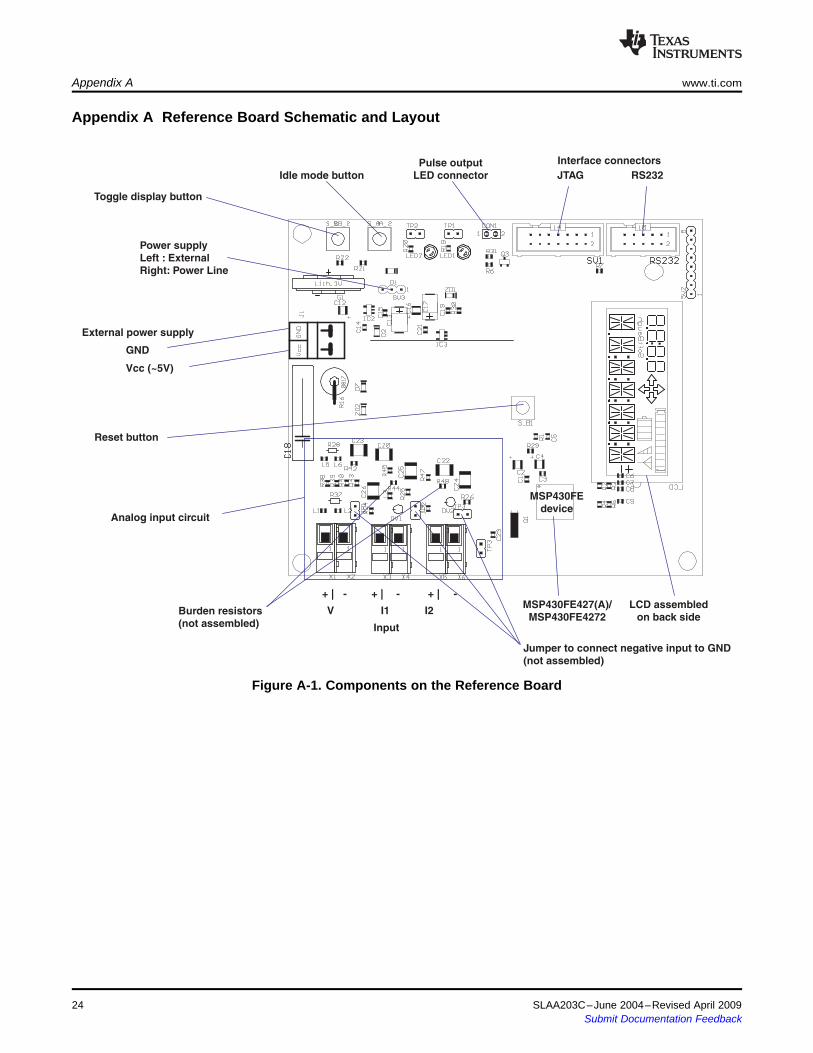
Appendix A Reference Board Schematic and Layout
Reset button
Idle mode button
Power supplyLeft : ExternalRight: Power Line
Pulse outputLED connector JTAG RS232
Interface connectors
+ | - + | - + | -
V I1 I2
Input
External power supply
GND
Vcc (~5V)
LCD assembledon back side
Toggle display button
Analog input circuit
MSP430FE427(A)/FE4272MSP430
Burden resistors(not assembled)
Jumper to connect negative input to GND(not assembled)
MSP430FEdevice
Appendix A www.ti.com
Figure A-1. Components on the Reference Board
24 SLAA203C–June 2004–Revised April 2009Submit Documentation Feedback
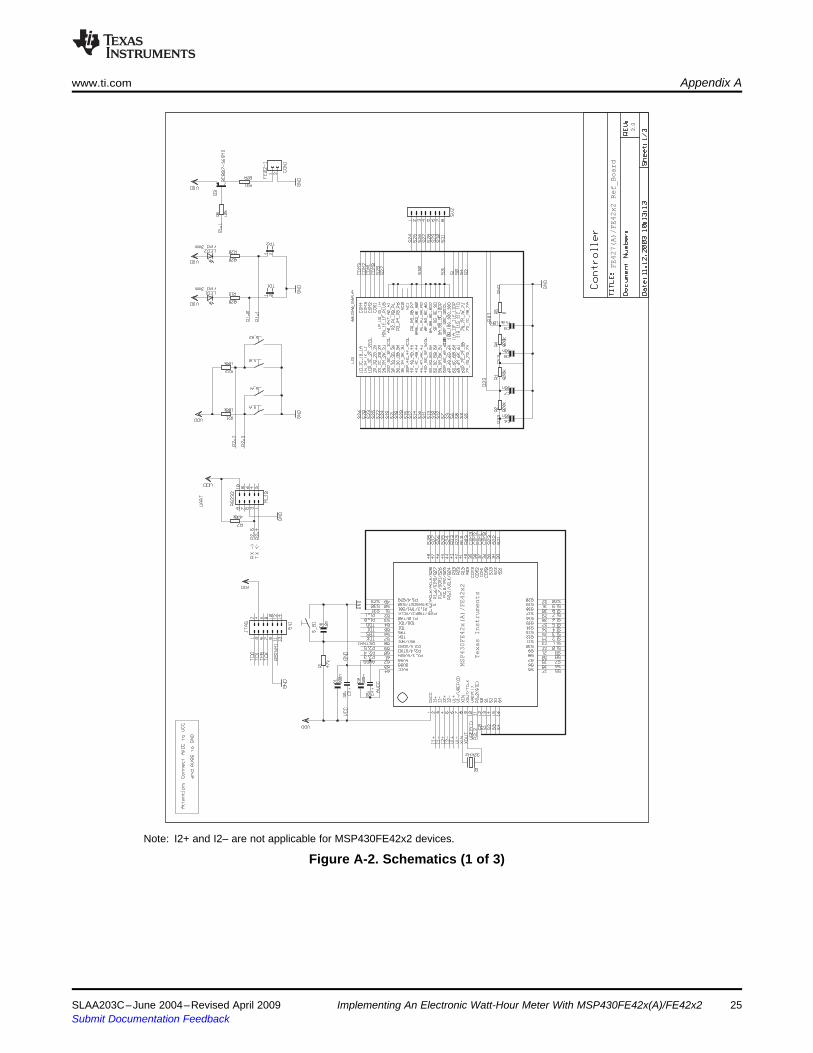
MSP430FE42x(A)/FE42x2
Texas Instruments
FE427(A)/FE42x2 Ref_Board
www.ti.com Appendix A
Note: I2+ and I2– are not applicable for MSP430FE42x2 devices.
Figure A-2. Schematics (1 of 3)
SLAA203C–June 2004–Revised April 2009 Implementing An Electronic Watt-Hour Meter With MSP430FE42x(A)/FE42x2 25Submit Documentation Feedback
FE427(A)/FE42x2 Ref_Board
Appendix A www.ti.com
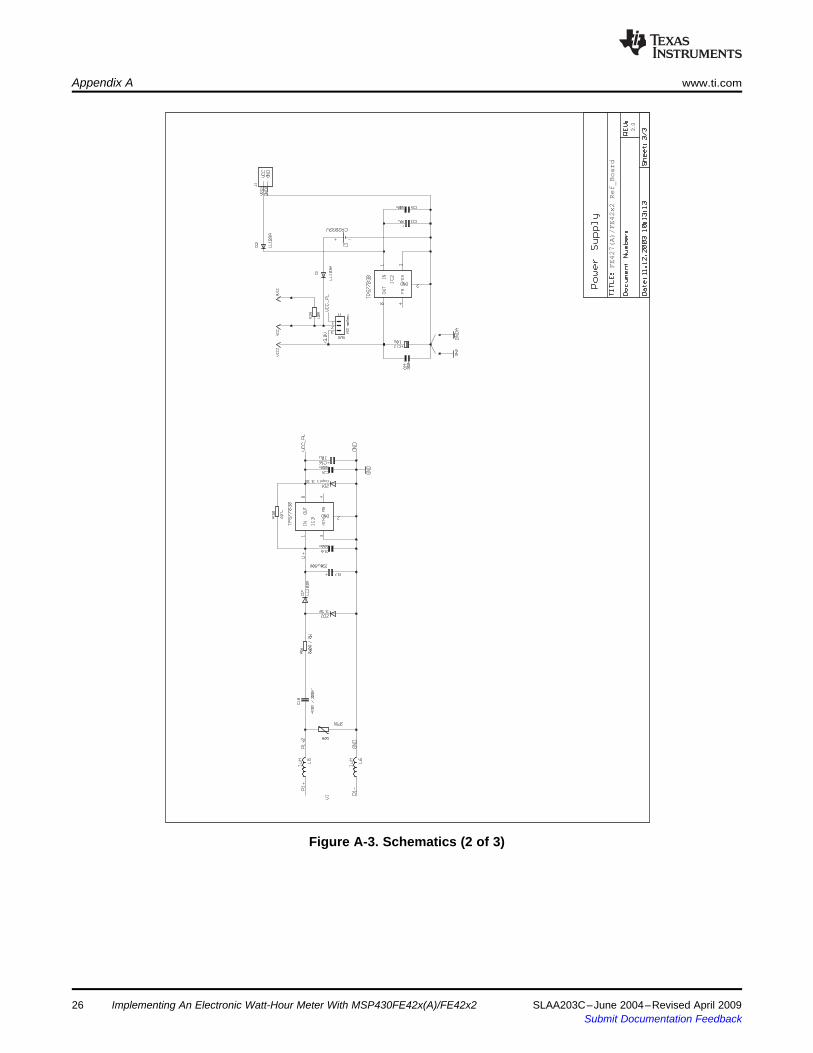
Figure A-3. Schematics (2 of 3)
Implementing An Electronic Watt-Hour Meter With MSP430FE42x(A)/FE42x226 SLAA203C–June 2004–Revised April 2009Submit Documentation Feedback
FE427(A)/FE42x2 Ref_Board
www.ti.com Appendix A
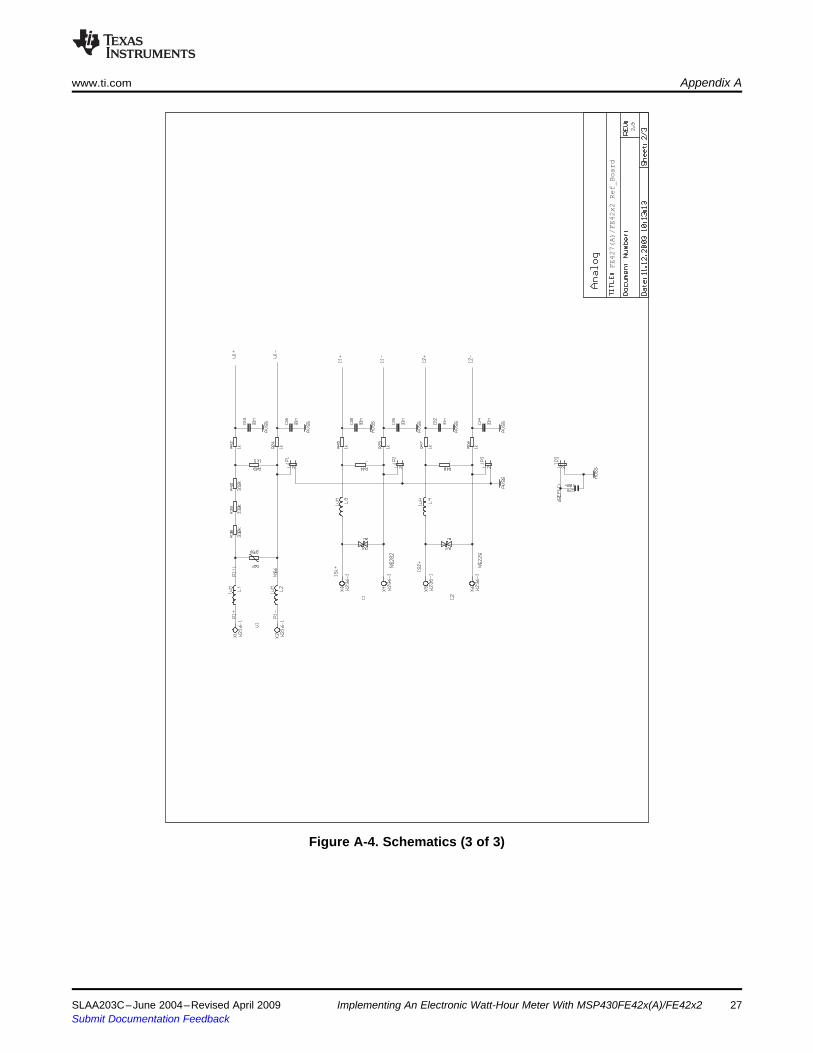
Figure A-4. Schematics (3 of 3)
SLAA203C–June 2004–Revised April 2009 Implementing An Electronic Watt-Hour Meter With MSP430FE42x(A)/FE42x2 27Submit Documentation Feedback
Appendix A www.ti.com
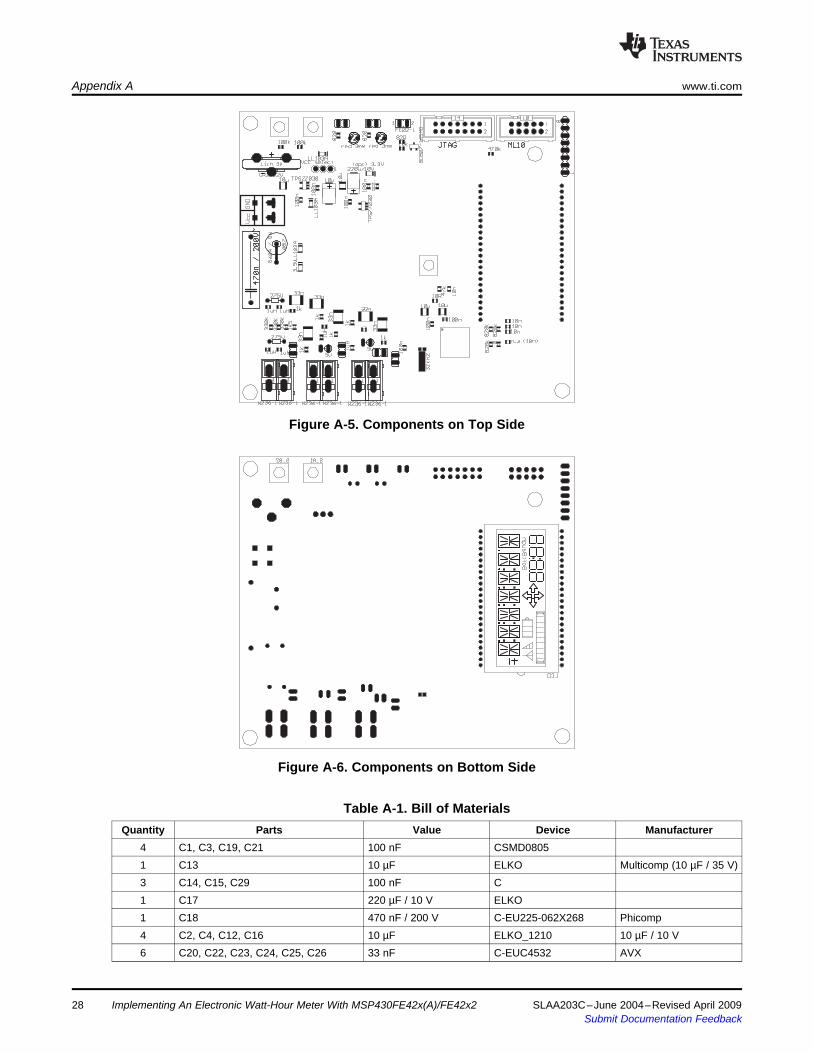
Figure A-5. Components on Top Side
Figure A-6. Components on Bottom Side
Table A-1. Bill of MaterialsQuantity Parts Value Device Manufacturer
4 C1, C3, C19, C21 100 nF CSMD08051 C13 10 µF ELKO Multicomp (10 µF / 35 V)3 C14, C15, C29 100 nF C1 C17 220 µF / 10 V ELKO1 C18 470 nF / 200 V C-EU225-062X268 Phicomp4 C2, C4, C12, C16 10 µF ELKO_1210 10 µF / 10 V6 C20, C22, C23, C24, C25, C26 33 nF C-EUC4532 AVX
28 Implementing An Electronic Watt-Hour Meter With MSP430FE42x(A)/FE42x2 SLAA203C–June 2004–Revised April 2009Submit Documentation Feedback
www.ti.com Appendix A
Table A-1. Bill of Materials (continued)Quantity Parts Value Device Manufacturer
1 C27 22 µF / 25 V CPOL-EUD/7343-31R AVX Typ: TAJ4 C5, C6, C7, C8 10 nF CSMD08051 C9 N.A. (10 nF) CSMD08052 D2, D3 LL103A BAS322 D7, D10 LL103A D2 DV1, DV2 5 V D_SUPPRESS1 G1 CR2032V CR2032V Varta
TPS77030, TPS77033,2 IC2, IC3 3.0 V, 3.3 V, or variable Texas Instrumentsor TPS770011 J1 SUP_CON SUP_CON6 L1, L2, L3, L4, L5, L6 1 µH L-US080508051 LCD SBLCDA2_DISPLAY SBLCDA2_DISPLAY Softbaugh2 LED1, LED2 Red 3 mm LED3MM Multicomp (Low Power)1 LED3 SFH486 LED5MM Infinion
MSP430FE42x(A) or1 MSP1 Texas InstrumentsMS430FE42x21 Q1 32 kHz QUARZ32K1 Q3 BC807-16SMD BC807-16SMD Philips (5Ap)1 R1 47 kΩ R_08051 R16 560R / 5 W R-EU_0817/7V2 R19, R20 820 R_08053 R2, R3, R4 820 kΩ R_08052 R21, R22 100 kΩ R_08051 R23 0R R_08056 R24, R25, R26, R42, R45, R47 1 kΩ R_08052 R28, R37 275 V VARISTOR-2,5 EPCOS1 R29 10R R_08051 R30 opt. R_08051 R31 82R R_08053 R38, R39, R40 330 kΩ R_08051 R43 1k5 R_08052 R44, R48 - R_08051 R5 0 R_08051 R6 10 kΩ R_08051 R7 470 kΩ R_08051 RS232 ML10 ML105 S_A, S_A1, S_B, S_B1, S_B2 Switch Switch1 SV1 JTAG ML141 SV2 MA08-11 SV3 VCC select MA03-1@23 TP1, TP2, TP3 JP1E Connector row6 X1, X2, X3, X4, X5, X6 W236-1 W236-1 Wago 2561 ZD1 (opt) 3.3 V D1 ZD2 3.9 V D
SLAA203C–June 2004–Revised April 2009 Implementing An Electronic Watt-Hour Meter With MSP430FE42x(A)/FE42x2 29Submit Documentation Feedback
Appendix B Frequently Asked Questions
Appendix B www.ti.com
1) Is it possible to implement temperature compensation with the ESP?Yes, the ESP430 can measure ambient temperature with the integrated temperature sensor. Using thisresult, the MSP430 CPU can modify parameters in the ESP430 accordingly. This can also be performedwithout stopping the ESP, on the fly. For example, to change the phase shift parameter for a currenttransformer based on ambient temperature, a parameter lookup table can be applied to the ESP setup bythe MSP430 CPU to improve the temperature dependent error performance of the CT.
2) Reactive power appears to be inaccurate at low current loads on the MSP430FE42x.The reactive power is calculated using the power triangle method using the active and apparent powermeasured and therefore may have some variances at very low currents.
3) How is the reactive power measured?FE42x
The reactive power is not measured by the ESP430CE1; it is calculated using the active and apparentpower results. Because the discrete SD16 values are available to the MSP430 CPU, the reactivepower can be calculated by doing a phase shift of the voltage or current by 90° with user software. Inthis case it is also possible to apply filtering for harmonics which are required in some meters.
FE42xA and FE42x2The ESP430CE1A/B calculates the reactive power independently of the active and apparent powerresults directly from the current and voltage samples. Refer to the ESP430 User's Guide (SLAU134)for exact formulae.
4) Energy pulses which are directly generated by the ESP430 interrupt level function seems toexhibit jitter. Is the measurement unstable?The ESP430 interrupt level flag is set as soon as the preset energy is accumulated in the buffer. Witheach SD16 conversion result a certain amount of energy is added to the internal buffer. Since this energyis based on a sin^2 function, sometimes a very small or very large amount can be accumulated. Each timethe value in the buffer exceeds the limit set by the interrupt level the flag is set and the interrupt service isrequested.
5) With the FE42x, when negative energy is measured by the meter, ILREACHED is not launchingan event message as it does when the meter measures positive energy. I believe ILREACHEDshould be causing an interrupt and a message each time the amount of negative energy isaccumulated by the meter, but it is not doing this. I've tried NEx bit settings 00, 01, and 10 in theESP_CTRL0 register without any success.The ILREACHED function for energy mode does the processing in real-time. This means with each valuewhich comes from the SD16 converter the actual measured energy is added to the internal buffer andcompared with the preset level. This is the reason why it only works with positive active energy for thecomparison.
However, the correct energies according to the NEx bits are always available in the energy returnregisters within the ESP430 module and can be accessed anytime by the CPU:#define ACTENERGY1_LO RET8 /* Active energy I1 Low Word */#define ACTENERGY1_HI RET9 /* Active energy I1 High Word */#define ACTENERGY2_LO RET10 /* Active energy I2 Low Word */#define ACTENERGY2_HI RET11 /* Active energy I2 High Word*/#define ACTENSPER1_LO RET16 /* Active energy I1 for last mains period LSW */#define ACTENSPER1_HI RET17 /* Active energy I1 for last mains period MSW */#define ACTENSPER2_LO RET18 /* Active energy I2 for last mains period LSW */#define ACTENSPER2_HI RET19 /* Active energy I2 for last mains period MSW */
30 SLAA203C–June 2004–Revised April 2009Submit Documentation Feedback
www.ti.com Appendix B
6) I am intending to process the arrival of messages from the ESP in an interrupt service routine,using IN0IFG as the interrupt source. Based on the ESP430CE user's guide, the mEVENT messageis sent when a flag in STAT0 is set if the corresponding flag in EVENT is also set. The messagealso includes the value of STAT0 in MBIN1. However, the description of many of the bits in STAT0say that the bit is reset if an event message has been sent.1. An event occurs in the ESP and the bit is set in STAT0.2. The corresponding bit in EVENT is set, therefore:
a. STAT0 is written to MBIN1b. mEVENT is written to MBIN0c. The bit is cleared in STAT0
If two events occur at the same time, does the ESP send just one message for all the events, ordoes it sent a separate message for each event?The events are synchronized to the ADC samples and sent once new ADC samples have beenprocessed.
When an event message is sent, how quickly must the CPU access the mailbox registers toprevent a following event message from being lost?The event flags are set at the rate of the ADC samples. If the new event message could not be sent intime, the prior flag is not cleared and is also sent with the next event message.
7) When a temperature measurement command (mTEMP message) is sent to the ESP430, thetemperature measurement is performed on the next zero–crossing of the voltage input, whichcould be up to 10ms after the command was sent. During the time between when the commandwas sent the temperature result is returned, is it possible to send other messages to the ESP, suchas a request to read a parameter register? If this is possible, what happens if the replies to bothmessages are ready at the same time?Yes, it is possible to send the additional message during this time. Messages are read and processed inthe order they are received by the ESP. User software should check that the mailbox is ready to receive anew message prior to accessing the outgoing mailbox registers; this reflects whether or not the ESP hasread the prior message.
8) In our design we only use one current channel, but we would like use the second currentchannel for a separate measurement (e.g., battery voltage). What settings should be made in orderto do this?It is possible to request a measurement on the ADC current input channel (I2) using the ESP but thelimitation is that it cannot be sampled as often as the I/V meter input channels.
There is a message command available that is not currently included in the user's guide and in the headerfile which requests an single measurement on the I2 channel and returns the value back via the mailbox tothe CPU./* Message to ESP */#define mREAD_I2 (0x000F) /* Sample request I2 Channel result *//* Message from ESP */#define mI2RDY (0x000B) /* I2 value ready */
After sending the sample request message to the ESP430 module, the I2 channel is enabled, and afterfour measurement cycles the result is sent via the mailbox to the MSP430 CPU.
9) I would like to know if my load is capacitive/inductive and hence use the CAPIND register. Itworks when my current is measured using I1 but does not update or give me an expected resultwhen current I2 is used for measurements.The CAPIND register is present only in the FE42x (ESP430CE1) and not on the FE42xA (ESP430CE1A)and the FE42x2 (ESP430CE1B) devices. In the FE42x CAPIND functionality has not been implementedfor current channel I2.
In the FE42xA and FE42x2 devices, there is no CAPIND register implementation. However, the reactiveenergy is now signed and can be used to indicate capacitive or inductive load, which now works for bothcurrents I1 and I2. Refer to the ESP430 User’s Guide (SLAU134) for load type interpretations.
SLAA203C–June 2004–Revised April 2009 Implementing An Electronic Watt-Hour Meter With MSP430FE42x(A)/FE42x2 31Submit Documentation Feedback

IMPORTANT NOTICETexas Instruments Incorporated and its subsidiaries (TI) reserve the right to make corrections, modifications, enhancements, improvements,and other changes to its products and services at any time and to discontinue any product or service without notice. Customers shouldobtain the latest relevant information before placing orders and should verify that such information is current and complete. All products aresold subject to TI’s terms and conditions of sale supplied at the time of order acknowledgment.TI warrants performance of its hardware products to the specifications applicable at the time of sale in accordance with TI’s standardwarranty. Testing and other quality control techniques are used to the extent TI deems necessary to support this warranty. Except wheremandated by government requirements, testing of all parameters of each product is not necessarily performed.TI assumes no liability for applications assistance or customer product design. Customers are responsible for their products andapplications using TI components. To minimize the risks associated with customer products and applications, customers should provideadequate design and operating safeguards.TI does not warrant or represent that any license, either express or implied, is granted under any TI patent right, copyright, mask work right,or other TI intellectual property right relating to any combination, machine, or process in which TI products or services are used. Informationpublished by TI regarding third-party products or services does not constitute a license from TI to use such products or services or awarranty or endorsement thereof. Use of such information may require a license from a third party under the patents or other intellectualproperty of the third party, or a license from TI under the patents or other intellectual property of TI.Reproduction of TI information in TI data books or data sheets is permissible only if reproduction is without alteration and is accompaniedby all associated warranties, conditions, limitations, and notices. Reproduction of this information with alteration is an unfair and deceptivebusiness practice. TI is not responsible or liable for such altered documentation. Information of third parties may be subject to additionalrestrictions.Resale of TI products or services with statements different from or beyond the parameters stated by TI for that product or service voids allexpress and any implied warranties for the associated TI product or service and is an unfair and deceptive business practice. TI is notresponsible or liable for any such statements.TI products are not authorized for use in safety-critical applications (such as life support) where a failure of the TI product would reasonablybe expected to cause severe personal injury or death, unless officers of the parties have executed an agreement specifically governingsuch use. Buyers represent that they have all necessary expertise in the safety and regulatory ramifications of their applications, andacknowledge and agree that they are solely responsible for all legal, regulatory and safety-related requirements concerning their productsand any use of TI products in such safety-critical applications, notwithstanding any applications-related information or support that may beprovided by TI. Further, Buyers must fully indemnify TI and its representatives against any damages arising out of the use of TI products insuch safety-critical applications.TI products are neither designed nor intended for use in military/aerospace applications or environments unless the TI products arespecifically designated by TI as military-grade or "enhanced plastic." Only products designated by TI as military-grade meet militaryspecifications. Buyers acknowledge and agree that any such use of TI products which TI has not designated as military-grade is solely atthe Buyer's risk, and that they are solely responsible for compliance with all legal and regulatory requirements in connection with such use.TI products are neither designed nor intended for use in automotive applications or environments unless the specific TI products aredesignated by TI as compliant with ISO/TS 16949 requirements. Buyers acknowledge and agree that, if they use any non-designatedproducts in automotive applications, TI will not be responsible for any failure to meet such requirements.Following are URLs where you can obtain information on other Texas Instruments products and application solutions:Products ApplicationsAmplifiers amplifier.ti.com Audio www.ti.com/audioData Converters dataconverter.ti.com Automotive www.ti.com/automotiveDLP® Products www.dlp.com Broadband www.ti.com/broadbandDSP dsp.ti.com Digital Control www.ti.com/digitalcontrolClocks and Timers www.ti.com/clocks Medical www.ti.com/medicalInterface interface.ti.com Military www.ti.com/militaryLogic logic.ti.com Optical Networking www.ti.com/opticalnetworkPower Mgmt power.ti.com Security www.ti.com/securityMicrocontrollers microcontroller.ti.com Telephony www.ti.com/telephonyRFID www.ti-rfid.com Video & Imaging www.ti.com/videoRF/IF and ZigBee® Solutions www.ti.com/lprf Wireless www.ti.com/wireless
Mailing Address: Texas Instruments, Post Office Box 655303, Dallas, Texas 75265Copyright © 2009, Texas Instruments Incorporated


![Three Phase Watt-Hour Meter - ULisboa · Three Phase Watt-Hour Meter Andre D. Gomes, Pedro M. Ramos´ ... meter can request is limited to the values imposed by regular standards [2]](https://img.pdfslide.net/doc/110x75/5c9d673b88c9939c348cb9e1/three-phase-watt-hour-meter-ulisboa-three-phase-watt-hour-meter-andre-d-gomes.jpg)