Embed Size (px)
Citation preview
(NASA-CR-149928) IMPROVEMENT OF BLACK N76-28404 NICKEL COATINGS Final Report (HoneywellInc) 62 p Hc $450 CSCL 11F
Unclas
G65 1
IMPROVEMENT OF BLACK NICKEL COATINGS BY R E PETERSON AND J H LIN
Final Report on Research Performed under Contract NAS8-31545 (DCN-1-5-58-01234) by
Honeywell Inc Systems and Research Center
Minneapolis Minnesota 55413
for
George C Marshall Space Flight Center National Aeronautics and Space Administration Marshall Space Flight Center Alabama 35812
June 1976
REPRooUCED 8
NATIONAL TECHNICAL INFoRA 0 Lj
ECMATION ShDEPATMN OF COMMERCE
httpsntrsnasagovsearchjspR=19760021316 2018-07-11T195609+0000Z
1 Report No 2 Government Accession No 3 Recipients Catalog No
4 Title and Subtitle 5 Report Date
May 1976 IMPROVEMENT OF BLACK NICKEL COATINGS 6 Performing Organization Code
7 Author(s) 8 Performing Organization Report No
R E Peterson and J H Lin
10 Work Unit No 9 Performing Organization Name and Address
Honeywell Inc 11 Contract or Grant No Systems and Research Center 2600 Ridgeway Parkway NE NAS8-31545 Minneapolis Minnesota 55413 13 Type of Report and Period Covered
12 Sponsoring Agency Name and Address Contractor Report
National Aeronautics and Space Administration 14 Sponsoring Agency CodeWashington DC 20546
15 Supplementary Notes
Project Manager James R Lowery NASA Marshall Space Flight Center Huntsville Alabama
16 Abstract
Selectively absorbing black nickel coatings are one of the most optically efficient low cost coatings for use on flat plate solar collectors However this Ni-Zn-S-0 coating is quite susceptible to a humid environment degrading badly in less than ten days at 38 C (100 F) at 95 percent relative humidity In this program a new black nickel formula was developed which can withstand such exposures with no loss of optical efficiency solar absorption of gt 0 92 and an infrared emittance (at 100degC) of lt 0 10 were still present after 14 days of humidity exposure This compares to a solar absorptance of only 0 72 for the previous formula after a similar time period The electroplating bath and conditions were changed to obtain the more stable coating configuration The effect of bath composition temperashyture pH and plating current density and time on the coating composition spectral optical properties and durability were investigated systematically
A3RIGINAJ PAGI8 OF POOR -QUAI1 T
17 Key Words (Suggested by Author(s))
Flat Plate Solar Collector Optically Selective Black Nickel Coating Solar Absorption and Thermal Emittance Humidity Resistance
18 Distribution Statement
19 Security classnd of this report)
F l
20 Security Ciassif (of this pagel
iNclassificdi Unclassified
21 NO of Pages 22 Price
For sale by [lie National Technical Information Service Springfield Virginia 22151
FOREWORD
This is the final report describing the work performed by Honeywell Inc Systems and Research Center for the NASA Marshall Space Flight Center Huntsville Alabama under contract number NAS8-31545 Black Nickel Coating Improvement Study
The authors acknowledge the guidance provided by Mr James R Lowery
NASA Project Manager
The following Honeywell personnel participated in the program
R E Peterson Principal Investigator
J1H Lin
S Heckler
N White
The Auger composition analysis of the coatings was done at the University of Minnesota by P Lindfors under the direction of Professor G K Wehner
ii
CONTENTS
Page
FOREWORD in
SUMMARY 1
TECHNICAL DEVELOPMENT AND RESULTS 2
State of the Art 2
Experimental and Analytical Techniques 5
Coating Preparation 5 Optical Tests 5 Physical Tests 6 Composition Analysis 6
The Chemistry of Black Nickel Coating 7
Mechanism of Humidity Degradation of Black Nickel Coatings 10
Effect of pH on Coating Properties 12
Effect of pH on Auger Spectra 13 Effect of pH on Optical Properties 17 Summary of the Effects of pH 17
Effect of Current Density on Coating Properties 19
Effect of Current Density on Auger Spectra 20 Effect of Current Density on Optical Properties 20 Summary of the Effect of Current Density Variations 25
Effect of Zn++Ni++ Ratio on Coating Properties 25
Effect of Zn++Ni++ Ratio on Auger Spectra 27 Effect of Zn++Ni + + Ratio on Optical Properties 27 Effect of Ni + + Variations from Standard NASA Formula - 31
33Summary of the Effects of Zn++Ni + + Ratio Effect of Temperature on Coating Properties 33
Effect of Temperature on Auger Spectra 34 Effect of Temperature on Optical Properties 34 Summary of Effects of Temperature on Coating Properties 39
The Effect of Thiocyante Concentration on Coating Properties 39
Effect of SCN- Concentration on Auger Spectra 39 Effect of NaSCN Concentration on Optical Properties 41 Summary of the Effects of Thiocyanate Concentration 45
4)T jPREMIG v
CONTENTS (CONCLUDED)
Page
Effect of Ammonium Ion on Coating Properties 45
Effect of NH4+ Concentration on Auger Spectra 45 47Effect of NH4+ Concentration on Optical Properties
Summary of the Effects of N114 + Concentration 47
Summary of the Parameter Study and Improved Black Nickel 49Formulas
Polymeric Overcoats to Protect Black Nickel
CONCLUSIONS AND RECOMMENDATIONS 53 52
53 Conclusions Recommendations
REFERENCES
vi
LIST OF ILLUSTRATIONS
Figure Page
1 Spectral reflectance of black nickel coating 3
2 Black nickel electroplating bath 8
3 Auger spectra of a NASA standard formula black nickel coating before and after NASA humidity test 11
4 Effect of pH on reduction potentials in black nickel plating electrolytes 14
5 Effect of pH on auger spectra pH 4 and 57 15
6 Effect of pH on auger spectra pH 60 and 65 16
7 Effect of pH on spectral reflectance - before humidity 18
8 Effect of pH on spectral reflectance - after 48-hour humidity test 18
9 Effect of current density on auger spectra 1 to 3 5 macm2 21
10 Effect qf current density on auger spectra 43-50 macm 22
11 Effect of current density on the Honeywell formula black nickel 23
12 Effect of current density on the reflectance of NASA black nickel coatings 24
13 Effect of current density on the reflectance of NASA black nickel coatings 24
14 Effect of Zn++Ni + + ratio on auger spectra for Zn++Ni + +
28from15 to 5
15 Effect of Zn++Ni ++ ratio on auger spectra at Zn++Ni++ = 7 29
16 Effect of Zn++Ni++ ratio on spectral reflectance 30
17 Effect of Zn++Ni++ ratio on spectral reflectance after humidity 30
vii
LIST OF ILLUSTRATIONS (CONCLUDED)
PageFigure
18 Effect of temperature on auger spectra from 180C to 290C 35
19 Effect of temperature on auger spectra 460C 36
20 Effect of temperature on spectral reflectance before humidity test 37
21 Effect of temperature on spectral reflectance after humidity test 37
22 Effect of temperature on spectral reflectance
23 Effect of temperature on spectral reflectance 38
38
24 Effect of NaSCN concentration on auger spectra 42
25 Effect of sodium thiocynate concentration on spectral reflectance 43
26 Effect of sodium thiocyanate concentration on spectral 43 reflectance after humidity test
27 Effect of NH + concentration on auger spectra 46
28 Effect of ammonium ion concentration on spectral reflectance before humidity test 48
29 Effect of ammonium ion concentration on spectral reflectance after humidity test 48
30 Effect of humidity on a black nickel coating with EPDM overcoat 52
viii
LIST OF TABLES
PageTable
I Performance Values for Some Solar Absorber Coatings 4
II Humidity Resistance of Four Samples Plated Using the NASA Standard Formula and Conditions at Various Times During the Program 12
III Humidity Resistance of Black Nickel Samples Plated at Different pH 19
IV Humidity Resistance of Black Nickel Samples Plated at Different Current Densities 26
V Humidity Resistance of Black Nickel Samples Plated at -Different Zn++Nit Ratios 32
VI Effect of Ni + + Concentration Change on Humidity Resistance of NASA Standard Formula Coatings 32
VII Humidity Resistance of Black Nickel Samples Plated at Different Temperatures 40
VIII Humidity Resistance of Black Nickel Samples Plated at Different NaSCN Concentrations 44
IX Humidity Resiptance of Black Nickel Samples Plated at
Different NH 4 Concentrations 47
X Humidity Resistance of Improved Black Nickel Coatings 50
XI Comparison of NASA Standard Formula and New Baths 51
XII Recommended Solution 51
XIII Humidity Resistance of Old and New Formulas 53
ix
IMPROVEMENT OF BLACK NICKEL SOLAR
ABSORBER COATINGS
By J H Lin and RE Peterson
Honeywell Inc
SUMMARY
This is the final report describing work performed by Honeywell Inc for the NASA Marshall Space Flight Center Huntsville Alabama under contract No NAS8-31545 Black Nickel Coating Improvement Study
Use of selective solar absorber coatings is a cost-effective technique for improving the performance of flat-plate solar collectors1 Among lowshycost selective coatings (excluding only vacuum-deposited coatings) electroshyplated black nickel (a Ni-Zn-S-0 complex) has the best optical characterisshytics with a solar absorptance a of - 0 96 and a thermal emittance e of 0 07 However black nickel has shown a tendency to degrade in accelerated humidshyity tests and possibly in the humidity environment of a solar collector over long periods The purpose of this program was to improve black nickel humidity resistance without sacrificing the excellent optical properties
The chemistry of the plating bath was studied and the effect of changes in plating parameters determined experimentally Plating time current density bath temperature pH and the concentration of SCN- Zn++ and Ni++ were all found to have significant effects on coating properties Essenshytially these plating parameters control the proportions of metal sulfides metal hydroxides and free metals in the coating The main effect of
humidity is to convert metalsulfides to metal hydroxides near the coating surface The significance of this change was found to be minimized by proshyducing a coating rich in metal hydroxides to begin with The hydroxide rich coating was achieved by increasing both pH and plating current density The resulting coatings withstood 14 days at 95 percent relative humidity at 38 0 C (100 0 F) with little change in optical properties (a = 092 and e = 0 10 after testing) compared to major degradation (a = 0 72 after test) for coatshyings produced with the previous formula
TECHNICAL DEVELOPMENT AND RESULTS
Significant technical factors and results discussed in this section are
state of the art experimental and analytical techniques chemistry of black
nickel plating the effect of several plating parameters including pH temshyand SCN- and NH 4 + concenshyperature current density Zn++Ni++ ratio
tration on the coating composition optical properties and humidity resis-Results of the parameter study are then summarized the rationaletance
behind the selection of new coating formulas is discussed and properties of
coatings produced with the new formulas are given Finally another techshy
nique studied organic overcoats will be discussed
State of the Art
The black nickel coating is applied by a process that was described as
early as 1921 2 Serfass 3 proposed a theory explaining the plating process and more recent recipes for fabricating wavelength selective black nickel coatings for solar energy applications have been given by Tabor 4 and NASA MSFC 5
The coating is applied to an infraredreflective metal substrate Most often this reflective substrate is achieved by plating a cheaper metal with
1o-3 cm of nickel The nickel layer remains reflective in the inshyabout 3 x frared over long periods and protects the base metal substrate from corshyrosion The thin (0 1 1m) black nickel layer is absorptive in the solar
1spectrum due to both a natural absorption in that region and an optical inshyterference effect In the infrared the coating is transparent resulting in a low emittance show through of the nickel-coated substrate The spectral
shown in Figure 1 Note that the reflectancereflectance of such a coating is remains low over the entire 0 4-1 5 jim wavelength region before rising rapidly to gt90 percent reflectance above 8 jim which is nearly the ideal behavior for a low-temperature selective solar absorber coating
When coated to the proper thickness the common black nickel coating
used in the electro-plating industry has a solar absorption (a) of 85 to 90
percent and infrared emittance (e) at 1000C of 6 to 8 percent The NASA
MSFC coating uses a similar process and achieves roughly the same optical
properties
Tabor 4 first pointed out that there are two stable black nickel coating The twocompositions corresponding to different plating current densities
compositions have different optical constants that can be used advantageously
in two-layer black nickel coating systems to achieve higher solar absorpshya = 92 percent in this way At Honeywelltances Tabor was able to get
2
1
9 Black nickel
10 - 5 8 cm e(loMC = 007
7
c 6 n1-0-3 cm NI C
S5 Substrate
n~4
3 1= 096
2
1
0
2 5 1 2 5 10 2b Wavelength pm
Figure 1- Spectral reflectance of black nickel coating
we previously used a formula and two-layer technique similar to Tabors to achieve coatings with a = 96 percent and G= 7 percent after considerable effort to optimize the procedure Coatings with a = 94 percent were obtained consistently over several months with this formula No effort was made to optimize the durability of this earlier coating
These performance values for black nickel are compared to properties of other selective coatings on Table I We have beenexamining the comshyposition durability and optical properties of many of these other coatings under contract with ERDA (Reference 1) From Table I it is clear that black nickel coatings have the best optical properties but far from the best durability especially under environmental humidity tests Due to apparent durability of the black chrome and black iron coatings our ERDA program has emphasized improvement of their optical properties
3
TABLE I-PERFORMANCE VALUES FOR SOME SOLAR ABSORBER COATINGS
Breakdown Humidity
Coating Substrate a temperature resistance- (oc)
07 300 PoorBlack nickel Nickel 96
Black copper Copper 90 14 200 Poor
93 450 ExcellentBlack chrome Nickel 12
08 --- GoodBlack iron Iron 85
MnO x Aluminum 70 10 ---
An equally reasonable approach however is to improve the durability of black nickel coatings How much is the better optical performance of the black nickel worth in terms of solar collection efficiency Based on results
comshyof recent NASAMSFC analysis 6 Honeywell solar simulator tests and an increase in absorptionputer-generated yearly solar collection averages
of 1 percent increases overall collector performance by -3 percent while a 1-percent decrease in emittance (from 8 percent to 7 percent for example) would increase collector performance by 1 5 percent These calculations are for an - 1001C collector operating temperature with two glass covers Therefore the better optical properties of black-nickel coating are fairly
percent better overall collector performancesignificant (equivalent to 15 relative to black chrome for example) Thus successful development to
improve the durability of black nickel has an important impact on flat-plate
collector systems
Some physical tests that have been given to black nickel coatings at
Honeywell are listed below 1
Heating at 2800C for one week caused no optical change
One-third sun year of UV caused no change
14 000 cycles from 280 to 1040C (equivalent to 40 years) caused no change
MIL STD coating abrasion test (erasure rub) badly scratches the coating
The MIL STD coating adherence test (Scotch tape pull) could not remove the coating
4
The key problem with black nickel coatings is of course its lack of humidity resistance It degrades very rapidly in accelerated humidity exshyposures Improving this humidity resistance was the main goal of the present program
Experimental and Analytical Techniques
Coating Preparation - About 200 black nickel samples were plated in this program in -8 (2 gallon) baths of plating solution The samples were 8 cm x 10 cm from which four 2 54 cm diameter samples were punched for the various optical and durability tests One sample was used to find the spectral reflectance and other optical properties one was sent for Auger composition analysis one was given an environmental humidity test followed by composition analysis and the fourth sample was given a humidity test followed by an optical characterization Often this fourth sample was returned to the humidity chamber for prolonged testing with periodic optical measurements to monitor any degradation
The coatings were all applied to bright nickel-coated steel substrates The bright nickel plating to 0 0025 cm thickness was done by a local electroplater Due to the lapse of time between the bright nickel electroplate and the black nickel coating in our lab the oxide layer that forms on Ni had to be removed before the black nickel coating could be applied The cleanshying and oxide removal (activation) procedure used in our lab was as follows
Cleaning with dish-soap and water Rinse
One minute in a boiling 30 percent solution of NaOH Rinse
One minute in 30 percent solution of HC1 at room temperature Rinse
This procedure gave a consistently good surface for subsequent black nickel plating In a production-line process the bright nickel plating would most likely be performed just before the black nickel plating and the activashytion process would then be unnecessary
Optical Tests - The solar absorptance (at air mass two) was measured right after the coating deposition with a Gier Dunkle Solar Reflectometer This measurement was followed by measurement of spectral reflectance from 0 3 to 12 pim in an integrating sphere reflectometer and from 2 5 to 40 pm in a Beckman IR 20A Spectrometer The solar absorptance (at air mass two) and the infrared emittance (at 100 0C) were calculated from the spectral reflectance curves using appropriate solar and black body spectra to weight the data in the integration
5
This technique gives a and e values accurate to plusmn0 02 The accuracy of this technique for the emittance values has been verified by direct measureshyment of total emittance at 1000C The solar absorptance as determined by the integrated spectral reflectance disagreed with the Gier Dunkle value by atmost two percent
Physical Tests - Programmable humidity test chambers were used for the two types of humidity tests given in this program namely
A constant environment of 95 percent relative humidity at 380C (100 0F) Throughout this report this environment will be referred to as the standard NASA humidity test since it was recommended for use as the basic test of the program in the RFP
The second test used is the much more severe MIL-STD-810B Method 507 Procedure I This test consists of a thermal and humidity cycle from room temperature to 710C (1500F) at 95 percent relative humidity (RH) and from 71C to room tempershyature at gt85 percent RH over a 24-hour period This is one of the most severe accelerated environmental tests The test conditions impose a vapor pressure on the samples that causes moisture penetration and migration
The suitability of this test to accurately gauge the effects of long term 10 to 20 years exposure in an actual solar collector is difficult to detershymine Coatings that have failed the 810-B test in only one day have now withstood two years of use in flat plate collectors in the relatively severe environment of Minnesota with no coating degradation except in limited areas where pinholes through the bright nickel coating led to spots of rust from the steel substrate Although there is no long term data to back it up we feel the 810B test is probably a more severe test than is necessary to simulate the long term humidity environment
Composition Analysis - The key technique used for coating composition analysis was the sputter-Auger composition depth profile These measureshyments were performed for Honeywell at the University of Minnesota under the direction of G K Wehner In Auger electron spectroscopy the sample surface is bombarded with electrons of several Key energy and one observes ejected electrons with well-defined energies that are characteristic of the atom species from which they originated An Ar ion gun operating at a pressure of 5 x 10⁻⁵ torr is used to sputter-etch the sample while analyzing the electron emissions The low sputtering rate of -70 Aminute allows a composition depth profile to be made The ion beam diameter is much larger (3mm) than the analyzing electron beam (50tm) With the region of analysis in the center of the relatively flat bottom of the ion-sputtered crater good depth resolution results The depth from which Auger signals originate extends about 15 Abelow the surface
6
The energy spectrum of the emitted electrons has peaks at energiescorresponding to the atomic species that are present and the magnitude of the peaks gives a measure of the relative amounts of that atom that are present The technique is insensitive to the interatomic bonding Since black nickel coatings have a very complex chemical structure it was essentially impossible to calibrate the Auger peaks to give a direct measure of absolute percentage of any particular element in the coating That is although the oxygen signal may be greater than the sulfur signal on a particular figure in this report there may actually be more sulfur in the coating However the technique can be used very effectively to identify changes between coatings and as a function of depth The comparison beshytween different coatings can also be aided somewhat by using the Auger signal from the underlying pure Ni substrate to normalize the data
The Chemistry of Black Nickel Coating
The following discussion of the chemistry of black Ni coating summarshyizes an earlier theoretical analysis by Serfass et al 3 It serves as the foundation for our experimental investigation of plating parameters
The bath and plating conditions used as the basis for the work of this program are as follows
NASA Standard Bath
Nickel sulfate (NiSO4 6H20) 75 gC
Nickel ammonium sulfate (NiSO4 (NH4 )2 So 4 6H20) 45 gi Zinc sulfate (ZnSO4 7H20) 37 5 gL
Sodium thiocynate (NaSCN) Current density
15 gL 43 macm 2
Temperature 21 - 2670C pH 56-59
Plating time 30 s (or until a coating of 15001 is produced
A very limited amount of testing was also done using a bath described by Tabor 4 but with current densities times and pH levels optimized earlier at Honeywell for maximum optical efficiency This other solution is referred to as the Honeywell black nickel coating in the discussion below where it will be described in more detail
7
The NASA standard bath for black nickel plating contains the ions of =Ni 2 + Zn 2 +o NH4 + SO4 SCN- Na+0 H+ and OH7 Using a bright nickelshy
plated substrate as the cathode and pure nickel as the anode a diagram of the plating bath is given in Figure 2 Some important reactions at each electrode during the plating process are listed below
Anode (Pure nickel)
Ni = Ni2 + + 2e- ()
Cathode (Bright nickel plated metal)
a Reduction of thicyanate ion in acidic solution
SCN + 3H + + 2e- = H2 S(aq ) + HCN(aq) (2)
+shy
eshye-
S Zn 2+
Ni 2 + so4
0 SCNNH4 +M H
H+
Na+
Anode Cathode
Figure 2 - Black nickel electroplating bath
8
b Formation of nickel and zinc sulfides
Ni 2+ + H 2 S =NiS + 21 + (3)
Zn 2+ + H2 S = ZnS+ 2H+ (4)
c Evolution of hydrogen gas
2H + + 2e- = H2 (gas) (5)
d Deposition of nickel and zinc metals from their ions
Ni 2 + -+ 2e = Ni (6)
Zn 2+ + 2e = Zn (7)
e Function of the ammonium ion
NH 4 + + OH- = NH 3 + H 2 0 (8)
Ni 2 + + 6 NH 3 = Ni(NH 3 )6 2+ (9)
Zn 2 + + 4 NH 3 = Zn(NH 3 )4 2+ (10)
f Deposition of metallic nickel and zinc from their ammonia complex ions
Ni(NH 3)62+ + 2e- = Ni + 6 NH 3 (11)
Zn(N-13 )4 2+ + 2e = Zn + 4 NE- 3 (12)
While nickel zinc thiocyanate and ammonium ions play an important role in plating the sodium ion does not participate in the reaction due to its highly negative reduction potential and the sulfate ion remains unchanged because of the predominant reaction of nickel at the anode
Essentially there are two basic reactions of primary importance the deposition of the metal sulfides [Equations (3) and (4)) and the deposition of the elemental metals [Equations (6) (7) (11) and (12) ) The rates of these two depositions can be controlled by the plating conditions In the actual coating there is a mixture of metal sulfides and free metals both of which are necessary to obtain the desired solar absorption properties As will be shown clearly below coatings with too little free metal do not have sufficient absorption in the solar spectral region causing the spectral reflectance curves to show an oscillating optical-interference pattern If there is too much free metal in the coating there is a flat spectral reflecshytance curve due to absorption by the metal atoms but often then the reflecshytance is too high (- 15 percent) in the solar region (it looks metallic) and
9
the coating transmittance in the IR is too low (giving a high emittance) Thus good optical properties depend on the proper -mixture of metal -sulfide and free metals
Another basic reaction not discussed above is the possible deposition of
metal hydroxides under high pH conditions
Zn ++ + 2 OII-- Zn(OH) 2 (13)
Ni + + 2 OH---Ni(OH) 2 (14)
This hydroxide precipitation can also occur when the solution is over driven e g by too high current density When the current density is too high hydrogen evolution near the cathode causes the local pH to increase over that of the bulk solution In electroplating the conditions at the solution-metal interface are much more important than that of the bulk solushytion Thus a locally high pH near the cathode can cause the precipitation of nickel and zinc hydroxides
The repeated pattern observed in our study of plating parameters was the appearance of three regions where the deposition of either metal sulfides free metals or metal hydroxides predominates over the other two The coating composition depends on the rates of these competing reactions Since pH is a dominant parameter the rates of various reactions will be discussed in the subsection below which covers the effect of the pH paramshyeter First however the mechanism of the humidity breakdown of the coating will be discussed
Mechanism of Humidity Degradation of Black Nickel Coatings
The Auger spectra of a black nickel plated coating using the standard NASA bath and conditions is shown before and during a NASA standard humidity test in Figure 3 Note the decrease in S and increase in 0 content near the coating surface The same basic change occurred to varying degrees for essentially all of the degraded samples inthe program Apparshyently the main reaction caused by the humidity is the replacement of metal sulfides by metal oxides or hydroxides in the coatings Hydrogen atoms can not be detected by Auger analysis so it is not possible to be sure if oxides or hydroxides are being formed However based on the analysis of bath chemistry it is most likely that hydroxides are being formed As shown below the degradation process can be greatly retarded by changes in plating conditions Also the reaction often moves to a certain depth in the coating and then fnns
10
Before humidity After humidity (2 days) NI
-- XZ V ZnX I N ZnX 2
2nX2
NN
0250 500 750 1000 0 250 500 750 I000 Approximate depth A Approximate depthA
NNI
CX 2
0 250 500 750 1000 Approximate depth it
Figure 3 - Auger spectra of a NASA standard formula black nickel coating before and after NASA humidiy test
1i
Table II shows the absorption and emittance of several coating samples all plated with the NASA standard formula after two different humidity deshygradation tests These results are intended to show the variable properties that can be obtained with nominally identical black nickel coatings Black nickel plating isinherently a complex and sensitive process with which many investigators have had trouble obtaining consistent results The -7 percent scatter of the results in Table II should be remembered when comshyparing results in the parameter study to be given below In the study inshyconsistencies were minimized by using identical plating techniques and only varying one parameter at a time However some variations in coatinq properties especially between different batches of the standard bath were difficult to eliminate
TABLE II- HUMIDITY RESISTANCE OF FOUR SAMPLES PLATED USING THE NASA STANDARD FORMULA AND CONDITIONS AT VARIOUS TIMES DURING THE PROGRAM
Before After one day After four days humidity 810-B NASA test
a S aS
86 08 826 885
93 12 857 90
91 10 896 90
90 09 - 805 88
Average properties
S90 097 846 891
Note the average properties obtained on the Standard coating at the bottom of Table II Also note that one day in the 810-B humidity test causes more degradation than four days of the NASA humidity test
Effect of pH on Coating Properties
The pH of the plating solution is of key importance The reduction of the thiocyanate ion offers a sulfide ion for black nickel sulfide formation but the thiocyanate reduction potential is greatly affected by the pH of the plating solution The relationship between reduction potential of thiocyanate and pH has been derived by Serfass 3 as
12
E = +0 068 + 0 0295 log (SCN-) - 0 0885 pH (15)
A plot of this equation is included in Figure 4 for various thiocyanate concentrations The more positive the potential E in Figure 4 (closer to the bottom of the graph) and Equation (15) the easier the reaction will proceed The potential required for several other reactions to proceed at various pH values is also plotted in Figure 4
It can be concluded from Figure 4 that
At lower pH thiocyanate is easier to reduce and thus nickel and zinc sulfides are easier to form
At lower pH the hydrogen ion is also more easily reduced and causes the evolution of hydrogen gas
At higher pH the reductions of hydrogen ion into hydrogen gas and the nickel ion into metallic nickel predominate over the reduction of thiocyanate (and hence NiS formation) This results in a grey metallic coating
The choice of pH is also restricted by the precipitation of nickel sulfide and nickel hydroxide The nickel sulfide precipitates (or deposits) very slowly at pH less than 3 but at pH over 6 a precipitation of nickel hydroxide may occur
Many of these predictions based on the computed reaction potentials were observed for the coatings deposited in this program at various pH values
- Effect of pH on Auger Spectra - The Auger spectra of samples plated using the NASA formula but with eight different pH values were measured
The pH of the standard NASA formula is 5 6 The Auger spectra for four of humidity tests that illustrate thethese different pH s before and after the
effects are shown in Figures 5 and 6
Before the humidity test there are some composition differences among samples plated at different pHs At pH higher than 6 0 the coating comshy
= positions are quite different from that of pH lower than 6 0 At pH 6 5 the Zn and 0 centrations are higher while the Ni and S are lower near the coating surface The higher 0 and lower S content can be explained by the precipitation and deposition of metallic hydroxides as was predicted by the computed reaction potentials for pH greater than 6
13
--
SCN- + 3H+ + 2e- -H 2 S (aq) + HCN (aq)
- 89
- 8 Zn+2 + 2e Zn[Zn+2] 1 M
I ~ I0 - 7I I
I I - 6 2 + 2e- -H 2 (GAS)
-5- NJ (NH3)6+2 + 2e- -6 NH3 + NI
- 41
[NI ] = 0001
(Ni ]= 001M 3 - ]01M N+ 2 +2e_ - Ni
2[Ni J]=1o M J
- 2 - Ni (OH) 2 Ppt
II
J NIS Ppt I I
I I I I I I
0I I 0 2 4 6 I 10 12 14
pH
Figure 4 - Effect of pH on reduction potentials in-black nickel plating electrolytes
14
pH= 40
Before humidity
ZnX 2
ZnX
Ni
pil= 40
After humidity
ZnX 2
ZnX2
-- -NI
0 250 500 Approximate depth A
750 1000 0 250 500 Approximate depthA
750 1000
pH1=57
_- ____
0250
2
Befor humdityAfter
ZnX
_ _ _ _
500 750 Approximate depth A
_ _ _
1000 0
pilH57
humidity
ZnX 2
250 500
Approximate dep A
750
1O0
pH S
t X 2
0250
=
_foCC X 2
500 Approximate depth
p 547and 57 N
750 1000 0250
7
_--C tX
0
500 Approximate depth
o x2
I 750
1000
Figure 5 - ]Effect of pHI on pH 4 and 5 7
Auger spectra
15
- pH 60
Before humidity
pH =-60
After humidity
Ni NI
Zn x22
0L
i
0
NU i
215 Approximate depth A
50 250 Approximate depth I
500
pH = 65
Before humidity
pH = 65
After humidity
Zn x 2 Ni
n xC2 2 50500
Approximate depth A S
0
Approximate depth
500
NI
ZnFiurx Efeto2Ho A grset
pH 6 0 and 6 5
16
One consistent change due to the humidity test (seen on Figures 5 and 6) is the decrease in sulfur concentration near the coating surface and a correshysponding increase in oxygen This change occurred on all the Auger spectra received but it is least distinct for the high pH samples of Figures 5 and 6 The pH = 6 5 sample seems most stable in humidity as far as the coating composition is concerned and as we shall see below the pH = 6 0 samples have the most stable optical properties Probably the relatively high oxygen content in the high pH samples prevents further oxidation (or the formation of hydroxide) during the humidity test
Effect of nH on Optical Properties - The spectral reflectance of samples in the pH range 4 5 to 6 5 are shown in Figure 7 As the figure indicates all samples have reflectance curves that are flat in the 35 to 1 5 jim region Their solar absorptance are all in the range of 91 percent to 94 percent Except for two thick coatings plated at pH 6 and 6 5 for 92 seconds all the samples have an infrared emittance between 9 percent and 12 percent
The reflectance of the same samples after 48 hours in the humidity chamber at 100degF and 95 percent relative humidity are shown in Figure 8 The humidity has no significant effect on the optical properties but it does flatten the reflectance curves in the 35 pim to 1 5 jim region somewhat and causes the reflectance to rise slightly faster at wavelengths beyond 2 Im The latter effect results in a slightly lower infrared emittance A reduced emittance of black nickel samples is typically observed after humidity tests The two-day humidity test improves both the a and e values longer tests however cause the coatings to degrade
Table III shows the results of longer humidity tests for samples plated at pH values from 3 5 to 6 5 The samples plated at a pH of 60 have the best humidity resistance Note the thick coating that was plated at pH 6 0 for 92 seconds showed almost no degradation at all after a 13-day humidity test However an undesirable property for this thick coating is its high emittance (23 2 percent before the humidity test) The sample with the best combination of optical properties and humidity resistance was the one plated at a pH of 6 0 for 40 seconds
Summary of the Effects of pH - Before the humidity test samples plated at a pH higher than 60 differ significantly from those below 6 0 At a pH greater than 60 the Zn and 0 concentrations are higher than the Ni and S concentrations near the coating surface This is due to the faster precipitation and deposition of Zn and Ni hydroxide compared to the deposishytion of metallic sulfides
After the humidity test all samples show a decrease in sulfur concenshytration near the coating surface and a corresponding increase in oxygen This change is minimized for the high pH samples that have a high oxygen content to start with
17
Samplenumber pH
Platingtime
a SymbolSy
85 45 40-s 9r4 091
8 88 56 40s 918 093
91 65 40 s 938 119 ___ shy
6- 92
65 92s 944 288
- i E
Before humidity z
4
2
0 3 4 5 7 1 2 3 4 5 7 10 20
Wavelength pm
Figure- 7 - Effect of pH on spectral reflectance -before humidity
numbe PH Plating a C Symbol
8 85 45 40 s 943 090
88 56 40 s 929 090
91 65 40 s 914 105
6 92 65 92s 968 241 ---
After humidity test 4 -
2shy
0 I I I I
3 4 5 7 1 2 3 4 5 7 1 20 Wavelength pm
Figure 8 - Effect of pH on spectral reflectance -
after 48-hour humidity test
18
TABLE III- HUMIDITY RESISTANCE OF BLACK NICKEL SAMPLES PLATED AT DIFFERENT pH
Days in Days at 38C and MIL-STD
95 relative humidity 810B Plating 0 2 4 6 8 10 3
pH time (s) a e a 6 a a a a 6 a
35 40 85 09 - - 80 80 79 82 08 77
40 40 87 07 - - 83 84 83 80 08 81
45 40 90 09 93 09 90 89 89 87 08 79
50 40 91 11 - - 85 84 80 83 - 70
56 40 90 09 92 09 88 86 84 78 07 72
(Standard)
60 40 92 12 - - 92 92 92 87 11 87
60 92 93 23 - - 94 94 94 94 21 92
65 40 93 12 91 10 88 87 84 84 08 74
The spectral reflectance curves of samples plated from pH = 4 5-6 5 are all quite similar After humidity testing the curves are somewhat flattened in the 3 5 jim to 1 5 pm region causing them to have a slightly lower infrared emittance The sample plated at a pH of 6 0 for 40 seconds had the best combination of optical properties and humidity resistance
Effect of Current Density on Coating Properties
The effect of current density on coating composition can be predicted somewhat from the computed potentials for various reactions as shown on Figure 4 At a given pH it is expected that if the current density is too low the reduction of hydrogen and nickel may predominate over the reducshytion of thiocyanate if the current density is too high a multitude of reacshytions occur including the evolution of hydrogen and the precipitation of nickel hydroxide Faster hydrogen evolution was observed at higher curshyrent density in the present experiments
19
Effect ofCurrent Density on Auger Spectra - The Auger spectra of five samples plated using the NASA formula but at different current densities before and after a humidity test are shown in Figures 9 and 10 The humidity test consisted of 48 hours at 38 0 C (1000F) and 95 percent relative humidity The usual current density used in the NASA formula is 4 3 macm2
Before the humidity test as can be seen in Figures 9 and 10 samples plated at different current densities have very similar compositions This means that for the NASA standard formula the current density has very little effect on the coating composition There is a less well defined intershyface between the black nickel coating and the underlyingNi layer when the higher urrent densities are used but the compositions of the basic coating are not very different
This is quite different from the Honeywell black nickel formula that gave two coatings of totally different compositions when they were plated at two different current densities as is shown in Figure 11 The sulfur and nickel content is much greater relative to the oxygen and zinc content for the lower current density (1 macm2 ) Also a large amount of carbon is present in the low current density coating The Honeywell formulation is identical to a bath previously studied by Tabor (Reference 4) who also noticed the two distinct compositions This change in compositions was exploited in the Honeywell two-layer coating to produce coatings with a = 96 and 0 = 07
After the humidity test most of the NASA formula samples show a similar increase in oxygen and a decrease in sulfur content near the coating surface (Figures 9 and 10) The change in oxygen and sulfur is less severe for the samples plated at the current densities of 2 0 macm 2 and 5 0 ma
2cm but basically there is little reason to choose one current density over another based on these Auger spectra for the NASA formula samples
Effect of Current Density on Optical Properties - Current densitiescovering the range of 5 to 5 macmz were used in this study To keep the
thickness of plated coatings roughly equal the plating time was reduced for the higher current densities keeping the product of current density (CD) and plating time constant The spectral reflectance of different current density samples are shown in Figure 12 The coatings plated from the baths with current densities less than 3 5 macm2 show an undamped oscillation in their spectral reflectance curves and have lower solar absorptions Their reflectance cut-off points also change drastically The samples prepared from current densities higher than and equal to 3 5 macm2 have reflectance
damped by absorption and higher overall solar absorptancecurves
The spectral reflectance of the same samples after humidity tests is shown in Figure 13 The spectral reflectances of samples plated with CD 3 5 macm2 were more stable than those of the lower current density samples
20
10 macm 2
Before humidity
10 m 2
After humidity
-- ZnX 2
0
0
NitI
CX 2
250 500 Approximate depth
20 macm 2
Before humidity
750 1000 0
NI
CX2
250 500 Approximate deptj
20 macm2
After humidity
750 1000
NNI
0 250
35 macia 2
Before humidity
CX 2
500
Approximate depth A
750 1000 0 250
35 macm 2
After humidity
500
Approximate depth
750 1000
jZ 2
0250 500 750 1000 0 250 500 Approximat dept A Approximate deptlj
Figure 9 shy ]Effect of current density on Anger spectra i to 35 macm 2
750 1000
0RIGINAL PAGIIN
cr POOR QUALITXT
21
43 macm 2
Before humidity
NI Ni
43 macm2
After humidity
ZnX 2 ZnX
Nf
o
III N
CX2 s N
250 500 Approximate depth A
750 1000 0 250 500 Approximate depth 1
750 1000
50 maVcm2
Before humidity
50 macm 2
After humidity
X 22 CX2 NIN
250 500 750 Approximate depth I
Figure 10 -
i000 0 250 500 750 Approximate deptA
Effect of current density on Auger spectra 43-5 0 macm2
1000
22
2 = 1 mcmCD
Before humidity
010
Xn22shy
0 250 500 750 1000 Approximate depth I
22 macmCD =
After humidity
NI
0 250 500 750 1O0
Approximate depth1
Figure 11 - Effect of current density on the Honeywzell formula black nickel
23
CD 2 Symbol (macmS
8 - 10 82 04
15 90 09
35 91 08 6- eoehmdt
Before humidity43 92 09
50 95 08 -- a- I _ _ _ 1 __ _
-2
0 13 4 5 7
Wavelength g m
Effect of current density on the reflectanceFigure 12-
of NASA black nickel coatings
CD(macm2 ) _ Symbol
8 l1 85 07
15 88 12
35 90 08 10 -43 94
I95 10 -0----o 50 O f 0 After humidity S4 shy
2
0 I
2 3 4 5 7 10 203 4 5 7 1 Wavelength pm
Figure 13 - Effect of current density on the reflectance of NASA black nickel after 2 day humidity test
24
Results of the humidity test on solar absorptance and emittance given in Table IV include samples plated at current densities from 0 5 to 5 0 macm2 Groups I and II represent tests conducted at different times throughout the program Group I was given the standard NASA test for one day and Group II underwent prolonged humidity testing Current densities of 1 5 4 and 5 ma
2cm all gave durable coatings but the coating plated at 1 5 macm 2 had a slightly higher emittance (12 percent before the humidity test) than the other two coatings which had an initial emittance of 9 to 10 percent The absorptance of the coating plated at 1 5 macm2 which was 88 percent was also low compared to the 91 to 92 percent absorptance of the other two coatings After 10 days in the NASA standard humidity all three of these coatings survived with almost no sign of degradation especially the coatings plated at current densities of 4 and 5 macm 2 The absorptance of the sample plated at the NASA standard current density of 4 3 decreased from the orishyginal 90 3 percent to 844 percent after 10 days in the NASA standard humishydity This drastically different behavior for the 4 3 macm 2 compared to the 4 and 5 macm 2 samples is surprising Other samples plated using the standard NASA current density at other times in the program had somewhat
as that of the 4 and 5 macm 2 better humidity resistance but never as good samples
Summary of the Effect of Current Density Variations - For the NASA formula current density has little effect on coating composition whereas samples plated from the Honeywell formula are very dependent on a change in current density
After the humidity test all samples plated at different current densities show a similar increase in oxygen and a decrease in sulfurcontent near the coating surface
Despite similarities in the composition profiles the optical properties were dependent on CD Coatings plated from baths with CD 2 5 macm 2
show an undamped oscillation in their spectral reflectance curves have lower solar absorptions and are less stable Samples with CDs gt-3 5 ma cm 2 have reflectance curves damped by absorptions their optical propershyties are much better and are more stable In particular samples plated at 4 and 5 macm2 were resistant to prolonged humidity degradation while absorptance of the sample plated with the standard (4 3 macm 2 ) current density decreased about 6 percent after 10 days of the NASA humidity test
Effect of Zn++Ni -H Ratio on Coating Properties
The great advantage of including zinc ions in solution comes from the high overvoltage of hydrogen on zinc metal which does not occur on nickel At the start of plating zinc or nickel-zinc alloys deposit on the cathode Due to high overvoltage for hydrogen the evolution of hydrogen is repressed and the reduction of nickel and thiocyanate are favored After the zinc surshyface is covered with a layer of sulfide the overvoltage no longer exists and the plating process goes back to where it started with the deposition of nickel
25
Mb
TABLE IV -HUMIDITY RESISTANCE OF BLACK NICKEL SAMPLES
0ooPLATED AT DIFFERENT CURRENT DENSITIES
Group I Group II Das Days at 38CC and IL-STD
CretCurrent Paig95Plating relative humidity 810B
density (macm2 )
time (sec) a
0 e a
1 a
0 c
4 c
6 a
8 a a
10 G
3 a
05 344 81 05 86 03 81 05 68 63 63 --shy
10 172 85 07 82 04 83 07 75 74 73 73 07 64
15 115 88 12 90 09 88 12 89 89 88 88 11 86
20 86 85 06 84 05 86 06 78 79 79 78 06 74
25 69 84 06 88 06 84 06 81 82 80 80 07 75
35 49 90 08 91 08 86 08 86 86 85 86 O 78
40 43 93 09 94 07 91 09 92 92 91 91 0 95
43 40 94 10 92 09 90 10 89 86 86 84 0 71
(Standard)
50 345 95 19 95 08 92 10 92 92 91 91 07 84
and zinc or nickel-zinc alloy and the evolution of hydrogen The bycle is reshypeated throughout the entire plating process Thus the Zn++Ni++ ratio is expected to have a significant effect on coating composition as well as on coating properties The standard NASA formula has a Zn++Ni + + ratio of 364 In the present experiment the Zn++Ni + + ratio was varied from 1 to
Ni + + 7 exceptwhere otherwise noted was kept at the standard concentration
Effect of Zn++Ni + + Ratio on Auger Spectra - The Auger spectra of four samples plated at different Zn t Nitt ratios before and after two days in the NASA humidity test are shown in Figures 14 and 15 Before the humidity test there are significant composition differences among the samples as the Zn++Ni++ ratio is changed The amount of oxygen decreases with respect to the sulfur and nickel as the Zn++Ni++ ratio is increased which means more sulfides have been formed and less hydroxides have been deposited This is consistent with the theoretical prediction that the high overvoltage of hydrogen on zinc represses the evolution of hydrogen and favors the reduction of thiocyanate Also at high Zn++Ni++ ratios the coating - Ni interface is much less distinct The reason for this change is uncertain
During humidity test the sulfur content decreases and the oxygen conshytent increases for all of the samples These composition changes due to the humidity test are greatest for the samples plated at higher Zn++Ni++ ratios The greater composition changes become visually very obvious when the Zn++Ni++ ratio is as high as 7 The scale for the depth of coating has been changed in Figure 15 for the Zn++lNi++ = 7 sample after the humidity test This spectrum shows that the humidity has penetrated deeply through the coating The change in composition is great for that sample very little Ni is left after the humidity test
Effect of Zn++Ni++ Ratio on Optical Properties - The spectral reflecshytance of the eight samples plated with different Zn++Ni++ ratios were measured in this program Four of the reflectance curves are shown in Figure 16
The spectral reflectances curves of all the samples fall into three distinct groups For Zn++Ni++ ratios from I to 25 the curves oscilshylate in the solar region with a high reflectance in the infrared When the ratio is between 364 and 5 the curves are flat in the solar region damped by absorption and have an intermediate reflectance in the infrared When the Zr++Ni++ ratio is higher than 5 the spectral curve is very flat in the solar region but the reflectance increases too slowly in the infrared There is a sharp change in the shape of the reflectance curves between the Zn++Ni + + ratio of 25 to 364 For a good combination of solar absorpshytion and low emittance a Zn++Ni++ ratio in the range of 25 to 5 is necessary
27
ZnNIr = 015
Before humidity
znlNI = 015
After Iithoiity - NI
II
_ n~nX 2
ZnX 2 -
II
20
00S 0
NI
r
0 250 500
Approximate depth
750 3000 0250 500
Approximate deptI
750 1000
Zn N = 0364
Before humidity NII
zg N r V 0364
After humidity N
k XCl CX2
0 250 500 Approximate depth
750 000 0
----
250
500 Approxiinat Jepth
750 10
ZnZN1 = 05 Zn+N =05
Before humidity After humidity
500 750 1000750 1000 0 2500250 500 Approximate deptljApproximate depthi
Figure 14 - Effect of Zn-l-Ni + + ratio on Auger spectrafor Zn+Ni+ from 15 to 5
28
----------------
- =Zn++NI 07
Before humidity
ZnX 2
C X
0 250 500 750 1000
Approximate depth i
Zn++Nl- = 07
After humidity
ZnX 2
glt
0 NI
V Ni CX 2 S
0 250 500 750
Approximate depth 4
Figure 15 - Effect of Zn++Ni++ ratio on Auger spectra + + at Zn++N = 7
1000
29
Sample ZnNi number ratio
62 15 8
66 364
69 566 -
85
93
93
94
e
08
11
13
24
Symbol Smo
-
-shy - 0-
o Before humidity test
- 0P 0)0
3 4 5 7 1
Wavelength pm
1Ater humidity test 8
0 ~~~
Figure 16 - Effect of Zn++Ni++ ratio spectral reflectance
0-shy0
0 10
74
16 2 3I I I
on
7
I
---shy
10
6
Fiur41-0f
Efec of number ratio o
81 W Sample ZnNI Symbol
00
o
1i
66H
62H 15
364
89
92
07
10
0
3 4 I
5 7
Figure 17
69H 5
F71H 7
- 1i
1 2 3 4 5
Wavelength prm
- Effect of Zn - INi + + ratio on reflectance after humidity
91 10
58 107
I20
7 0
spectral
-o-oshy
2
30
At high zinc ion concentration or when the Zn++Ni++ ratio is greater than 5 the coating looks gray This is probably due to too much free nickel metal in the coating which also accounts for the very flat spectral curve and the high emittance (24 percent) This free Ni can be seen in the Auger spectra (Figures 14 and 15) as the indistinct Ni-coating interface
The reflectances of the same coatings after 48 hours in the NASA standard humidity test are given in Figure 17 A reflectance increase in the 1-2 jim wavelength region can be seen for most of the samples This change is more pronounced for the low and very high Zn++Ni++ ratio and is not as significant for the Zn++Ni++ ratio between 25 and 5 The oscilshylation of the low Zn++Ni++ ratio curve is damped by absorption after the humidity test The coating with Zn++Ni++ = 7 was almost completely degraded by the humidity its solar absorption decreased from 94 percent to 58 percent This coating could be wiped off by rubbing gently after the humidity test
The results for samples plated at Zn++Ni++ ratios from 1 to 7 with Ni++ kept at the standard concentration are summarized in Table V Samshyples plated at a Zn++Ni++ ratio higher than the standard ratio had a high initial absorptance but they degraded badly The degradation increased as the ratio was increased Samples plated at a Zn++Ni++ ratio lower than the standard ( 364) had a low absorptance initially after ten days of the NASA humidity test their absorptances were either increased or about the same after another three days of 810B humidity test their absorptances were only slightly decreased The a changes are probably strongly deshypendent on the exact position of minimums in the reflectance spectrum for these samples At the initial stage of humidity degradation samples plated at the lower Zn+-l-Ni++ ratios changed their colors from an original gold or yellowish blue to a blue or dark blue Further humidity exposure changed the colors only slightly This indicates that the initial humidity exposure probably oxidized or hydrolyzed the coatings near the surfaces and that proshytected somewhat the coatings underneath Note that the solar absorptance of all of the Zn++Ni++= 364 samples stabilized at about the same level of a - 82 Considering the low initial of a of the Zn++Ni+- lt 25 samples and the poor durability of high ratio samples it is probably best to use the standard NASA Zn++Ni++ ratio of 364
Effect of Ni++ Variations from Standard NASA Formula - To detershymine effects of Ni++ concentration a limited test program was undertaken The properties of samples prepared using the NASA standard formula but with variation from the recommended Ni++ content (Zn++ content held conshystant) are shown in Table VE The test procedure used for these samples is as follows
Solar reflectance and IR emittance of freshly prepared samples were measured A MIL-STD-810B humidity test was then given to one sample for one day and the solar reflectance was measured
31
--- --- ---
TABLE V -HUMIDITY RESISTANCE OF BLACK NICKEL SAMPLES PLATED AT DIFFERENT Zn++Ni + + RATIOS
Days at 38 0C and Days in 95 relative humidity MIL-STD
8101 - I
[7n++ Plating 8 10 3
Time 0 4 6 a(S) a e a a a a s
88 86 86 07 8182 88010 40 08
79 08 84 82 80 82 07 78015 40
81 78 78 76 06 70020 40 79 08
40 81 06 84 83 80 81 07 79025
11 88 84 82 82 08 800364 40 93
(Standard)
40 92 11 85 81 78 7-7 08 75040
92 13 86 82 80 78 --- 8050 40
-93 24 43 ---070 40
TABLE VI- EFFECT OF Ni + + CONCENTRATION CHANGE ON HUMIDITY OF NASA STANDARD FORMULA COATINGS
After 1 After + 1 day[Ni++ ] Sample Before day 810B 4 days
NASA test 8101B(g) number humidity humidity
l aagp e a aas a
20 72 0 886 006 0673 0 881 0682
0 901 0 74522 74 0909 006 0 839
008 0876 0895 07352345 77 0906
(Standard)
0908 0784245 79 0911 007 0792
26 81 0 918 008 0 849 0 891 0690
862 0 874 070830 82 0908 007 0
0 919 007 0 828 0917 079350 83
80 84 0900 007 0 865 0900 0 811
32
ORIGINAI PAGE 18 OF POOR QUAIXY
A second sample was given four days exposure to the NASA humidity test and the solar reflectance was measured That sample was then given the MIL-STD-810B test for one day and the solar reflectance was measured again
There is no spectacular improvement in the humidity resistance for anyof these samples they all degrade substantially in the 4-day NASA + 1-day810B tests However samples prepared with high Ni ++ content seem to be somewhat more durable than the low Ni++ content samples
Summary of the Effects of Zn++Ni++ Ratio - As the Zn++Ni++ ratio is increased the amount of oxygen decreases with respect to sulfur and nickel concentration This implies that more sulfides have been formed and less hydroxide has been deposited At high Zn++Ni + + ratios free metallic nickel is present in the coating especially near the coating-Ni substrate interface
After humidity testing the sulfur content decreased while the oxygen content increased This occurred for all the samples but was greatest for the higher Zn++Ni++ ratios
Zn++Ni++ ratios in the range of 364 to 5 gave the best combination of solar absorption and low emittance If the ratio is too low the curves oscillate in the solar region with a high reflectance in the infrared If the ratio is too high the reflectance increases too slowly in the infrared and the emittance is high
Although they have a high initial absorptance the samples plated at a Zn++Ni ++ ratio higher than the standard degraded badly after the humidity test Samples plated at a lower Zn++Ni++ ratio had a low absorptanceinitially but after humidity testing either increased their absorptance or remained constant A Zn++Ni++ ratio near the NASA recommended value of 364 gives about the best combination of durability and optical properties
Increasing only the Ni+ content of the bath while keeping the Zn++ content constant increases coating stability slightly
Effect of Temperature on Coating Properties - Since the rates of different reactions are affected differently by increasing the temperature coating compositions will be affected by the bath temperature Another effect the temperature may have is to change the solubility of sulfides and hydroxides of nickel and zinc No attempt was made to compute these changes theoretically Samples were prepared at 101 different temperashytures in the experimental study The NASA standard formula recommends that the temperature be kept in the range 21 to 26 70C
33
Effect of Temperature on the Auger Spectra - Samples were plated at (65degF) to 52degC (125WF) in 5 6bC (10-F) intervals attemperatures from 18deg0
) and at a lower currentboth the standard high current density (4 3 macm 15 macm2 ) Since the low current density samples gave essenshydensity (2
tially the same results as the high current density samples those results will not be presented The Auger spectra of four of the samples before and
given in Figures 18 and 19 Since chemicalafter the humidity test are at a faster rate as temperature is increasedreactions generally proceed
the plating times in the depositions were varied in an attempt to keep the The rule we used to calculate the platingcoating thicknesses constant
times was that reaction rates double for every 10degC temperature increase
This rule did not work well for the black nickel plating reactions as can be which show different thicknesses for differentseen from Figures 18 and 19
temperature samples At higher temperatures the coatings are thinner
since the reaction rates did not increase as rapidly as expected with temshy
perature
similar ex-The composition of samples before the humidity test are cept that the sulfur increases slightly toward the coating surfaces as the
This sulfur increase resulted in less stableplating temperature increases coatings as evidenced by larger changes in the Auger spectra (note especishy
ally the change in zn content) and decreases in solar absorptance after the The oxygen content was more strongly affected at lowerhumidity test but this change did not affect optical properties as muchtemperatures
Optical Properties - Spectral reflectancesEffect of Temperature onof samples plated at different temperatures before the humidity test are
shown in Figure 20 Those after a 48-hour NASA humidity test are shown in Figure 21
The wavelength at which reflectance curves rise (a rough indication of
coating thickness) decreases as the temperature is increased which again
shows that the usual rule used to calculate plating times did not work in This result is probably due to the fact that all reactions inshythis case
cluding both those favoring the deposition and those preventing the deposishytion became faster as temperature was increased
The most significant result of this experiment is the distinct change in
shape of the spectral curves as the temperature changes from 18 to 290C See Figure 20 At 180C and 240C the curve is flat in the solar region damped by absorption whereas at 299C the reflectance curve has a dis-
Since the flat spectral shape has higher absorption andtinct oscillation is less sensitive to thickness errors keeping the temperature at or below 240C is quite important
Among these samples the ones plated at lower temperatures were more stable showing smaller changes in spectral reflectance The sample plated at 180C was the most stable
34
180 C (59 S) 18C (59 S)
Before humidity After humidity
ZnX 2
NNI
0 260 4do 660 80 1000 Approximate depth A
1200 14bo 1600 260 40 660 86o idoo Approximate depth i
12bo1 4oo 1600
24-C (40 S)
Before humidity
24C (40 S)
After humidity
ZnX2 NI
0 250
290C (27 5)
Before humidity
_ --
500
Approximate depth~ZnX2
750 1000 0
00
250 500
Approximate depthA
29degC (27 5)
After humidity
750 1000
NI
0 250 500 750 1000 0 250 500 750 1000 Approximate depth I Approximate depth I
Figure 18 - Effect of temperature on Auger spectrafrom 1800 to 290C
35
46oC (9S) 46oC (9S) Before humidity After humidity NHi
ZnX 2
Z ZnX2Ni
02 I
NI s CXNIIICX ~
250 500 750 1000 0 250 500 750 10000
Approximate depth A Approximate depth A
Figure 19 - Effect of temperature on Auger spectra 460C
As previously mentioned the coatings plated at high temperatures were thinner because we overcorrected for the expected change in reaction rates Hence the high temperature samples may have been less desirable because they were thinner To eliminate this factor another set of samples was prepared for which the thicknesses were nearly the same at various plating
are shown in shytemperatures The spectral reflectances of these samples Figure 22 A significant oscillation in the reflectance curve begins at 270C and increases as the temperature is increased The result is that samples plated at higher temperatures have lower solar absorptance
Reflectance curves of the same samples after the humidity test are shown in Figure 23 After the humidity test all reflectance curves are flattened in the solar region damped by absorption and the reflectance cut-off points are pushed toward shorter wavelengths Results of these two
These results areeffects are a higher absorption with a lower emittance usually observed for samples subjected to a short and less severe humidity test e g 48 hours at 380C and 95 percent humidity Longer or more severe humidity tests usually cause a decrease in absorption as will be discussed below Among the sample reflectance curves shown in Figures 22 and 23 the lower plating temperatures again displayed the smallest changes even though the coatings were of roughly equal thickness
36
1 Before humidity test o
6- 07 Temperature Time Symbol
4 i 1830C(65degF) 590
2390C(750F) 40
2 ~2940cw850F) 27 N0 - I 406C(105F 126
bull 0 i _ _ _ _ _ _ _ _ _
2L 0 517C(125F) 58 0 0 I
3 4 5 7 1 2 3 4 5 7 10 20
Wavelength gm
Figure 20 - Effect of temperature on spectral reflectance before humidity test
1- After humidity test
68 ___
emperature Ti Symbol0 - (OF) (S)
4 1830o(65oF) 59
239C(75F) 40 bulliI o Ji 294C(85F) 27
2 - 7406C(1050F) 126 -o
- -470C(1250F) 58
0 3 4 5 7 12 3 4 7 ib 20
Wavelength pim
Figure 21- Effect of temperature on spectral reflectance after humidity test
37
0Sample Temp Plating e Symbol number time
93 (722degC(72o F) 40s 935 096 0
8- 96 6 40 901 076 8 96 - (800 F) ___ _______
97 (8-) 40 897 079 0
Before humidity test
i
S4
-2 -
Z
0
Sample
number Te Plating
ine u e Symbol
bull - -- ~~ (0F) (322C 40
30
865
864
068
073
-o0shy
0 i5
I
3 4 5 7 1 2 3 4 5 7 10 20 Wavelength gm
Figure 22 - Effect of temperature on spectral reflectance
1 Sample Plating Temp ltm Symbol - -
number time ____ __
222C 40s 957 103 shy93____ (72-F) 18 267degC 96 (80F) 40 877 055
shy294-C 97 (85F) 40 932 066 ---
6 After humidity00
4shy
Sample Temp Plating bol
2 number time Sym
32 2oC 898 067 -o-o
99 (9OC) 40 0 0
0 322- C
001 (90 F) 30 877 056
4 5 10 20 3 4 5 7 13
Wavelength um
Figure 23- Effect of temperature on spectral reflectance
ORIGINAL PAGE IS38 OF POOR QUALITY
The results of both short and prolonged humidity tests on a and e for samples plated at temperatures from 180C to 520C are listed in Table VII The suggested plating temperature range in the NASA formula is from 210C to 270C The most stable samples in Table VII were those plated at 220C 240C 290C and 350C for 40 seconds The samples plated at the higher temperatures 290C and 350C were thicker than those samples plated at lower temperatures with the same plating time The good humidity resisshytance of the samples plated at 290C and 350C was probably due to this greater thickness However the solar absorptance of these thick coatings plated at high temperatures was too low (a = 80 to 85 percent) Thus to obtain durable coatings with good optical properties it is important to keep the plating temperature between 220C and 240C
Summary of Effects of Temperature on Coating Properties - As the temperature is increased the sulfur content increases near the coating surface resulting in a less chemically stable coating
Before humidity testing samples plated at 18 to 240C have reflectance curves that are flat in the solar region For samples plated at or above 270C the reflectance curves have a distinct oscillation in the solar region and the samples have a lower solar absorptance
After short term humidity testing samples from 180C to 350C have reflectance curves flattened in the solar region while those above 350C still have the oscillation
In long term humidity tests the 180C sample also degraded Hence to obtain durable coatings with good optical properties the temperature should be between 220C and 240C
The Effect of Thiocyanate Concentration on Coating Properties
The SCN ion provides the sulfur which allows the deposition of nickel and zinc sulfides in the plating process Notice in Figure 24 that higher concentrations of thiocyanate ions enhance the reduction reactions Thus the SCN concentration is expected to have a significant effect on coating properties In this experiment plating solutions with ten different concenshy
3 to 30 gt were used to producetrations of NaSCN covering the range black nickel coatings The standard NASA formula was 15 gt of NaSCN
Effect of SCN- Concentration on Auger Spectra - The Auger spectra of four representative samples plated at different NaSCN concentrations before and after a two-day NASA standard humidity test are shown in Figure 24 The most significant effect of thiocyanate concentration on the coating composition is the increase in sulfur content as the thiocyanate concentration increases The sulfur increase is most obvious when the sodium thiocyanate increases from 15 gL the NASA standard formula
39
TABLE VII- HUMIDITY RESISTANCE OF BLACK NICKEL SAMPLES PLATED AT DIFFERENT TEMPERATURES
Days at 38C and 95 relative humidity
Days in MIL-STD
_810B
TemperaturedegC F
Platingtime(s) a 0 4a 6aY 8a a 10 3
a
183 65 59 95 19 80 74 72 70
222 72 40 92 10 91 92 91 89 08 80
239 75 40 91 10 90 89 85 86 08 78 (standard)
267 80 40 90 08 86 85 81 80 06 67
294 85 40 85 08 89 89 87 87 07 77
294 85 33 88 08 88 85 86 84 06 75
294 85 27 88 06 83 81 79 78 06 67
350 95 40 80 08 83 84 84 85 07 82
350 95 18 86 05 77 78 72 71 06 60
406 105 13 K83 05 67 67 63
461 115 9 77 05 56 55
517 125 6 67 04 52 50
to 21 gI At low SCN- concentration the coating S content is low but the 0 and both Ni and Zn are at about the same level as coatings produced at high SCN- concentration This indicates that at low SCN- concentration there may be more free metals in the coating resulting in flatter reflectance curves and higher emittance
After the two-day humidity test an increase in oxygen and a decrease in sulfur near the coating surface occurred for all the samples can be seen on the Auger spectra in Figure 24 A slight decrease in nickel near the coating surface can also be seen on Figure 24 Based on the Auger data no parshyticular NaSCN concentration appears to offer greatly enhanced humidity resistance
Effect of NaSCN Concentration on Optical Properties - The effect of the variation of SCN content keeping all other variables constant on the spectral reflectance of the coatings is shown in Figure 25 The curves are flatter at low SCN- concentrations also at very low NaSCN concentration (3-6 gt) the emittance has increased to 12 to 15 percent Both of these effects are probably due to the presence of uncombined metals in the coating as was also suggested from the Auger data
At high NaSCN concentrations (greater than 15 glt) oscillations begin to appear in the spectral reflectance curves The oscillations become very large at NaSCN = 25 gt Such oscillations indicate insufficient absorption in the solar region so that a NaSCN concentration below 24 gt may be necessary
The reflectance curves of the same samples after 48 hours in the NASA standard humidity chamber test (380C and 95 percent relative humidity) are shown in Figure 26 An important effect is an increase in reflectance of some of the samples in the 1 to 2 aLm wavelength region compared to samples before the humidity test This effect is more pronounced for the high NaSCN concentration and is not very significant for NaSCN less than 24 gIl Thus for greater stability concentrations of NaSCN greater than 21 gl should be avoided
The effect of the prolonged humidity test on a and s values for samples plated at all the different NaSCN concentrations are listed in Table VIII NaSCN concentrations that gave durable coatings were scattered in the range of 6-21 g The results in the table do not show a clear pattern for coatshying durability Samples plated at the NaSCN concentrations of 6 gt and 21 gt had the best humidity resistance It is likely that any concentration in the range of 6 to 21 g would give roughly equivalent durability properties
41
-- ------
Ni NaSON 9 gt
Before humidity Afterhuml thty N
NaSCN 9 g4t
Be3 z~ ZnX 2 I-
0205070
Approximate
NaSCN 15 git
Before humidity
S
depth A
1000 0 0 250 500
Approximate depth I
NaSCN 15 gPt
After humidity ZnX
750 1000
2
NaSCN
Before
ZnX 2 -
a0
250
Aporox
21 gil
-humidity-
500
atedepth J
750 1000 0
250
NaSCN 21 qL
After humidity
ZnX 2
500
Approximate depti
750
N
1000
__C_2
0 250
500
Approximate depth A
Figure 24
750 1000 0
- Effect of NaSCN
Auger spectra
250 500
Approximate depthA
concentration on
750 1000
42 ORIGINAL PAGE 5
OF POOR QUA TIF2
-c SymbolSamgle NaSCN num er concentration
8 bgt 95 14
38 12 gt 94 10
15 gt 95 12 _39 43 27 gi 89 07
o
f4 Before humidity test
bull
2
0 t I I I
4 5 7 10 2033 4 5 7 1 2 Wavelength pm
Effect of sodium thiocynate concentration onFigure 25-spectral reflectance
Symbol-Sample NaSCN a E
number concentration
36H 6 gt 964 089 yA8
38 H 12 q t 942 094 -
39 H 15 gt 952 096 A
6 43 H 27 1t 893 053
C4 After humidity test
4
3 4 5 7 1 2 Wavelength Pm
3 4 5 7 10 20
Figure 26- Effect of sodium thiocyanate concentration on spectral reflectance after humidity test
ORIGINAL PAGE IS OF POOR QUAIL
43
TABLE VIII HUMIDITY RESISTANCE OF BLACK NICKEL SAMPLES PLATED AT DIFFERENT NaSCN CONCENTRATIONS
Days inDays at 380C and MIL-STD
95 relative humidity -TD810B
NaS CN Plating 0 2 4 6 8 10 3 (g4) s) a c a a a a a c a
30 40 93 121 93 11 84 84 86 80 09 73 1
60 40 95 141 96 09 93 92 91 90 13 88
90 40 94 111 96 12 92 91 88 88 10 80
120 40 94 101 94 09 91 88 85 84 10 80
150 40 93 12 93 10 92 93 91 91 09 83 standard)
180 40 91 09 1 90 08 91 o90 88 90 09 80
210 40 92 101 92 08 91 91 89 89 08 86
240 40 89 11 1 89 08 89 89 86 86 08 81
270 40 89 07 89 05 85 80 79 76 06 65
300 40 87 07 189 07 83 83 80 81 07 78
Summary of the Effects of Thiocyanate Concentration - As the thiocyshyanate concentration is increased sulfur content in the coating increases After humidity testing the usual increase in oxygen and decrease in sulfur content can be seen near the coating surface
At low SCN concentrations the reflectance curves are flatter and have higher emittances probably due to free metal in the coatings At high SCNshyconcentrations oscillations appear in the spectral reflectance curves After humidity testing ihere is an increase in the solar reflectance for high NaSCN concentrations of greater than 21 gIl Coatings in the range 6 to 21 giL have the best prolonged humidity resistance
Effect of Ammonium Ion on Coating Properties
Presence of the ammonium ion is very important in black nickel plating Without ammonium ion the coating will be nonadherent and smutty3 The functions of ammonium ion are summarized as follows
Prevents too great a rise in pH by buffer action and thus favors the reduction of thiocyanate and hence metal sulfide formation
Suppresses the formation and precipitation of hydroxide salts of both nickel and zinc
Reduces the metallic nickel and zinc contents in the coating by forming ammonia complexes of nickel and zinc which are more difficult to reduce into free metals than uncomplexed nickel and zinc ions
The suppression of metallic ion reduction permits the reduction of thiocyanate to proceed
In this experiment six NH4+ concentrations in the range 3 to 8 gL were investigated The NH4 + concentration of the standard NASA formula is 5-6 gIl
+Effect of NH4 Concentration on Auger Spectra - The Auger spectra of three representative samples plated at different ammonium concentrations are shown in Figure 27 No significant difference was found among the Auger spectra either before or after the two-day NASA standard humidity test Although production of good coatings requires the presence of NH4 +
ions the coating composition is not very dependent on the exact concentration
45
Nill4 = 49ft N 4Vt
Before humidity After humidity
Zrn2 M I
0 250 500
Apprormmate depthI
NH4 += 56 qJt
Before humidity
750
X
1000 0
NH4
After
C 2
250 500 Approximate depth
56
lvvxmdlty
1 750 1000
NN_
ZX 2 X2
0 250 500
Approxm tedepth
750 3000 0 250 500
Appommmte depth - 750 1000
ig4u 2 Efc
Befor-humiity-AfterZnnX 0N
o N4 c on Auger
huJmidity 2
4ONI
- -- shy
250 500 750 Appmae depth j
Figure 2 7- Eff ect of NET+
3000 0 250 500 75D Appoorlmde depth
concentration on Auger spectra
1000
Effect of NH4+ Concentration on Optical Properties - Coating insensishytivity to the level of NH 4 + concentration is also apparent from the optical properties The small effect of NH4+ concentration on the spectral reflecshytance of three coatings is shown in Figure 28 All the curves are similar
The spectral reflectance of the same samples after the 2-day NASA humidity test are shown in Figure 29 A similar increase in reflectance in the 1 to 2 tim region and a decrease of the bump at 0 9 11m is observed for all the samples The overall solar absorption is actually increased in this short humidity test However degradation of a results from the longshyterm humidity test for all samples plated at various NH 4 + concentrations as given in Table IX Table IX again shows that NH4 + concentration has very little effect on the coating optical properties and humidity resistance
+ +Summary of the Effects of NH 4 Concentration - If the NH 4 concenshytration is at least 3 g 4t (the smallest concentration tested) further inshycreases in NH 4 + concentration have little effect on coating optical propershyties or humidity resistance
TABLE IX- HUMIDITY RESISTANCE OF BLACK NICKEL SAMPLES PLATED AT DIFFERENT NH 4 + CONCENTRATIONS
Days at 38degC and Days in 95 relative humidit MIL-STD
NH4+ Plating 810B 4 Time 0 4 6 8 10 3
gt (s) a a a a a e a
30 40 88 09 88 89 87 88 09 81
40 40 88 08 89 90 87 90 09 82
50 40 84 08 87 87 86 86 07 76
56 40 86 08 88 88 86 87 07 84
(Standard)
70 40 86 08 88 89 88 89 07 83
80 40 86 08 88 90 87 88 08 81
47
1N Sample a C Symbol number tration __ -____
8 52 4 gt 91 08
55 56 gt 90 08
58 8 gt 90 09 6 ~~Before humidity test
0 Before humidity test
0
3 4 5 7 1 2 3 4 5 7 10 20 2 Wavelength pm
coner- y Figure 28- Effect of ammroniuml ion concentration on
spectral reflectance before humidity test
Sample NH4 + C Symbo Number - -
tratlon
8 52 40 gt 93 09 55 56 g 93 08 2-3 4570
l- -_ 09 _- - -i - --58 8 94- - 95
spectral refl an 1 After humidity testbefo
4
01
3 4 5 7 1 2 3 4 0 20
Wavelength Pm
Figure 29- Effect of ammonium ion concentration on spectral reflectance after humidity test
ORIGINAL PAGE
OF PO01R QUAL=TY
48
Summary of the Parameter Study and Improved Black Nickel Formulas
Auger analysis of nearly all the samples exposed to humidity showed the conversion of metal sulfides to metal oxides or hydroxides near the coating surface with a corresponding degradation in solar absorptance In this proshycess the sulfide is washed from the surface by the humidity which is probshyably the source of the optical degradation This process can be greatly imshypeded by depositing coatings which are initially rich in hydroxides and which have a minimum amount of sulfur This was the basic strategy used to obtain more humidity resistant coatings Based on the parameter study it was found that an increase in oxygen and decrease in sulfur content could be accomplished by increasing the bath pH (and possibly current density) or by decreasing the Zn++Ni++ ratio (or Zn concentration) the temperature or the SCN- concentration Within certain limitations (namely the maintenance of good optical properties) these changes were incorporated in the improved plating formulas to be described below
A second general strategy which can be used to improve the coating is to simply plate thicker black nickel coatings Although in the initial stage of humidity exposure most of the coatings seemed to be oxidized or hydrolyzed by the humidity beyond that stage further humidity exposure degraded the coatings less severely and more slowly Thus the degradation stabilized near the coating surface As a result thick coatings had significantly better humidity resistance although they also usually had an undesirable higher emittance However it is possible to adjust the coating thickness along with other favorable parameters to optimize both the optical properties and humidity resistance
The improved plating formulas were actually derived through an iterashytive process using as general guidelines the desire to reduce the sulfur conshytent and to increase the coating thickness The stability of optical propershyties under humidity exposure for all of the coatings studied in this developshyment phase are given in Table X In each case the variations from a basic formula are indicated Also the average properties obtained with the NASA standard solution are shown for comparison The composition of the three new solutions studied are listed in Table XI along with the composition of the NASA standard solution
Among all of the bath compositions and plating conditions studied the two indicated by the asterisk on Table X gave the best combination of humidity resistance and optical properties Note that after 14 days in the NASA standard humidity chamber the absorption for both of these samples was better than 0 91 Among these two samples the one plated for 45 seconds had considerably better resistance to the severe MIL-STD-810-B humidity test but its initial optical properties are not quite as good as those for the sample plated for 40 seconds Since we feel that the 810B test is
49
TABLE X -HUMIDITY RESISTANCE OF IMPROVED BLACK NICKEL COATINGS
(a) Solution I
Before 810 B humidity NASA standard humidity density Time humidity 1 day 4 days 4 days 10 days 14 days 20 days
2 ) (S)(macm
40 40 882 07 694 883
40 45 849 07 821 --- 887
40 50 812 09 834 --- 864
50 40 865 07 835 --- 876 - ---
50 45 791 13 865 --- 845 ---
50 50 814 12 832 --- 853 --- - --shy
60 40 797 09 841 772 872 ---
60 45 822 11 859 789 820
60 50 794 13 819 --- 855 ----
(b) Solution 2
40 40 911 07 888 --- 908
40 45 918 07 745 --- 912
40 50 913 09 755 --- 884
50 40 930 10 665 --- 892
50 45 896 09 817 --- 914
50 50 904 11 893 --- 926
60 40 904 10 905 775 937 --- 839 --- 786
60 45 896 11 946 856 946 890 848 10 832
60 50 906 21 908 --- 929
( ) Solution 3
- 50- 48 898 07 856 786 --- 855 813 --- 805
50 48 877 10 877 821 --- 927 898 --- 897
60 37 892 08 901 838
60 40 907 10 842 751 --- 924 917 10 906
60 45 885 12 902 867 --- 928 913 14 886
60 47 890 --- 834 754
70 35 899 10 588 485 --- 868 814 --- 806
70 43 896 13 785 649 --- 921 902 --- 884
70 48 880 22 866 795 --- 916 891 --- 885
(d) Standard NASA solution average
43 40 900 097 1 846 891 783 721 7 670
ORIGINAL PAGE IS OF POOR QUAIUTX
50
TABLE XI- COMPARISON OF NASA STANDARD FORMULA AND NEW BATHS
Platingbath NASA New New New parameter standard bath bath 1 bath 2 bath 4 3
pH 56-57 60 60 60
Temperature (C) 222 222 222 222
Current density 43 (macm2 )
EN11J (gl) 56 70 70 70
NaSCN (g~l) 150 150 150 60
Zn++Ni+ 0346 0 10- 030 030
[Ni++] (gl) 2345 2345 2345 2345
Time (S) 400 --
more severe than necessary to simulate long-term humidity effects the thinner (40 second) coating would probably be satisfactory
Thus the recommendation of this program is that the formula given in
Table XII be used for solar absorber applications of black nickel coatings
TABLE XII- RECOMMENDED SOLUTION
Nickel sulfate (NiSO4 6H 2 0) 539 gl
Nickel ammonium sulfate [NiSO4 (NH4 )2SO6H2 02 76 7 gil
Ni+ + 2345 g1l NN4+ 70 g1l
Zinc sulfate (ZnSO7H 2 0) 30 9 gl
Zn++Ni + 030
Sodium thiocyanate (NaSCN) 6 g1l
60pH
Temperature 222degC (72degF) 6 0 (macm )
Current density
40 secondsTime
Note The time can be increased to 45 seconds if greater humidity resistance is shown to be needed in long term tests but this would degrade the optical properties somewhat
51
Polymeric Overcoats to Protect Black Nickel
An alternative approach Which was investigated briefly in the program was the use of polymeric overcoat materials to protect underlying black nickel coatings A key requirement for such a polymeric coating is high transparency in the infrared so that the low emittance of the black nickel coating is not increased Three polymeric materials which in previous work1 were found to be very transparent in the infrared were investigated The three materials were ethylene propylene material (EPM) ethylene propylene diene material (EPDM) and a silicone-based polymer All three were shown to adhere well to black nickel coatings Thickness for the polymeric coatings was 10-2 cm The silicone coating was found to drastishycally increase the emittance for coatings of this thickness to over 0 60 in most cases The EPM and EPDM materials have nearly identical IR absorpshytion spectra and both increased the emittance by - 8 percent when used at the 0 01 cm thickness Thinner coatings could not be made without pinholes At 0 01 cm however these coatings did give a considerable degree of humidity protection to the black nickel coating EPDM coating on the NASA standard black nickel was subjected to three days in the 810B humidity test with minimal effects as shown in Figure 30
8 NASA black nickel with 01 cm EPDM overcoat before and after 3 day 810-B
8 humidity test
I shy6shybull After
4Before 89 17
91 18I After
Before humidity2-
2
Figure 30 - Effect of humidity on a black nickel coating with EPDM overcoat
52
In addition to the increased emittance there are several other problems associated with practical use of polymeric overcoats on a flat-plate collecshytor The EPDM material has double-bonded molecular structure which may be susceptible to UV degradation The EPM has no double bonds but it may have the disadvantage of flowing slightly if used on a warm inclined plane such as a flat-plate collector Another serious problem is the lack of stability for both the EPM and EPDM at the elevated temperatures which may temporarily result when cooling fluid is not circulating in a flat-plate collector Both materials were found to burn off in less than one hour at 232 degC (450 OF) which is a temperature that may be achieved under thermal runaway conditions
In summary none of the polymeric material investigated in this proshygram or others that we are aware of can fulfill all the requirements which would be needed asa practical polymeric protective coating
CONCLUSIONS AND RECOMMENDATIONS
Conclusions
The objective of this program was to determine an improved technique for electroplating of black nickel coating which would increase the coating resistance to humidity without sacrificing its excellent selective absorbing optical properties The optical properties of the best new coatings before and after various humidity exposures are compared in Table XIII to that of the NASA standard formula which served as the baseline for the program
TABLE XIII- HUMIDITY RESISTANCE OF OLD AND NEW FORMULAS
NASA standardBefore MIL-STD 810B humidity humidity
1 day 4 days 4 days 10 days 14 days 20 days
NASA standard 0900 0 097 0 846 --- 891 783 721 --- 670
New formula
40 second electroplate 902 10 842 751 --- 924 917 10 906
45 second electroplate 885 12 902 867 928 913 14 886
53
The new formula plated for 40 seconds is more susceptible to the severe MIL-STD-810B humidity test than is the 45-second coating but in the NASA standard test (38degC at 95 RH) both coatings do equally well The thinner coating has the advantage of somewhat better optical properties Both new coatings do substantially better than the baseline NASA black nickel coating
Recommendations
It is recommended that the new solution formula developed in this proshygram be used for a flat-plate solar demonstration program A critical need exists for long-term field condition testing of black nickel coatings
It is likelythat more small-scale experimentalwork involving iterations of the plating variables could further enhance both optical and humidity resisshytance of black nickel coatings In other words although the coating propershyties were greatly improved during this program they have not been totally optimized In particular the better solar properties obtained in some preshyvious work (a - 0 96 and e- 0 07) might be approached through further effort
The use of polymeric overcoats to protect black nickel coatings cannot be recommended at this time Suitable materials which simultaneously fulshyfill the requirements for low IR absorption high temperature stability and the ability to provide humidity protection have not been identified
REFERENCES
1 H Y B Mar J H Lin P B_Zimmer- R-E -Petet-sdn and-J S Gross --Optical- Coatings fr-Flat Plate Solar Collectors Final Report for
ERDA under Contract No NSF-C-957 (AER-74-09104) September 1975
2 Metal Industry pp 23-25 January 1921 pp 73-74 February 1921
3 E J Serfass R F Muraca and W R Meyer An Explanation of Black Nickel Plating 39th Proc AES 101 (1952)
4 H Tabor J Harris H Wenberger and B Doron Further Studies on Selective Black Coatings U N Conf on New Source of Energy Paper E Conf 35546 Rome (1961)
5 NASA Technical Brief B73-10156
6 NASA Technical Brief M-TU-74-3 The Development of a Solar-Powered Heating and Cooling System MSFC May 1974
54
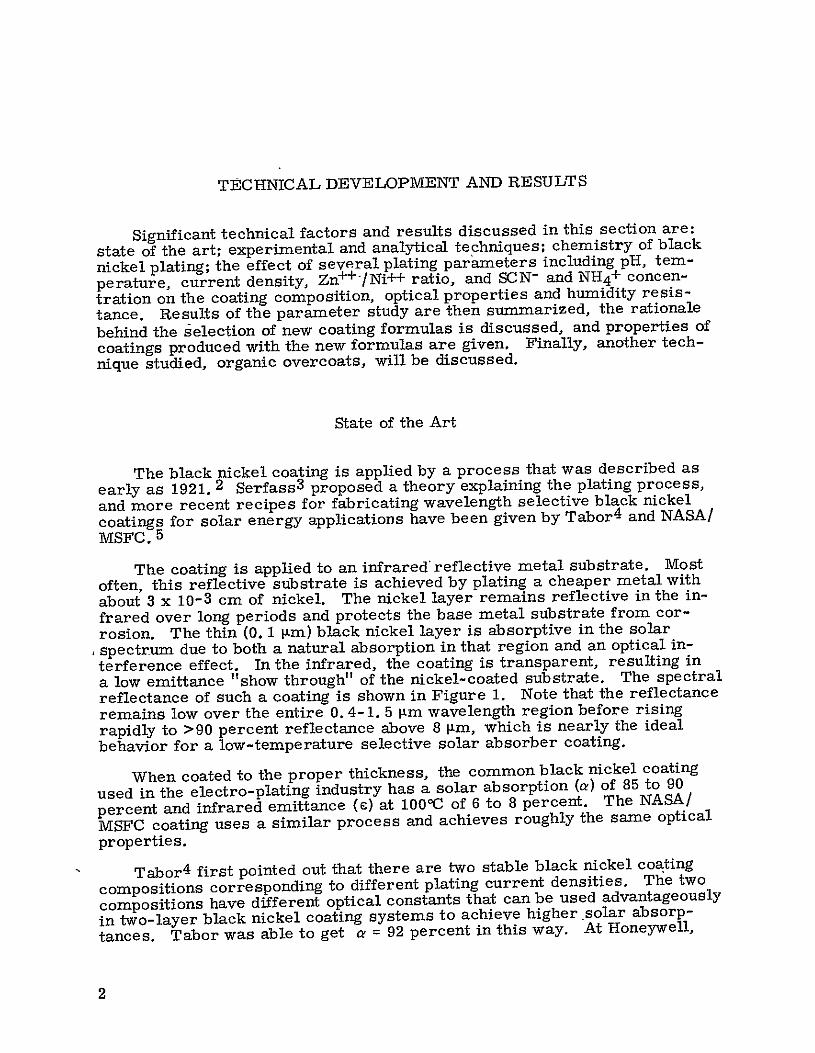
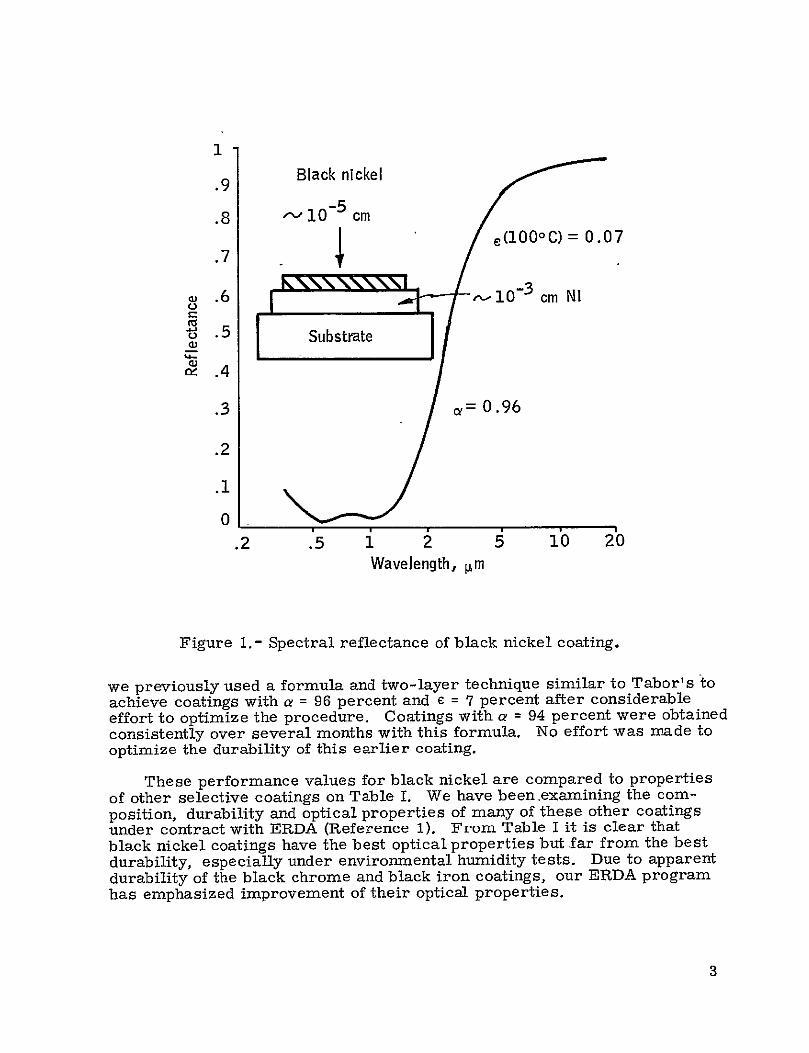
1
9 Black nickel
10 - 5 8 cm e(loMC = 007
7
c 6 n1-0-3 cm NI C
S5 Substrate
n~4
3 1= 096
2
1
0
2 5 1 2 5 10 2b Wavelength pm
Figure 1- Spectral reflectance of black nickel coating
we previously used a formula and two-layer technique similar to Tabors to achieve coatings with a = 96 percent and G= 7 percent after considerable effort to optimize the procedure Coatings with a = 94 percent were obtained consistently over several months with this formula No effort was made to optimize the durability of this earlier coating
These performance values for black nickel are compared to properties of other selective coatings on Table I We have beenexamining the comshyposition durability and optical properties of many of these other coatings under contract with ERDA (Reference 1) From Table I it is clear that black nickel coatings have the best optical properties but far from the best durability especially under environmental humidity tests Due to apparent durability of the black chrome and black iron coatings our ERDA program has emphasized improvement of their optical properties
3
TABLE I-PERFORMANCE VALUES FOR SOME SOLAR ABSORBER COATINGS
Breakdown Humidity
Coating Substrate a temperature resistance- (oc)
07 300 PoorBlack nickel Nickel 96
Black copper Copper 90 14 200 Poor
93 450 ExcellentBlack chrome Nickel 12
08 --- GoodBlack iron Iron 85
MnO x Aluminum 70 10 ---
An equally reasonable approach however is to improve the durability of black nickel coatings How much is the better optical performance of the black nickel worth in terms of solar collection efficiency Based on results
comshyof recent NASAMSFC analysis 6 Honeywell solar simulator tests and an increase in absorptionputer-generated yearly solar collection averages
of 1 percent increases overall collector performance by -3 percent while a 1-percent decrease in emittance (from 8 percent to 7 percent for example) would increase collector performance by 1 5 percent These calculations are for an - 1001C collector operating temperature with two glass covers Therefore the better optical properties of black-nickel coating are fairly
percent better overall collector performancesignificant (equivalent to 15 relative to black chrome for example) Thus successful development to
improve the durability of black nickel has an important impact on flat-plate
collector systems
Some physical tests that have been given to black nickel coatings at
Honeywell are listed below 1
Heating at 2800C for one week caused no optical change
One-third sun year of UV caused no change
14 000 cycles from 280 to 1040C (equivalent to 40 years) caused no change
MIL STD coating abrasion test (erasure rub) badly scratches the coating
The MIL STD coating adherence test (Scotch tape pull) could not remove the coating
4
The key problem with black nickel coatings is of course its lack of humidity resistance It degrades very rapidly in accelerated humidity exshyposures Improving this humidity resistance was the main goal of the present program
Experimental and Analytical Techniques
Coating Preparation - About 200 black nickel samples were plated in this program in -8 (2 gallon) baths of plating solution The samples were 8 cm x 10 cm from which four 2 54 cm diameter samples were punched for the various optical and durability tests One sample was used to find the spectral reflectance and other optical properties one was sent for Auger composition analysis one was given an environmental humidity test followed by composition analysis and the fourth sample was given a humidity test followed by an optical characterization Often this fourth sample was returned to the humidity chamber for prolonged testing with periodic optical measurements to monitor any degradation
The coatings were all applied to bright nickel-coated steel substrates The bright nickel plating to 0 0025 cm thickness was done by a local electroplater Due to the lapse of time between the bright nickel electroplate and the black nickel coating in our lab the oxide layer that forms on Ni had to be removed before the black nickel coating could be applied The cleanshying and oxide removal (activation) procedure used in our lab was as follows
Cleaning with dish-soap and water Rinse
One minute in a boiling 30 percent solution of NaOH Rinse
One minute in 30 percent solution of HC1 at room temperature Rinse
This procedure gave a consistently good surface for subsequent black nickel plating In a production-line process the bright nickel plating would most likely be performed just before the black nickel plating and the activashytion process would then be unnecessary
Optical Tests - The solar absorptance (at air mass two) was measured right after the coating deposition with a Gier Dunkle Solar Reflectometer This measurement was followed by measurement of spectral reflectance from 0 3 to 12 pim in an integrating sphere reflectometer and from 2 5 to 40 pm in a Beckman IR 20A Spectrometer The solar absorptance (at air mass two) and the infrared emittance (at 100 0C) were calculated from the spectral reflectance curves using appropriate solar and black body spectra to weight the data in the integration
5
This technique gives a and e values accurate to plusmn0 02 The accuracy of this technique for the emittance values has been verified by direct measureshyment of total emittance at 1000C The solar absorptance as determined by the integrated spectral reflectance disagreed with the Gier Dunkle value by atmost two percent
Physical Tests - Programmable humidity test chambers were used for the two types of humidity tests given in this program namely
A constant environment of 95 percent relative humidity at 380C (100 0F) Throughout this report this environment will be referred to as the standard NASA humidity test since it was recommended for use as the basic test of the program in the RFP
The second test used is the much more severe MIL-STD-810B Method 507 Procedure I This test consists of a thermal and humidity cycle from room temperature to 710C (1500F) at 95 percent relative humidity (RH) and from 71C to room tempershyature at gt85 percent RH over a 24-hour period This is one of the most severe accelerated environmental tests The test conditions impose a vapor pressure on the samples that causes moisture penetration and migration
The suitability of this test to accurately gauge the effects of long term 10 to 20 years exposure in an actual solar collector is difficult to detershymine Coatings that have failed the 810-B test in only one day have now withstood two years of use in flat plate collectors in the relatively severe environment of Minnesota with no coating degradation except in limited areas where pinholes through the bright nickel coating led to spots of rust from the steel substrate Although there is no long term data to back it up we feel the 810B test is probably a more severe test than is necessary to simulate the long term humidity environment
Composition Analysis - The key technique used for coating composition analysis was the sputter-Auger composition depth profile These measureshyments were performed for Honeywell at the University of Minnesota under the direction of G K Wehner In Auger electron spectroscopy the sample surface is bombarded with electrons of several Key energy and one observes ejected electrons with well-defined energies that are characteristic of the atom species from which they originated An Ar ion gun operating at a pressure of 5 x 10⁻⁵ torr is used to sputter-etch the sample while analyzing the electron emissions The low sputtering rate of -70 Aminute allows a composition depth profile to be made The ion beam diameter is much larger (3mm) than the analyzing electron beam (50tm) With the region of analysis in the center of the relatively flat bottom of the ion-sputtered crater good depth resolution results The depth from which Auger signals originate extends about 15 Abelow the surface
6
The energy spectrum of the emitted electrons has peaks at energiescorresponding to the atomic species that are present and the magnitude of the peaks gives a measure of the relative amounts of that atom that are present The technique is insensitive to the interatomic bonding Since black nickel coatings have a very complex chemical structure it was essentially impossible to calibrate the Auger peaks to give a direct measure of absolute percentage of any particular element in the coating That is although the oxygen signal may be greater than the sulfur signal on a particular figure in this report there may actually be more sulfur in the coating However the technique can be used very effectively to identify changes between coatings and as a function of depth The comparison beshytween different coatings can also be aided somewhat by using the Auger signal from the underlying pure Ni substrate to normalize the data
The Chemistry of Black Nickel Coating
The following discussion of the chemistry of black Ni coating summarshyizes an earlier theoretical analysis by Serfass et al 3 It serves as the foundation for our experimental investigation of plating parameters
The bath and plating conditions used as the basis for the work of this program are as follows
NASA Standard Bath
Nickel sulfate (NiSO4 6H20) 75 gC
Nickel ammonium sulfate (NiSO4 (NH4 )2 So 4 6H20) 45 gi Zinc sulfate (ZnSO4 7H20) 37 5 gL
Sodium thiocynate (NaSCN) Current density
15 gL 43 macm 2
Temperature 21 - 2670C pH 56-59
Plating time 30 s (or until a coating of 15001 is produced
A very limited amount of testing was also done using a bath described by Tabor 4 but with current densities times and pH levels optimized earlier at Honeywell for maximum optical efficiency This other solution is referred to as the Honeywell black nickel coating in the discussion below where it will be described in more detail
7
The NASA standard bath for black nickel plating contains the ions of =Ni 2 + Zn 2 +o NH4 + SO4 SCN- Na+0 H+ and OH7 Using a bright nickelshy
plated substrate as the cathode and pure nickel as the anode a diagram of the plating bath is given in Figure 2 Some important reactions at each electrode during the plating process are listed below
Anode (Pure nickel)
Ni = Ni2 + + 2e- ()
Cathode (Bright nickel plated metal)
a Reduction of thicyanate ion in acidic solution
SCN + 3H + + 2e- = H2 S(aq ) + HCN(aq) (2)
+shy
eshye-
S Zn 2+
Ni 2 + so4
0 SCNNH4 +M H
H+
Na+
Anode Cathode
Figure 2 - Black nickel electroplating bath
8
b Formation of nickel and zinc sulfides
Ni 2+ + H 2 S =NiS + 21 + (3)
Zn 2+ + H2 S = ZnS+ 2H+ (4)
c Evolution of hydrogen gas
2H + + 2e- = H2 (gas) (5)
d Deposition of nickel and zinc metals from their ions
Ni 2 + -+ 2e = Ni (6)
Zn 2+ + 2e = Zn (7)
e Function of the ammonium ion
NH 4 + + OH- = NH 3 + H 2 0 (8)
Ni 2 + + 6 NH 3 = Ni(NH 3 )6 2+ (9)
Zn 2 + + 4 NH 3 = Zn(NH 3 )4 2+ (10)
f Deposition of metallic nickel and zinc from their ammonia complex ions
Ni(NH 3)62+ + 2e- = Ni + 6 NH 3 (11)
Zn(N-13 )4 2+ + 2e = Zn + 4 NE- 3 (12)
While nickel zinc thiocyanate and ammonium ions play an important role in plating the sodium ion does not participate in the reaction due to its highly negative reduction potential and the sulfate ion remains unchanged because of the predominant reaction of nickel at the anode
Essentially there are two basic reactions of primary importance the deposition of the metal sulfides [Equations (3) and (4)) and the deposition of the elemental metals [Equations (6) (7) (11) and (12) ) The rates of these two depositions can be controlled by the plating conditions In the actual coating there is a mixture of metal sulfides and free metals both of which are necessary to obtain the desired solar absorption properties As will be shown clearly below coatings with too little free metal do not have sufficient absorption in the solar spectral region causing the spectral reflectance curves to show an oscillating optical-interference pattern If there is too much free metal in the coating there is a flat spectral reflecshytance curve due to absorption by the metal atoms but often then the reflecshytance is too high (- 15 percent) in the solar region (it looks metallic) and
9
the coating transmittance in the IR is too low (giving a high emittance) Thus good optical properties depend on the proper -mixture of metal -sulfide and free metals
Another basic reaction not discussed above is the possible deposition of
metal hydroxides under high pH conditions
Zn ++ + 2 OII-- Zn(OH) 2 (13)
Ni + + 2 OH---Ni(OH) 2 (14)
This hydroxide precipitation can also occur when the solution is over driven e g by too high current density When the current density is too high hydrogen evolution near the cathode causes the local pH to increase over that of the bulk solution In electroplating the conditions at the solution-metal interface are much more important than that of the bulk solushytion Thus a locally high pH near the cathode can cause the precipitation of nickel and zinc hydroxides
The repeated pattern observed in our study of plating parameters was the appearance of three regions where the deposition of either metal sulfides free metals or metal hydroxides predominates over the other two The coating composition depends on the rates of these competing reactions Since pH is a dominant parameter the rates of various reactions will be discussed in the subsection below which covers the effect of the pH paramshyeter First however the mechanism of the humidity breakdown of the coating will be discussed
Mechanism of Humidity Degradation of Black Nickel Coatings
The Auger spectra of a black nickel plated coating using the standard NASA bath and conditions is shown before and during a NASA standard humidity test in Figure 3 Note the decrease in S and increase in 0 content near the coating surface The same basic change occurred to varying degrees for essentially all of the degraded samples inthe program Apparshyently the main reaction caused by the humidity is the replacement of metal sulfides by metal oxides or hydroxides in the coatings Hydrogen atoms can not be detected by Auger analysis so it is not possible to be sure if oxides or hydroxides are being formed However based on the analysis of bath chemistry it is most likely that hydroxides are being formed As shown below the degradation process can be greatly retarded by changes in plating conditions Also the reaction often moves to a certain depth in the coating and then fnns
10
Before humidity After humidity (2 days) NI
-- XZ V ZnX I N ZnX 2
2nX2
NN
0250 500 750 1000 0 250 500 750 I000 Approximate depth A Approximate depthA
NNI
CX 2
0 250 500 750 1000 Approximate depth it
Figure 3 - Auger spectra of a NASA standard formula black nickel coating before and after NASA humidiy test
1i
Table II shows the absorption and emittance of several coating samples all plated with the NASA standard formula after two different humidity deshygradation tests These results are intended to show the variable properties that can be obtained with nominally identical black nickel coatings Black nickel plating isinherently a complex and sensitive process with which many investigators have had trouble obtaining consistent results The -7 percent scatter of the results in Table II should be remembered when comshyparing results in the parameter study to be given below In the study inshyconsistencies were minimized by using identical plating techniques and only varying one parameter at a time However some variations in coatinq properties especially between different batches of the standard bath were difficult to eliminate
TABLE II- HUMIDITY RESISTANCE OF FOUR SAMPLES PLATED USING THE NASA STANDARD FORMULA AND CONDITIONS AT VARIOUS TIMES DURING THE PROGRAM
Before After one day After four days humidity 810-B NASA test
a S aS
86 08 826 885
93 12 857 90
91 10 896 90
90 09 - 805 88
Average properties
S90 097 846 891
Note the average properties obtained on the Standard coating at the bottom of Table II Also note that one day in the 810-B humidity test causes more degradation than four days of the NASA humidity test
Effect of pH on Coating Properties
The pH of the plating solution is of key importance The reduction of the thiocyanate ion offers a sulfide ion for black nickel sulfide formation but the thiocyanate reduction potential is greatly affected by the pH of the plating solution The relationship between reduction potential of thiocyanate and pH has been derived by Serfass 3 as
12
E = +0 068 + 0 0295 log (SCN-) - 0 0885 pH (15)
A plot of this equation is included in Figure 4 for various thiocyanate concentrations The more positive the potential E in Figure 4 (closer to the bottom of the graph) and Equation (15) the easier the reaction will proceed The potential required for several other reactions to proceed at various pH values is also plotted in Figure 4
It can be concluded from Figure 4 that
At lower pH thiocyanate is easier to reduce and thus nickel and zinc sulfides are easier to form
At lower pH the hydrogen ion is also more easily reduced and causes the evolution of hydrogen gas
At higher pH the reductions of hydrogen ion into hydrogen gas and the nickel ion into metallic nickel predominate over the reduction of thiocyanate (and hence NiS formation) This results in a grey metallic coating
The choice of pH is also restricted by the precipitation of nickel sulfide and nickel hydroxide The nickel sulfide precipitates (or deposits) very slowly at pH less than 3 but at pH over 6 a precipitation of nickel hydroxide may occur
Many of these predictions based on the computed reaction potentials were observed for the coatings deposited in this program at various pH values
- Effect of pH on Auger Spectra - The Auger spectra of samples plated using the NASA formula but with eight different pH values were measured
The pH of the standard NASA formula is 5 6 The Auger spectra for four of humidity tests that illustrate thethese different pH s before and after the
effects are shown in Figures 5 and 6
Before the humidity test there are some composition differences among samples plated at different pHs At pH higher than 6 0 the coating comshy
= positions are quite different from that of pH lower than 6 0 At pH 6 5 the Zn and 0 centrations are higher while the Ni and S are lower near the coating surface The higher 0 and lower S content can be explained by the precipitation and deposition of metallic hydroxides as was predicted by the computed reaction potentials for pH greater than 6
13
--
SCN- + 3H+ + 2e- -H 2 S (aq) + HCN (aq)
- 89
- 8 Zn+2 + 2e Zn[Zn+2] 1 M
I ~ I0 - 7I I
I I - 6 2 + 2e- -H 2 (GAS)
-5- NJ (NH3)6+2 + 2e- -6 NH3 + NI
- 41
[NI ] = 0001
(Ni ]= 001M 3 - ]01M N+ 2 +2e_ - Ni
2[Ni J]=1o M J
- 2 - Ni (OH) 2 Ppt
II
J NIS Ppt I I
I I I I I I
0I I 0 2 4 6 I 10 12 14
pH
Figure 4 - Effect of pH on reduction potentials in-black nickel plating electrolytes
14
pH= 40
Before humidity
ZnX 2
ZnX
Ni
pil= 40
After humidity
ZnX 2
ZnX2
-- -NI
0 250 500 Approximate depth A
750 1000 0 250 500 Approximate depthA
750 1000
pH1=57
_- ____
0250
2
Befor humdityAfter
ZnX
_ _ _ _
500 750 Approximate depth A
_ _ _
1000 0
pilH57
humidity
ZnX 2
250 500
Approximate dep A
750
1O0
pH S
t X 2
0250
=
_foCC X 2
500 Approximate depth
p 547and 57 N
750 1000 0250
7
_--C tX
0
500 Approximate depth
o x2
I 750
1000
Figure 5 - ]Effect of pHI on pH 4 and 5 7
Auger spectra
15
- pH 60
Before humidity
pH =-60
After humidity
Ni NI
Zn x22
0L
i
0
NU i
215 Approximate depth A
50 250 Approximate depth I
500
pH = 65
Before humidity
pH = 65
After humidity
Zn x 2 Ni
n xC2 2 50500
Approximate depth A S
0
Approximate depth
500
NI
ZnFiurx Efeto2Ho A grset
pH 6 0 and 6 5
16
One consistent change due to the humidity test (seen on Figures 5 and 6) is the decrease in sulfur concentration near the coating surface and a correshysponding increase in oxygen This change occurred on all the Auger spectra received but it is least distinct for the high pH samples of Figures 5 and 6 The pH = 6 5 sample seems most stable in humidity as far as the coating composition is concerned and as we shall see below the pH = 6 0 samples have the most stable optical properties Probably the relatively high oxygen content in the high pH samples prevents further oxidation (or the formation of hydroxide) during the humidity test
Effect of nH on Optical Properties - The spectral reflectance of samples in the pH range 4 5 to 6 5 are shown in Figure 7 As the figure indicates all samples have reflectance curves that are flat in the 35 to 1 5 jim region Their solar absorptance are all in the range of 91 percent to 94 percent Except for two thick coatings plated at pH 6 and 6 5 for 92 seconds all the samples have an infrared emittance between 9 percent and 12 percent
The reflectance of the same samples after 48 hours in the humidity chamber at 100degF and 95 percent relative humidity are shown in Figure 8 The humidity has no significant effect on the optical properties but it does flatten the reflectance curves in the 35 pim to 1 5 jim region somewhat and causes the reflectance to rise slightly faster at wavelengths beyond 2 Im The latter effect results in a slightly lower infrared emittance A reduced emittance of black nickel samples is typically observed after humidity tests The two-day humidity test improves both the a and e values longer tests however cause the coatings to degrade
Table III shows the results of longer humidity tests for samples plated at pH values from 3 5 to 6 5 The samples plated at a pH of 60 have the best humidity resistance Note the thick coating that was plated at pH 6 0 for 92 seconds showed almost no degradation at all after a 13-day humidity test However an undesirable property for this thick coating is its high emittance (23 2 percent before the humidity test) The sample with the best combination of optical properties and humidity resistance was the one plated at a pH of 6 0 for 40 seconds
Summary of the Effects of pH - Before the humidity test samples plated at a pH higher than 60 differ significantly from those below 6 0 At a pH greater than 60 the Zn and 0 concentrations are higher than the Ni and S concentrations near the coating surface This is due to the faster precipitation and deposition of Zn and Ni hydroxide compared to the deposishytion of metallic sulfides
After the humidity test all samples show a decrease in sulfur concenshytration near the coating surface and a corresponding increase in oxygen This change is minimized for the high pH samples that have a high oxygen content to start with
17
Samplenumber pH
Platingtime
a SymbolSy
85 45 40-s 9r4 091
8 88 56 40s 918 093
91 65 40 s 938 119 ___ shy
6- 92
65 92s 944 288
- i E
Before humidity z
4
2
0 3 4 5 7 1 2 3 4 5 7 10 20
Wavelength pm
Figure- 7 - Effect of pH on spectral reflectance -before humidity
numbe PH Plating a C Symbol
8 85 45 40 s 943 090
88 56 40 s 929 090
91 65 40 s 914 105
6 92 65 92s 968 241 ---
After humidity test 4 -
2shy
0 I I I I
3 4 5 7 1 2 3 4 5 7 1 20 Wavelength pm
Figure 8 - Effect of pH on spectral reflectance -
after 48-hour humidity test
18
TABLE III- HUMIDITY RESISTANCE OF BLACK NICKEL SAMPLES PLATED AT DIFFERENT pH
Days in Days at 38C and MIL-STD
95 relative humidity 810B Plating 0 2 4 6 8 10 3
pH time (s) a e a 6 a a a a 6 a
35 40 85 09 - - 80 80 79 82 08 77
40 40 87 07 - - 83 84 83 80 08 81
45 40 90 09 93 09 90 89 89 87 08 79
50 40 91 11 - - 85 84 80 83 - 70
56 40 90 09 92 09 88 86 84 78 07 72
(Standard)
60 40 92 12 - - 92 92 92 87 11 87
60 92 93 23 - - 94 94 94 94 21 92
65 40 93 12 91 10 88 87 84 84 08 74
The spectral reflectance curves of samples plated from pH = 4 5-6 5 are all quite similar After humidity testing the curves are somewhat flattened in the 3 5 jim to 1 5 pm region causing them to have a slightly lower infrared emittance The sample plated at a pH of 6 0 for 40 seconds had the best combination of optical properties and humidity resistance
Effect of Current Density on Coating Properties
The effect of current density on coating composition can be predicted somewhat from the computed potentials for various reactions as shown on Figure 4 At a given pH it is expected that if the current density is too low the reduction of hydrogen and nickel may predominate over the reducshytion of thiocyanate if the current density is too high a multitude of reacshytions occur including the evolution of hydrogen and the precipitation of nickel hydroxide Faster hydrogen evolution was observed at higher curshyrent density in the present experiments
19
Effect ofCurrent Density on Auger Spectra - The Auger spectra of five samples plated using the NASA formula but at different current densities before and after a humidity test are shown in Figures 9 and 10 The humidity test consisted of 48 hours at 38 0 C (1000F) and 95 percent relative humidity The usual current density used in the NASA formula is 4 3 macm2
Before the humidity test as can be seen in Figures 9 and 10 samples plated at different current densities have very similar compositions This means that for the NASA standard formula the current density has very little effect on the coating composition There is a less well defined intershyface between the black nickel coating and the underlyingNi layer when the higher urrent densities are used but the compositions of the basic coating are not very different
This is quite different from the Honeywell black nickel formula that gave two coatings of totally different compositions when they were plated at two different current densities as is shown in Figure 11 The sulfur and nickel content is much greater relative to the oxygen and zinc content for the lower current density (1 macm2 ) Also a large amount of carbon is present in the low current density coating The Honeywell formulation is identical to a bath previously studied by Tabor (Reference 4) who also noticed the two distinct compositions This change in compositions was exploited in the Honeywell two-layer coating to produce coatings with a = 96 and 0 = 07
After the humidity test most of the NASA formula samples show a similar increase in oxygen and a decrease in sulfur content near the coating surface (Figures 9 and 10) The change in oxygen and sulfur is less severe for the samples plated at the current densities of 2 0 macm 2 and 5 0 ma
2cm but basically there is little reason to choose one current density over another based on these Auger spectra for the NASA formula samples
Effect of Current Density on Optical Properties - Current densitiescovering the range of 5 to 5 macmz were used in this study To keep the
thickness of plated coatings roughly equal the plating time was reduced for the higher current densities keeping the product of current density (CD) and plating time constant The spectral reflectance of different current density samples are shown in Figure 12 The coatings plated from the baths with current densities less than 3 5 macm2 show an undamped oscillation in their spectral reflectance curves and have lower solar absorptions Their reflectance cut-off points also change drastically The samples prepared from current densities higher than and equal to 3 5 macm2 have reflectance
damped by absorption and higher overall solar absorptancecurves
The spectral reflectance of the same samples after humidity tests is shown in Figure 13 The spectral reflectances of samples plated with CD 3 5 macm2 were more stable than those of the lower current density samples
20
10 macm 2
Before humidity
10 m 2
After humidity
-- ZnX 2
0
0
NitI
CX 2
250 500 Approximate depth
20 macm 2
Before humidity
750 1000 0
NI
CX2
250 500 Approximate deptj
20 macm2
After humidity
750 1000
NNI
0 250
35 macia 2
Before humidity
CX 2
500
Approximate depth A
750 1000 0 250
35 macm 2
After humidity
500
Approximate depth
750 1000
jZ 2
0250 500 750 1000 0 250 500 Approximat dept A Approximate deptlj
Figure 9 shy ]Effect of current density on Anger spectra i to 35 macm 2
750 1000
0RIGINAL PAGIIN
cr POOR QUALITXT
21
43 macm 2
Before humidity
NI Ni
43 macm2
After humidity
ZnX 2 ZnX
Nf
o
III N
CX2 s N
250 500 Approximate depth A
750 1000 0 250 500 Approximate depth 1
750 1000
50 maVcm2
Before humidity
50 macm 2
After humidity
X 22 CX2 NIN
250 500 750 Approximate depth I
Figure 10 -
i000 0 250 500 750 Approximate deptA
Effect of current density on Auger spectra 43-5 0 macm2
1000
22
2 = 1 mcmCD
Before humidity
010
Xn22shy
0 250 500 750 1000 Approximate depth I
22 macmCD =
After humidity
NI
0 250 500 750 1O0
Approximate depth1
Figure 11 - Effect of current density on the Honeywzell formula black nickel
23
CD 2 Symbol (macmS
8 - 10 82 04
15 90 09
35 91 08 6- eoehmdt
Before humidity43 92 09
50 95 08 -- a- I _ _ _ 1 __ _
-2
0 13 4 5 7
Wavelength g m
Effect of current density on the reflectanceFigure 12-
of NASA black nickel coatings
CD(macm2 ) _ Symbol
8 l1 85 07
15 88 12
35 90 08 10 -43 94
I95 10 -0----o 50 O f 0 After humidity S4 shy
2
0 I
2 3 4 5 7 10 203 4 5 7 1 Wavelength pm
Figure 13 - Effect of current density on the reflectance of NASA black nickel after 2 day humidity test
24
Results of the humidity test on solar absorptance and emittance given in Table IV include samples plated at current densities from 0 5 to 5 0 macm2 Groups I and II represent tests conducted at different times throughout the program Group I was given the standard NASA test for one day and Group II underwent prolonged humidity testing Current densities of 1 5 4 and 5 ma
2cm all gave durable coatings but the coating plated at 1 5 macm 2 had a slightly higher emittance (12 percent before the humidity test) than the other two coatings which had an initial emittance of 9 to 10 percent The absorptance of the coating plated at 1 5 macm2 which was 88 percent was also low compared to the 91 to 92 percent absorptance of the other two coatings After 10 days in the NASA standard humidity all three of these coatings survived with almost no sign of degradation especially the coatings plated at current densities of 4 and 5 macm 2 The absorptance of the sample plated at the NASA standard current density of 4 3 decreased from the orishyginal 90 3 percent to 844 percent after 10 days in the NASA standard humishydity This drastically different behavior for the 4 3 macm 2 compared to the 4 and 5 macm 2 samples is surprising Other samples plated using the standard NASA current density at other times in the program had somewhat
as that of the 4 and 5 macm 2 better humidity resistance but never as good samples
Summary of the Effect of Current Density Variations - For the NASA formula current density has little effect on coating composition whereas samples plated from the Honeywell formula are very dependent on a change in current density
After the humidity test all samples plated at different current densities show a similar increase in oxygen and a decrease in sulfurcontent near the coating surface
Despite similarities in the composition profiles the optical properties were dependent on CD Coatings plated from baths with CD 2 5 macm 2
show an undamped oscillation in their spectral reflectance curves have lower solar absorptions and are less stable Samples with CDs gt-3 5 ma cm 2 have reflectance curves damped by absorptions their optical propershyties are much better and are more stable In particular samples plated at 4 and 5 macm2 were resistant to prolonged humidity degradation while absorptance of the sample plated with the standard (4 3 macm 2 ) current density decreased about 6 percent after 10 days of the NASA humidity test
Effect of Zn++Ni -H Ratio on Coating Properties
The great advantage of including zinc ions in solution comes from the high overvoltage of hydrogen on zinc metal which does not occur on nickel At the start of plating zinc or nickel-zinc alloys deposit on the cathode Due to high overvoltage for hydrogen the evolution of hydrogen is repressed and the reduction of nickel and thiocyanate are favored After the zinc surshyface is covered with a layer of sulfide the overvoltage no longer exists and the plating process goes back to where it started with the deposition of nickel
25
Mb
TABLE IV -HUMIDITY RESISTANCE OF BLACK NICKEL SAMPLES
0ooPLATED AT DIFFERENT CURRENT DENSITIES
Group I Group II Das Days at 38CC and IL-STD
CretCurrent Paig95Plating relative humidity 810B
density (macm2 )
time (sec) a
0 e a
1 a
0 c
4 c
6 a
8 a a
10 G
3 a
05 344 81 05 86 03 81 05 68 63 63 --shy
10 172 85 07 82 04 83 07 75 74 73 73 07 64
15 115 88 12 90 09 88 12 89 89 88 88 11 86
20 86 85 06 84 05 86 06 78 79 79 78 06 74
25 69 84 06 88 06 84 06 81 82 80 80 07 75
35 49 90 08 91 08 86 08 86 86 85 86 O 78
40 43 93 09 94 07 91 09 92 92 91 91 0 95
43 40 94 10 92 09 90 10 89 86 86 84 0 71
(Standard)
50 345 95 19 95 08 92 10 92 92 91 91 07 84
and zinc or nickel-zinc alloy and the evolution of hydrogen The bycle is reshypeated throughout the entire plating process Thus the Zn++Ni++ ratio is expected to have a significant effect on coating composition as well as on coating properties The standard NASA formula has a Zn++Ni + + ratio of 364 In the present experiment the Zn++Ni + + ratio was varied from 1 to
Ni + + 7 exceptwhere otherwise noted was kept at the standard concentration
Effect of Zn++Ni + + Ratio on Auger Spectra - The Auger spectra of four samples plated at different Zn t Nitt ratios before and after two days in the NASA humidity test are shown in Figures 14 and 15 Before the humidity test there are significant composition differences among the samples as the Zn++Ni++ ratio is changed The amount of oxygen decreases with respect to the sulfur and nickel as the Zn++Ni++ ratio is increased which means more sulfides have been formed and less hydroxides have been deposited This is consistent with the theoretical prediction that the high overvoltage of hydrogen on zinc represses the evolution of hydrogen and favors the reduction of thiocyanate Also at high Zn++Ni++ ratios the coating - Ni interface is much less distinct The reason for this change is uncertain
During humidity test the sulfur content decreases and the oxygen conshytent increases for all of the samples These composition changes due to the humidity test are greatest for the samples plated at higher Zn++Ni++ ratios The greater composition changes become visually very obvious when the Zn++Ni++ ratio is as high as 7 The scale for the depth of coating has been changed in Figure 15 for the Zn++lNi++ = 7 sample after the humidity test This spectrum shows that the humidity has penetrated deeply through the coating The change in composition is great for that sample very little Ni is left after the humidity test
Effect of Zn++Ni++ Ratio on Optical Properties - The spectral reflecshytance of the eight samples plated with different Zn++Ni++ ratios were measured in this program Four of the reflectance curves are shown in Figure 16
The spectral reflectances curves of all the samples fall into three distinct groups For Zn++Ni++ ratios from I to 25 the curves oscilshylate in the solar region with a high reflectance in the infrared When the ratio is between 364 and 5 the curves are flat in the solar region damped by absorption and have an intermediate reflectance in the infrared When the Zr++Ni++ ratio is higher than 5 the spectral curve is very flat in the solar region but the reflectance increases too slowly in the infrared There is a sharp change in the shape of the reflectance curves between the Zn++Ni + + ratio of 25 to 364 For a good combination of solar absorpshytion and low emittance a Zn++Ni++ ratio in the range of 25 to 5 is necessary
27
ZnNIr = 015
Before humidity
znlNI = 015
After Iithoiity - NI
II
_ n~nX 2
ZnX 2 -
II
20
00S 0
NI
r
0 250 500
Approximate depth
750 3000 0250 500
Approximate deptI
750 1000
Zn N = 0364
Before humidity NII
zg N r V 0364
After humidity N
k XCl CX2
0 250 500 Approximate depth
750 000 0
----
250
500 Approxiinat Jepth
750 10
ZnZN1 = 05 Zn+N =05
Before humidity After humidity
500 750 1000750 1000 0 2500250 500 Approximate deptljApproximate depthi
Figure 14 - Effect of Zn-l-Ni + + ratio on Auger spectrafor Zn+Ni+ from 15 to 5
28
----------------
- =Zn++NI 07
Before humidity
ZnX 2
C X
0 250 500 750 1000
Approximate depth i
Zn++Nl- = 07
After humidity
ZnX 2
glt
0 NI
V Ni CX 2 S
0 250 500 750
Approximate depth 4
Figure 15 - Effect of Zn++Ni++ ratio on Auger spectra + + at Zn++N = 7
1000
29
Sample ZnNi number ratio
62 15 8
66 364
69 566 -
85
93
93
94
e
08
11
13
24
Symbol Smo
-
-shy - 0-
o Before humidity test
- 0P 0)0
3 4 5 7 1
Wavelength pm
1Ater humidity test 8
0 ~~~
Figure 16 - Effect of Zn++Ni++ ratio spectral reflectance
0-shy0
0 10
74
16 2 3I I I
on
7
I
---shy
10
6
Fiur41-0f
Efec of number ratio o
81 W Sample ZnNI Symbol
00
o
1i
66H
62H 15
364
89
92
07
10
0
3 4 I
5 7
Figure 17
69H 5
F71H 7
- 1i
1 2 3 4 5
Wavelength prm
- Effect of Zn - INi + + ratio on reflectance after humidity
91 10
58 107
I20
7 0
spectral
-o-oshy
2
30
At high zinc ion concentration or when the Zn++Ni++ ratio is greater than 5 the coating looks gray This is probably due to too much free nickel metal in the coating which also accounts for the very flat spectral curve and the high emittance (24 percent) This free Ni can be seen in the Auger spectra (Figures 14 and 15) as the indistinct Ni-coating interface
The reflectances of the same coatings after 48 hours in the NASA standard humidity test are given in Figure 17 A reflectance increase in the 1-2 jim wavelength region can be seen for most of the samples This change is more pronounced for the low and very high Zn++Ni++ ratio and is not as significant for the Zn++Ni++ ratio between 25 and 5 The oscilshylation of the low Zn++Ni++ ratio curve is damped by absorption after the humidity test The coating with Zn++Ni++ = 7 was almost completely degraded by the humidity its solar absorption decreased from 94 percent to 58 percent This coating could be wiped off by rubbing gently after the humidity test
The results for samples plated at Zn++Ni++ ratios from 1 to 7 with Ni++ kept at the standard concentration are summarized in Table V Samshyples plated at a Zn++Ni++ ratio higher than the standard ratio had a high initial absorptance but they degraded badly The degradation increased as the ratio was increased Samples plated at a Zn++Ni++ ratio lower than the standard ( 364) had a low absorptance initially after ten days of the NASA humidity test their absorptances were either increased or about the same after another three days of 810B humidity test their absorptances were only slightly decreased The a changes are probably strongly deshypendent on the exact position of minimums in the reflectance spectrum for these samples At the initial stage of humidity degradation samples plated at the lower Zn+-l-Ni++ ratios changed their colors from an original gold or yellowish blue to a blue or dark blue Further humidity exposure changed the colors only slightly This indicates that the initial humidity exposure probably oxidized or hydrolyzed the coatings near the surfaces and that proshytected somewhat the coatings underneath Note that the solar absorptance of all of the Zn++Ni++= 364 samples stabilized at about the same level of a - 82 Considering the low initial of a of the Zn++Ni+- lt 25 samples and the poor durability of high ratio samples it is probably best to use the standard NASA Zn++Ni++ ratio of 364
Effect of Ni++ Variations from Standard NASA Formula - To detershymine effects of Ni++ concentration a limited test program was undertaken The properties of samples prepared using the NASA standard formula but with variation from the recommended Ni++ content (Zn++ content held conshystant) are shown in Table VE The test procedure used for these samples is as follows
Solar reflectance and IR emittance of freshly prepared samples were measured A MIL-STD-810B humidity test was then given to one sample for one day and the solar reflectance was measured
31
--- --- ---
TABLE V -HUMIDITY RESISTANCE OF BLACK NICKEL SAMPLES PLATED AT DIFFERENT Zn++Ni + + RATIOS
Days at 38 0C and Days in 95 relative humidity MIL-STD
8101 - I
[7n++ Plating 8 10 3
Time 0 4 6 a(S) a e a a a a s
88 86 86 07 8182 88010 40 08
79 08 84 82 80 82 07 78015 40
81 78 78 76 06 70020 40 79 08
40 81 06 84 83 80 81 07 79025
11 88 84 82 82 08 800364 40 93
(Standard)
40 92 11 85 81 78 7-7 08 75040
92 13 86 82 80 78 --- 8050 40
-93 24 43 ---070 40
TABLE VI- EFFECT OF Ni + + CONCENTRATION CHANGE ON HUMIDITY OF NASA STANDARD FORMULA COATINGS
After 1 After + 1 day[Ni++ ] Sample Before day 810B 4 days
NASA test 8101B(g) number humidity humidity
l aagp e a aas a
20 72 0 886 006 0673 0 881 0682
0 901 0 74522 74 0909 006 0 839
008 0876 0895 07352345 77 0906
(Standard)
0908 0784245 79 0911 007 0792
26 81 0 918 008 0 849 0 891 0690
862 0 874 070830 82 0908 007 0
0 919 007 0 828 0917 079350 83
80 84 0900 007 0 865 0900 0 811
32
ORIGINAI PAGE 18 OF POOR QUAIXY
A second sample was given four days exposure to the NASA humidity test and the solar reflectance was measured That sample was then given the MIL-STD-810B test for one day and the solar reflectance was measured again
There is no spectacular improvement in the humidity resistance for anyof these samples they all degrade substantially in the 4-day NASA + 1-day810B tests However samples prepared with high Ni ++ content seem to be somewhat more durable than the low Ni++ content samples
Summary of the Effects of Zn++Ni++ Ratio - As the Zn++Ni++ ratio is increased the amount of oxygen decreases with respect to sulfur and nickel concentration This implies that more sulfides have been formed and less hydroxide has been deposited At high Zn++Ni + + ratios free metallic nickel is present in the coating especially near the coating-Ni substrate interface
After humidity testing the sulfur content decreased while the oxygen content increased This occurred for all the samples but was greatest for the higher Zn++Ni++ ratios
Zn++Ni++ ratios in the range of 364 to 5 gave the best combination of solar absorption and low emittance If the ratio is too low the curves oscillate in the solar region with a high reflectance in the infrared If the ratio is too high the reflectance increases too slowly in the infrared and the emittance is high
Although they have a high initial absorptance the samples plated at a Zn++Ni ++ ratio higher than the standard degraded badly after the humidity test Samples plated at a lower Zn++Ni++ ratio had a low absorptanceinitially but after humidity testing either increased their absorptance or remained constant A Zn++Ni++ ratio near the NASA recommended value of 364 gives about the best combination of durability and optical properties
Increasing only the Ni+ content of the bath while keeping the Zn++ content constant increases coating stability slightly
Effect of Temperature on Coating Properties - Since the rates of different reactions are affected differently by increasing the temperature coating compositions will be affected by the bath temperature Another effect the temperature may have is to change the solubility of sulfides and hydroxides of nickel and zinc No attempt was made to compute these changes theoretically Samples were prepared at 101 different temperashytures in the experimental study The NASA standard formula recommends that the temperature be kept in the range 21 to 26 70C
33
Effect of Temperature on the Auger Spectra - Samples were plated at (65degF) to 52degC (125WF) in 5 6bC (10-F) intervals attemperatures from 18deg0
) and at a lower currentboth the standard high current density (4 3 macm 15 macm2 ) Since the low current density samples gave essenshydensity (2
tially the same results as the high current density samples those results will not be presented The Auger spectra of four of the samples before and
given in Figures 18 and 19 Since chemicalafter the humidity test are at a faster rate as temperature is increasedreactions generally proceed
the plating times in the depositions were varied in an attempt to keep the The rule we used to calculate the platingcoating thicknesses constant
times was that reaction rates double for every 10degC temperature increase
This rule did not work well for the black nickel plating reactions as can be which show different thicknesses for differentseen from Figures 18 and 19
temperature samples At higher temperatures the coatings are thinner
since the reaction rates did not increase as rapidly as expected with temshy
perature
similar ex-The composition of samples before the humidity test are cept that the sulfur increases slightly toward the coating surfaces as the
This sulfur increase resulted in less stableplating temperature increases coatings as evidenced by larger changes in the Auger spectra (note especishy
ally the change in zn content) and decreases in solar absorptance after the The oxygen content was more strongly affected at lowerhumidity test but this change did not affect optical properties as muchtemperatures
Optical Properties - Spectral reflectancesEffect of Temperature onof samples plated at different temperatures before the humidity test are
shown in Figure 20 Those after a 48-hour NASA humidity test are shown in Figure 21
The wavelength at which reflectance curves rise (a rough indication of
coating thickness) decreases as the temperature is increased which again
shows that the usual rule used to calculate plating times did not work in This result is probably due to the fact that all reactions inshythis case
cluding both those favoring the deposition and those preventing the deposishytion became faster as temperature was increased
The most significant result of this experiment is the distinct change in
shape of the spectral curves as the temperature changes from 18 to 290C See Figure 20 At 180C and 240C the curve is flat in the solar region damped by absorption whereas at 299C the reflectance curve has a dis-
Since the flat spectral shape has higher absorption andtinct oscillation is less sensitive to thickness errors keeping the temperature at or below 240C is quite important
Among these samples the ones plated at lower temperatures were more stable showing smaller changes in spectral reflectance The sample plated at 180C was the most stable
34
180 C (59 S) 18C (59 S)
Before humidity After humidity
ZnX 2
NNI
0 260 4do 660 80 1000 Approximate depth A
1200 14bo 1600 260 40 660 86o idoo Approximate depth i
12bo1 4oo 1600
24-C (40 S)
Before humidity
24C (40 S)
After humidity
ZnX2 NI
0 250
290C (27 5)
Before humidity
_ --
500
Approximate depth~ZnX2
750 1000 0
00
250 500
Approximate depthA
29degC (27 5)
After humidity
750 1000
NI
0 250 500 750 1000 0 250 500 750 1000 Approximate depth I Approximate depth I
Figure 18 - Effect of temperature on Auger spectrafrom 1800 to 290C
35
46oC (9S) 46oC (9S) Before humidity After humidity NHi
ZnX 2
Z ZnX2Ni
02 I
NI s CXNIIICX ~
250 500 750 1000 0 250 500 750 10000
Approximate depth A Approximate depth A
Figure 19 - Effect of temperature on Auger spectra 460C
As previously mentioned the coatings plated at high temperatures were thinner because we overcorrected for the expected change in reaction rates Hence the high temperature samples may have been less desirable because they were thinner To eliminate this factor another set of samples was prepared for which the thicknesses were nearly the same at various plating
are shown in shytemperatures The spectral reflectances of these samples Figure 22 A significant oscillation in the reflectance curve begins at 270C and increases as the temperature is increased The result is that samples plated at higher temperatures have lower solar absorptance
Reflectance curves of the same samples after the humidity test are shown in Figure 23 After the humidity test all reflectance curves are flattened in the solar region damped by absorption and the reflectance cut-off points are pushed toward shorter wavelengths Results of these two
These results areeffects are a higher absorption with a lower emittance usually observed for samples subjected to a short and less severe humidity test e g 48 hours at 380C and 95 percent humidity Longer or more severe humidity tests usually cause a decrease in absorption as will be discussed below Among the sample reflectance curves shown in Figures 22 and 23 the lower plating temperatures again displayed the smallest changes even though the coatings were of roughly equal thickness
36
1 Before humidity test o
6- 07 Temperature Time Symbol
4 i 1830C(65degF) 590
2390C(750F) 40
2 ~2940cw850F) 27 N0 - I 406C(105F 126
bull 0 i _ _ _ _ _ _ _ _ _
2L 0 517C(125F) 58 0 0 I
3 4 5 7 1 2 3 4 5 7 10 20
Wavelength gm
Figure 20 - Effect of temperature on spectral reflectance before humidity test
1- After humidity test
68 ___
emperature Ti Symbol0 - (OF) (S)
4 1830o(65oF) 59
239C(75F) 40 bulliI o Ji 294C(85F) 27
2 - 7406C(1050F) 126 -o
- -470C(1250F) 58
0 3 4 5 7 12 3 4 7 ib 20
Wavelength pim
Figure 21- Effect of temperature on spectral reflectance after humidity test
37
0Sample Temp Plating e Symbol number time
93 (722degC(72o F) 40s 935 096 0
8- 96 6 40 901 076 8 96 - (800 F) ___ _______
97 (8-) 40 897 079 0
Before humidity test
i
S4
-2 -
Z
0
Sample
number Te Plating
ine u e Symbol
bull - -- ~~ (0F) (322C 40
30
865
864
068
073
-o0shy
0 i5
I
3 4 5 7 1 2 3 4 5 7 10 20 Wavelength gm
Figure 22 - Effect of temperature on spectral reflectance
1 Sample Plating Temp ltm Symbol - -
number time ____ __
222C 40s 957 103 shy93____ (72-F) 18 267degC 96 (80F) 40 877 055
shy294-C 97 (85F) 40 932 066 ---
6 After humidity00
4shy
Sample Temp Plating bol
2 number time Sym
32 2oC 898 067 -o-o
99 (9OC) 40 0 0
0 322- C
001 (90 F) 30 877 056
4 5 10 20 3 4 5 7 13
Wavelength um
Figure 23- Effect of temperature on spectral reflectance
ORIGINAL PAGE IS38 OF POOR QUALITY
The results of both short and prolonged humidity tests on a and e for samples plated at temperatures from 180C to 520C are listed in Table VII The suggested plating temperature range in the NASA formula is from 210C to 270C The most stable samples in Table VII were those plated at 220C 240C 290C and 350C for 40 seconds The samples plated at the higher temperatures 290C and 350C were thicker than those samples plated at lower temperatures with the same plating time The good humidity resisshytance of the samples plated at 290C and 350C was probably due to this greater thickness However the solar absorptance of these thick coatings plated at high temperatures was too low (a = 80 to 85 percent) Thus to obtain durable coatings with good optical properties it is important to keep the plating temperature between 220C and 240C
Summary of Effects of Temperature on Coating Properties - As the temperature is increased the sulfur content increases near the coating surface resulting in a less chemically stable coating
Before humidity testing samples plated at 18 to 240C have reflectance curves that are flat in the solar region For samples plated at or above 270C the reflectance curves have a distinct oscillation in the solar region and the samples have a lower solar absorptance
After short term humidity testing samples from 180C to 350C have reflectance curves flattened in the solar region while those above 350C still have the oscillation
In long term humidity tests the 180C sample also degraded Hence to obtain durable coatings with good optical properties the temperature should be between 220C and 240C
The Effect of Thiocyanate Concentration on Coating Properties
The SCN ion provides the sulfur which allows the deposition of nickel and zinc sulfides in the plating process Notice in Figure 24 that higher concentrations of thiocyanate ions enhance the reduction reactions Thus the SCN concentration is expected to have a significant effect on coating properties In this experiment plating solutions with ten different concenshy
3 to 30 gt were used to producetrations of NaSCN covering the range black nickel coatings The standard NASA formula was 15 gt of NaSCN
Effect of SCN- Concentration on Auger Spectra - The Auger spectra of four representative samples plated at different NaSCN concentrations before and after a two-day NASA standard humidity test are shown in Figure 24 The most significant effect of thiocyanate concentration on the coating composition is the increase in sulfur content as the thiocyanate concentration increases The sulfur increase is most obvious when the sodium thiocyanate increases from 15 gL the NASA standard formula
39
TABLE VII- HUMIDITY RESISTANCE OF BLACK NICKEL SAMPLES PLATED AT DIFFERENT TEMPERATURES
Days at 38C and 95 relative humidity
Days in MIL-STD
_810B
TemperaturedegC F
Platingtime(s) a 0 4a 6aY 8a a 10 3
a
183 65 59 95 19 80 74 72 70
222 72 40 92 10 91 92 91 89 08 80
239 75 40 91 10 90 89 85 86 08 78 (standard)
267 80 40 90 08 86 85 81 80 06 67
294 85 40 85 08 89 89 87 87 07 77
294 85 33 88 08 88 85 86 84 06 75
294 85 27 88 06 83 81 79 78 06 67
350 95 40 80 08 83 84 84 85 07 82
350 95 18 86 05 77 78 72 71 06 60
406 105 13 K83 05 67 67 63
461 115 9 77 05 56 55
517 125 6 67 04 52 50
to 21 gI At low SCN- concentration the coating S content is low but the 0 and both Ni and Zn are at about the same level as coatings produced at high SCN- concentration This indicates that at low SCN- concentration there may be more free metals in the coating resulting in flatter reflectance curves and higher emittance
After the two-day humidity test an increase in oxygen and a decrease in sulfur near the coating surface occurred for all the samples can be seen on the Auger spectra in Figure 24 A slight decrease in nickel near the coating surface can also be seen on Figure 24 Based on the Auger data no parshyticular NaSCN concentration appears to offer greatly enhanced humidity resistance
Effect of NaSCN Concentration on Optical Properties - The effect of the variation of SCN content keeping all other variables constant on the spectral reflectance of the coatings is shown in Figure 25 The curves are flatter at low SCN- concentrations also at very low NaSCN concentration (3-6 gt) the emittance has increased to 12 to 15 percent Both of these effects are probably due to the presence of uncombined metals in the coating as was also suggested from the Auger data
At high NaSCN concentrations (greater than 15 glt) oscillations begin to appear in the spectral reflectance curves The oscillations become very large at NaSCN = 25 gt Such oscillations indicate insufficient absorption in the solar region so that a NaSCN concentration below 24 gt may be necessary
The reflectance curves of the same samples after 48 hours in the NASA standard humidity chamber test (380C and 95 percent relative humidity) are shown in Figure 26 An important effect is an increase in reflectance of some of the samples in the 1 to 2 aLm wavelength region compared to samples before the humidity test This effect is more pronounced for the high NaSCN concentration and is not very significant for NaSCN less than 24 gIl Thus for greater stability concentrations of NaSCN greater than 21 gl should be avoided
The effect of the prolonged humidity test on a and s values for samples plated at all the different NaSCN concentrations are listed in Table VIII NaSCN concentrations that gave durable coatings were scattered in the range of 6-21 g The results in the table do not show a clear pattern for coatshying durability Samples plated at the NaSCN concentrations of 6 gt and 21 gt had the best humidity resistance It is likely that any concentration in the range of 6 to 21 g would give roughly equivalent durability properties
41
-- ------
Ni NaSON 9 gt
Before humidity Afterhuml thty N
NaSCN 9 g4t
Be3 z~ ZnX 2 I-
0205070
Approximate
NaSCN 15 git
Before humidity
S
depth A
1000 0 0 250 500
Approximate depth I
NaSCN 15 gPt
After humidity ZnX
750 1000
2
NaSCN
Before
ZnX 2 -
a0
250
Aporox
21 gil
-humidity-
500
atedepth J
750 1000 0
250
NaSCN 21 qL
After humidity
ZnX 2
500
Approximate depti
750
N
1000
__C_2
0 250
500
Approximate depth A
Figure 24
750 1000 0
- Effect of NaSCN
Auger spectra
250 500
Approximate depthA
concentration on
750 1000
42 ORIGINAL PAGE 5
OF POOR QUA TIF2
-c SymbolSamgle NaSCN num er concentration
8 bgt 95 14
38 12 gt 94 10
15 gt 95 12 _39 43 27 gi 89 07
o
f4 Before humidity test
bull
2
0 t I I I
4 5 7 10 2033 4 5 7 1 2 Wavelength pm
Effect of sodium thiocynate concentration onFigure 25-spectral reflectance
Symbol-Sample NaSCN a E
number concentration
36H 6 gt 964 089 yA8
38 H 12 q t 942 094 -
39 H 15 gt 952 096 A
6 43 H 27 1t 893 053
C4 After humidity test
4
3 4 5 7 1 2 Wavelength Pm
3 4 5 7 10 20
Figure 26- Effect of sodium thiocyanate concentration on spectral reflectance after humidity test
ORIGINAL PAGE IS OF POOR QUAIL
43
TABLE VIII HUMIDITY RESISTANCE OF BLACK NICKEL SAMPLES PLATED AT DIFFERENT NaSCN CONCENTRATIONS
Days inDays at 380C and MIL-STD
95 relative humidity -TD810B
NaS CN Plating 0 2 4 6 8 10 3 (g4) s) a c a a a a a c a
30 40 93 121 93 11 84 84 86 80 09 73 1
60 40 95 141 96 09 93 92 91 90 13 88
90 40 94 111 96 12 92 91 88 88 10 80
120 40 94 101 94 09 91 88 85 84 10 80
150 40 93 12 93 10 92 93 91 91 09 83 standard)
180 40 91 09 1 90 08 91 o90 88 90 09 80
210 40 92 101 92 08 91 91 89 89 08 86
240 40 89 11 1 89 08 89 89 86 86 08 81
270 40 89 07 89 05 85 80 79 76 06 65
300 40 87 07 189 07 83 83 80 81 07 78
Summary of the Effects of Thiocyanate Concentration - As the thiocyshyanate concentration is increased sulfur content in the coating increases After humidity testing the usual increase in oxygen and decrease in sulfur content can be seen near the coating surface
At low SCN concentrations the reflectance curves are flatter and have higher emittances probably due to free metal in the coatings At high SCNshyconcentrations oscillations appear in the spectral reflectance curves After humidity testing ihere is an increase in the solar reflectance for high NaSCN concentrations of greater than 21 gIl Coatings in the range 6 to 21 giL have the best prolonged humidity resistance
Effect of Ammonium Ion on Coating Properties
Presence of the ammonium ion is very important in black nickel plating Without ammonium ion the coating will be nonadherent and smutty3 The functions of ammonium ion are summarized as follows
Prevents too great a rise in pH by buffer action and thus favors the reduction of thiocyanate and hence metal sulfide formation
Suppresses the formation and precipitation of hydroxide salts of both nickel and zinc
Reduces the metallic nickel and zinc contents in the coating by forming ammonia complexes of nickel and zinc which are more difficult to reduce into free metals than uncomplexed nickel and zinc ions
The suppression of metallic ion reduction permits the reduction of thiocyanate to proceed
In this experiment six NH4+ concentrations in the range 3 to 8 gL were investigated The NH4 + concentration of the standard NASA formula is 5-6 gIl
+Effect of NH4 Concentration on Auger Spectra - The Auger spectra of three representative samples plated at different ammonium concentrations are shown in Figure 27 No significant difference was found among the Auger spectra either before or after the two-day NASA standard humidity test Although production of good coatings requires the presence of NH4 +
ions the coating composition is not very dependent on the exact concentration
45
Nill4 = 49ft N 4Vt
Before humidity After humidity
Zrn2 M I
0 250 500
Apprormmate depthI
NH4 += 56 qJt
Before humidity
750
X
1000 0
NH4
After
C 2
250 500 Approximate depth
56
lvvxmdlty
1 750 1000
NN_
ZX 2 X2
0 250 500
Approxm tedepth
750 3000 0 250 500
Appommmte depth - 750 1000
ig4u 2 Efc
Befor-humiity-AfterZnnX 0N
o N4 c on Auger
huJmidity 2
4ONI
- -- shy
250 500 750 Appmae depth j
Figure 2 7- Eff ect of NET+
3000 0 250 500 75D Appoorlmde depth
concentration on Auger spectra
1000
Effect of NH4+ Concentration on Optical Properties - Coating insensishytivity to the level of NH 4 + concentration is also apparent from the optical properties The small effect of NH4+ concentration on the spectral reflecshytance of three coatings is shown in Figure 28 All the curves are similar
The spectral reflectance of the same samples after the 2-day NASA humidity test are shown in Figure 29 A similar increase in reflectance in the 1 to 2 tim region and a decrease of the bump at 0 9 11m is observed for all the samples The overall solar absorption is actually increased in this short humidity test However degradation of a results from the longshyterm humidity test for all samples plated at various NH 4 + concentrations as given in Table IX Table IX again shows that NH4 + concentration has very little effect on the coating optical properties and humidity resistance
+ +Summary of the Effects of NH 4 Concentration - If the NH 4 concenshytration is at least 3 g 4t (the smallest concentration tested) further inshycreases in NH 4 + concentration have little effect on coating optical propershyties or humidity resistance
TABLE IX- HUMIDITY RESISTANCE OF BLACK NICKEL SAMPLES PLATED AT DIFFERENT NH 4 + CONCENTRATIONS
Days at 38degC and Days in 95 relative humidit MIL-STD
NH4+ Plating 810B 4 Time 0 4 6 8 10 3
gt (s) a a a a a e a
30 40 88 09 88 89 87 88 09 81
40 40 88 08 89 90 87 90 09 82
50 40 84 08 87 87 86 86 07 76
56 40 86 08 88 88 86 87 07 84
(Standard)
70 40 86 08 88 89 88 89 07 83
80 40 86 08 88 90 87 88 08 81
47
1N Sample a C Symbol number tration __ -____
8 52 4 gt 91 08
55 56 gt 90 08
58 8 gt 90 09 6 ~~Before humidity test
0 Before humidity test
0
3 4 5 7 1 2 3 4 5 7 10 20 2 Wavelength pm
coner- y Figure 28- Effect of ammroniuml ion concentration on
spectral reflectance before humidity test
Sample NH4 + C Symbo Number - -
tratlon
8 52 40 gt 93 09 55 56 g 93 08 2-3 4570
l- -_ 09 _- - -i - --58 8 94- - 95
spectral refl an 1 After humidity testbefo
4
01
3 4 5 7 1 2 3 4 0 20
Wavelength Pm
Figure 29- Effect of ammonium ion concentration on spectral reflectance after humidity test
ORIGINAL PAGE
OF PO01R QUAL=TY
48
Summary of the Parameter Study and Improved Black Nickel Formulas
Auger analysis of nearly all the samples exposed to humidity showed the conversion of metal sulfides to metal oxides or hydroxides near the coating surface with a corresponding degradation in solar absorptance In this proshycess the sulfide is washed from the surface by the humidity which is probshyably the source of the optical degradation This process can be greatly imshypeded by depositing coatings which are initially rich in hydroxides and which have a minimum amount of sulfur This was the basic strategy used to obtain more humidity resistant coatings Based on the parameter study it was found that an increase in oxygen and decrease in sulfur content could be accomplished by increasing the bath pH (and possibly current density) or by decreasing the Zn++Ni++ ratio (or Zn concentration) the temperature or the SCN- concentration Within certain limitations (namely the maintenance of good optical properties) these changes were incorporated in the improved plating formulas to be described below
A second general strategy which can be used to improve the coating is to simply plate thicker black nickel coatings Although in the initial stage of humidity exposure most of the coatings seemed to be oxidized or hydrolyzed by the humidity beyond that stage further humidity exposure degraded the coatings less severely and more slowly Thus the degradation stabilized near the coating surface As a result thick coatings had significantly better humidity resistance although they also usually had an undesirable higher emittance However it is possible to adjust the coating thickness along with other favorable parameters to optimize both the optical properties and humidity resistance
The improved plating formulas were actually derived through an iterashytive process using as general guidelines the desire to reduce the sulfur conshytent and to increase the coating thickness The stability of optical propershyties under humidity exposure for all of the coatings studied in this developshyment phase are given in Table X In each case the variations from a basic formula are indicated Also the average properties obtained with the NASA standard solution are shown for comparison The composition of the three new solutions studied are listed in Table XI along with the composition of the NASA standard solution
Among all of the bath compositions and plating conditions studied the two indicated by the asterisk on Table X gave the best combination of humidity resistance and optical properties Note that after 14 days in the NASA standard humidity chamber the absorption for both of these samples was better than 0 91 Among these two samples the one plated for 45 seconds had considerably better resistance to the severe MIL-STD-810-B humidity test but its initial optical properties are not quite as good as those for the sample plated for 40 seconds Since we feel that the 810B test is
49
TABLE X -HUMIDITY RESISTANCE OF IMPROVED BLACK NICKEL COATINGS
(a) Solution I
Before 810 B humidity NASA standard humidity density Time humidity 1 day 4 days 4 days 10 days 14 days 20 days
2 ) (S)(macm
40 40 882 07 694 883
40 45 849 07 821 --- 887
40 50 812 09 834 --- 864
50 40 865 07 835 --- 876 - ---
50 45 791 13 865 --- 845 ---
50 50 814 12 832 --- 853 --- - --shy
60 40 797 09 841 772 872 ---
60 45 822 11 859 789 820
60 50 794 13 819 --- 855 ----
(b) Solution 2
40 40 911 07 888 --- 908
40 45 918 07 745 --- 912
40 50 913 09 755 --- 884
50 40 930 10 665 --- 892
50 45 896 09 817 --- 914
50 50 904 11 893 --- 926
60 40 904 10 905 775 937 --- 839 --- 786
60 45 896 11 946 856 946 890 848 10 832
60 50 906 21 908 --- 929
( ) Solution 3
- 50- 48 898 07 856 786 --- 855 813 --- 805
50 48 877 10 877 821 --- 927 898 --- 897
60 37 892 08 901 838
60 40 907 10 842 751 --- 924 917 10 906
60 45 885 12 902 867 --- 928 913 14 886
60 47 890 --- 834 754
70 35 899 10 588 485 --- 868 814 --- 806
70 43 896 13 785 649 --- 921 902 --- 884
70 48 880 22 866 795 --- 916 891 --- 885
(d) Standard NASA solution average
43 40 900 097 1 846 891 783 721 7 670
ORIGINAL PAGE IS OF POOR QUAIUTX
50
TABLE XI- COMPARISON OF NASA STANDARD FORMULA AND NEW BATHS
Platingbath NASA New New New parameter standard bath bath 1 bath 2 bath 4 3
pH 56-57 60 60 60
Temperature (C) 222 222 222 222
Current density 43 (macm2 )
EN11J (gl) 56 70 70 70
NaSCN (g~l) 150 150 150 60
Zn++Ni+ 0346 0 10- 030 030
[Ni++] (gl) 2345 2345 2345 2345
Time (S) 400 --
more severe than necessary to simulate long-term humidity effects the thinner (40 second) coating would probably be satisfactory
Thus the recommendation of this program is that the formula given in
Table XII be used for solar absorber applications of black nickel coatings
TABLE XII- RECOMMENDED SOLUTION
Nickel sulfate (NiSO4 6H 2 0) 539 gl
Nickel ammonium sulfate [NiSO4 (NH4 )2SO6H2 02 76 7 gil
Ni+ + 2345 g1l NN4+ 70 g1l
Zinc sulfate (ZnSO7H 2 0) 30 9 gl
Zn++Ni + 030
Sodium thiocyanate (NaSCN) 6 g1l
60pH
Temperature 222degC (72degF) 6 0 (macm )
Current density
40 secondsTime
Note The time can be increased to 45 seconds if greater humidity resistance is shown to be needed in long term tests but this would degrade the optical properties somewhat
51
Polymeric Overcoats to Protect Black Nickel
An alternative approach Which was investigated briefly in the program was the use of polymeric overcoat materials to protect underlying black nickel coatings A key requirement for such a polymeric coating is high transparency in the infrared so that the low emittance of the black nickel coating is not increased Three polymeric materials which in previous work1 were found to be very transparent in the infrared were investigated The three materials were ethylene propylene material (EPM) ethylene propylene diene material (EPDM) and a silicone-based polymer All three were shown to adhere well to black nickel coatings Thickness for the polymeric coatings was 10-2 cm The silicone coating was found to drastishycally increase the emittance for coatings of this thickness to over 0 60 in most cases The EPM and EPDM materials have nearly identical IR absorpshytion spectra and both increased the emittance by - 8 percent when used at the 0 01 cm thickness Thinner coatings could not be made without pinholes At 0 01 cm however these coatings did give a considerable degree of humidity protection to the black nickel coating EPDM coating on the NASA standard black nickel was subjected to three days in the 810B humidity test with minimal effects as shown in Figure 30
8 NASA black nickel with 01 cm EPDM overcoat before and after 3 day 810-B
8 humidity test
I shy6shybull After
4Before 89 17
91 18I After
Before humidity2-
2
Figure 30 - Effect of humidity on a black nickel coating with EPDM overcoat
52
In addition to the increased emittance there are several other problems associated with practical use of polymeric overcoats on a flat-plate collecshytor The EPDM material has double-bonded molecular structure which may be susceptible to UV degradation The EPM has no double bonds but it may have the disadvantage of flowing slightly if used on a warm inclined plane such as a flat-plate collector Another serious problem is the lack of stability for both the EPM and EPDM at the elevated temperatures which may temporarily result when cooling fluid is not circulating in a flat-plate collector Both materials were found to burn off in less than one hour at 232 degC (450 OF) which is a temperature that may be achieved under thermal runaway conditions
In summary none of the polymeric material investigated in this proshygram or others that we are aware of can fulfill all the requirements which would be needed asa practical polymeric protective coating
CONCLUSIONS AND RECOMMENDATIONS
Conclusions
The objective of this program was to determine an improved technique for electroplating of black nickel coating which would increase the coating resistance to humidity without sacrificing its excellent selective absorbing optical properties The optical properties of the best new coatings before and after various humidity exposures are compared in Table XIII to that of the NASA standard formula which served as the baseline for the program
TABLE XIII- HUMIDITY RESISTANCE OF OLD AND NEW FORMULAS
NASA standardBefore MIL-STD 810B humidity humidity
1 day 4 days 4 days 10 days 14 days 20 days
NASA standard 0900 0 097 0 846 --- 891 783 721 --- 670
New formula
40 second electroplate 902 10 842 751 --- 924 917 10 906
45 second electroplate 885 12 902 867 928 913 14 886
53
The new formula plated for 40 seconds is more susceptible to the severe MIL-STD-810B humidity test than is the 45-second coating but in the NASA standard test (38degC at 95 RH) both coatings do equally well The thinner coating has the advantage of somewhat better optical properties Both new coatings do substantially better than the baseline NASA black nickel coating
Recommendations
It is recommended that the new solution formula developed in this proshygram be used for a flat-plate solar demonstration program A critical need exists for long-term field condition testing of black nickel coatings
It is likelythat more small-scale experimentalwork involving iterations of the plating variables could further enhance both optical and humidity resisshytance of black nickel coatings In other words although the coating propershyties were greatly improved during this program they have not been totally optimized In particular the better solar properties obtained in some preshyvious work (a - 0 96 and e- 0 07) might be approached through further effort
The use of polymeric overcoats to protect black nickel coatings cannot be recommended at this time Suitable materials which simultaneously fulshyfill the requirements for low IR absorption high temperature stability and the ability to provide humidity protection have not been identified
REFERENCES
1 H Y B Mar J H Lin P B_Zimmer- R-E -Petet-sdn and-J S Gross --Optical- Coatings fr-Flat Plate Solar Collectors Final Report for
ERDA under Contract No NSF-C-957 (AER-74-09104) September 1975
2 Metal Industry pp 23-25 January 1921 pp 73-74 February 1921
3 E J Serfass R F Muraca and W R Meyer An Explanation of Black Nickel Plating 39th Proc AES 101 (1952)
4 H Tabor J Harris H Wenberger and B Doron Further Studies on Selective Black Coatings U N Conf on New Source of Energy Paper E Conf 35546 Rome (1961)
5 NASA Technical Brief B73-10156
6 NASA Technical Brief M-TU-74-3 The Development of a Solar-Powered Heating and Cooling System MSFC May 1974
54
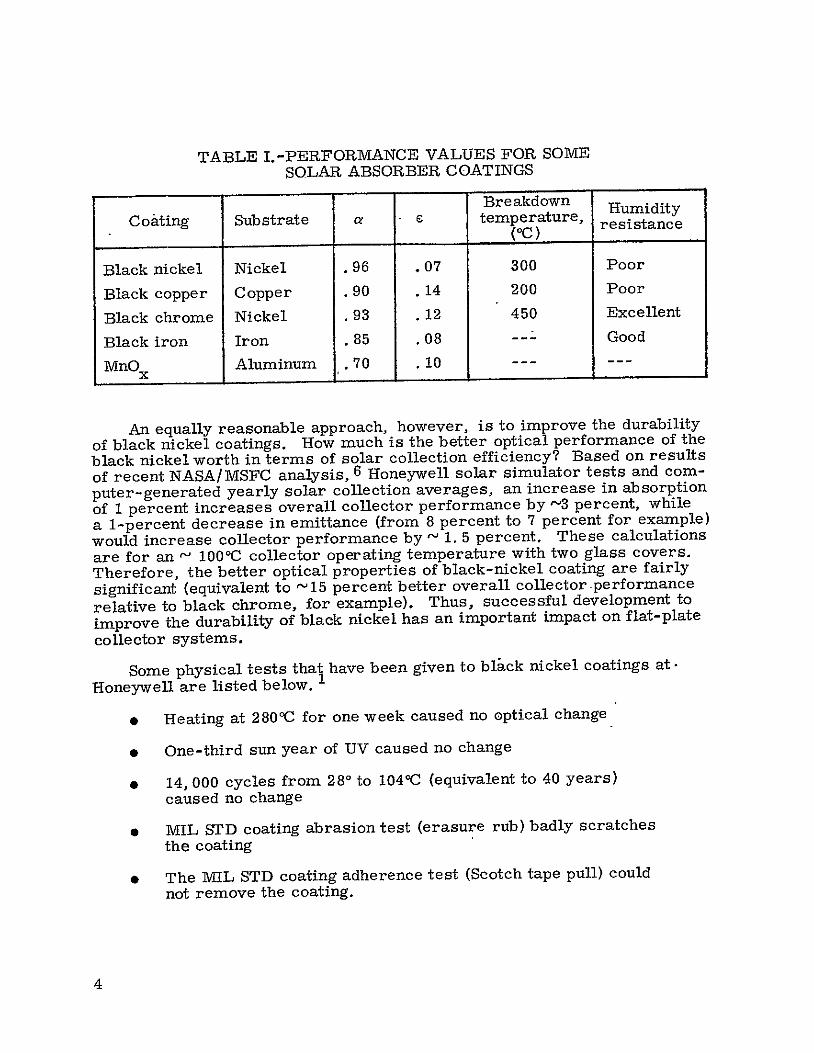
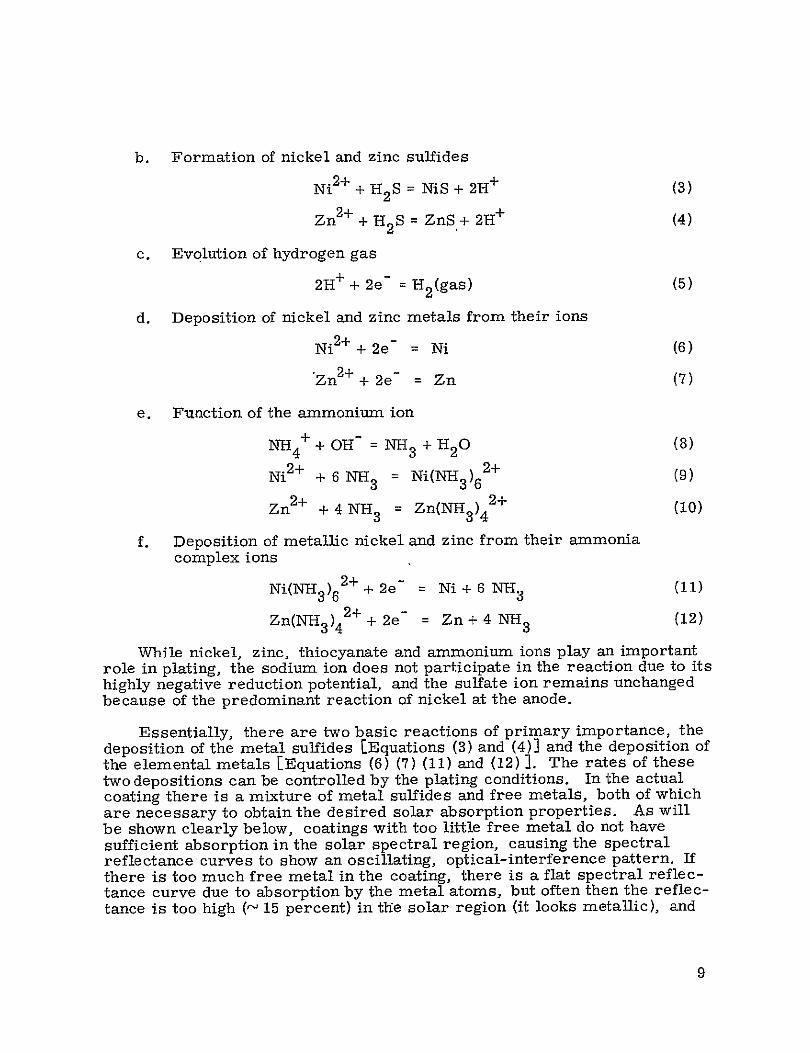
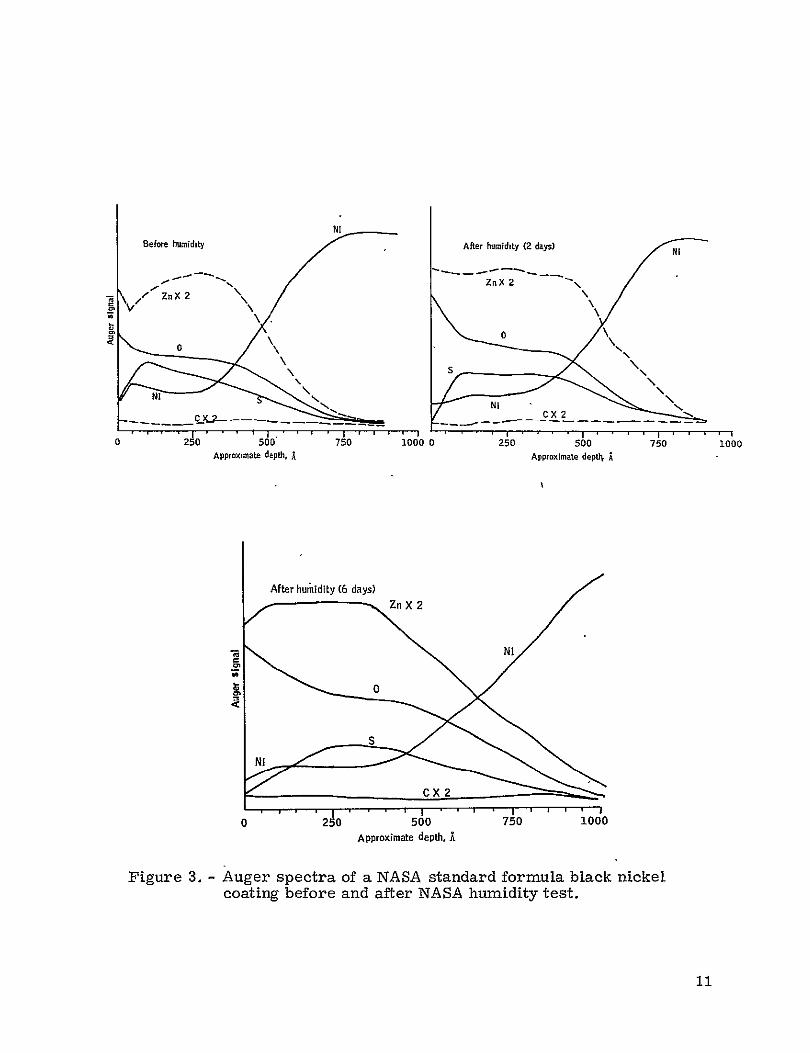
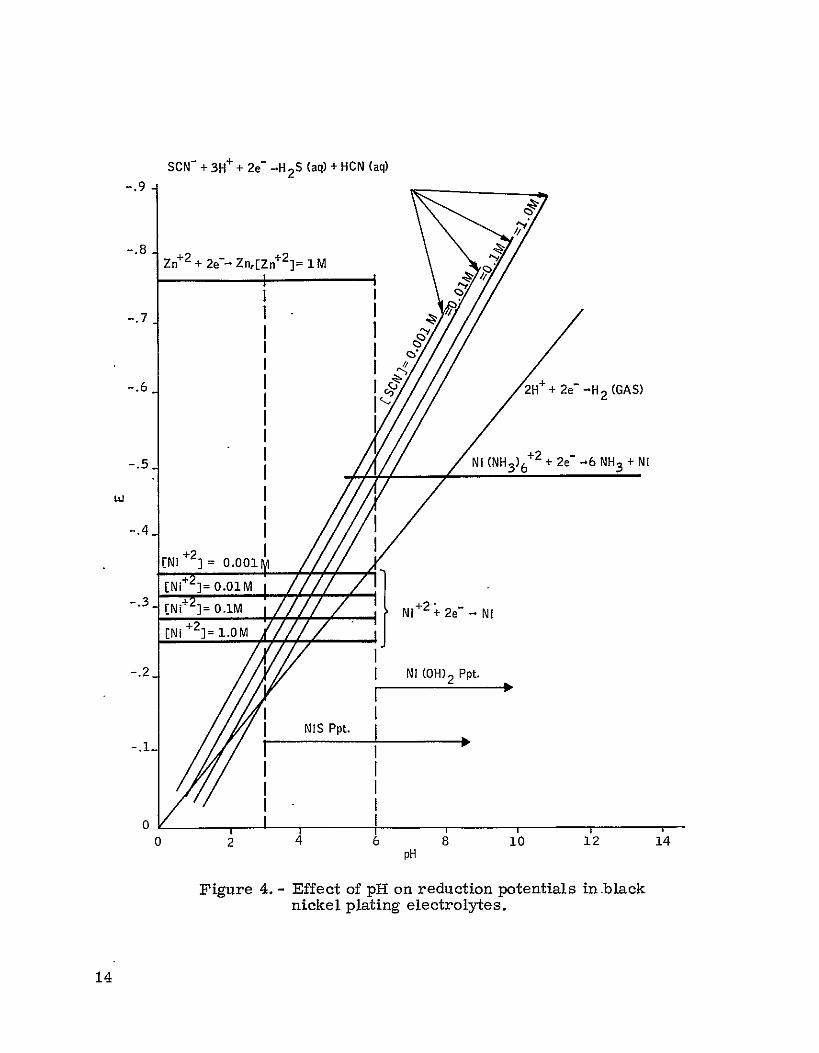
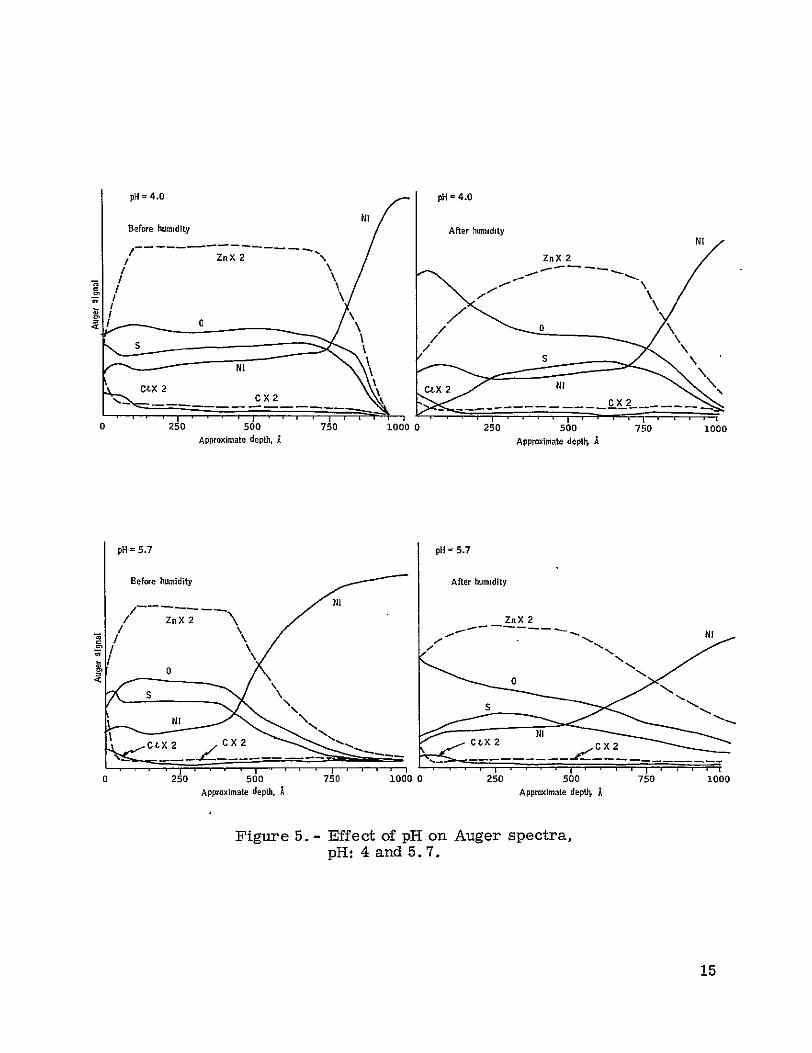
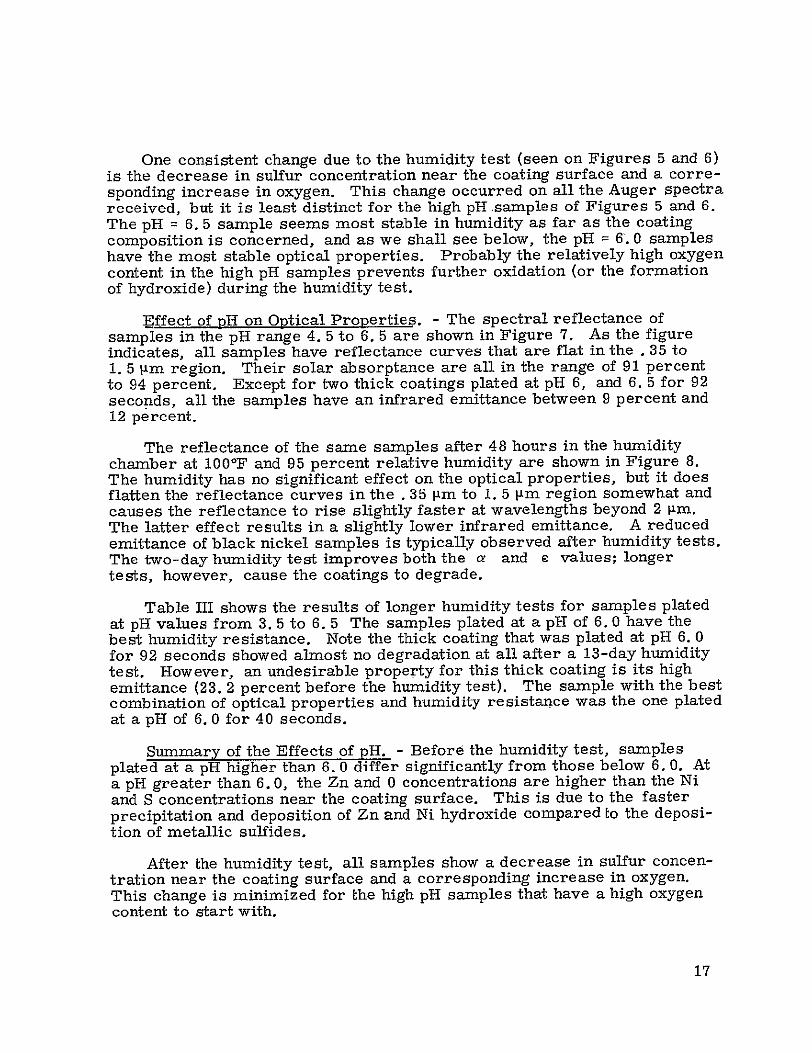
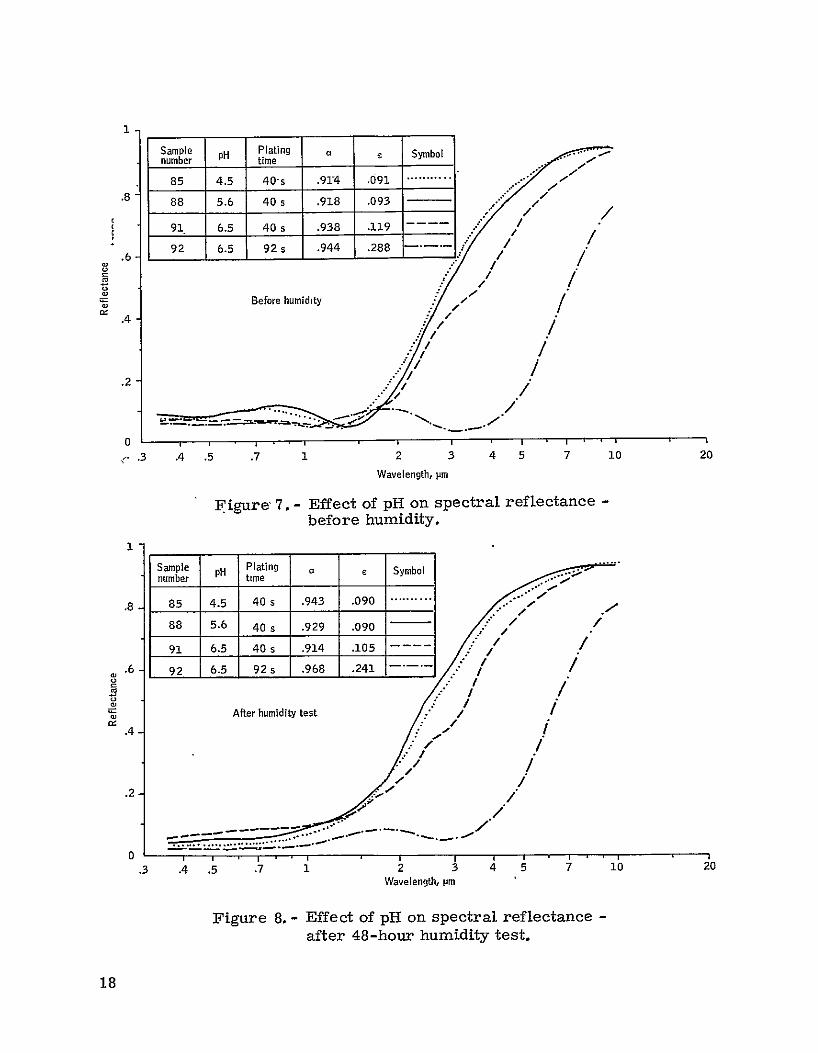
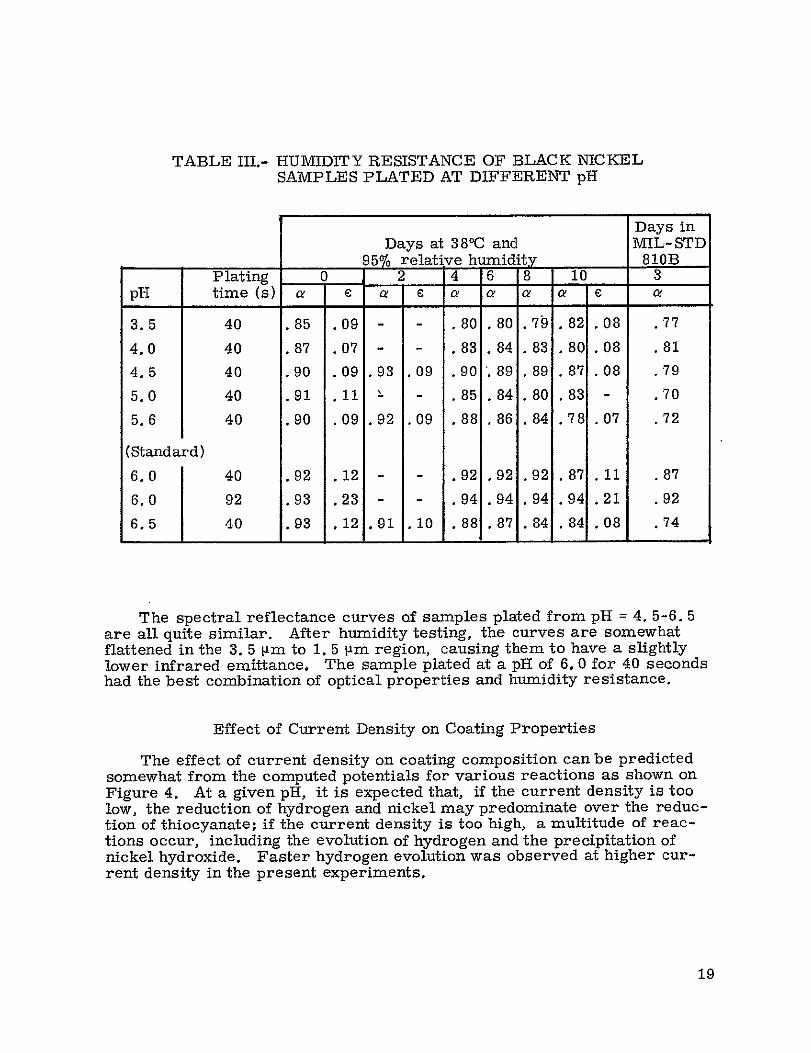
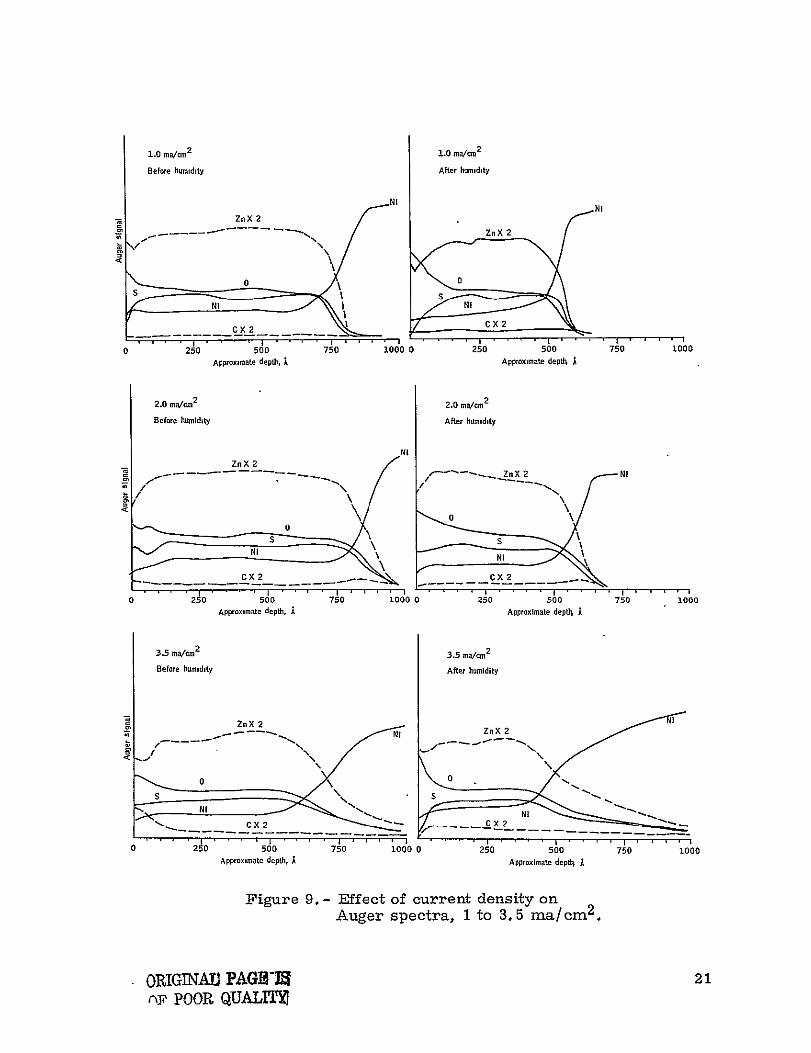
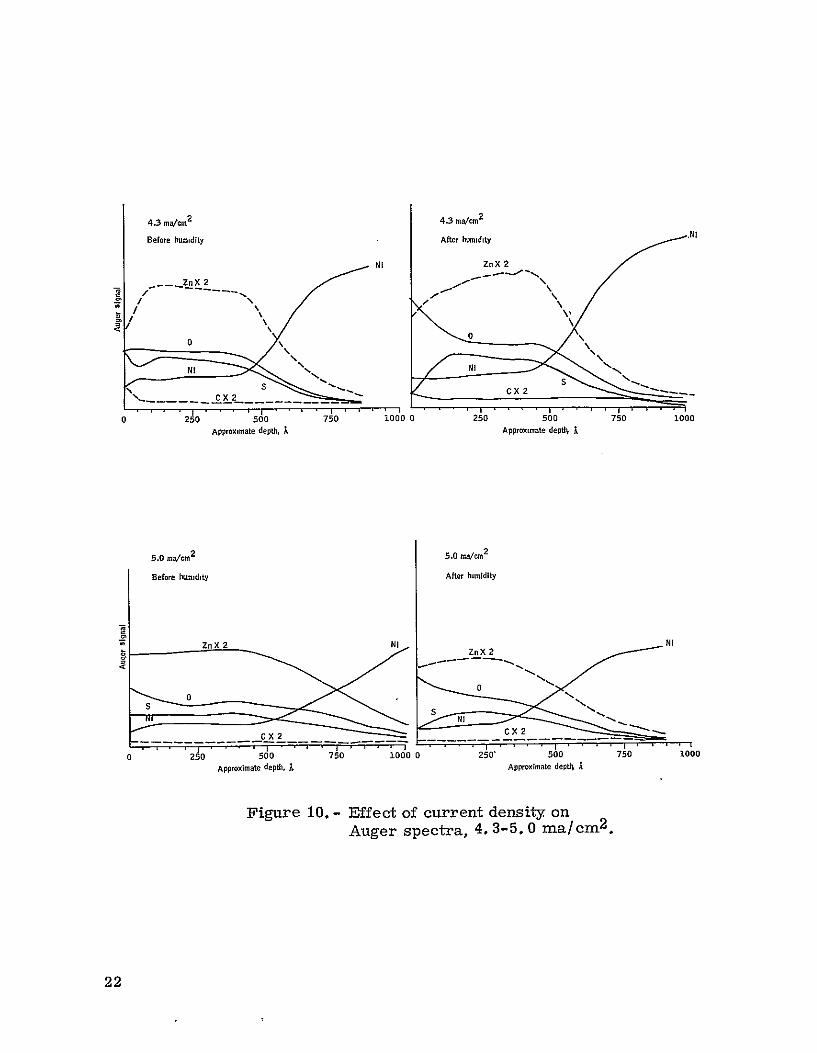
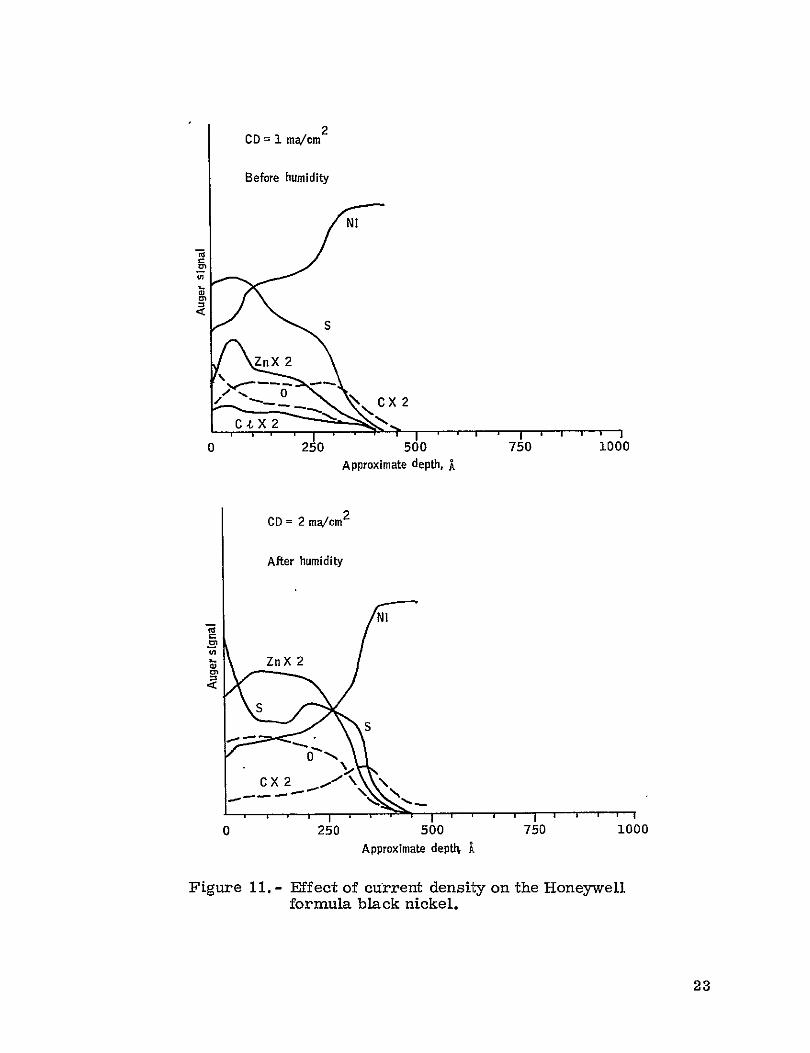
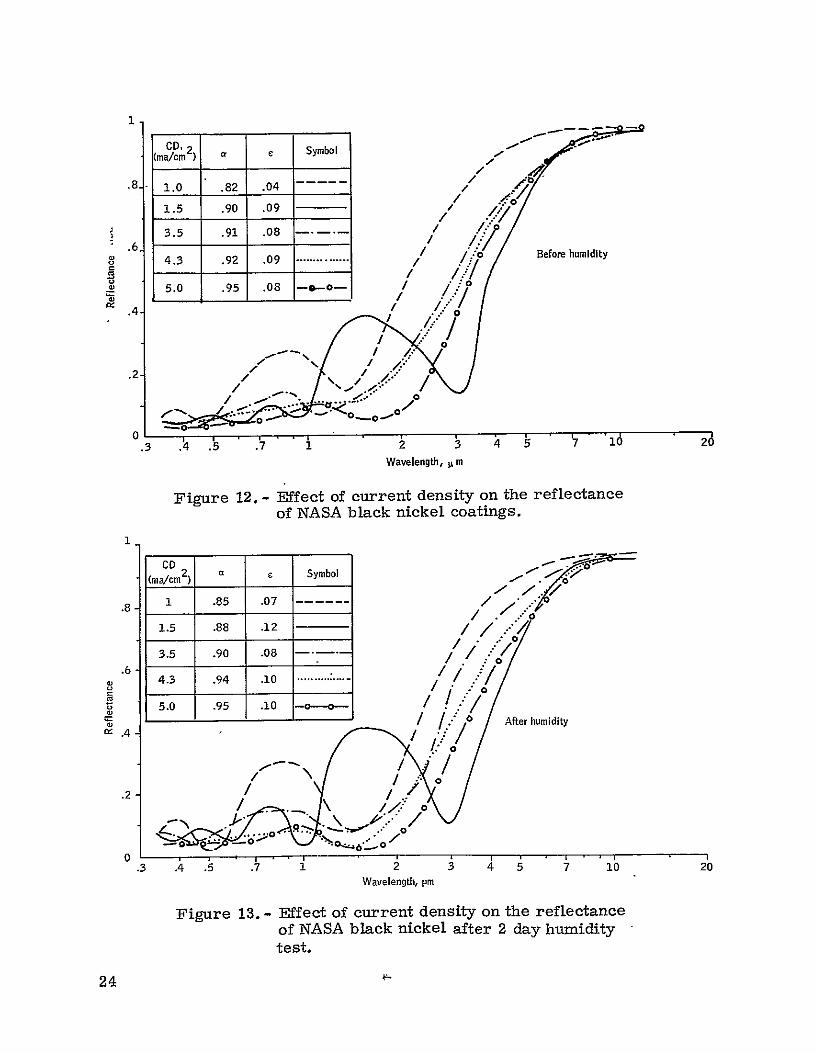
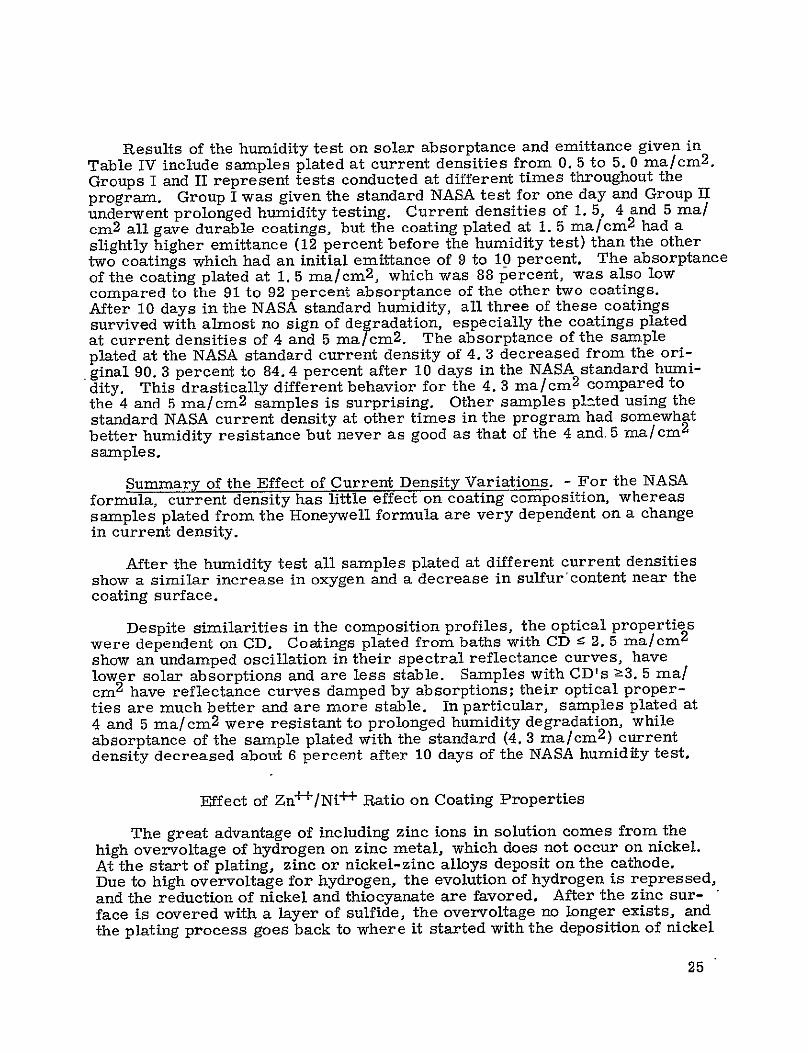
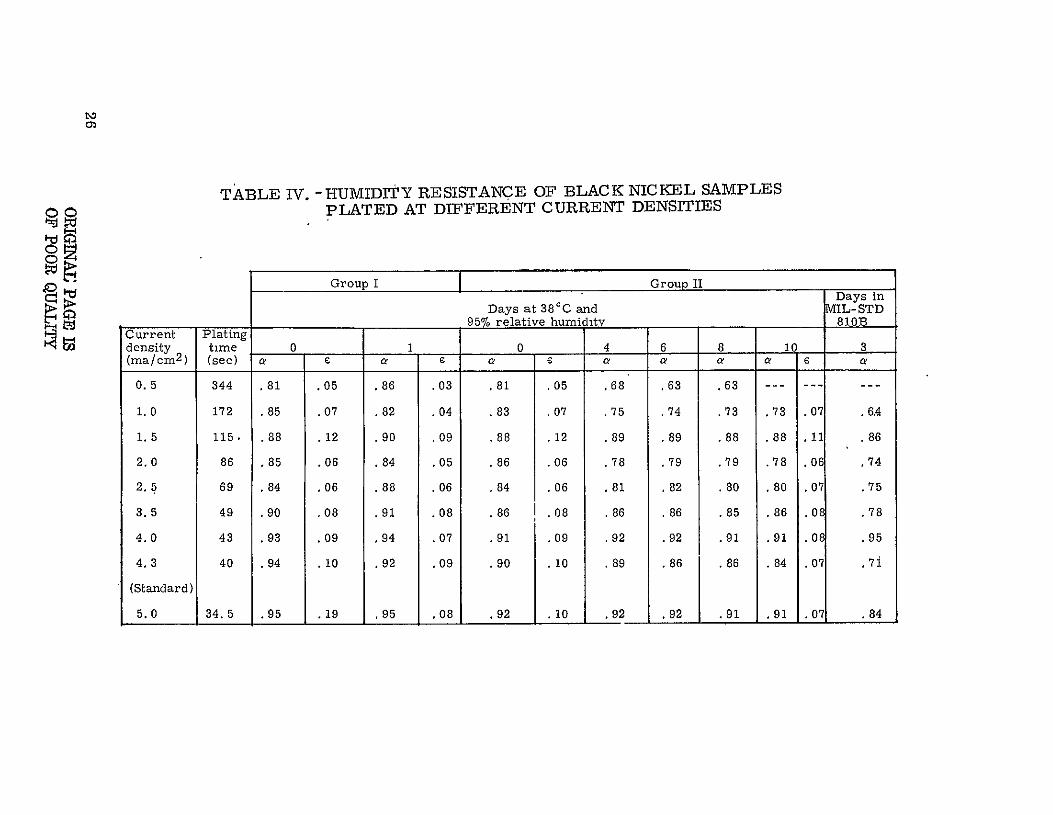
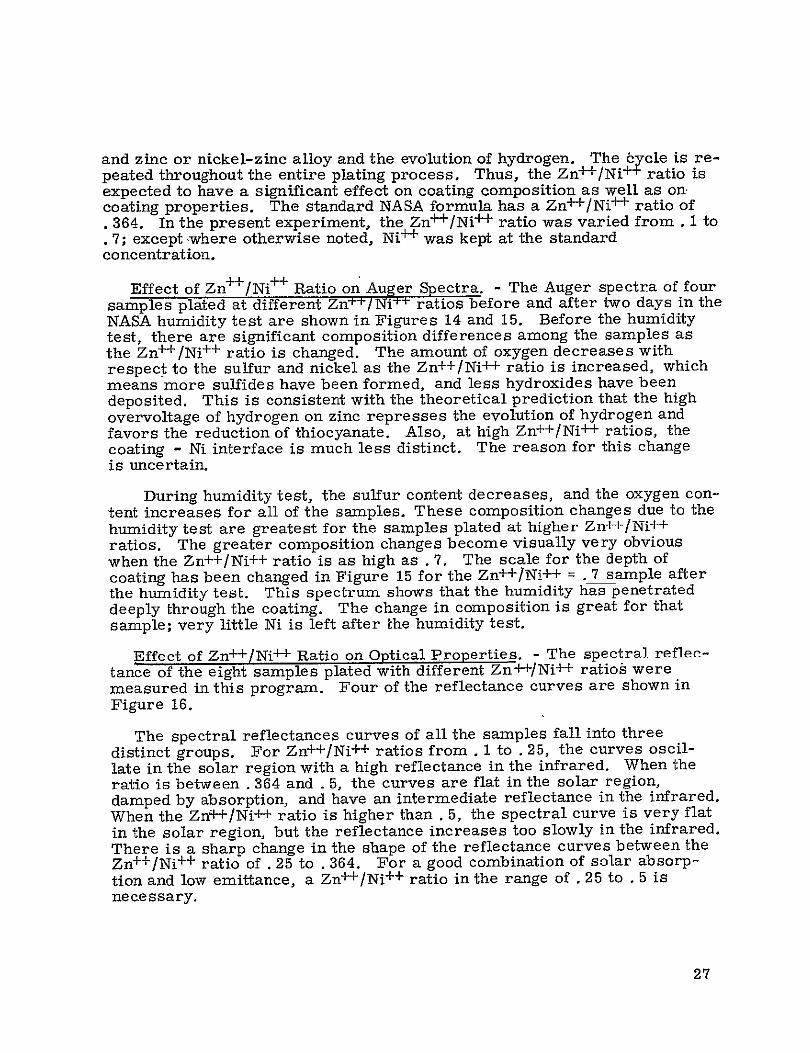
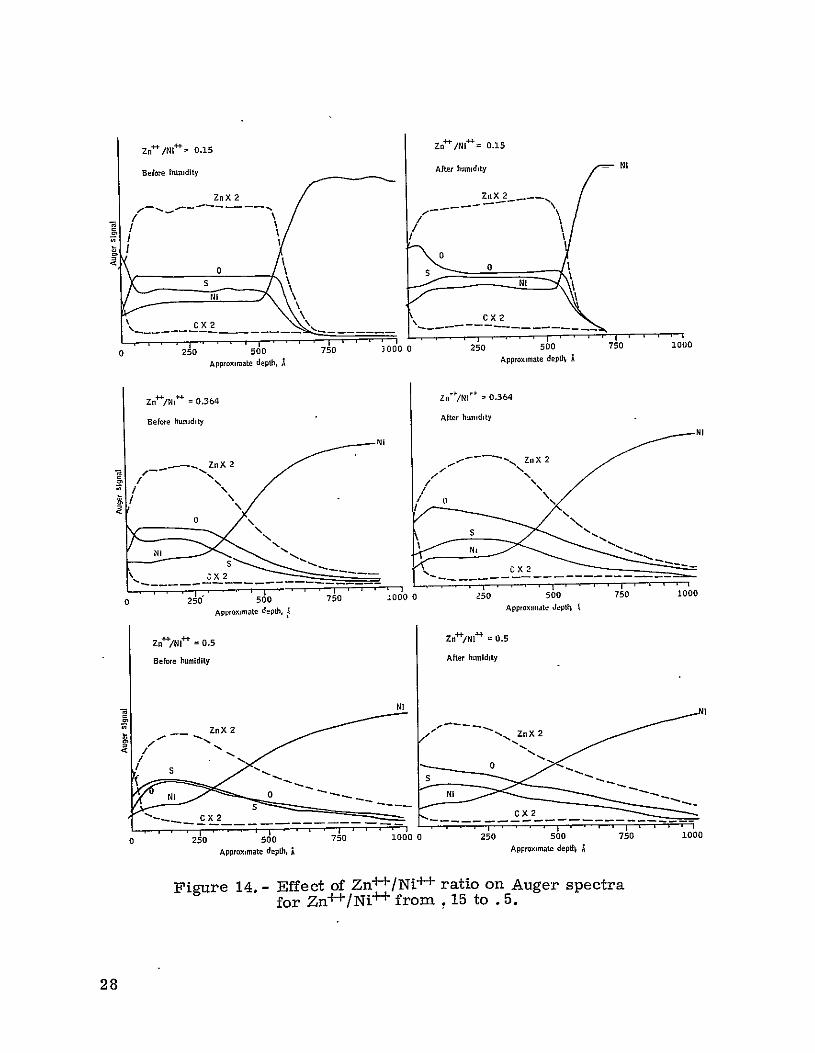
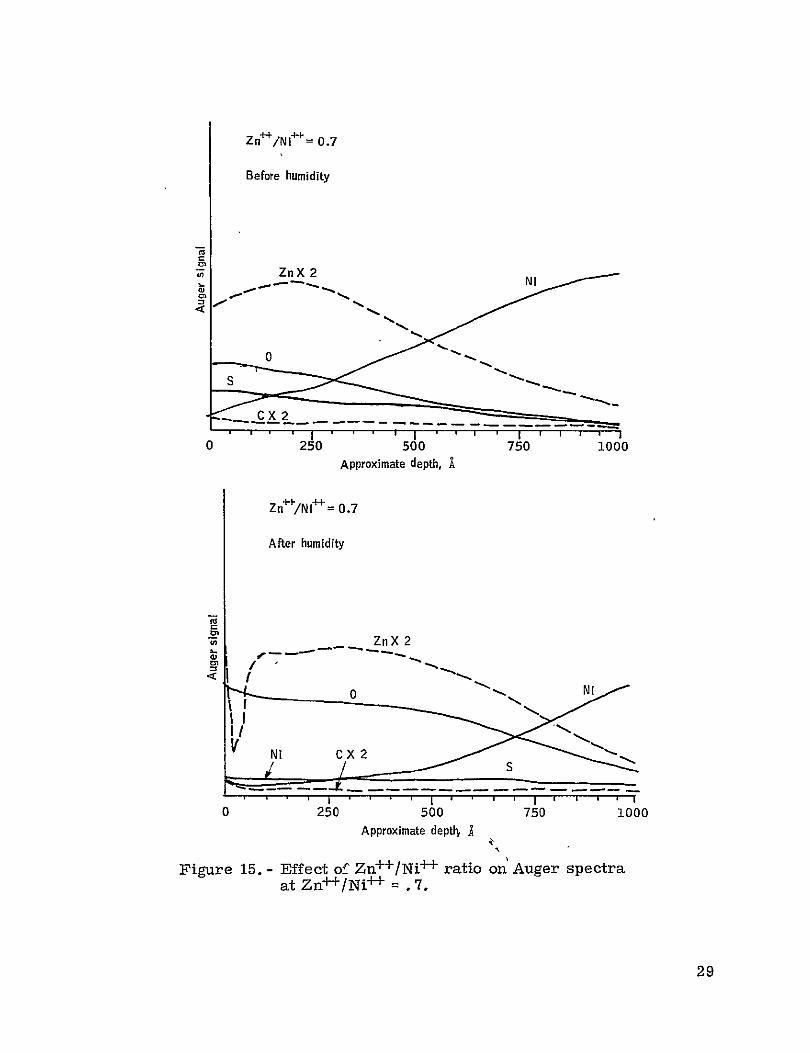
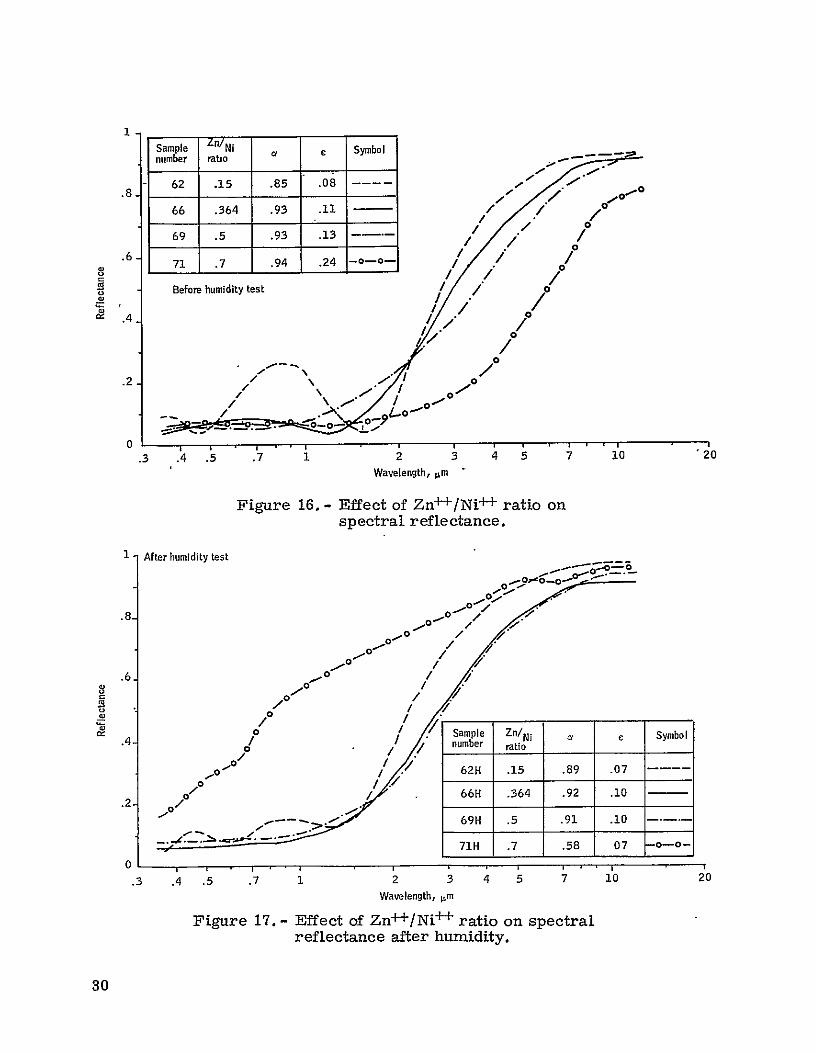
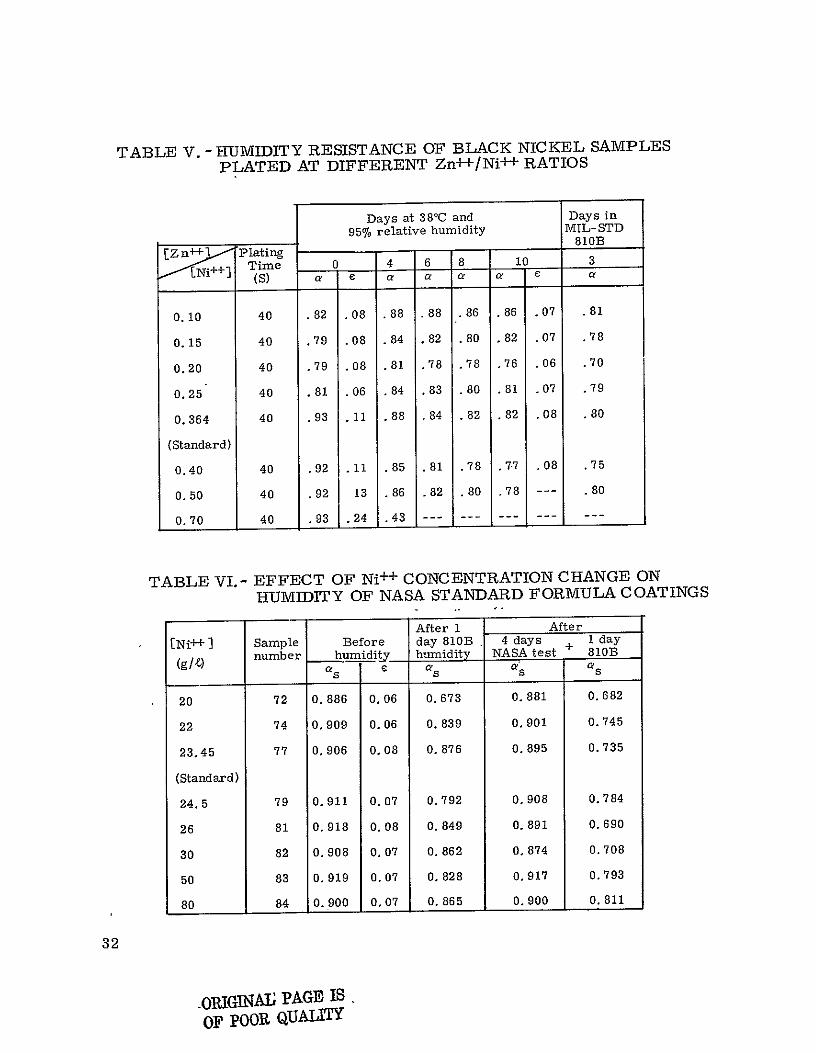
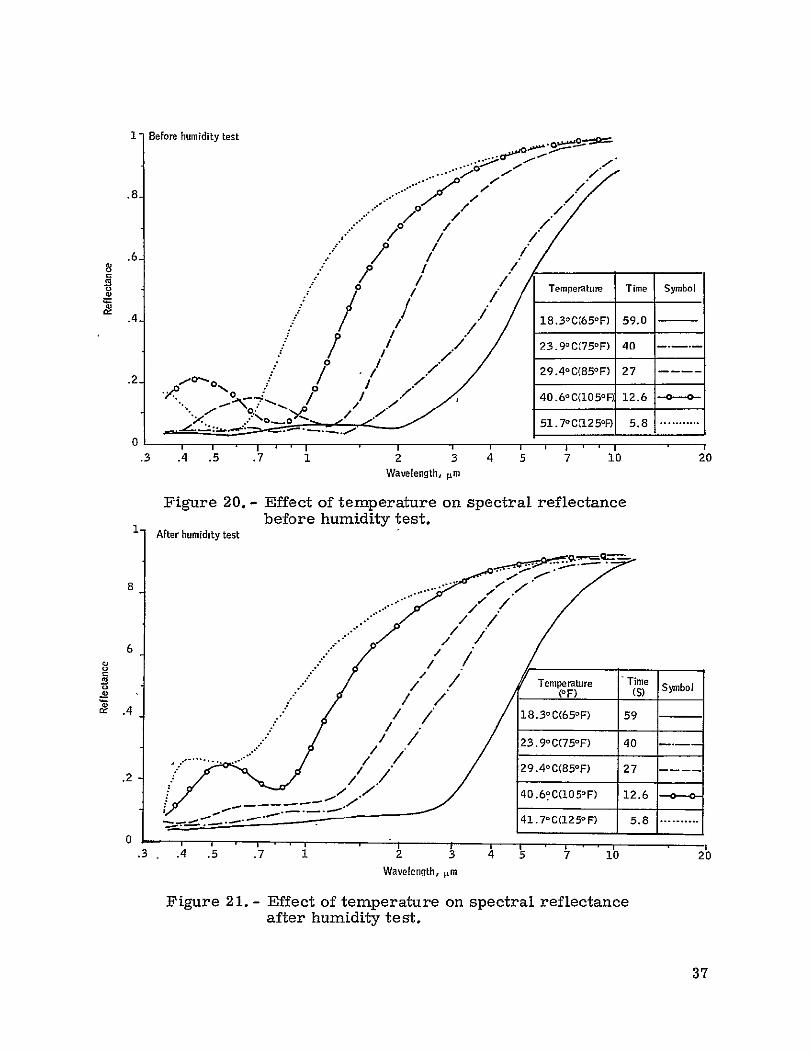
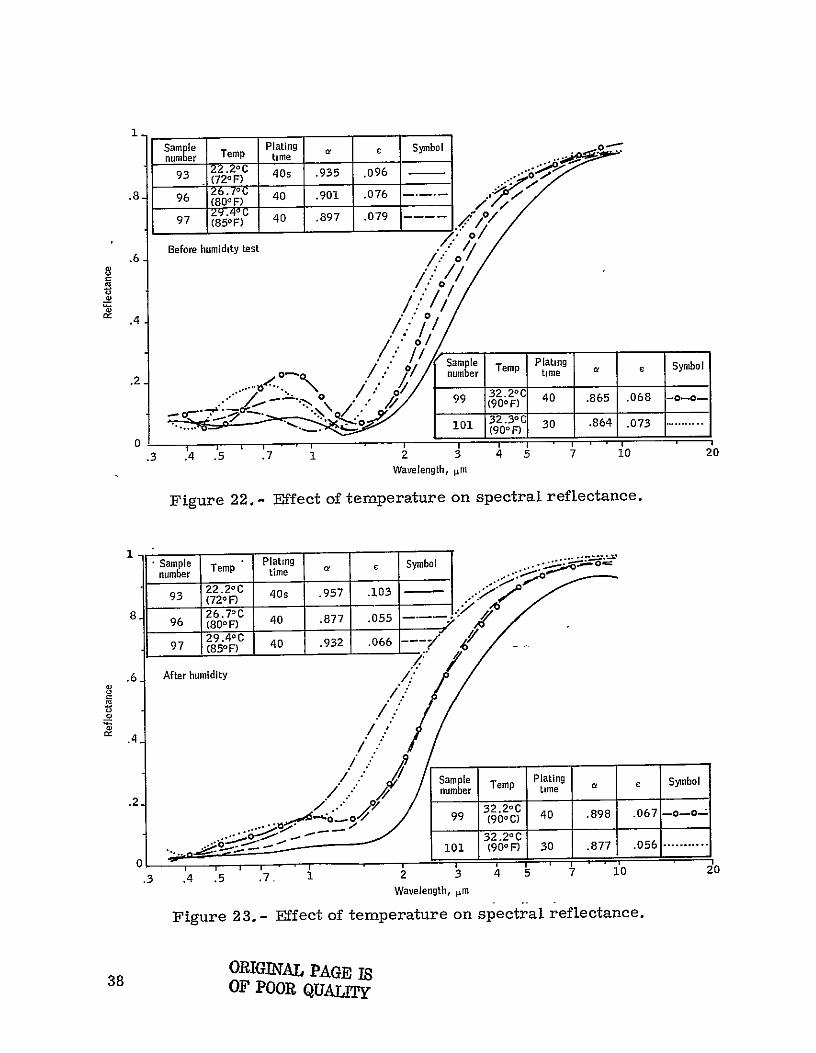
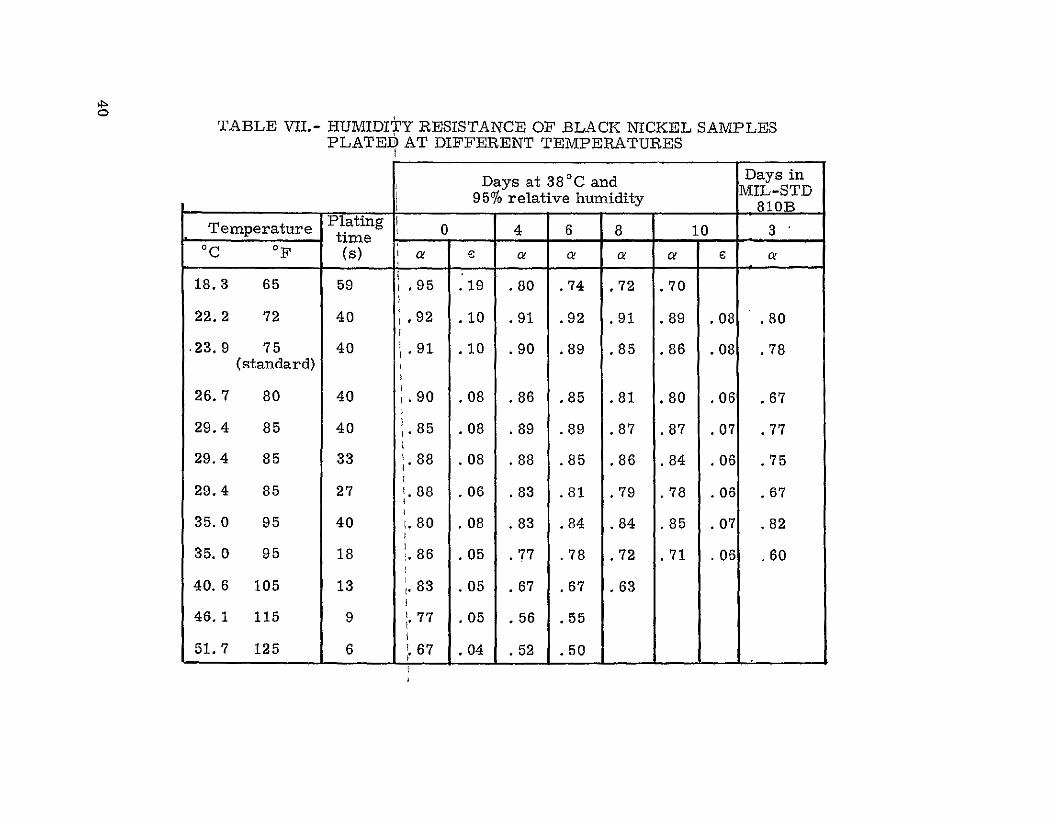
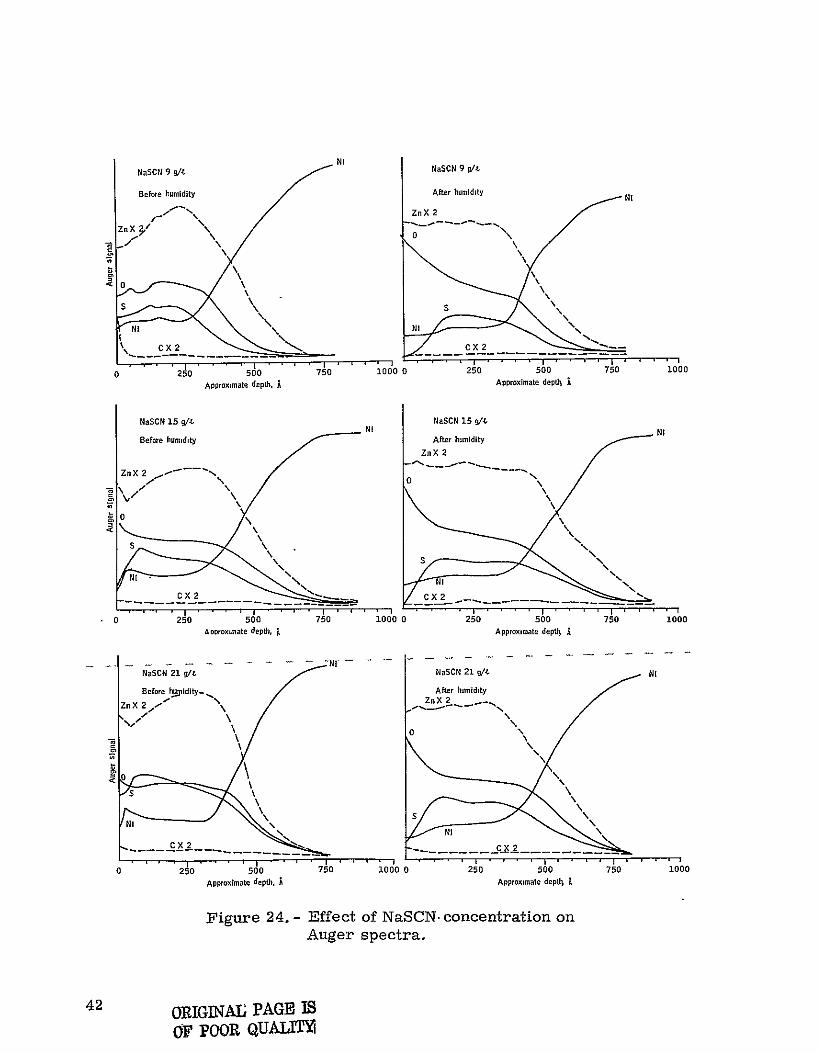
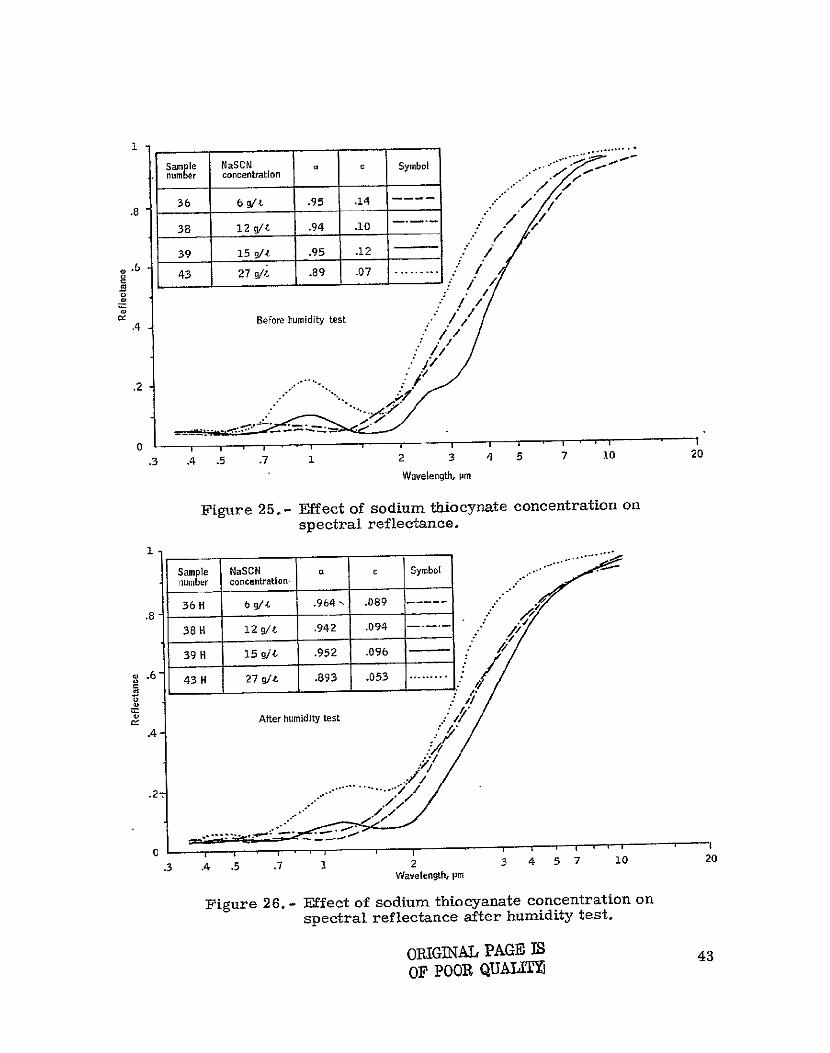
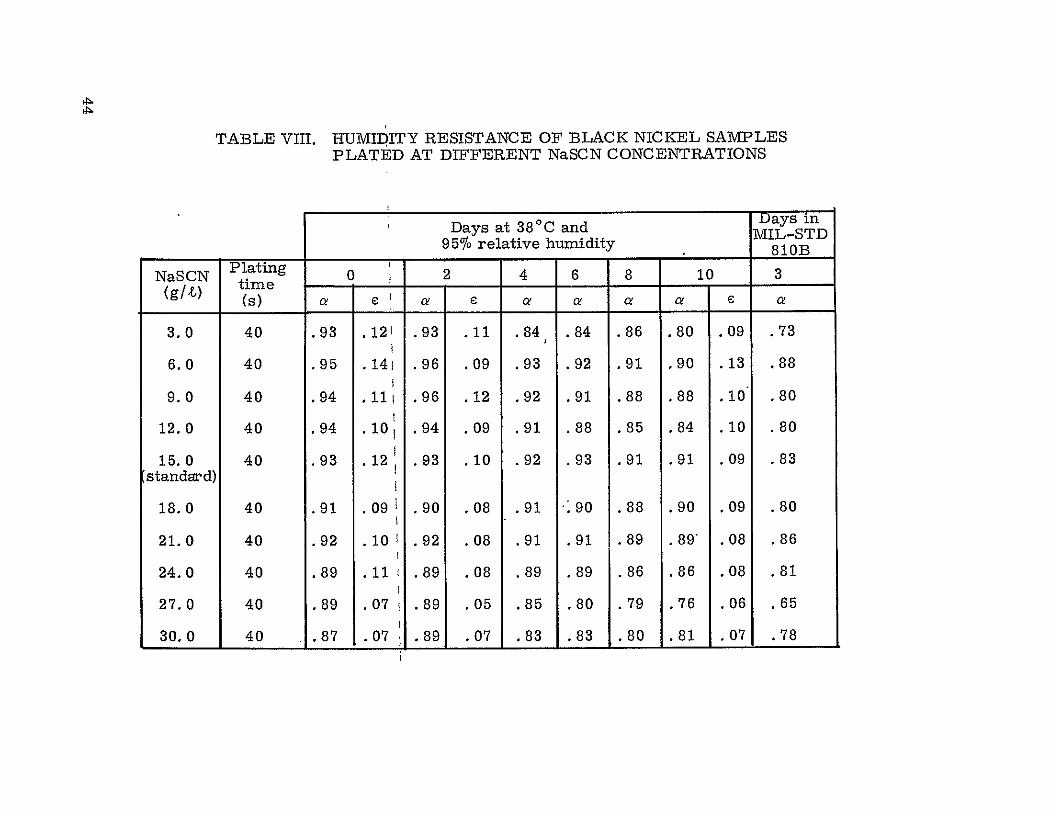
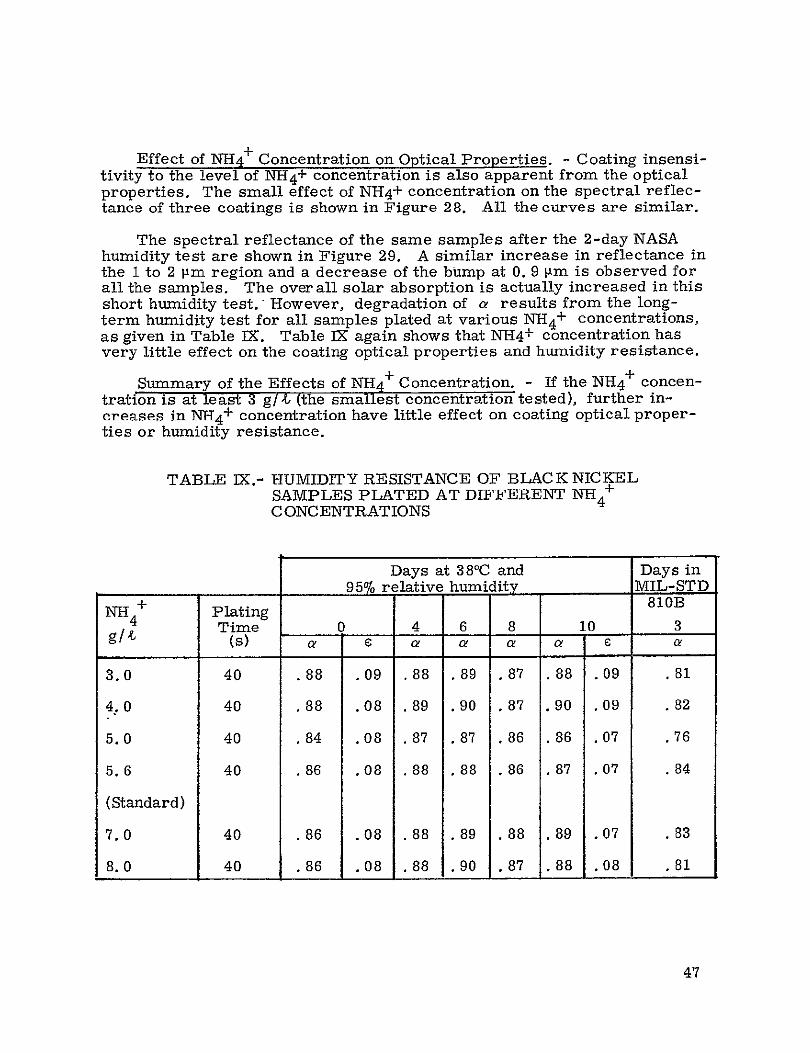
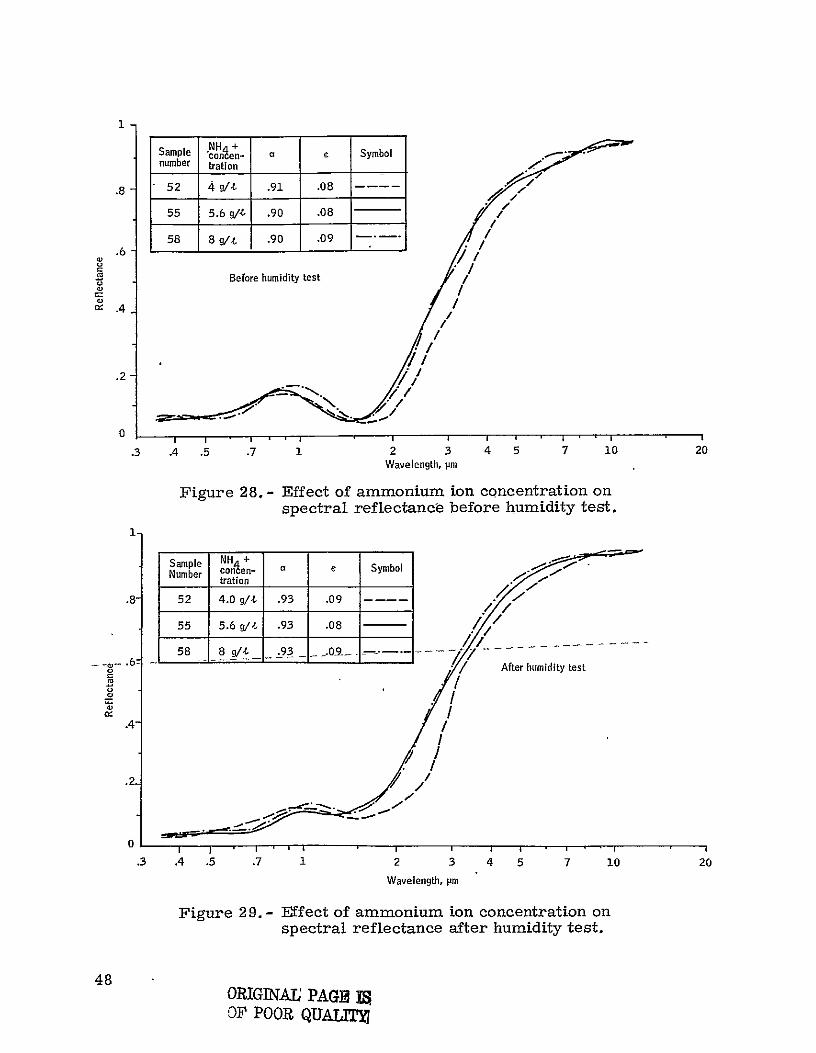
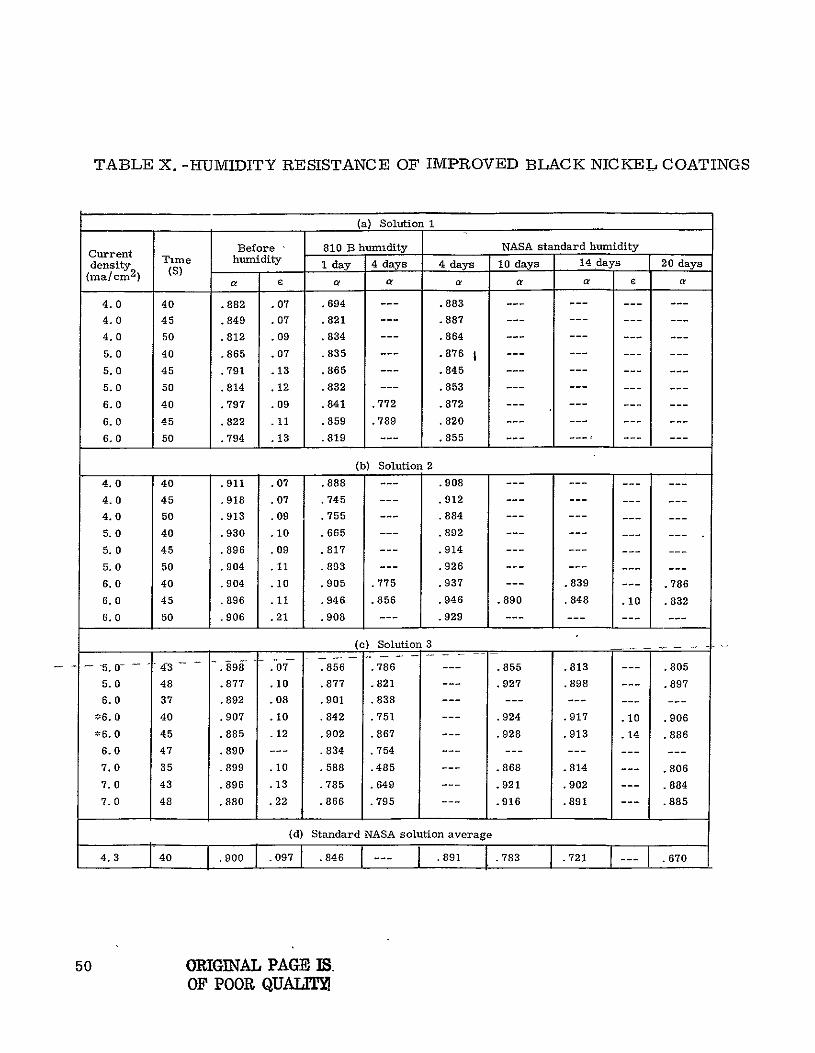