Embed Size (px)
Citation preview
Improvement of Flood Risk Assessment under Climate Change in Ho Chi Minh City with GIS
Applications
�
�
A thesis approved to the Faculty of Environmental Sciences
and Process Engineering at the Brandenburg University of
Technology in Cottbus - Senftenberg in partial fulfillment of the
requirement for the award of the academic degree of Doctor of
Philosophy (Ph.D.) in Environmental Sciences.
by
Master of Science
Tran Thong Nhat
Matriculation Number: 3000078
from Song Cau Town, Phu Yen Province, Viet Nam
Supervisor: Prof. Dr. Dr. h.c. Michael Schmidt
Supervisor: apl. Prof. Dr-Ing. habil. Frank Molkenthin
Day of the oral examination: July 9, 2014
„Gedruckt mit Unterstützung des Deutschen Akademischen Austauschdienstes“
Entwicklung des Hochwasserrisikos beeinflusst durch den Klimawandel in Ho Chi Minh Stadt
mittels GIS
Von der Fakultät für Umweltwissenschaften und
Verfahrenstechnik der Brandenburgischen Technischen
Universität Cottbus zur Erlangung des Akademischen Grades
eines Doktors der Philosophie (Ph.D.) in
Umweltwissenschaften genehmigte Dissertation
vorgelegt von
Master of Science
Tran Thong Nhat
Matriculation Number: 3000078
aus Song Cau Town, Phu Yen Province, Viet Nam
Gutachter: Prof. Dr. Dr. h.c. Michael Schmidt
Gutachter: apl. Prof. Dr-Ing. habil. Frank Molkenthin
Tag der mündlichen Prüfung: July 9, 2014
Declaration/Affiant
Tran Thong Nhat i
Declaration/ Affiant
The following Philosophy of Doctor thesis was prepared in my own words without any
additional help. All used sources of literature are listed at the end of the thesis.
I hereby grant to Brandenburg University of Technology Cottbus – Senftenberg
permission to reproduce and to distribute publicly paper and electronic copies of this
document in whole and in part.
Cottbus, December 17 2013 Tran Thong Nhat

Dedication
Tran Thong Nhat ii
Dedication
The first dedication is given my parents who always wish their children attaining
further steps in the way of human knowledge. I also want to dedicate the thesis to my
son who usually play and make obstreperousness beside as I did the research. The final
I would like to dedicate to my wife who always suggests a lot of strange ideas and
sometimes cooks for a funny meal

Acknowledgement
Tran Thong Nhat iii
Acknowledgement
To make the research in Brandenburg University of Technology Cottbus – Senftenberg
I received many supports from persons and organizations. It is very difficult to give
list of thank that can express my gratitude satisfactorily.
The first thank I would like to give to Prof. Dr. Dr. h.c Michael Schmidt and Dr. Harry
Storch, who brought the chance for me participating to this research by enrollment and
supervision for whole time of the research with valuable comments and advices.
The second thank I would like to give to BMBF and DAAD which supported for fund
within time of the research.
I am also indebted to Mr. Ho Long Phi who consumed a lot of time to discuss and
address valuable ideas for the research. Moreover, he also supported and provided for
collecting data for my research that needs for a long time and is very close relationship
with the data management organizations in the Vietnam situation.
It is a pleasure to thank my friends in Vietnam, Mr. Phan Nguyen Viet and Mr.
Nguyen Hong Dung who helped in collecting data. Additionally, I also want to give
thank to Mr. Hoang Tung who is always willing to support for data that he is
managing. I would like to thank Assoc. Prof. Dr. Nguyen Kim Loi and Mr. Bao Van
Tuy who supported for me in the updating researches in Ho Chi Minh City relating to
climate change.
I am very grateful for the advices and consultant from apl. Prof. Dr. Manfred Wanner,
apl. Prof. Dr.-Ing. habil. Frank Molkenthin, Dr. Dmytro Palekhov, Mr. Nigel Keith
Downes, and Mr. Hendrik Rujner. Their supports are very useful for my presentation
in the defense. Additionally, I also want to give thank to Mr. Le Duc Tho and Ms.
Antje Katzschner who support for translation of the abstract.
Finally, I indeed thank to the staff in the project Megacity City Research Project. Ho
Chi Minh - Integrative Urban and Environmental Planning Adaptation to Climate
Change Framework and many other people whom I can not list all them here.
However they have had a lot of the supports in the live, study and administration
issues to authority in Cottbus and BTU.

List of Abbreviations
Tran Thong Nhat iv
List of Abbreviations
Abbreviation Full Descriptions
2D Two Dimensions
3D Three Dimensions
ADB Asian Development Bank
AGC-DOST Applied GIS Center - Department of Science and Technology
BFCI-DARD Bureau of Flood Control and Irrigation - Department of Agriculture and Rural Development
BMBF German Ministry of Education and Research
DEM Digital Elevation Model
DHI Danish Hydraulic Institute
DTM Digital Terrain model
ESRI Environmental Systems Research Institute
FC FLOODsite Consortium
GDLA General Department of Land Administration
GPS Global Positioning System
HCMCPC Ho Chi Minh City's People Committee
HCMCSO Ho Chi Minh City Statistical Office
ICEM International Centre for Environmental Management
ICEM International Centre for Environmental Management
IND Industry
IPCC Intergovernmental Panel on Climate Change
JICA Japan International Cooperation Agency
LIDAR Light Detection And Ranging
MONRE Ministry of Natural Resources and Environment
NSWDOC-MHL
New South Wales Department of Commerce - Manly Hydraulics Laboratory
OGC Open GIS Consortium
OSP Open Space
PUB Public
RES Resident
List of Abbreviations
Tran Thong Nhat v
SCFC Steering Center of the urban Flood Control program of Ho Chi Minh city
SF Structure Forum
SIHYMETE Sub Institute of Hydrometeology and Environment of South Viet Nam
TIN Triangle Irregular Network
TL Tide level
UST Urban Structure Types
UTM Universal Transverse Mercator
VNGov. Vietnamese Government
VNUHCM Vietnam National University Ho Chi Minh City
WB World Bank

Table of Content
Tran Thong Nhat vi
Table of Content
Declaration/ Affiant.................................................................................. i
Dedication… ........................................................................................... ii
Acknowledgement................................................................................. iii
List of Abbreviations............................................................................. iv
Table of Content .................................................................................... vi
List of Figures.........................................................................................x
List of Tables ....................................................................................... xiii
Abstract……….. ................................................................................... xvi
Chapter 1. Introduction .......................................................................1
1. Statement of problem .................................................................................1
2. Aims and objectives ....................................................................................6
2.1. Aims ...................................................................................................................... 6
2.2. Objectives ............................................................................................................. 6
3. Significance of the study.............................................................................6
4. Methodology ................................................................................................8
5. Content summary......................................................................................11
Chapter 2. Literature Review ............................................................ 13
1. Study area ..................................................................................................13
2. Geographic information system (GIS)....................................................14
3. Flood models..............................................................................................16
4. Climate change ..........................................................................................17

Table of Content
Tran Thong Nhat vii
5. Researches related to the thesis ...............................................................19
Chapter 3. Data and database........................................................... 22
1. Collecting data...........................................................................................22
2. Editing and correcting data .....................................................................23
3. Population data .........................................................................................24
4. Analyzing and calculating climate data..................................................24
4.1. Identifying climate change trend and rules .................................................... 24
4.2. Identifying the future time point to assess flood risk..................................... 26
4.3. Identifying peaks and their appearance number of the tide level ................ 27
4.4. Calculating climate data at the future time point .......................................... 27
Chapter 4. Building Flood Model and Flooding Maps..................... 30
1. Selecting a suitable flood model for the research ..................................30
1.1. Build criteria of selection .................................................................................. 30
1.2. Analysis and selection the most suitable flood model .................................... 30
2. Interpolating roads elevations .................................................................31
3. Buildings height interpolation .................................................................34
4. Classifying the rivers causing flood.........................................................36
5. Building the flooding model .....................................................................36
6. Results of flood model and flooding maps..............................................40
6.1. Digital Terrain model and drainage system ................................................... 40
6.2. Flooded area maps............................................................................................. 42
6.3. Flooding depth modeling for the research ...................................................... 45
6.3.1 Method................................................................................................................. 45
6.3.2 Result and discussion .......................................................................................... 46
6.4. Flooding duration modeling for the research ................................................. 52
6.4.1 Method................................................................................................................. 53
6.4.2 Result and discussion .......................................................................................... 53
Table of Content
Tran Thong Nhat viii
6.5. Flooding frequency modeling for the research............................................... 60
6.5.1 Method................................................................................................................. 60
6.5.2 Result and discussion .......................................................................................... 61
Chapter 5. Flood Risks of Houses.................................................... 68
1. Introduction...............................................................................................68
2. Method .......................................................................................................69
3. Result and discussion................................................................................71
3.1. Affected areas..................................................................................................... 71
3.2. Depth grades ...................................................................................................... 73
3.3. Duration grades ................................................................................................. 77
3.4. Frequency grades............................................................................................... 80
Chapter 6. Flood Risk of Population ................................................ 85
1. Introduction...............................................................................................85
2. Method .......................................................................................................86
3. Results and discussion ..............................................................................87
3.1. Affected population ........................................................................................... 87
3.2. Depth grades ...................................................................................................... 89
3.3. Duration grades ................................................................................................. 92
3.4. Frequency grades............................................................................................... 97
Chapter 7. Flood Risk of Land Use................................................. 102
1. Introduction.............................................................................................102
2. Method .....................................................................................................103
3. Results and discussion ............................................................................105
3.1. Affected areas................................................................................................... 105
3.2. Depth grades .................................................................................................... 113
3.3. Duration grades ............................................................................................... 117
3.4. Frequency grades............................................................................................. 121
Table of Content
Tran Thong Nhat ix
Chapter 8. Conclusion and Recommendation............................... 127
1. Conclusions..............................................................................................127
1.1. Flood model and flooded areas in Ho Chi Minh City .................................. 127
1.2. Flood risk of houses ......................................................................................... 129
1.3. Flood risk of population.................................................................................. 130
1.4. Flood risk of land use ...................................................................................... 132
2. Recommendations ...................................................................................134
2.1. Authorities and decision makers.................................................................... 134
2.2. Planner.............................................................................................................. 135
2.3. Outlooks and further researches.................................................................... 136
Appendixes. ........................................................................................ 138
Appendix A.1: Tide peaks and their duration (hour) at levels 1.50m and 1.85m…. ....................................................................................... 138
Appendix A.2: Tide peaks and their frequency (time/month) at levels 1.50m and 1.85m................................................................................. 139
Appendix B.1: Land use types at flooding depth grades in urban zones of Ho Chi Minh City ................................................................. 140
Appendix B. 2: Land Use Types in Flooding Duration grades in urban zones of Ho Chi Minh City....................................................... 142
Appendix B. 3: Land use types at flooding frequency grades in urban zones of Ho Chi Minh City....................................................... 144
Appendix C: Land use classes transferred from UST ..................... 146
Literatures and References ............................................................... 150
List of Figures
Tran Thong Nhat x
List of Figures
Fig. 1. 1: Methodology flowchart .........................................................................10
Fig. 4. 1: Flow chart of the interpolation procedure .............................................32
Fig. 4. 2: Principle of flooded area model.............................................................38
Fig. 4. 3: Digital Terrain Model and drainage system in Ho Chi Minh City........41
Fig. 4. 4: Flooded area map at the tide levels in urban zones Ho Chi Minh City.42
Fig. 4. 5: Flooded areas at the tide levels in urban zones of Ho Chi Minh City...44
Fig. 4. 6: Flooded areas of flooding depth grades at the tide levels in Ho Chi
Minh City ..............................................................................................................48
Fig. 4. 7: Flooding depth maps at 1.50m tide level in urban zones Ho Chi Minh
City ........................................................................................................................49
Fig. 4. 8: Flooding depth maps at 1.85m tide level in urban zones Ho Chi Minh
City ........................................................................................................................50
Fig. 4. 9: Flooded areas of flooding depth grades at the tide levels in urban zones
of Ho Chi Minh City .............................................................................................52
Fig. 4. 10: Flooded areas of flooding duration grades at the tide levels in Ho Chi
Minh City ..............................................................................................................55
Fig. 4. 11: Flooded areas of flooding duration grades at the tide levels in urban
zones of Ho Chi Minh City ...................................................................................57
Fig. 4. 12: Flooding duration maps at 1.50m tide level in urban zones of Ho Chi
Minh City ..............................................................................................................58
Fig. 4. 13: Flooding duration maps at 1.85m tide level in urban zones of Ho Chi
Minh City ..............................................................................................................59
Fig. 4. 14: Flooded areas of flooding frequency grades at the tide levels in Ho
Chi Minh City........................................................................................................63
Fig. 4. 15: Flooded areas of flooding frequency grades at the tide levels in urban
zones of Ho Chi Minh City ...................................................................................65
List of Figures
Tran Thong Nhat xi
Fig. 4. 16: Flooding frequency maps at 1.50m tide level in urban zones of Ho Chi
Minh City ..............................................................................................................66
Fig. 4. 17: Flooding frequency maps at 1.85m tide level in urban zones of Ho Chi
Minh City ..............................................................................................................67
Fig. 5. 1: Affected houses map at the tide levels in Ho Chi Minh City................72
Fig. 5. 2: Affected house areas at the tide levels in urban zones of Ho Chi Minh
City ........................................................................................................................73
Fig. 5. 3: Affected house areas of flooding depth grades at the tide levels in Ho
Chi Minh City........................................................................................................74
Fig. 5. 4: Affected house areas of flooding depth grades at the tide levels in
urban zones of Ho Chi Minh City.........................................................................76
Fig. 5. 5: Affected house areas of flooding duration grades at the tide levels in
Ho Chi Minh City..................................................................................................78
Fig. 5. 6: Affected house areas of flooding duration grades at the tide levels in
urban zones of Ho Chi Minh City.........................................................................80
Fig. 5. 7: Affected house areas of flooding frequency grades at the tide levels in
Ho Chi Minh City..................................................................................................82
Fig. 5. 8: Affected house areas of flooding frequency grades at the tide levels in
urban zones of Ho Chi Minh City.........................................................................84
Fig. 6. 1: Affected inhabitant at the tide levels in urban zones of Ho Chi Minh
City ........................................................................................................................88
Fig. 6. 2: Affected inhabitants so flooding depth grades at the tide levels in Ho
Chi Minh City........................................................................................................90
Fig. 6. 3: Affected inhabitants of flooding depth grades at the tide levels in urban
zones of Ho Chi Minh City ...................................................................................92
Fig. 6. 4: Affected inhabitants of flooding duration grades at the tide levels in Ho
Chi Minh City........................................................................................................94
List of Figures
Tran Thong Nhat xii
Fig. 6. 5: Affected inhabitants of flooding duration grades at the tide levels in
urban zones of Ho Chi Minh City.........................................................................96
Fig. 6. 6: Affected inhabitants of flooding frequency grades at the tide levels in
Ho Chi Minh City..................................................................................................98
Fig. 6. 7: Affected inhabitants of flooding frequency grades at the tide levels in
urban zones of Ho Chi Minh City.......................................................................100
Fig. 7. 1: Flooded land use maps at 1.50m tide levels in Ho Chi Minh City .....106
Fig. 7. 2: Flooded land use maps at 1.85m tide levels in Ho Chi Minh City .....107
Fig. 7. 3: Areas of affected land use types at the tide levels in Ho Chi Minh City
.............................................................................................................................109
Fig. 7. 4: Flooded areas of land use types at the tide levels in urban zones Ho Chi
Minh City ............................................................................................................111
Fig. 7. 5: Flooded areas of built up types at the tide levels in urban zones of Ho
Chi Minh City......................................................................................................113
Fig. 7. 6: Flooded areas of built up types at the tide levels in flooding depth
grades in Ho Chi Minh City ................................................................................116
Fig. 7. 7: Flooded areas of built up types at tide levels in flooding duration
grades in Ho Chi Minh City ................................................................................120
Fig. 7. 8: Flooded areas of built up types at tide levels in flooding frequency
grades in Ho Chi Minh City ................................................................................125

List of Tables
Tran Thong Nhat xiii
List of Tables
Tab. 2. 1: Increasing the number of heavy rains over time serial.........................19
Tab. 2. 2: Sea level rises SLR (cm) compared with SL of period 1980 - 1999....20
Tab. 3. 1: The summary of data to use in the research .........................................25
Tab. 3. 2: Sea level rising SLR (cm) relate to SL of period 1980 - 1999 in Ho Chi
Minh City ..............................................................................................................26
Tab. 3. 3: Interval average tide level increment (cm) at the forecast times in Ho
Chi Minh City........................................................................................................26
Tab. 3. 4: Tide height and frequency in 2030 with daily tide level peaks............28
Tab. 3. 5: Frequencies of daily sea level peaks over 1.5m in three emission
scenarios and average times per month at year 2030............................................28
Tab. 4. 1: Flooded areas at the tide levels in urban zones of Ho Chi Minh City..43
Tab. 4. 2: Flooded areas of flooding depth grades at the tide levels in Ho Chi
Minh City ..............................................................................................................47
Tab. 4. 3: Flooded areas of flooding depth grades at the tide levels in urban zones
of Ho Chi Minh City .............................................................................................51
Tab. 4. 4: Flooded areas of flooding duration grades at the tide levels in Ho Chi
Minh City ..............................................................................................................54
Tab. 4. 5: Flooded areas of flooding duration grades at the tide levels in urban
zones of Ho Chi Minh City ...................................................................................56
Tab. 4. 6: Flooded areas of flooding frequency grades at the tide levels in Ho Chi
Minh City ..............................................................................................................62
Tab. 4. 7: Flooded areas of flooding frequency grades at the tide levels in urban
zones of Ho Chi Minh City ...................................................................................64
Tab. 5. 1: Affected house areas at the tide levels in urban zones of Ho Chi Minh
City ........................................................................................................................71
List of Tables
Tran Thong Nhat xiv
Tab. 5. 2: Affected house areas of flooding depth grades at the tide levels in Ho
Chi Minh City........................................................................................................74
Tab. 5. 3: Affected house areas of flooding depth grades at the tide levels in
urban zones of Ho Chi Minh City.........................................................................75
Tab. 5. 4: Affected house areas of flooding duration grades at the tide levels in
Ho Chi Minh City..................................................................................................77
Tab. 5. 5: Affected house areas of flooding duration grades at the tide levels in
urban zones of Ho Chi Minh City.........................................................................79
Tab. 5. 6: Affected house areas of flooding frequency grades at the tide levels in
Ho Chi Minh City..................................................................................................81
Tab. 5. 7: Affected house areas of flooding frequency grades at the tide levels in
urban zones of Ho Chi Minh City.........................................................................83
Tab. 6. 1: Affected inhabitant at the tide levels in urban zones of Ho Chi Minh
City ........................................................................................................................87
Tab. 6. 2: Affected inhabitants of flooding depth grades at the tide levels in Ho
Chi Minh City........................................................................................................89
Tab. 6. 3: Affected inhabitants of flooding depth grades at the tide levels in urban
zones of Ho Chi Minh City ...................................................................................91
Tab. 6. 4: Affected inhabitants of flooding duration grades at tide levels in Ho
Chi Minh City........................................................................................................93
Tab. 6. 5: Affected inhabitants of flooding duration grades at the tide levels in
urban zones of Ho Chi Minh City.........................................................................95
Tab. 6. 6: Affected inhabitants of flooding frequency grades at tide levels in Ho
Chi Minh City........................................................................................................97
Tab. 6. 7: Affected inhabitants of flooding frequency grades at the tide levels in
urban zones of Ho Chi Minh City.........................................................................99
Tab. 7. 1: Land use types in the research ............................................................105
Tab. 7. 2: Areas of affected land use types at the tide levels in Ho Chi Minh City .
List of Tables
Tran Thong Nhat xv
............................................................................................................................ 108
Tab. 7. 3: Flooded areas of land use types at the tide levels in urban zones of Ho
Chi Minh City......................................................................................................110
Tab. 7. 4: Flooded areas of built up types at the tide levels in flooding depth
grades in Ho Chi Minh City ................................................................................115
Tab. 7. 5: Flooded areas of built up types at the tide levels in flooding duration
grades in Ho Chi Minh City ................................................................................118
Tab. 7. 6: Flooded areas of built up types at the tide levels in flooding frequency
grades in Ho Chi Minh City ................................................................................124
Abstract
Tran Thong Nhat xvi
Improvement of Flood Risk Assessment under Climate
Change in Ho Chi Minh City with GIS Applications
Abstract
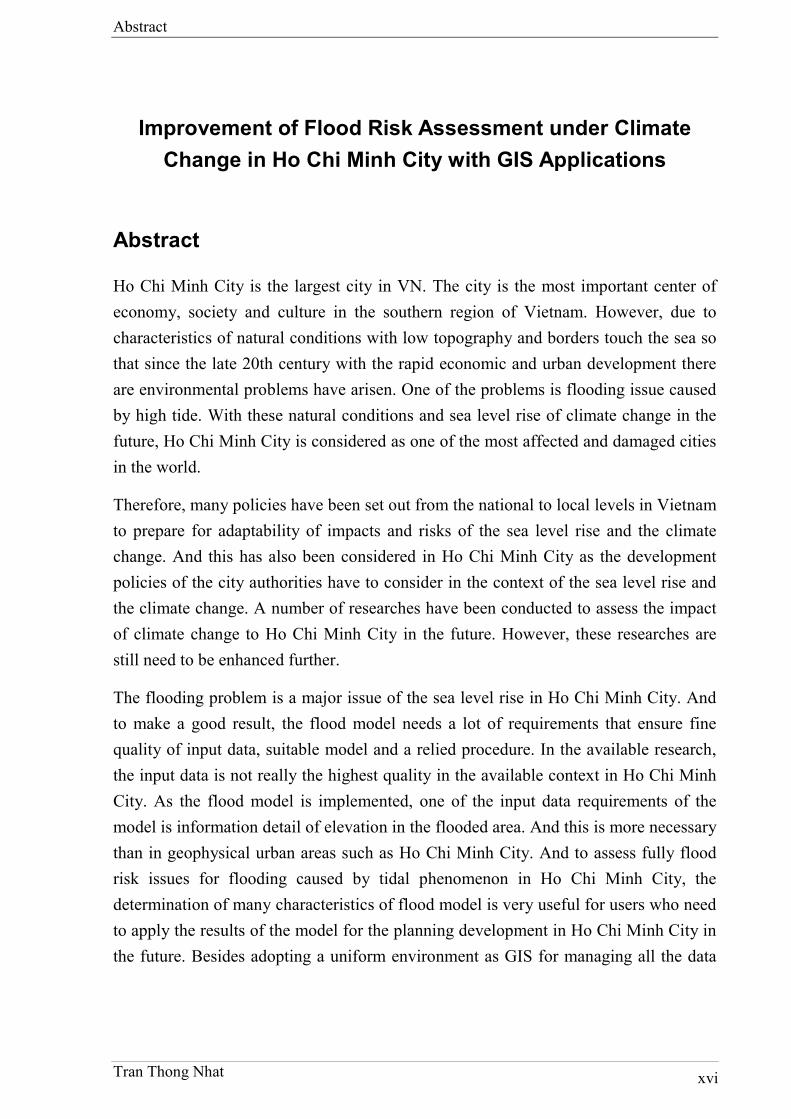
Ho Chi Minh City is the largest city in VN. The city is the most important center of
economy, society and culture in the southern region of Vietnam. However, due to
characteristics of natural conditions with low topography and borders touch the sea so
that since the late 20th century with the rapid economic and urban development there
are environmental problems have arisen. One of the problems is flooding issue caused
by high tide. With these natural conditions and sea level rise of climate change in the
future, Ho Chi Minh City is considered as one of the most affected and damaged cities
in the world.
Therefore, many policies have been set out from the national to local levels in Vietnam
to prepare for adaptability of impacts and risks of the sea level rise and the climate
change. And this has also been considered in Ho Chi Minh City as the development
policies of the city authorities have to consider in the context of the sea level rise and
the climate change. A number of researches have been conducted to assess the impact
of climate change to Ho Chi Minh City in the future. However, these researches are
still need to be enhanced further.
The flooding problem is a major issue of the sea level rise in Ho Chi Minh City. And
to make a good result, the flood model needs a lot of requirements that ensure fine
quality of input data, suitable model and a relied procedure. In the available research,
the input data is not really the highest quality in the available context in Ho Chi Minh
City. As the flood model is implemented, one of the input data requirements of the
model is information detail of elevation in the flooded area. And this is more necessary
than in geophysical urban areas such as Ho Chi Minh City. And to assess fully flood
risk issues for flooding caused by tidal phenomenon in Ho Chi Minh City, the
determination of many characteristics of flood model is very useful for users who need
to apply the results of the model for the planning development in Ho Chi Minh City in
the future. Besides adopting a uniform environment as GIS for managing all the data
Abstract
Tran Thong Nhat xvii
of flooding problem and making conditions for the development of decision support
systems is very necessary for flood management in the future.
The research has been carried out and its results have been generated on the flood risk
assessment associated context of the sea level rise due to climate change with high
emissions scenario A1FI in 2030 for the current houses, the population and the land
use types. The results have shown a lot of the areas where are inundated in the future
with the increasing flooding duration, depth and frequency even though they are not
flooded at the current because there are some protective structures. This will be helpful
for suggesting a forecast of the development direction to decision makers in Ho Chi
Minh City for next time period.
And the last part is the proposal for decision and policy makers, authorities and
planners as well. Moreover, the results of this research can be used as the references
and the foundations for further researches and so that the problems that Ho Chi Minh
City may be encountered due to flood risk caused by climate change to the economic
and social aspects of the development in Ho Chi Minh City will encounter. And the
problem of adaptation to climate change will be more completed and more thoroughly
so that it is to minimize the damage of climate change for the city.
Keywords: GIS, Sea Level Rise, Flood Risk, Climate Change, Ho Chi Minh City.
Abstrakt
Tran Thong Nhat xviii
Entwicklung des Hochwasserrisikos beeinflusst durch den
Klimawandel in Ho Chi Minh Stadt mittels GIS
Abstrakt
Ho Chi Minh Stadt ist die größte Stadt in Vietnam. Sie ist das wichtigste Zentrum für
Wirtschaft, Gesellschaft und Kultur in der südlichen Region Vietnams. Durch den
rasanten wirtschaftlichen Aufschwung und die damit einhergehende Stadtentwicklung
gibt es seit dem Ende des 20. Jahrhunderts Umweltprobleme. Dies wird durch die
natürlichen Bedingungen, eine wenig ausgeprägte Topographie und die Nähe zum
Meer begünstigt. Überschwemmungen durch Hochwasser stellen ein großes Problem
dar. Mit diesen natürlichen Bedingungen und dem prognostizierten
Meeresspiegelanstieg durch den Klimawandel ist Ho Chi Minh Stadt zukünftig als
eine der am stärksten betroffenen und geschädigten Städte der Welt zu betrachten.
Daher sind viele Maßnahmen auf nationaler und lokaler Ebene in Vietnam entwickelt
worden, um sich den Auswirkungen anzupassen, und den Risiken des Anstieges des
Meeresspiegels und des Klimawandels zu begegnen. In Ho Chi Minh Stadt muss das
aufgrund der oben genannten Bedingungen besonders betrachtet werden. Eine Reihe
von Untersuchungen wurden durchgeführt, um die Auswirkungen des Klimawandels
in Ho Chi Minh Stadt in der Zukunft zu beurteilen. Allerdings müssen diese
Untersuchungen noch weiter entwickelt und verbessert werden.
Das Überschwemmungsproblem durch den Anstieg des Meeresspiegels, ist ein
wichtiges Thema in Ho Chi Minh Stadt. Um ein gutes Ergebnis zu bekommen, müssen
die Qualität der Eingangsdaten sowie das Modell gut sein. In der derzeitigen
Forschung, haben die Eingangsdaten nicht die höchste Qualität im Kontext von Ho
Chi Minh Stadt. Als das Hochwassermodel implementiert wurde, war eine der
Eingangsdatenanforderung des Modells, die Information der Höhe der
Überschwemmung. Dies wird in städtischen Gebieten noch wichtiger aufgrund der
geophysikalischen Gegebenheiten von Ho Chi Minh Stadt.
Für eine umfassende Beurteilung der Hochwasserrisikofragen von
Überschwemmungen beeinflusst zusätzlich durch die Gezeitenphänome in Ho Chi
Minh Stadt , ist die Bestimmung vieler Eigenschaften für die Ergebnisse des

Abstrakt
Tran Thong Nhat xix
Hochwassermodells sehr nützlich für Anwender, die die Ergebnisse des Modells für
die Planung der Entwicklung in Ho Chi Minh Stadt in der Zukunft anwenden werden.
Hierfür wäre die Einführung einer einheitlichen Umgebung im GIS zur Verwaltung
aller Daten von Überschwemmungsproblemen und Herstellungsbedingungen für die
Entwicklung von Entscheidungsunterstützungssystemen in der Zukunft für das
Hochwassermanagement sehr wichtig.
Vorliegende Arbeit hat Ergebnisse in Bezug auf Hochwasserrisiko basierend auf
dem Emissionsszenario A1FI im Jahr 2030 , verbunden mit dem darin prognostizierten
Anstieg des Meeresspiegels, für die aktuelln Bebauung, Bevölkerung und
Landnutzungstypen generiert. Die Ergebnisse zeigen eine Menge Bereiche, in denen in
Zukunft mit zunehmender Überschwemmungsdauer, -tiefe und -frequenz gerechnet
werden muss, auch wenn sie aktuell nicht überflutet werden, da sie einige noch
Schutzstrukturen besitzen. Dies wird hilfreich für Prognosen der weiteren Entwicklung
für Entscheidungsträger in Ho Chi Minh Stadt in der nächste Zeit sein.
Zusätzlich bietet der letzte Teil der Arbeit einen Vorschlag für die
Entscheidungsfindung der Entscheidungsträger, Behörden und Planer. Darüber hinaus
können Ergebnisse dieser Forschung, sowie Referenzen und Grundlagen, für weitere
Forschungen verwendet werden, so dass den Problemen in Ho-Chi-Minh-Stadt
aufgrund des Hochwasserrisikos, beeinflusst durch Klimawandel und die damit
verbundenen wirtschaftlichen und sozialen Aspekte, begegnet werden kann. Dadurch
kann das Problem der Anpassung an den Klimawandel angegangen weden, so dass der
Schaden des Klimawandels für die Stadt minimiert werden kann.
Stichwort: GIS, Anstieg des Meeresspiegels, Hochwasserrisiko, Klimawandel, Ho
Chi Minh Stadt, Vietnam
Chapter 1. Introduction
Tran Thong Nhat 1
Chapter 1. Introduction
Climate change is a global problem and human has to face. Climate change has also
been performing that its impacts are very serious to Viet Nam. All reports that have
researched on climate change list Viet Nam as a greatly affected countries of climate
change because of its topography and geography (WB, 2007). The most terrible issue
is rising of sea level.
The impacts of climate change affect the areas located along the coast stretching from
north to south of Vietnam. One of the most important city and it severely affected that
is Ho Chi Minh City (HCMC).
With the high concentration of population and demands for housing, many areas in Ho
Chi Minh City have been excessive urbanization and land use changes dramatically
not only in the central area but also in the surrounding rural areas. This has created
problems about environment. One problem is the phenomenon that occurs frequently
flooded over the city.
Research, Improvement of Flood Risk Assessment under Climate Change in Ho Chi
Minh City with GIS Applications, is seen as a part of a research project, Megacity City
Research Project. Ho Chi Minh - Integrative Urban and Environmental Planning
Adaptation to Climate Change Framework, conducted by the Brandenburg University
of Technology Cottbus - Senftenberg. The project is a part of the research program
"Sustainable Development of the Megacities of Tomorrow - Climate and Energy
Efficient Structures in Urban Growth Centres", has been sponsored by the German
government, Ministry of Education and Research (BMBF).
1. Statement of problem
According to official web site of Ho Chi Minh City People’s Committee (HCMCPC,
2010), Ho Chi Minh City is “located from 10°10’-10°38’ north and 106°2’-106°54’
east. The city center is 50km from the East Sea in a straight line. Ho Chi Minh City
belongs to a transitional region between the southeastern and Mekong Delta regions.
The general topography is that Ho Chi Minh City terrain gets lower from north to
Chapter 1. Introduction
Tran Thong Nhat 2
south and from east to west. There are three types of terrain. The high terrain lies in
the northern-northeastern area and part of the northwestern area encompassing
northern Cu Chi, northeastern Thu Duc and District 9. This is the bending terrain with
average height of 10-25 meters. Long Binh Hill in District 9 is the highest at 32
meters. The depression terrain lies in the southern-southwestern and southeastern part
encompassing district 9, district 8, district 7, Binh Chanh rural district, Nha Be rural
district and Can Gio rural district. The area’s height is in the range of 0.5 to 2 meters.
The medium-height terrain lies in the middle of the city, encompassing most old
residential areas, part of districts 2 and Thu Duc district, and the whole of district 12
and Hoc Mon rural district. The area’s height is 5-10 meters” and 72.3% of the whole
urban area of Ho Chi Minh City is below 2 m mean sea level (Storch, Downes, Thinh,
Thamm, Phi, Thuc, Thuan, Emberger, Goedecke, Welsch and Schmidt, 2009).
About hydrology, Ho Chi Minh City is located in the downstream of Dong Nai - Sai
Gon river system and there are two large water storage reservoirs including Dau Tieng
reservoir connected to the Saigon River and Tri An reservoir connected to the Dong
Nai river. Ho Chi Minh City has a network of rivers and canals are very diverse. In
addition to the main rivers, the city also has an intricate system of canals such as Lang
The, Bau Nong, Rach Tra, Ben Cat, An Ha, Tham Luong, Cau Bong, Nhieu Loc-Thi
Nghe, Ben Nghe, Lo Gom, Kenh Te, Tau Hu, Kenh Doi. Sometimes the rivers and the
canals serve in irrigation, but are influenced by the fluctuations of regime of semi-
diurnal tide from the South China Sea. Tidal penetration in land has caused adverse
impacts on agricultural productivity and limits the water drainage in urban areas.
Average rainfall in the city reached 1.949 mm/year. Each year, average number of rain
days in the city is 159. The rain days are most concentrated for the months from May
to November, accounting for about 90%, especially in the two months June and
September. On whole extent of the city, rainfall is unevenly distributed and tends to
increase southwest – northeast axis. The core districts and northern districts have a
higher precipitation that the other areas.
Since the elements of topography, hydrology and meteorology, it is to see that Ho Chi
Minh City from natural conditions is very sensitive to variability and change of
climate. Climate change, particularly changes in precipitation, storm intensity and sea
level rising will affect Ho Chi Minh City. They are causes of flooding and threaten not
only the low land areas, but also extend to other areas.
Chapter 1. Introduction
Tran Thong Nhat 3
Besides natural factors, human and social factors are also an issue to regard. The
causes of serious problem of urban flooding are the ongoing rapid urbanization
process, which has changed the land-use patterns. Ho Chi Minh City has the largest
population in Vietnam and its urbanization rate is very high. With the demands of
economic development and housing for residents in urbanization progress combining
with the weakness in construction control and management the city has loss the green
space areas, water bodies and agricultural land that are converted to impervious
surfaces rapidly (JICA, 2004; Van, 2008; Viet, 2008). Natural streams, channels,
lakes, wetlands and vegetation structures that can maintain the urban water balance
have been replaced by impermeable surfaces causing increased surface run-off
flow. With state of land use change inappropriately consequently, problems of urban
environment have appeared and one of which is a phenomenon of urban flooding.
According to experts, the phenomenon of flooding in Ho Chi Minh City began
appearing in the early the 90s of 20th century (Lai, 2005). At the early time, the
phenomenon appeared in low frequency and in small areas. However, day to day level
of flooding has increased rapidly along with the urban development in Ho Chi Minh
City (JICA, 2004; Lai, 2005; Viet, 2008). Even if at the current, the flooding is
appearing more and more serious as it is heavy rain and tide and flooding come every
month of year (Nhan, 2006; Phi, 2007). Under this situation, the city government has
tried to eliminate the flooded sites drastically but the situation has not improved since
the old flooded sites disappeared, the new ones come. Therefore, urban flooding in Ho
Chi Minh City is already doing a lot of suffering for regions when rain and high tide
appear. Urban flooding has made sustainable development plan of Ho Chi Minh City
that has been facing many challenges at the current and the future (SCFC, 2010; WB,
2007).
The urban flooding in Ho Chi Minh City can be divided into two groups based on
supplying water source to flooding phenomenon. The first is raining and the second is
due to difference between water levels of the system of canals and inland elevation in
Ho Chi Minh City. In the second group includes the phenomenon of tides, flooding
caused the flood discharge in the lakes on the Sai Gon and Dong Nai River upstream
making the water level rising in the rivers and canals. The flooding caused by rainfall
mainly concentrates for six-month of rainy season from May to November. The
flooding caused by the high tide is most serious because it occurs with high frequency

Chapter 1. Introduction
Tran Thong Nhat 4
in all months. Moreover, regime of semi-diurnal tide in Ho Chi Minh City has caused
flooding tide occurring two times per day. For the flooding caused the discharge from
the reservoirs, this is not often and it only occurs in heavy rains. But in the fact that the
discharge is often not the main cause of the flooding is an enhanced factor for the
severity of flooding. Due to the supplying of water resources as the above analysis, the
flooding of the first group is called rainfall flooding and the flooding of the second
group is called tidal flooding.
In addition to the natural factors cause Ho Chi Minh City became a flood-prone areas
due to low land, tide is located in the geography when there are often monsoon rains,
the flooding in Ho Chi Minh City is contributed by human activities. Because the
natural factors are fixed and existed for long time, but the phenomenon of flooding
occurs and becomes severe for around the last two decades. The human causes are
factors decide to the nature and extent of the current flooding. In the human factors,
the direct factor causing the flooding in Ho Chi Minh City is urbanization that has
changed the land-use patterns. Natural streams, channels, lakes, wetlands had been
occupied and fill up to be residential areas (Phi, 2009). Consequently, infiltration
ability has been reduced a lot and water when it is rain and discharge from reservoirs
in river upstream comes would not have places to store for balance of water. Besides,
vegetation structures that can maintain the urban water balance have been replaced by
impermeable surfaces so that land has been reduced infiltration ability and it causes
increasing surface run-off flow. Another factor is the drainage system of Ho Chi Minh
City has been very old, obsolete and damaged so that the drainage system has
overloaded when it is rain (Phi, 2007; Thang, 2010; Trung, 2009). As a result, when
rainfall comes surface flow will not be able to escape for short time and the flooding
appears. The extent of the flooding is more severe if the rain is heavy and continues
for long time.
Additionally, Ho Chi Minh City is located on a weak stratum and a low relief. That the
stratum under this city is very feeble and the rapid urban growth builds resident areas
where construct many high buildings and blocks. In the new residential areas, demands
of living water are inquired and increased day by day but infrastructure of living water
supply can not solve. As a result, the households in the areas have to conduct
extraction of groundwater for their needs uncontrollably (Nga, 2006). Combination
between the extraction of groundwater and the increasing of impermeable surface has
Chapter 1. Introduction
Tran Thong Nhat 5
made water table has reduced a much more so that land subsidence has appeared
(Dinh, Trung, Sarti, Dransfeld and Hanssen, 2008; Nga, 2006; Trung & Dinh, 2009).
After for a period of time, the areas is lower and lower and as a result flooding
happens obviously and frequently as flood tide.
Recent studies on the urban flooding problem in Ho Chi Minh City have proven that
local impacts of climate change and rising tide levels are coming to Ho Chi Minh City.
Especially sea level rising has affected seriously. According to Ho Long Phi (2007),
rainfall events which have high precipitation are increasing dramatically for some last
recent decades (Table 2.1). In addition a report delivered by Vietnamese Ministry of
Natural Resources and Environment (MONRE) in 2009 estimates that sea level rise in
the area of Ho Chi Minh City is in the situation of alarming. With average emission
scenario by 2050 sea level rising may be up to 33cm and be 75cm at the end of 21st
century (Table 2. 2).
Thus the problem of urban flooding in Ho Chi Minh City is related to two following
issues:
Land use change is not suitable having caused more and more serious
flooding in Ho Chi Minh City. This situation has affected the lives of
people and the urban development in Ho Chi Minh City.
Additionally, local climate change and sea level rising are coming and
happening more clearly so that the flooding situation will be worse in the
future.
With the urban development and infrastructure as stated above if Ho Chi Minh City
authorities do not have any improvement on management and planning, flooding areas
are more serious and deeper from consequences of climate change impacts. Moreover,
not only will many flooding areas appear and spread in the near future but also flood
risks about environment to habitant living in the areas will issue if authorities do not
have any strategies for adaptation and mitigation.
With the problem of urban flooding in Ho Chi Minh City, this research would like to
contribute on understanding and clarifying the risks and effects and damage of
flooding to current houses, people, and urban systems in the future with sea level rise.
Chapter 1. Introduction
Tran Thong Nhat 6
2. Aims and objectives
2.1. Aims
Aims are to show the general targets that researcher yearn toward after the research
completes the entire study. In this study there are two goals that are expected to
progress:
To improve the accuracy of results of flood model with optimizing the
digital terrain model and determining more flooding characteristics
To identify and expose the current and future risks of urban flooding to the
current houses, population and land use
2.2. Objectives
To achieve the aims, implementation procedure will need to achieve the specific
objectives of the various stages towards completion of the aims that had been set. In
that sense the objectives of the research will be:
To improve the digital terrain model for the flood model
To optimize the flooding characteristics for the flood model
To produce hazard maps of urban flooding to current houses, population
and land use
To exposure and evaluate future flood risks to current houses, population
land use
To announce and warn to decision makers, planners on a suitable land use
planning integrated climate change scenarios
To give helpful information to people where are safe areas for resettlement
under conditions of climate change in the future
3. Significance of the study
Ho Chi Minh City is one of the most major and important center of economic, cultural
and education of Vietnam. And the city has the largest population of Vietnam, more

Chapter 1. Introduction
Tran Thong Nhat 7
than 7 million of people in 2009 (HCMCPC, 2011; Wikipedia, 2013). Ho Chi Minh
City is one of the city has a great influence to the economic development for its
country. Ho Chi Minh City located in the North of Mekong Delta, and the down
stream of Dong Nai river system. This is also a transition area between the
southeastern and southwestern regions. This is a traffic hub linking the provinces in
the region and the international gateway. Based on that favorable strategic position, the
city has been developing rapidly; that can say Ho Chi Minh City is the fastest in
Vietnam of all aspects.
In the progress of development and international integration, Ho Chi Minh City has
always maintained a central role in economic, financial, trade and services of the
country and is the kernel of the southern key region on economy that is one of three
largest key economic regions. The city is also a driving force for the social economic
development in the southern areas and whole the country for the national strategy of
industrialization and modernization. Ho Chi Minh City is keeping the leading role of
the economy in Vietnam. The city accounts for 0.6% area and 8.34% populations in
Vietnam but accounts for 20.2% GDP in 2009 (HCMCSO, 2011; Wikipedia, 2013).
Because the city is one of the most important centers for the economic development in
the southern region and Vietnam, the facing and suffering with urban flooding that
occurs regularly and continuously severe have been enforced Ho Chi Minh City in a
very difficult situation to ensure the city being able to continue to maintain strong and
sustainable growth in the future. Therefore, researches solving environmental
problems in the city to make recommendations to decision makers and planners who
will deliver policies and spatial planning appropriately to help the city continue to
develop steadily will have very important meaning in the moment and the future.
This study is an applied research that applies a new method, geographic information
system (GIS), for studying and assessing under influences and impacts of urban
flooding in Ho Chi Minh City. It is important and the most significant of this research
is the its results will contribute a scientific basis for planning and policy making of the
managers who make policies that are appropriate for sustainable development in the
future under the impacts of climate change becoming more severe. Additionally, the
research will also contribute to flood risk management in the city with the GIS
technology.
Chapter 1. Introduction
Tran Thong Nhat 8
4. Methodology
In order to assess impact, risk and vulnerability of flooding to Ho Chi Minh
metropolitan areas needs digital flooding maps at the time points from the current to
future when climate and land use are changed. A flood model has to be evaluated and
selected and then it is used to produce digital flooding maps from input data such as
elevation, land use, soil, drainage, hydrology and climate data. After the chosen flood
model is completed it will be applied to two scenarios: situation of flooding for current
urban system and climate conditions, situation of flooding for current urban system
and future climate conditions that are impacted by climate change.
In order to choose a suitable flood model easily needs to assess existing situation of
flooding in the city of Ho Chi Minh City, the study's requirements and the
characteristics of existing flood models. Flooding phenomenon in Ho Chi Minh City
can be divided into two types based on water supplying sources caused flooding. They
include the first source provided by rainfall or precipitation and the other one provided
by the canals due to difference of water levels between water level in canals and
ground elevation, called the tide level.
With the first source, the flooding phenomenon is formed as following process. When
it is heavy rain, surface flow will occur if rainy water could not infiltrate into soil in
rained areas. The surface flow then reaches to drainage network system if it is
existential. If the drainage network system can not flow out rivers and canals in the
area the rained areas will be flooded locally. After that time the flooded areas will
spread into around places. The spreading speed and areas depend on precipitation,
rainfall intensity, areas elevation, the drainage network system, land use/ land cover
and soil types. The precipitation is an item of climate therefore climate change will
effect direct to potential flooded areas in the future.
Differently, the flooding in the situation of tide is different source to supply water and
drainage factor. In this case the catch basins and the manholes or the rivers and the
canals are the water providers. And then spreading procedures of the water extends
over ground surface to around areas. The drainage factor depends on hydrologic
system, absorption and infiltration of soil in the area. In reality, the probability of the
two reasons occur together is able and consequences of flooding is more serious.
Chapter 1. Introduction
Tran Thong Nhat 9
Understanding the causes of flooding in Ho Chi Minh City will help a lot for the
selection of flood model consistent with context of the Ho Chi Minh City. At the
current there are many flood models on over the world, in general they have been
integrated on GIS environment. Therefore, choosing the most appropriate flood model
with the flood situation in Ho Chi Minh City is an important step needing to
determine. In order to does this step, the first task has to classify the types of flood
model nowadays on over the world, then build a set of criteria to select a model that is
the most appropriate model with context of Ho Chi Minh City. After that determining
the most appropriate model for Ho Chi Minh City done, the model will be used to
identify flooded areas and flooding maps. The flooding maps combined with the
information of the urban system will expose risk degree at the flooding areas in Ho
Chi Minh City. Based on exposure of the degree, some predictions, warnings and
suggestions will be sent to policy, decision makers and planners. It is helpful and
useful to get up the awareness around policies of adaptation and reducing living costs
as the scenarios that are able to happen with the conditions of climate change.
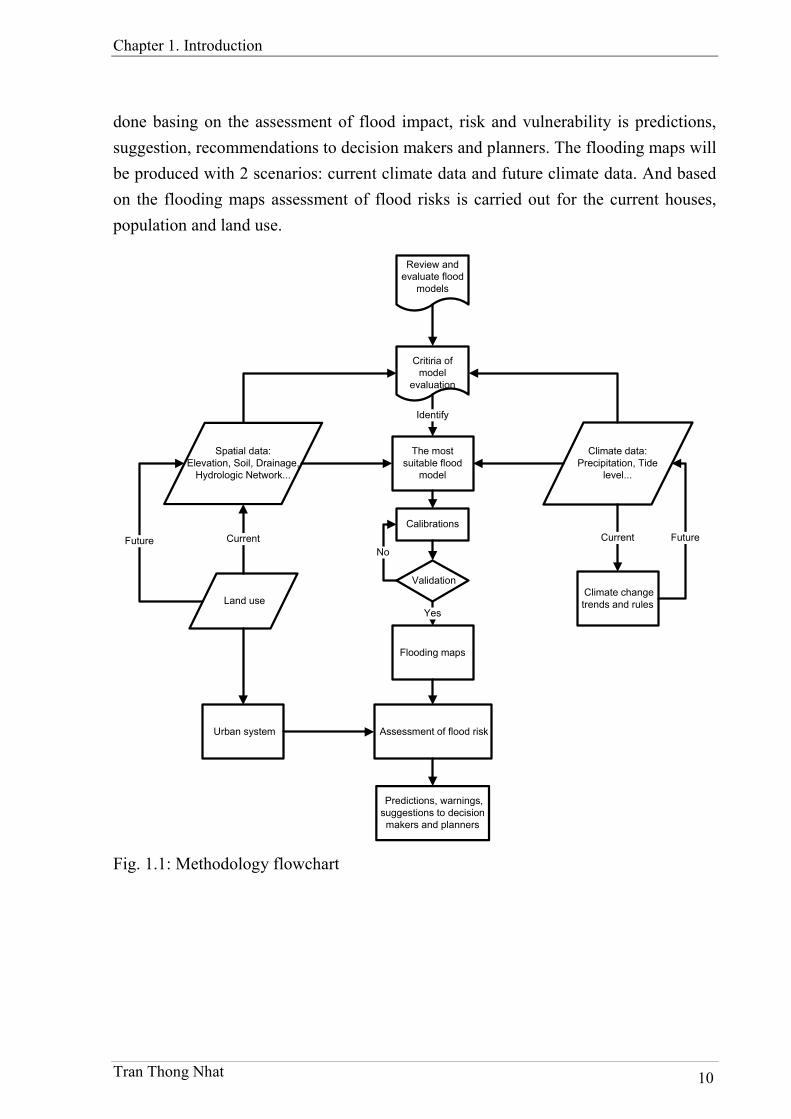
From the analysis of the above factors, a process of the research is described in the
flowchart as figure 1. The research process will begin with a review and evaluation
indoor about current flood models on over the world. Then the second step will build a
set of evaluation criteria for choice the most appropriate flood model in context of Ho
Chi Minh City. The next step is to collect data for the research, including data for
implementing the model and data for assessing the damage, the impact of flooding.
Once data collection is done, analysis will be conducted that founds trends and rules of
climate change which will be able to calculate the values of weather in the future. The
construction of evaluation criteria for choice the model is based on three aspects:
theory to construct models, data input of models and requirements to satisfy the
research output.
After the evaluation criteria has completed, the choice of the most flood model will be
carried out. To get reliable results after implementation, the model need to conduct
calibration validation. The calibration process will be accepted after the validation
process gets a high satisfaction. With the calibrated parameters the chosen model will
be implemented to identify flooded areas and create flooding maps. The results,
flooding maps, will be used to analyze and evaluate the impact and risk to the urban
system. The evaluation is based on the spatial relationships. And last step that will be
Chapter 1. Introduction
Tran Thong Nhat 10
done basing on the assessment of flood impact, risk and vulnerability is predictions,
suggestion, recommendations to decision makers and planners. The flooding maps will
be produced with 2 scenarios: current climate data and future climate data. And based
on the flooding maps assessment of flood risks is carried out for the current houses,
population and land use.
Spatial data:Elevation, Soil, Drainage,
Hydrologic Network...
Climate data:Precipitation, Tide
level...
Land use
CurrentFuture
Climate change trends and rules
FutureCurrent
The most suitable flood
model
Flooding maps
Urban system Assessment of flood risk
Predictions, warnings, suggestions to decision makers and planners
Calibrations
Validation
Yes
No
Critiria of model
evaluation
Identify
Review and evaluate flood
models
Fig. 1.1: Methodology flowchart
Chapter 1. Introduction
Tran Thong Nhat 11
5. Content summary
The thesis is organized into seven chapters to describe whole the tasks carried out of
the research. The content of the thesis is performed ordinarily from introduction to the
conclusion. These chapters are summarized as the followings.
In the chapter, there is a general introduction about the thesis. The chapter draws a
main picture for the thesis. It includes a general review problem in Ho Chi Minh City
and then determining objectives of the thesis, methodology, and steps to implement for
the investigation and summary content of the chapters in the thesis that the thesis will
be conducted.
The chapter 2 shows literature review of the research. The chapter reviews researches
relating and applied to this study. It includes GIS and remote sensing, flood models,
emission scenarios and climate change and done researches on the flood and climate
change in Ho Chi Minh City. The target of the chapter is to evaluate facilities to help
the research can be completed and gaps of flood problem in Ho Chi Minh City with
climate change conditions.
The chapter 3 the first one describes the real tasks of the research. This chapter
presents all stages of the data and database process that includes collecting, editing and
errors processing. Besides calculated secondary data are to serve next steps.
The next chapter motivates steps by steps about flood model. It shows choosing the
most suitable approach to determine flood areas and its characteristics for the research.
And based on the approach, a flood model is built. Further, problems that help to
improve the accuracy of result from the model are also mentioned and detailed.
In the chapter 5, chapter 6 and chapter 7 the approaches on flood risk analysis and
assessment are described and presented in GIS environment. The steps and theories
that are applied of assessment and analysis are mentioned detailed for each of ground
objects matching to the research aims such as houses, population, and land use. And
results based on theories will be determined. The results are calculated and computed
to identify flood risk grades and impact to residents and their properties. Additionally,
the discussions of the results are mentioned and explained for the results.
The last chapter is conclusions and recommendations that are collected from chapter 5,
chapter 6 and chapter 7. This chapter also mentions suggestions to the stakeholder in

Chapter 1. Introduction
Tran Thong Nhat 12
the study area such as decision makers, planner and residents living in the flood risk
suitable warnings. Moreover, in the chapter, there are assessments that give what the
research archives and what the research should be conducted further in the future.

Chapter 2. Literature Review
Tran Thong Nhat 13
Chapter 2. Literature Review
1. Study area
Study area is located at Ho Chi Minh City center. In the area there are many typical
features for Ho Chi Minh City specially and that for urban areas in Viet Nam
generally. The characteristics of the study area are described in the next sections
(HCMCPC, 2010; HCMCPC, 2011).
Geography: Ho Chi Minh City is located from 10°10’-10°38’ north and 106°2’-
106°54’ east (HCMCPC, 2011). Moreover, Ho Chi Minh City touch with South China
Sea so that the city has conditions that are sensitive with the climate change especially
sea level rise in the future.
Topography: the study area is located in Ho Chi Minh City which belongs to a
transitional region between the southeastern and Mekong Delta regions. The general
topography is that Ho Chi Minh City terrain gets lower from north to south and from
east to west. So the study are has the medium-height terrain lies in the middle of the
city, encompassing most old residential areas.
The area’s height is 5-10 meters in Vietnamese vertical reference system that is chosen
mean sea level at Hon Dau, Hai Phong for the level zero. The height of the area does
not have suddenly change except the areas of a river and canals. The trend of height
increases slowly from east to west and from north to south. Moreover there are more
than 72.3% areas of the whole urban area of Ho Chi Minh City is below 2 m in
Vietnamese vertical reference system (Storch et al., 2009).
Ecology: The ecology of the study area is classified into basic types: the area of trees
with some parks, the area of river and canals with water surface, and the other one
with resident region with most small and low houses.
Climate: the study area is located in Ho Chi Minh City so it also has climate as Ho Chi
Minh City. The city lies in the tropical climate region near the equator. Like southern
provinces, it has a high temperature all the year and two distinct seasons, the dry and
the rainy. The rainy season lasts from May to November and the dry season from
Chapter 2. Literature Review
Tran Thong Nhat 14
December to April. According to records of the meteorological observatory at Tan Son
Nhat airport, the city’s climate has the following features: rich radiation, high rainfall,
humidity averages, around 79.5% per year (HCMCPC, 2010).
2. Geographic information system (GIS)
As the name of the GIS, geographic information system, the nature of GIS technology
is a combination of processing power to solve problems relating to spatial and non
spatial data processing. Therefore, GIS can solve almost applications and simulate
spatial phenomena. Consequently nowadays many applications of many other
disciplines and fields apply GIS as a environment to integrate and develop their tools
so that the applications will be managed, implemented, stored, computed and
displayed much better, more visual, easier analysis and more convenient delivering to
end users. Moreover GIS is also an environment to develop spatial decision support
systems that is helpful for managers and decision makers who make more precise and
effective resolutions.
With that tendency, flood management field also applies GIS to make a basic
environment for the development of the tools that serve for simulations, computations,
analysis and visual display to users. The tendency is promoted strongly nowadays
(Vieux, 2005). The process and generation of flooding in reality is very complex to
simulate similarly to the real process so that the establishment of the theory to model
this process is actually a simplification to simulate a relatively consistent for each
specific situation. It is also the answer why many flood models are built. With the
trend of development on an advanced nowadays, requirements about flood models
must be made the results more accurate and thus the technologies that are used to
support to processes of spatial simulation of flood model software are strong. As a
result, the requirements of spatial processing for flood models have been meeting the
spatial processing functions of GIS. Additionally, the results of GIS are also easily
visualized and interpreted to the end users. Moreover, to extract the reports with
formats such as maps and tables is also a strong feature of GIS. All these are reviewed
and expressed specifically in the book, The GIS Applications for Water, Wastewater,
and Storm water Systems, written by Uzair M. Shamsi in 2005 (Shamsi, 2005). The
authors focus on applications related to water in urban areas. The book brought to the
readers the specific case studies for characteristic applications on water that help the
Chapter 2. Literature Review
Tran Thong Nhat 15
readers being understood and would be able to apply for the same situation easily. Not
only GIS is mentioned but the book also showed the integration of remote sensing into
the GIS for applications on water. For an example, high resolution satellite images can
be used to update information about the changes large-scale land surface such as land
use, or environmental damages can be detected based on satellite imagery after
disasters such as floods, earthquakes or tsunamis.
Besides, GIS can be applied to the fields of water related to urban regions as Uzair M.
Shamsi written it can also apply to model for applications relating to water in the areas
where there are more extend such as basins, delta and catchments…. The applications
are considered in the document titled Geographic Information Systems in Water
Resources Engineering written by Johnson in 2009. The document has shown the
methods and provided GIS applications for most of the problems about water
resources at basin level as surface water hydrology, groundwater hydrology,
wastewater and storm water, and floodplains.
GIS can not only apply the problems of flooding, a lot of researches and
documentation have shown that GIS is also used as a powerful analytical tool in
analyzing the risks, damage assessments of natural disasters. These are expressed
through the cases of study in book Geospatial Techniques in Urban Disaster Hazard
Analysis edited by Showalter and Lu (2010). Documents gathered plenty of applied
researches which use geospatial techniques for analyzing, evaluating and managing
risk, damage caused by natural disasters. Especially in this document there is a
separated section for the representation of GIS applications for sea level rise and flood
analysis. This section includes 5 chapters containing chapter 3 and chapter 5 focusing
on vulnerability assessments (Maantay, Maroko and Culp, 2010; Pavri, 2010), chapter
4 and chapter 6 focusing on risk analysis and management (Bizimana & Schilling,
2010; Deckers, Kellens, Reyns, Vanneuville and Maeyer, 2010) related to flood
analysis and sea level rise. The other chapter, chapter 2, relates to apply GIS for
modeling of sea level rising on the world (Usery, Choi and Finn, 2010). As the editors
summarized in the text, in the chapter 2, Usery, Choi, and Finn’s use GIS to create
global animation of sea level rise. Their research is offered not as a predictive model
but to demonstrate a methodology for using GIS data layers to create models, animate
data, and provide the basis for more detailed modeling which can lead to improved
coastal policy-making.

Chapter 2. Literature Review
Tran Thong Nhat 16
3. Flood models
Flooding problem is a natural phenomenon occurring in the world for a long time.
Flood can be defined on FLOODsite (FC, 2009) as follows: "a temporary covering of
land by water outside its normal confines". Because of the severity of the flood
affected people's lives flood has been studied for a long time in the world (Aronica,
Hankin and Beven, 1998a; Bates & De Roo, 2000; Chow, 1973; Cunge, 1975; Cunge,
2003; Horritt, 2004).
Today, flood models and their theories as well are very popular over the world and
continuously upgrade day by day. Currently the world there are many models
simulating flooding in the reality. These flood models do not only compute but also
they can display the results of visualization on the GIS environment (DHI, 2004; DHI,
2007a).
There are many flood models to determine flood characteristics. Depending on goals,
accuracy and available data in the study area of each research, there are a lot of flood
models applied in the real (Apel, Aronica, Kreibich and Thieken, 2009; Bates & De
Roo, 2000; Sanders, 2007). If separation bases on using hydraulic model in the flood
models there are two groups. The first is non used hydraulic model and the second is
the used hydraulic model.
The flood models that are non used hydraulic model are not based on computation of
water wave motion. For this group, there are two types. The type 1 uses a comparison
method that considers differences between elevation of ground surface and water level
height. Therefore this method is called planar surface (Horritt & Bates, 2001; Nhat,
2011; Nhat & Loi, 2010; Priestnall, Jaafar and Duncan, 2000). The type 2 is based on a
statistical relation – regression between flooded area and discharge of the sub
catchment and called statistical approach (Townsend & Foster, 2002). To apply the
second one in a new study area, there is an area where similar to the new study area
and has relationship between flooded area and discharge. Then in the new study area a
SAR image is captured and a combination between SAR and the relationship, the
characteristics of flood in the new study area are computed including flooded area,
depth and duration. The advantages of the group are simple and low computation cost
and not needed advance data. However, the results tend more exaggerated than reality
because they do not have lost of energy due to transmission (Dung, 2011).
Chapter 2. Literature Review
Tran Thong Nhat 17
The flood models used hydraulic models are complicated models to simulate all the
processes with water wave motion, conservation of energy and momentum of water.
To model the process of a flood, the researchers would analyze the flooding process
that consists of many smaller processes, but are merged into two major processes such
as hydrological and hydraulic processes. Two processes are built to models called
hydrological model and hydraulic model. In each process also includes many delicate
processes such as the infiltration, evaporation, transpiration, runoff generation process.
These processes are modeled by mathematical equations. The method chosen to solve
this equation also makes many differences for results of the flood model (NSWDOC-
MHL, 2006). To resolve a lot of the aspects, these processes are simulated by equation
system. The equation system contains plenty of unknowns related to position, energy
and momentum of the water. And depending on the number of spatial unknowns that
the model can solve the flood model is called story cell (Bates & De Roo, 2000;
Cunge, 1975; Hunter, 2005; Nien, 1996), one dimensional hydraulic (Chaudhry, 2008;
Dac, 2005; DHI, 2004; Hoa, Nhan, Wolanski, Tran and Haruyama, 2007; Horritt &
Bates, 2002; Pappenberger, Frodsham, Beven, Romanowicz and Matgen, 2007;
Werner, 2004), two dimensional hydraulic (Aronica, Tucciarelli and Nasello, 1998b;
Carrivick, 2006; DHI, 2007a; Hervouet, Hubert, Janin, Lepeintre and Peltier, 1994),
couple one –two dimensional hydraulic (DHI, 2007b; Dung, 2008; Frank, Ostan,
Coccato and Stelling, 2001; Hoa et al., 2007; Vorogushyn, Merz, Lindenschmidt and
Apel, 2010) and three dimensional hydraulic (Wilson, Yagci, Rauch and Olsen, 2006).
To implement of the flood models the input data is available with the elevation in the
river bed or at least cross sections of the rivers and canals. The advantages of the
models are really approximate simulations so that the results are computed have more
accuracy than the first group. However, the disadvantages are needs of detail input
data, resources and high computation cost.
4. Climate change
Climate change is one of hot problems in the world nowadays. This change of climate
is due to the behaviors of human into the environment so that global warming impacts
to the climate and weather of the earth. Depending on the geography and regional
natural conditions, different regions of the world are affected at different scales by the
climate change. The climate change impact assessments on over the world are
presented in the IPCC reports (IPCC, 2001; IPCC, 2007). In the reports IPCC has built
Chapter 2. Literature Review
Tran Thong Nhat 18
the impact on emissions scenarios of the world and based on frame data of IPCC the
countries would downscale and calculate the results of climate change at the national
level.
For Vietnam, the climate change is a significant and highlight problem because of
potential impacts of sea level rise. The reason of that is because Vietnam has a long
coastline that is along country from north to south through a lot of areas of the country.
According to the studies on the impacts of sea level rise, Vietnam is one of the
countries that are seriously affected but especially the low land of delta in southern and
northern regions. Realizably those issues Vietnamese state and government have built
and developed a national program to study this problem (VNGov., 2008). The national
program on climate change and sea level rise is one of important programs which set
out the objectives and stages of the preparation for facing impact, risks in Vietnam
caused by climate change in the medium and long term.
Based on objectives of the national program on climate change, a lot of researches on
climate change are deployed. In 2009, Ministry of Natural Resources and Environment
(MONRE) reported results on climate change and sea level rise on regions in Vietnam
with interval ten years in the 21st century (MONRE, 2009; Phung & Working Project
Team, 2011). And then with frame data of the report, the provincial governments
downscales and calculates more detail of result on climate change and sea level rise for
their province matching with the real local climate data.
With that direction of the development, Ho Chi Minh City government has been
improving the studies related to climate change and sea level rise to serve management
and planning. The first thing is to provide the results on climate change and sea level
rise in Ho Chi Minh City. The research “Study to build an evaluable model of climate
change impacts to natural, human and social economy in Ho Chi Minh City” of Sub
Institute of Hydrometeology and Environment of South Viet Nam (Phung & Working
Project Team, 2011) had released the results of climate change and sea level rise in Ho
Chi Minh City in 2011. That is one of the reference materials for the analysis and
calculation of the value weather and rising sea level in this study.

Chapter 2. Literature Review
Tran Thong Nhat 19
(Source: Phi, 2007)
5. Researches related to the thesis
In the recent decades, some researchers began to study the problems concerning to
urban flooding in Ho Chi Minh City and shown the causes but they were discrete (Phi,
2007; Phi, 2009; Thang, 2010) or a beginning combination makes sense of the causes
for phenomenon of urban flooding in Ho Chi Minh City (Trung, 2009). However, no
comprehensive and systematic study on the issue of flooding at the entire city level is
made to solve the urban flooding problem here. In the studying of flooding field in Ho
Chi Minh City, the researcher, Ho Long Phi has had the researches which are more
concentrated for urban flooding problems in Ho Chi Minh City. In climate change
research and urban flooding in Ho Chi Minh City (2007), Phi made conclusions about
climate change phenomenon is affecting urban flooding problem in Ho Chi Minh City
from hydrographic data as shown in table 2.1. From this study Phi showed a tendency
to increase the number of heavy rains over time serial. The tendency will make a
serious dimension to the problem of urban flooding in Ho Chi Minh in the future.
Tab. 2.1: Increasing the number of heavy rains with volume more than 100m
Period 1952-1961 1962-1971 1972-1981 1982-1991 1992-2002
Counts 0 1 2 2 4
Additionally, in the research Local Climate Change Research and Urban Flooding in
Ho Chi Minh City (2009), Phi pointed out that water level rising in Ho Chi Minh is not
only by global climate change but also by local factors as urbanization and land use
change which have caused increasing tidal level in the area. The increased rainfall has
also exposed a cause of the Ho Chi Minh urban flooding that is poor drainage system
in Ho Chi Minh. The status of the drainage system can not be improved from new
projects because by problems about setting construction standards for drainage system
in Vietnam that have not kept to update with changing climatic conditions in the
locality (Thang, 2010).
Besides the researches, a number of organizations have conducted studies to
implement urban upgrading projects to address environmental issues and especially,
urban flooding is one of them. Currently there are many projects large and small to
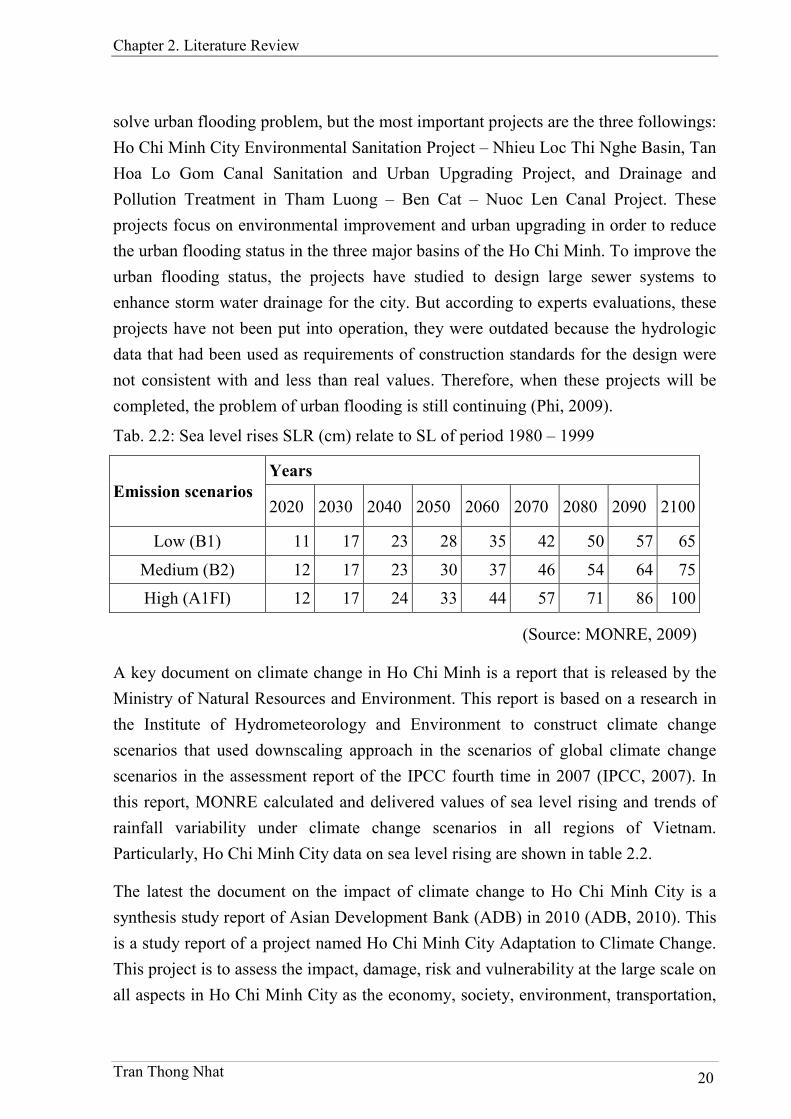
Chapter 2. Literature Review
Tran Thong Nhat 20
solve urban flooding problem, but the most important projects are the three followings:
Ho Chi Minh City Environmental Sanitation Project – Nhieu Loc Thi Nghe Basin, Tan
Hoa Lo Gom Canal Sanitation and Urban Upgrading Project, and Drainage and
Pollution Treatment in Tham Luong – Ben Cat – Nuoc Len Canal Project. These
projects focus on environmental improvement and urban upgrading in order to reduce
the urban flooding status in the three major basins of the Ho Chi Minh. To improve the
urban flooding status, the projects have studied to design large sewer systems to
enhance storm water drainage for the city. But according to experts evaluations, these
projects have not been put into operation, they were outdated because the hydrologic
data that had been used as requirements of construction standards for the design were
not consistent with and less than real values. Therefore, when these projects will be
completed, the problem of urban flooding is still continuing (Phi, 2009).
Tab. 2.2: Sea level rises SLR (cm) relate to SL of period 1980 – 1999
Years Emission scenarios
2020 2030 2040 2050 2060 2070 2080 2090 2100
Low (B1) 11 17 23 28 35 42 50 57 65
Medium (B2) 12 17 23 30 37 46 54 64 75
High (A1FI) 12 17 24 33 44 57 71 86 100
A key document on climate change in Ho Chi Minh is a report that is released by the
Ministry of Natural Resources and Environment. This report is based on a research in
the Institute of Hydrometeorology and Environment to construct climate change
scenarios that used downscaling approach in the scenarios of global climate change
scenarios in the assessment report of the IPCC fourth time in 2007 (IPCC, 2007). In
this report, MONRE calculated and delivered values of sea level rising and trends of
rainfall variability under climate change scenarios in all regions of Vietnam.
Particularly, Ho Chi Minh City data on sea level rising are shown in table 2.2.
The latest the document on the impact of climate change to Ho Chi Minh City is a
synthesis study report of Asian Development Bank (ADB) in 2010 (ADB, 2010). This
is a study report of a project named Ho Chi Minh City Adaptation to Climate Change.
This project is to assess the impact, damage, risk and vulnerability at the large scale on
all aspects in Ho Chi Minh City as the economy, society, environment, transportation,
(Source: MONRE, 2009)
Chapter 2. Literature Review
Tran Thong Nhat 21
infrastructure, agriculture, industry in 2050 under climate change conditions to assist
the Ho Chi Minh City People's Committee and its results is to recommend the
adaptation policies to help cities sustainable development in the future. The project
had focused largely on vulnerability assessment, impact of climate change in 2050
based on scenarios that were integrated of sea level rising, precipitation increasing in
the status of typhoons. To build inundated areas, a hydraulic model HydroGIS (Hoanh,
Phong, Trung, Dung, Hien, Ngoc and Tuong, 2012; Nhan, Hoa, Cong and Diep, 2009;
Thai, 2011) had been used and then assessing impact, damage, risk and vulnerability to
the areas in Ho Chi Minh City is based on the results of the model. Generally this is a
comprehensive study project for the projected impacts of climate change to Ho Chi
Minh City in 2050. However, with using HydroGIS model to identify flooding areas
was not appropriate and accurate. That is because HydroGIS model built based on
river flooding. Moreover, HydroGIS model can not simulate the street elevation and
irrigation system for controlling flow water from rivers. Thus applying this model will
not correct for flooding phenomenon in urban areas such as Ho Chi Minh City. And a
gap of the study that is the results had not considered the impact of land subsidence
flooding in Ho Chi Minh City (ADB, 2009a; ADB, 2009b; WB, 2010). The next one is
procedure of the model implementation duration that there was not the calibration
process for parameters of the model before the model was applied to create scenarios
for future so that the results are not highly reliable.
To be able to say up to now, the studies related to urban flooding in Ho Chi Minh City
are also discrete. The studies to current urban flooding problem have not been
completed or perfect, the studies toward the future there is the ADB project that is
fairly complete however the project focuses only on analyzing the impact of climate
change scenarios to urban in Ho Chi Minh City. It has not been implemented
systematic study on the existing flooding situation. Additionally, the tool used for the
study has not been scientific because the study only tries to run the model to reap
outputs without regard to the appropriate context of performance of the model.
Chapter 3. Data and database
Tran Thong Nhat 22
Chapter 3. Data and database
1. Collecting data
This is big problem for any researches in Vietnam because the regulations of
publishing and updating data are very strict and not consistent. The data for the study
can be divided into the following groups: climate data, data for flood model and data
for assessments. The data groups are described in the following paragraphs with data
information and evaluation in the context of the research requirements.
Climate data include tide level, rainfall and temperature for a reference time period of
calculated climate change. The reference time period shown by the IPCC and Vietnam
is from 1980 to 1999 (IPCC, 2007; MONRE, 2009). The data for the reference time
period are collected and almost this serial data are not missed. Moreover to calculate
tide level, precipitation of rain and temperature in the future time, the scenarios of sea
level rise in Ho Chi Minh City, rainfall and temperature changes are collected.
Data for a flood model include data for implementation and data for calibration. Data
for implementation need a perfect terrain or river-canal network and their cross
sections, drainage system and land use in the study area. The research collected
terrestrial elevation points, drainage system, cross sections of Nhieu Loc-Thi Nghe
canal sub catchment and land use of whole the city. This data group is missed almost
the cross sections for river – canal network besides the observed data serves for
calibration and verification of flood model.
Data for assessments the research has collected data of urban system including: the
latest administration boundary at the community level, population data in 2009, traffic
system and build up footprint in 2006.
Results of data collection are shown in table 3.1. These data are available in many
formats, consequently editing task that change to a standard GIS data consumes many
time. Basically there are three types of collected main data: GIS data, tables and text.
GIS format includes the following data: elevation points excluding river and canal
network, river-canal network, the latest administration boundary at the community
Chapter 3. Data and database
Tran Thong Nhat 23
level, traffic system, buildup footprint and land use. Although these data in GIS
formats, but there is still a lot of errors of spatial relationship that needs to edit and
correct.
Tabular data includes: population, climate data, and climate change scenarios. All this
data should be transferred to GIS format or associated with spatial objects in GIS
respectively. Besides they need to be checked the accuracy before being used for
research.
Text data includes: drainage system and cross sections of Nhieu Loc Thi Nghe sub
catchment. The conversion and editing data in GIS format takes a lot of time.
Currently data is being prioritized for editing and progress. Together with the editing,
checking and correcting is carried out.
2. Editing and correcting data
In GIS, there are two types of information for each object. The first is the spatial
information related to the geometry and position of the object. The second is
information related to nonspatial or in the other word called object attributes. The
editing data is mostly issues concern in terms of the geometry and spatial problems of
the object that are emended and corrected exactly in geographical location. The object
attributes are almost unchanged because they have been determined by management
agencies in Vietnam.
The spatial data have many types of error that are based on the geometry features with
polygon, line or point. The errors occur in the polygon data are the overlays and the
gaps between objects in the same feature class due to defect in snapping between the
vertices of two adjacent objects. The errors appearing in the linear data are primarily
caused from missing of the digitization processing such as snapping of adjacent
features in the feature class. The errors include overlap and self overlap, pseudo nodes
and dangles. Additionally, the data also need to check the lines of the data must be
within Ho Chi Minh City. And the last geometry type of the data is point. With the
point in the research there are elevation data and out-inlet gates. In these data, the
elevation points need to check because there are some residual points between terrain
points and features points such as misunderstood points in roads, buildings, bench
mark.
Chapter 3. Data and database
Tran Thong Nhat 24
Method of identifying errors is to check problems about geometry, location and the
spatial relationships between objects in the same feature class or between data layers
with each other that are based on regulations called topology rules. After identifying
the errors, method for correcting errors depends on the types of errors. If the errors
show wrong locations, the features in the data will be corrected to right locations based
on the satellite image. With the features are misunderstood, they will be deleted.
3. Population data
Population data includes information at the time points that the research interests for
assessment at the current and future scenarios. For the current scenario, the population
data is collected at the commune level that is surveyed and inventory whole the
country on the first April 2009.
Data are collected and used in the research are shown in the table 3.1. In the table the
columns describe the information of the data including data name, published date and
data source. Published date is year when the data is official delivered popularly to third
parties which need to use the data. The data source is legal organizations which can
issue for the other organizations for using.
4. Analyzing and calculating climate data
4.1. Identifying climate change trend and rules
This task is being considered as the scenarios of climate change. Therefore, this action
is part of the collected data. The data on climate change trend and rules are presented
as table 3.2 and table 3.3. Table 3.2 shows sea level rising in Vietnam and Ho Chi
Minh City for 21st century with interval of 10 years (Phung & Working Project Team,
2011). The sea level rising is compared with sea level of referent time 1980-1999.
Additionally, to calculate the tide level in the future time when there is climate change
needs to identify value of interval average tide level increment. The values are shown
in the table 3.3 (Phung & Working Project Team, 2011).
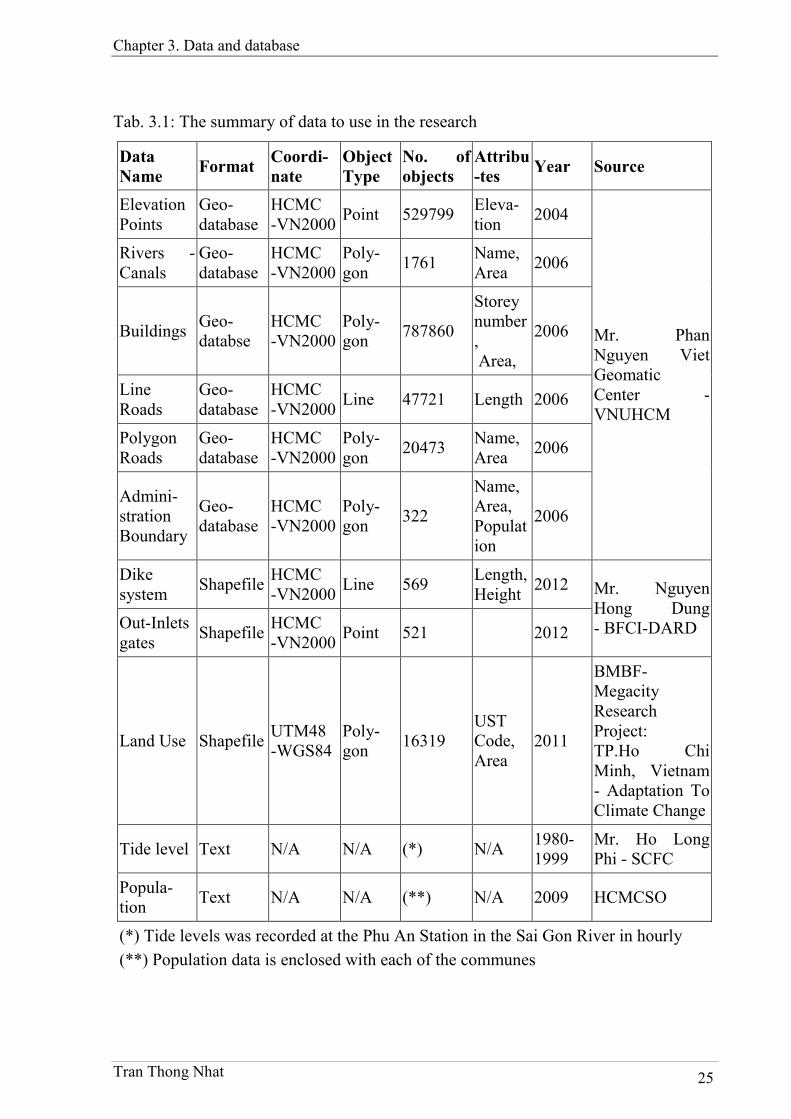
Chapter 3. Data and database
Tran Thong Nhat 25
Tab. 3.1: The summary of data to use in the research
Data Name
Format Coordi-nate
Object Type
No. of objects
Attribu-tes
Year Source
Elevation Points
Geo-database
HCMC -VN2000
Point 529799 Eleva-tion
2004
Rivers - Canals
Geo-database
HCMC -VN2000
Poly-gon
1761 Name, Area
2006
Buildings Geo-databse
HCMC -VN2000
Poly-gon
787860
Storey number, Area,
2006
Line Roads
Geo-database
HCMC -VN2000
Line 47721 Length 2006
Polygon Roads
Geo-database
HCMC -VN2000
Poly-gon
20473 Name, Area
2006
Admini-stration Boundary
Geo-database
HCMC -VN2000
Poly-gon
322
Name, Area, Population
2006
Mr. Phan Nguyen Viet Geomatic Center - VNUHCM
Dike system
Shapefile HCMC -VN2000
Line 569 Length, Height
2012
Out-Inlets gates
Shapefile HCMC -VN2000
Point 521 2012
Mr. Nguyen Hong Dung - BFCI-DARD
Land Use Shapefile UTM48 -WGS84
Poly-gon
16319 UST Code, Area
2011
BMBF- Megacity Research Project: TP.Ho Chi Minh, Vietnam - Adaptation To Climate Change
Tide level Text N/A N/A (*) N/A 1980-1999
Mr. Ho Long Phi - SCFC
Popula-tion
Text N/A N/A (**) N/A 2009 HCMCSO
(*) Tide levels was recorded at the Phu An Station in the Sai Gon River in hourly
(**) Population data is enclosed with each of the communes
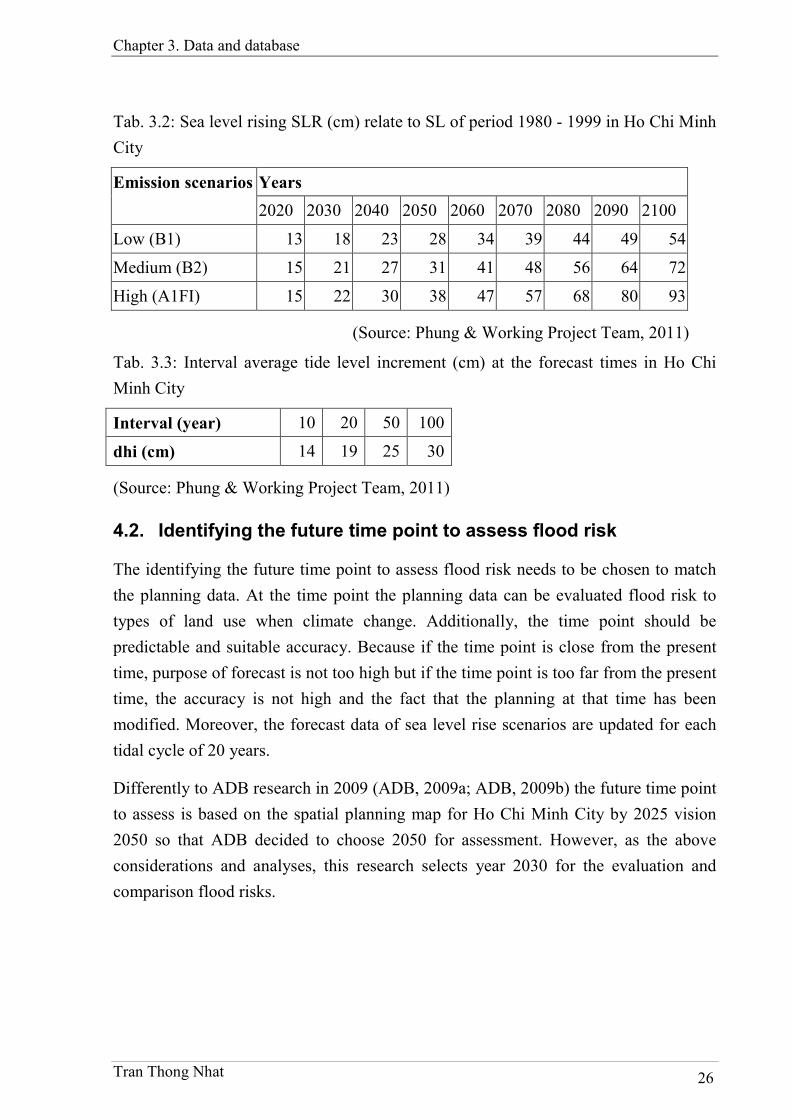
Chapter 3. Data and database
Tran Thong Nhat 26
Tab. 3.2: Sea level rising SLR (cm) relate to SL of period 1980 - 1999 in Ho Chi Minh
City
Years Emission scenarios
2020 2030 2040 2050 2060 2070 2080 2090 2100
Low (B1) 13 18 23 28 34 39 44 49 54
Medium (B2) 15 21 27 31 41 48 56 64 72
High (A1FI) 15 22 30 38 47 57 68 80 93
(Source: Phung & Working Project Team, 2011)
Tab. 3.3: Interval average tide level increment (cm) at the forecast times in Ho Chi
Minh City
Interval (year) 10 20 50 100
dhi (cm) 14 19 25 30
(Source: Phung & Working Project Team, 2011)
4.2. Identifying the future time point to assess flood risk
The identifying the future time point to assess flood risk needs to be chosen to match
the planning data. At the time point the planning data can be evaluated flood risk to
types of land use when climate change. Additionally, the time point should be
predictable and suitable accuracy. Because if the time point is close from the present
time, purpose of forecast is not too high but if the time point is too far from the present
time, the accuracy is not high and the fact that the planning at that time has been
modified. Moreover, the forecast data of sea level rise scenarios are updated for each
tidal cycle of 20 years.
Differently to ADB research in 2009 (ADB, 2009a; ADB, 2009b) the future time point
to assess is based on the spatial planning map for Ho Chi Minh City by 2025 vision
2050 so that ADB decided to choose 2050 for assessment. However, as the above
considerations and analyses, this research selects year 2030 for the evaluation and
comparison flood risks.
Chapter 3. Data and database
Tran Thong Nhat 27
4.3. Identifying peaks and their appearance number of the tide
level
Identifying and calculating tide level peaks in the study area daily are important.
Additionally, the peaks are shown the tide heights that impact flooded areas it also
address the frequency of the flood can appear for the time. Based on those the flood
risk can be explored.
In Ho Chi Minh City, the tidal regime is of semi-diurnal tide so that tidal peak number
each day is usually two times. Therefore there are a difference amount of flood
between flooding by max level and peak of tide per day and calculating peak number
of tide per day is essential for flood risk assessment.
To identify and calculate the tidal daily peaks, the research carry out analyze chain
data of tide at the Phu An measurement station on Sai Gon River with time interval is
hourly. The method to define tidal peak is comparison value of tide level at a time
point with before and after adjacent values (Mudelsee, 2010). If the value of tide level
is more than before and after adjacent values, the value is peak and otherwise the value
is not. The chain data is analyzed continuously time by time for whole the period of
time (1980-1999).
The next step is computation of number of the tide peaks in the value chain. Method of
determining number of the appearance of the tide peaks is based on the set of the tide
peaks. Then a processing of count from the set of tide peaks will be done to determine
a number of appearances for each of tide peak value.
To process the tasks, the research develops a program in the Freemat programming
language (Sourceforge.net, 2012) to analyze and identify the tide peaks. The result of
the tide peak and frequency is shown the table 3.4.
4.4. Calculating climate data at the future time point
Calculating tide level at a station under climate change at the future time point is based
on three elements (as shown in equation 3.1): high tide at the reference time, rising sea
level at the time point and interval average tide level increment at that time point (dhi).
To determine the value of dhi is complicated because this task needs support of many
software and data to analyze the harmonic astronomical cycles. However, there is a
research with title “Study to build an evaluable model of climate change impacts to
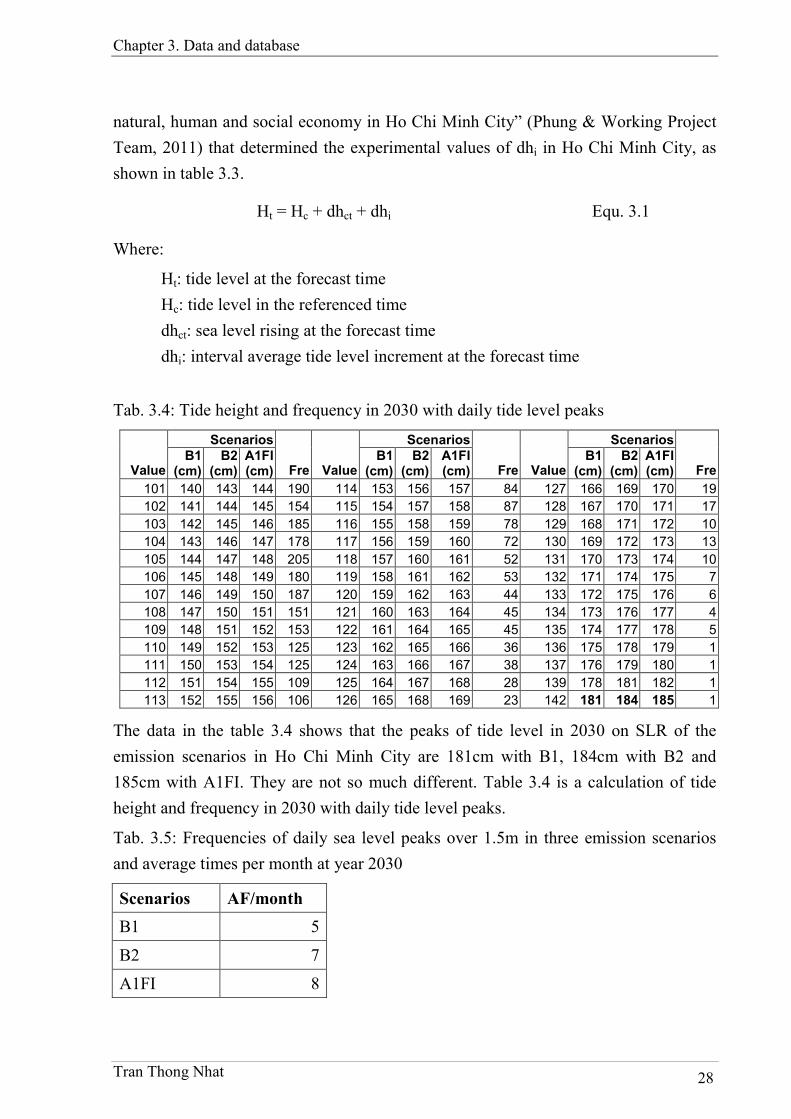
Chapter 3. Data and database
Tran Thong Nhat 28
natural, human and social economy in Ho Chi Minh City” (Phung & Working Project
Team, 2011) that determined the experimental values of dhi in Ho Chi Minh City, as
shown in table 3.3.
Ht = Hc + dhct + dhi Equ. 3.1
Where:
Ht: tide level at the forecast time
Hc: tide level in the referenced time
dhct: sea level rising at the forecast time
dhi: interval average tide level increment at the forecast time
Tab. 3.4: Tide height and frequency in 2030 with daily tide level peaks
Scenarios Scenarios Scenarios
Value B1
(cm) B2
(cm) A1FI (cm) Fre Value
B1 (cm)
B2 (cm)
A1FI (cm) Fre Value
B1 (cm)
B2 (cm)
A1FI (cm) Fre
101 140 143 144 190 114 153 156 157 84 127 166 169 170 19
102 141 144 145 154 115 154 157 158 87 128 167 170 171 17
103 142 145 146 185 116 155 158 159 78 129 168 171 172 10
104 143 146 147 178 117 156 159 160 72 130 169 172 173 13
105 144 147 148 205 118 157 160 161 52 131 170 173 174 10
106 145 148 149 180 119 158 161 162 53 132 171 174 175 7
107 146 149 150 187 120 159 162 163 44 133 172 175 176 6
108 147 150 151 151 121 160 163 164 45 134 173 176 177 4
109 148 151 152 153 122 161 164 165 45 135 174 177 178 5
110 149 152 153 125 123 162 165 166 36 136 175 178 179 1
111 150 153 154 125 124 163 166 167 38 137 176 179 180 1
112 151 154 155 109 125 164 167 168 28 139 178 181 182 1
113 152 155 156 106 126 165 168 169 23 142 181 184 185 1
The data in the table 3.4 shows that the peaks of tide level in 2030 on SLR of the
emission scenarios in Ho Chi Minh City are 181cm with B1, 184cm with B2 and
185cm with A1FI. They are not so much different. Table 3.4 is a calculation of tide
height and frequency in 2030 with daily tide level peaks.
Tab. 3.5: Frequencies of daily sea level peaks over 1.5m in three emission scenarios
and average times per month at year 2030
Scenarios AF/month
B1 5
B2 7
A1FI 8
Chapter 3. Data and database
Tran Thong Nhat 29
In the table 3.5 the frequency of tide peaks is more than current average tide level
1.5m on the scenarios is very much. The result of the frequency is shown in the table
3.5 This means with the current flooded areas at the tide level 1.5m will be inundated
more than from 5 to 8 times per month matching to the scenarios. This information is a
warning to the residents who are living there because of flood impact of their life
activities.
Chapter 4. Building Flood Model and Flooding Maps
Tran Thong Nhat 30
Chapter 4. Building Flood Model and Flooding
Maps
1. Selecting a suitable flood model for the research
1.1. Build criteria of selection
The construction of evaluation criteria is to be able to choose the most appropriate
model for flooding context and data in Ho Chi Minh City of this study. These criteria
are an attachment between goals of the study, the flooding context and the available
data in the Ho Chi Minh City. Therefore the criteria will be integrated and expressed
the following requirements:
Research outcomes: Outcomes of the model must be calculated for whole
of the city.
Available data on flooding study in Ho Chi Minh City: At least the flood
model determines the flooded areas with sea level rise.
Abilities of flood model software: to be able to determine the flooded area,
flooding depth, flooding duration, and flooding frequency.
Complexity of the model software on the operation and learning it: the
model software is the most simple as possible.
Cost of software: the least fee is priority.
1.2. Analysis and selection the most suitable flood model
As mentioned in the flood model review of chapter 2, the flood models are classified
two groups: non used hydraulic model (Horritt & Bates, 2001; Nhat, 2011; Nhat &
Loi, 2010; Priestnall et al., 2000; Townsend & Foster, 2002) and used hydraulic model
(Aronica et al., 1998b; Chaudhry, 2008; Cunge, 1975; Dac, 2005; DHI, 2007a; Dung,
2008; Nhan et al., 2009; Nien, 1996; NSWDOC-MHL, 2006; Vorogushyn et al., 2010;
Wilson et al., 2006). Base on the criteria of selection a suitable flood model, the
Chapter 4. Building Flood Model and Flooding Maps
Tran Thong Nhat 31
research outcome covers whole of the Ho Chi Minh City but availability of input data
for hydraulic model is not completed so that flood models of the second group is not
suitable.
In the first group, there are two approaches for build flood model that are the planar
surface and statistical. The second approach requires a similar study area to Ho Chi
Minh City with relationship between flooded area and discharge but in the reality there
is not any region on over the world be able to satisfy these conditions. Therefore the
first approach called planar surface is the most suitable flood model to implement for
the research.
The planar surface approach has many advantages when it is implemented GIS
environment. This reasons due to GIS functions:
Very fast and accurate for modeling terrain surface with digital terrain
model (DTM)
Interpolate values for the others values accurately and efficiently
Simulate ground features more detailed so that the terrain surface is the
most approximate with reality
Tide records, one of input data are integrated GIS easily
Computing the flood characteristics such as depth, duration and frequency
conveniently
Results from the approach are suitable for flood risk assessments of the
next tasks
And if this approach is selected, there is not more the cost for software
2. Interpolating roads elevations
Interpolating roads elevations is based on the discrete elevation points inside of the
roads (Nhat, 2012). That is to make the roads with continuous along road height so
that the roads can be barriers to protect low land preventing flooding. Basically the
process is carried out based on the elevation interpolation of along a road with known
height information of the start and end points of a line (ESRI, 2011). From that
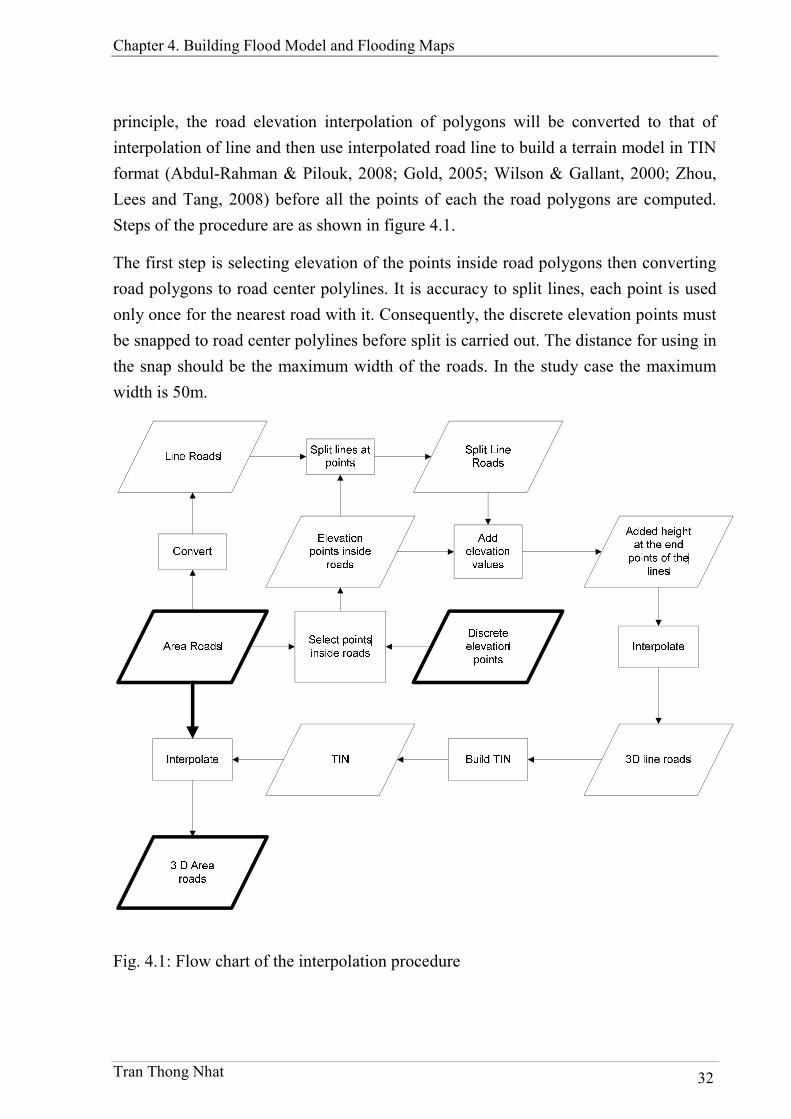
Chapter 4. Building Flood Model and Flooding Maps
Tran Thong Nhat 32
principle, the road elevation interpolation of polygons will be converted to that of
interpolation of line and then use interpolated road line to build a terrain model in TIN
format (Abdul-Rahman & Pilouk, 2008; Gold, 2005; Wilson & Gallant, 2000; Zhou,
Lees and Tang, 2008) before all the points of each the road polygons are computed.
Steps of the procedure are as shown in figure 4.1.
The first step is selecting elevation of the points inside road polygons then converting
road polygons to road center polylines. It is accuracy to split lines, each point is used
only once for the nearest road with it. Consequently, the discrete elevation points must
be snapped to road center polylines before split is carried out. The distance for using in
the snap should be the maximum width of the roads. In the study case the maximum
width is 50m.
Fig. 4.1: Flow chart of the interpolation procedure
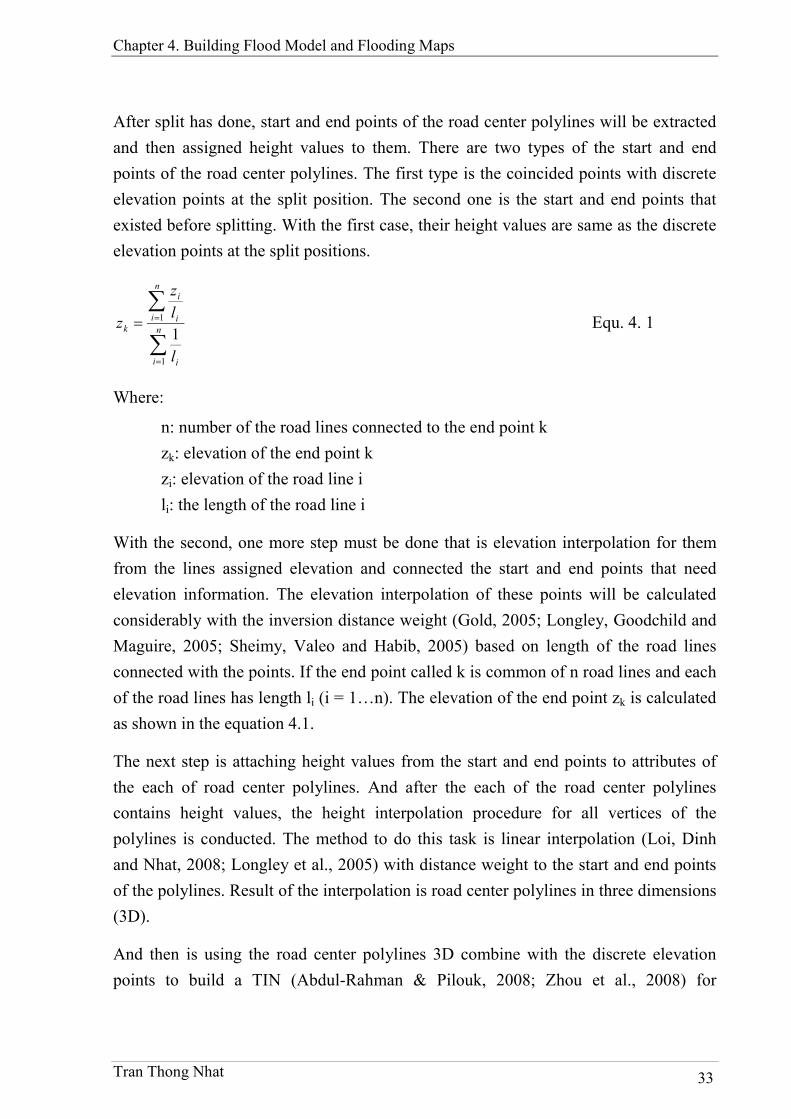
Chapter 4. Building Flood Model and Flooding Maps
Tran Thong Nhat 33
After split has done, start and end points of the road center polylines will be extracted
and then assigned height values to them. There are two types of the start and end
points of the road center polylines. The first type is the coincided points with discrete
elevation points at the split position. The second one is the start and end points that
existed before splitting. With the first case, their height values are same as the discrete
elevation points at the split positions.
n
i i
n
i i
i
k
l
l
z
z
1
1
1 Equ. 4. 1
Where:
n: number of the road lines connected to the end point k
zk: elevation of the end point k
zi: elevation of the road line i
li: the length of the road line i
With the second, one more step must be done that is elevation interpolation for them
from the lines assigned elevation and connected the start and end points that need
elevation information. The elevation interpolation of these points will be calculated
considerably with the inversion distance weight (Gold, 2005; Longley, Goodchild and
Maguire, 2005; Sheimy, Valeo and Habib, 2005) based on length of the road lines
connected with the points. If the end point called k is common of n road lines and each
of the road lines has length li (i = 1…n). The elevation of the end point zk is calculated
as shown in the equation 4.1.
The next step is attaching height values from the start and end points to attributes of
the each of road center polylines. And after the each of the road center polylines
contains height values, the height interpolation procedure for all vertices of the
polylines is conducted. The method to do this task is linear interpolation (Loi, Dinh
and Nhat, 2008; Longley et al., 2005) with distance weight to the start and end points
of the polylines. Result of the interpolation is road center polylines in three dimensions
(3D).
And then is using the road center polylines 3D combine with the discrete elevation
points to build a TIN (Abdul-Rahman & Pilouk, 2008; Zhou et al., 2008) for

Chapter 4. Building Flood Model and Flooding Maps
Tran Thong Nhat 34
interpolating the road polygons. In this step the interpolation method is the nearest
neighbor with sample distance 25m. That this will make the heterogeneity of the
vertexes of the road center polylines and road polygons will be reduced and increase
the high accuracy of the road polygons. Final step will get the road polygons in 3D.
3. Buildings height interpolation
Nowadays, to determine height of the ground objects there are approaches to conduct
this task. However, these approaches require a lot of resources of technology and cost.
With the latest technology the first one that should be mentioned for getting elevation
of ground objects with high accuracy need to be listed is LIDAR (Cobby, Mason and
Davenport, 2001; El-Omari & Moselhi, 2008; Madhavan, Wang, Tanahashi, Hirayu,
Niwa, Yamamoto, Tachibana and Sasagawa, 2006; Oude-Elberink & Vosselman,
2011; Pu, Rutzinger, Vosselman and S., 2011; Yang, Fang and Li, 2013; Yoon,
Sagong, Lee and Lee, 2009). And one more technology is applied common almost the
countries for producing cartography is stereo aerial photo (Ahmadabadian, Robson,
Boehm, Shortis, Wenzel and Fritsch, 2013; Altmaier & Kany, 2002; Baltsavias, 1999;
Barnea & Filin, 2013; Gabet, Giraudon and Renouard, 1997; Pollefeys, Koch,
Vergauwen and Van-Gool, 2000; Zebedin, Klaus, Gruber-Geymayer and Karner,
2006). The final, oldest and best accuracy is geodesy (Wahr, 1996). And some latest
decades, a new technology that complements for geodesy for surveying the ground
locations of the objects is GPS (El-Rabbany, 2002; Grewal, Weill and Andrews, 2007;
Samama, 2008). With the technologies the vertical information of the ground objects is
collected to the accuracy depended on application requirements. However because of
limitation of the resources, this research can not use these approaches to get the
vertical information of the ground objects. To apply only available resources, the
research develops and builds a new approach to derive the vertical information that is
based on spatial relationship of elevation between ground objects to each other.
To determine an interpolation method to derive base height of the buildings, the first
task should be highly considered that is the building objects relationship with other
ground objects that have already height information. To do the task, the analysis of
building characteristic of construction in the study area is applied. Here there are able
to divide two types of building. The first is built in clusters and the second is discrete.
Most of the cluster buildings are usually constructed in urban zone with roads in front
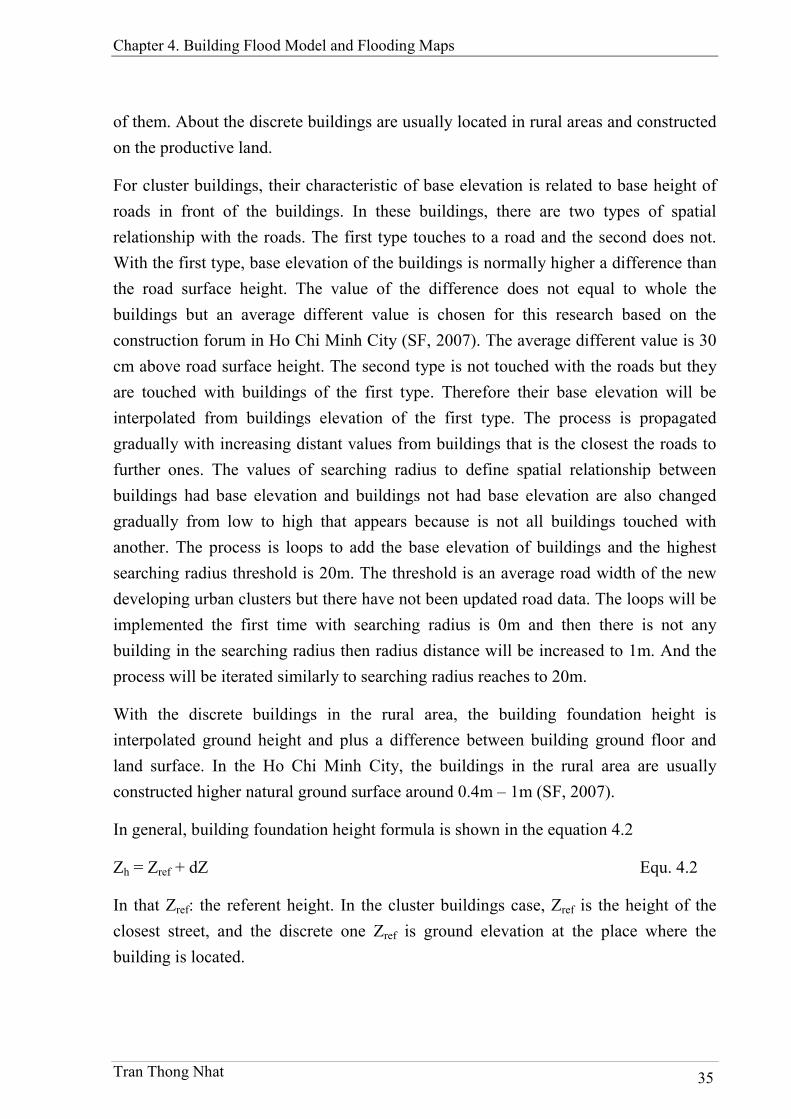
Chapter 4. Building Flood Model and Flooding Maps
Tran Thong Nhat 35
of them. About the discrete buildings are usually located in rural areas and constructed
on the productive land.
For cluster buildings, their characteristic of base elevation is related to base height of
roads in front of the buildings. In these buildings, there are two types of spatial
relationship with the roads. The first type touches to a road and the second does not.
With the first type, base elevation of the buildings is normally higher a difference than
the road surface height. The value of the difference does not equal to whole the
buildings but an average different value is chosen for this research based on the
construction forum in Ho Chi Minh City (SF, 2007). The average different value is 30
cm above road surface height. The second type is not touched with the roads but they
are touched with buildings of the first type. Therefore their base elevation will be
interpolated from buildings elevation of the first type. The process is propagated
gradually with increasing distant values from buildings that is the closest the roads to
further ones. The values of searching radius to define spatial relationship between
buildings had base elevation and buildings not had base elevation are also changed
gradually from low to high that appears because is not all buildings touched with
another. The process is loops to add the base elevation of buildings and the highest
searching radius threshold is 20m. The threshold is an average road width of the new
developing urban clusters but there have not been updated road data. The loops will be
implemented the first time with searching radius is 0m and then there is not any
building in the searching radius then radius distance will be increased to 1m. And the
process will be iterated similarly to searching radius reaches to 20m.
With the discrete buildings in the rural area, the building foundation height is
interpolated ground height and plus a difference between building ground floor and
land surface. In the Ho Chi Minh City, the buildings in the rural area are usually
constructed higher natural ground surface around 0.4m – 1m (SF, 2007).
In general, building foundation height formula is shown in the equation 4.2
Zh = Zref + dZ Equ. 4.2
In that Zref: the referent height. In the cluster buildings case, Zref is the height of the
closest street, and the discrete one Zref is ground elevation at the place where the
building is located.
Chapter 4. Building Flood Model and Flooding Maps
Tran Thong Nhat 36
dZ: height difference between building ground floor and referent height Zref. In the
research, dZ value of the cluster buildings is 0,3m and that of discrete buildings in the
rural area is 0,7m. The values of dZ are based on practical experiences of the civil
engineers.
4. Classifying the rivers causing flood
The approach of the flood model is connection the land where is lower than interested
tide level with the river, canal and urban drainage system. However, at the current in
Ho Chi Minh City there is a lot of available irrigation and dike systems to server
providing water for fields and protect the low land against the high tide. The systems
contain many embankments and out-inlet gates to control water quantity from provide
sources such as rivers and canals. Therefore, with river and canal system, the research
must classify two types of rivers and canals: type 1is able to cause flood and the type 2
is not able to cause flood.
To classify rivers and canals, the first step is update the dyke system with dykes,
levees and gate. And then the research will separate the rivers cause flood and not
cause flood. The rivers and canals causing flood are rivers and canals that do not exist
barriers by gates and they can drive water from water sources to the low land and
make flood. Therefore the land below the tide level and touch with the rivers causing
flood is inundated.
Otherwise, the rivers and canals uncausing flood are rivers and canals that are existing
barriers by gates at their out-inlet. Moreover, rivers and canals which are supplied
water by the rivers and canals uncausing flood are also considered as those of
uncausing flood.
5. Building the flooding model
Method to determine flooded areas of the research is based on the vent principle. That
means water will flow to the lowland areas when these areas are touched to the water
from the ocean through connection systems like rivers, canal or drainage. The entire
flooded area modeling for the research is described in figure 4.2.
Chapter 4. Building Flood Model and Flooding Maps
Tran Thong Nhat 37
Firstly, a terrain surface needs to be built. The surface represents terrain elevation of
interest area. In order to represent the terrain surface for the Earth's surface, GIS
technology has made two types: Triangle Irregular Network which is also known as
TIN (Longley et al., 2005) and raster format which is a grid and commonly called
digital elevation model DEM (Longley et al., 2005). The terrain surface is represented
raster format having the advantage that is easier to analyze spatial processing due to
simplicity in its data structure. However the raster can not express a terrain surface
which has complex arrangement of the ground objects and extreme changes of
elevation in the areas where there are artificial objects such as dykes, streets, banks of
rivers. In addition to a raster is built from interpolation algorithms that are always
existing errors whose significant degree depends on the selected resolution and
topographic characteristics (Booij, 2005). Because the accuracy of the raster depends
on the resolution and the topographic characteristics, terrain objects smaller than the
size of a pixel in the raster will not be shown and the different topographic
characteristics will be changed in different height residuals. That in fact the flooding
problem, there are many ground features works to prevent flooding as dykes, streets
but their small size makes it difficult to achieve a representation on the raster. Contrary
to the raster structure TIN is created by more complex algorithm and defined data
structure so that it consumes more time to spatial analysis but TIN has strengths that
can express mutational changes of terrain and objects with different sizes on the
surface that can be represented if there is their information of elevation or vertical
values. Another strength is that it will not have the interpolation error thus if the input
data have high accuracy, the model will have good accuracy (Abdul-Rahman &
Pilouk, 2008).
The goal of the terrain surface in the research is to identify the positions of lowland
where has the risk of potential flooding (Deckers et al., 2010; Usery et al., 2010). The
identification of these positions needs a terrain surface that models more accurate the
real terrain surface as possible so that this will also help the high accuracy of the
research results. With these requirements, the research have used TIN structure to
represent terrain surface for the study area where requires to identify areas of potential
flooding. The terrain surface in TIN format of this research is called DTM with
integration of the ground objects
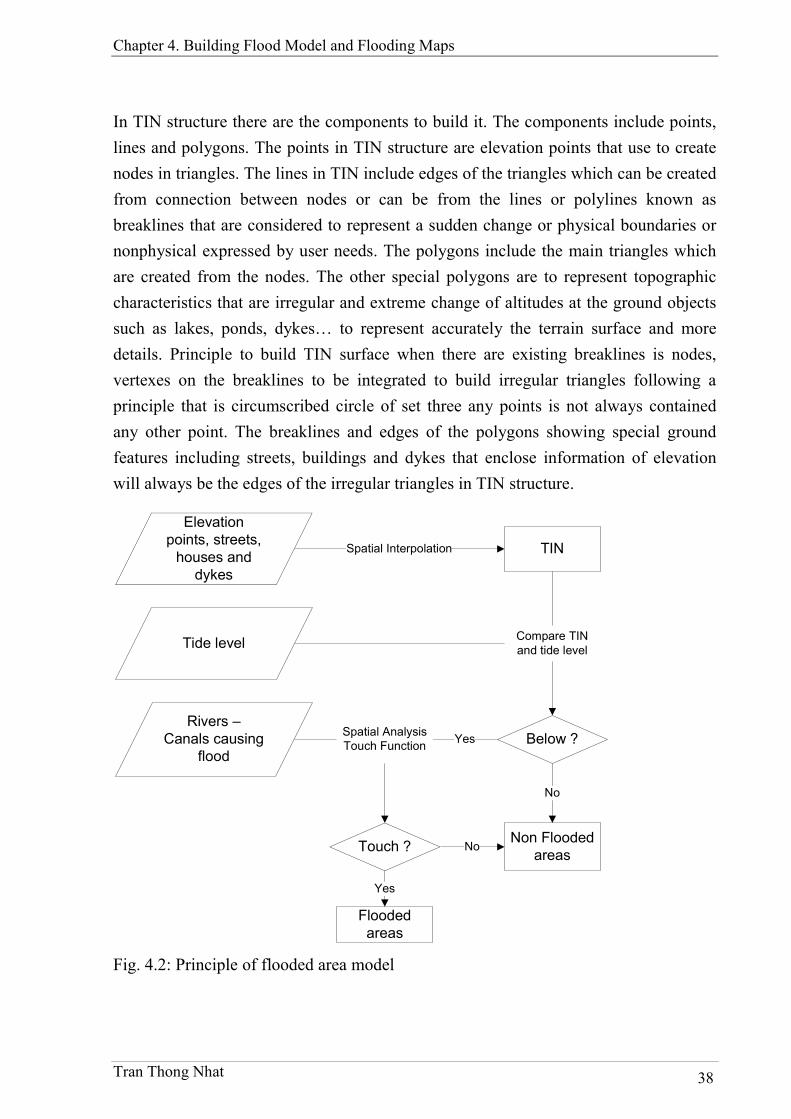
Chapter 4. Building Flood Model and Flooding Maps
Tran Thong Nhat 38
In TIN structure there are the components to build it. The components include points,
lines and polygons. The points in TIN structure are elevation points that use to create
nodes in triangles. The lines in TIN include edges of the triangles which can be created
from connection between nodes or can be from the lines or polylines known as
breaklines that are considered to represent a sudden change or physical boundaries or
nonphysical expressed by user needs. The polygons include the main triangles which
are created from the nodes. The other special polygons are to represent topographic
characteristics that are irregular and extreme change of altitudes at the ground objects
such as lakes, ponds, dykes… to represent accurately the terrain surface and more
details. Principle to build TIN surface when there are existing breaklines is nodes,
vertexes on the breaklines to be integrated to build irregular triangles following a
principle that is circumscribed circle of set three any points is not always contained
any other point. The breaklines and edges of the polygons showing special ground
features including streets, buildings and dykes that enclose information of elevation
will always be the edges of the irregular triangles in TIN structure.
Elevation points, streets,
houses and dykes
Touch ?
TIN
Rivers –Canals causing
flood
Compare TINand tide level
Flooded areas
Spatial Interpolation
Yes
Non Flooded areas
No
Yes
Spatial AnalysisTouch Function
Below ?
Tide level
No
Fig. 4.2: Principle of flooded area model
Chapter 4. Building Flood Model and Flooding Maps
Tran Thong Nhat 39
In the research, the nodes are elevation points. And the lines and polygons that are
ground features creating extreme changes of vertical values which impact to flooding
prone areas include river canal network, lakes and dykes.
Based on the sea level, positions whose elevation is lower than sea level will be
theoretic potential flooding positions. Method to identify a position being a theoretic
potential flooding position is a comparison between elevation of the position and sea
level altitude. Integrating the theoretic adjacent potential flooding positions will make
theoretic potential flooding areas. From the theoretic potential flooding areas, a
polygon layer will be created. However, all positions where are lower than sea level
are not flooding areas because below sea level is necessary condition but is not
sufficient condition for a position becomes real potential flooding. To be a real
potential flooding position it must touch to connection system of sea water called
connection system layer such as rivers, canals, drainage system connected to canals or
rivers that is also the sufficient condition for a theoretic potential flooding position to
be real one. In order to identify which polygon of the theoretic potential flooding
areas, the research applies spatial analysis tool with function touch between the
theoretic potential flooding area layer and connection system layers. If the polygons of
theoretic potential flooding area layer touch with the connection system layer, those
polygons are real potential flooding areas.
Besides purpose to define the flooded areas, the flow chart is main procedure for
producing other flood characteristics. Because of different elevation of the terrain,
flooded areas at different tide levels are not the same. Therefore, the flow chart is run
for each of loops in the computing and identifying procedure of the flood
characteristics at each of interested tide levels.
Normally a flood has some characteristics that are used to assess risks of the flood
including depth, area, duration, flow speed and frequency. In the research, the maps
are flooded area, flooding depth, duration and frequency. The flood flow speed is not
able to define because flood model applied has not the function and additionally
flooding in Ho Chi Minh City is caused by tide level so that the flow speed is very
weak. These maps have a relationship with each other. With flooding is caused by
rising tide, the tide level has constraint with three characteristics: flooded areas, depth
and duration. The tide level is higher the flooded areas is larger, the flooding depth is
deeper and flooding duration is longer. The terrain elevation is not only correlation
Chapter 4. Building Flood Model and Flooding Maps
Tran Thong Nhat 40
with above three characteristics but it also does with the frequency if consideration of
each position on the terrain. The terrain elevation is lower, the frequency is higher.
These combinations will expose vulnerability and risk of flood.
6. Results of flood model and flooding maps
6.1. Digital Terrain model and drainage system
In general, terrain in Ho Chi Minh City is flat and does not change very much. Almost
elevation of the city is below 2.0m referred to Vietnamese vertical coordinate system.
There are some zones that have some hills and the old city center located in west
northern and east northern regions is above 2.0m. These zones are not connected
continuously and they are separated by canal and river sub catchments where low
lands are.
The city dyke system is developed much more in the recent years to reduce flood
impact on manufactory and living activities of residents caused by high tides. The
system includes main dykes along main rivers such as Sai Gon River and canals. They
are connected to the dykes of irrigation in the fields to protect agricultural lands in the
west and west northern regions. The dyke system builds protection constructions for
the residential and manufactory areas. Moreover, at the out-inlet of the canals, there
are a lot of gates to control water flow from rivers into the canals so that tide level in
the canals is not too high for making a flood. In the figure 4.3, the dyke system is
concentrated in the west regions with agricultural land use, some residential zones in
the northern and west southern. Further, the dyke system combines and joins with the
street system so that a protection network for tide flood is available in those areas.
The result of the DTM that presents all elevation information of the ground objects
such as roads and buildings has some differences to the available researches in Ho Chi
Minh City. In the available researches that consider of flood phenomenon in Ho Chi
Minh City they are used DEM that is raster format for input to present the ground
surface to implement of a flood model to determine floodplain, depth and other
characteristics (ADB, 2009a; ADB, 2009b; Nhat, 2011; Storch & Downes, 2011; WB,
2010). However DEM is not able to integrate the ground objects that have the size
smaller than the resolution of the DEM such as streets, dikes…. As a result the output
of the flood model will not have high accuracy especially with flood caused by high
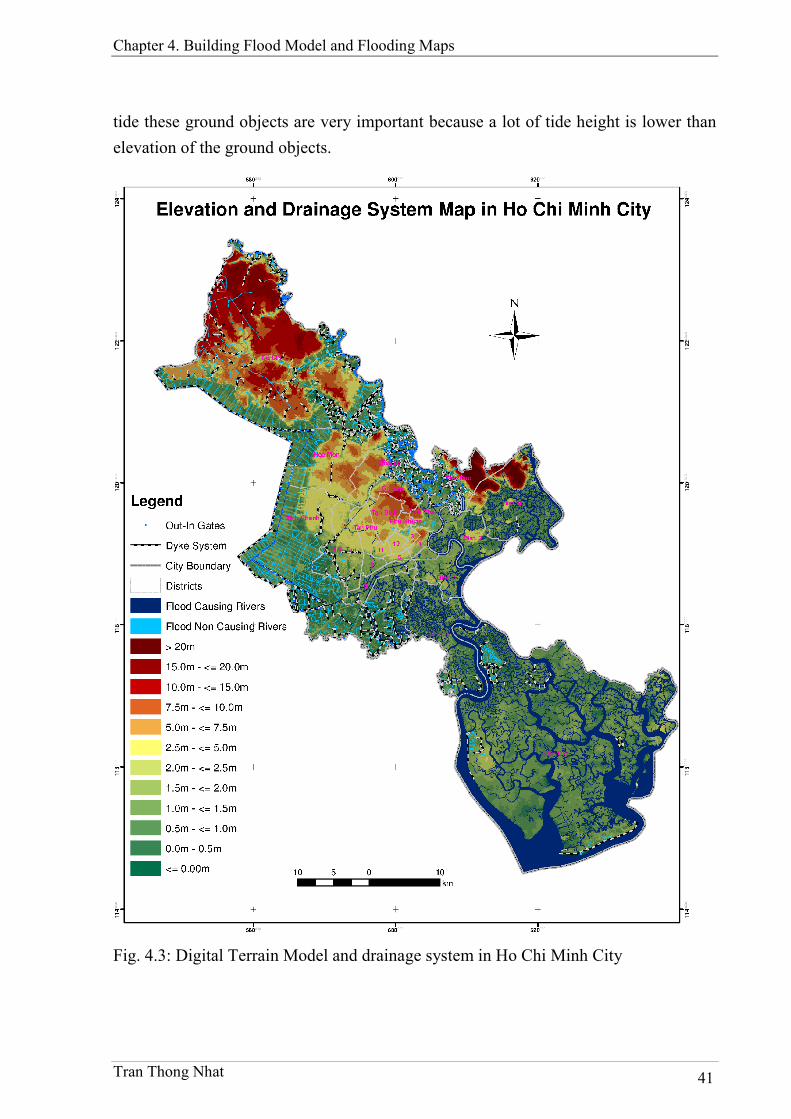
Chapter 4. Building Flood Model and Flooding Maps
Tran Thong Nhat 41
tide these ground objects are very important because a lot of tide height is lower than
elevation of the ground objects.
Fig. 4.3: Digital Terrain Model and drainage system in Ho Chi Minh City
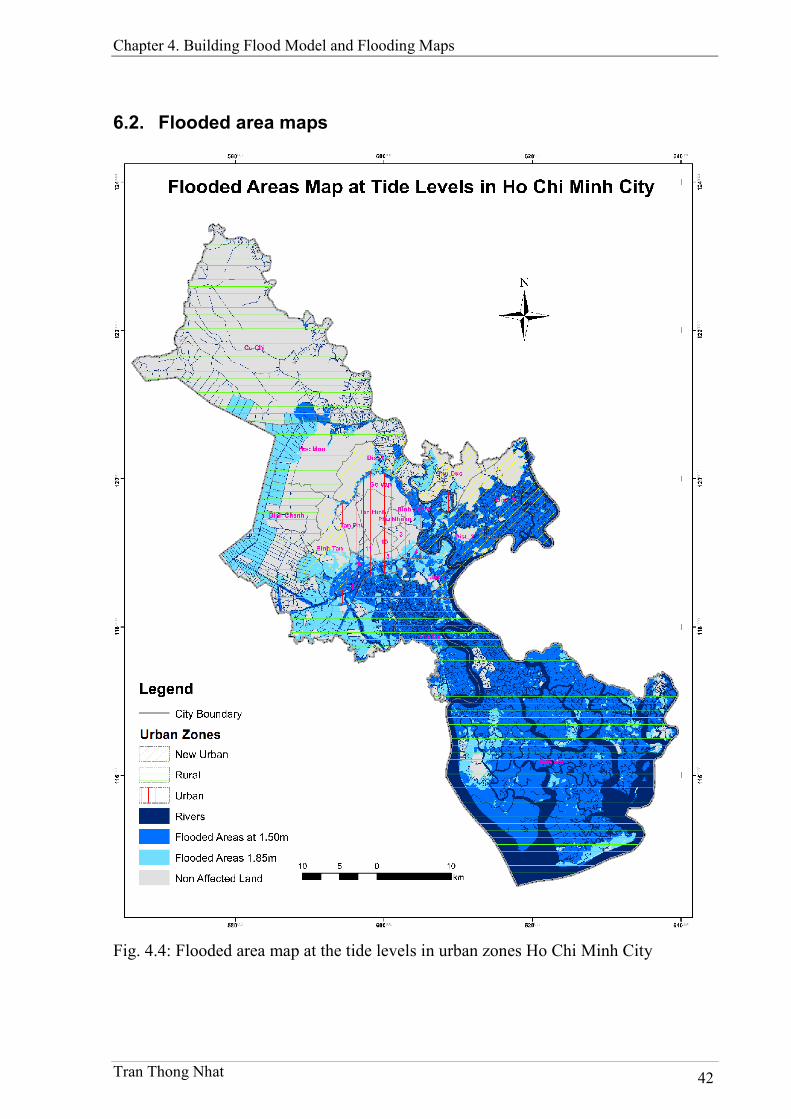
Chapter 4. Building Flood Model and Flooding Maps
Tran Thong Nhat 42
6.2. Flooded area maps
Fig. 4.4: Flooded area map at the tide levels in urban zones Ho Chi Minh City
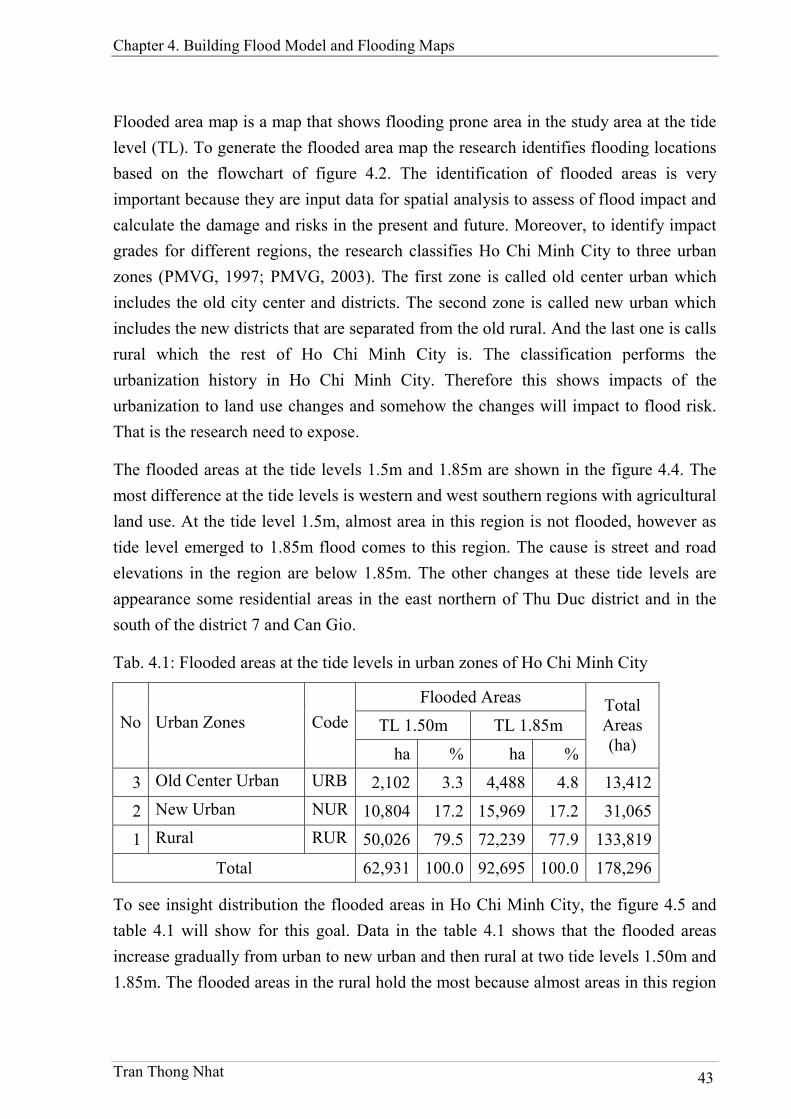
Chapter 4. Building Flood Model and Flooding Maps
Tran Thong Nhat 43
Flooded area map is a map that shows flooding prone area in the study area at the tide
level (TL). To generate the flooded area map the research identifies flooding locations
based on the flowchart of figure 4.2. The identification of flooded areas is very
important because they are input data for spatial analysis to assess of flood impact and
calculate the damage and risks in the present and future. Moreover, to identify impact
grades for different regions, the research classifies Ho Chi Minh City to three urban
zones (PMVG, 1997; PMVG, 2003). The first zone is called old center urban which
includes the old city center and districts. The second zone is called new urban which
includes the new districts that are separated from the old rural. And the last one is calls
rural which the rest of Ho Chi Minh City is. The classification performs the
urbanization history in Ho Chi Minh City. Therefore this shows impacts of the
urbanization to land use changes and somehow the changes will impact to flood risk.
That is the research need to expose.
The flooded areas at the tide levels 1.5m and 1.85m are shown in the figure 4.4. The
most difference at the tide levels is western and west southern regions with agricultural
land use. At the tide level 1.5m, almost area in this region is not flooded, however as
tide level emerged to 1.85m flood comes to this region. The cause is street and road
elevations in the region are below 1.85m. The other changes at these tide levels are
appearance some residential areas in the east northern of Thu Duc district and in the
south of the district 7 and Can Gio.
Tab. 4.1: Flooded areas at the tide levels in urban zones of Ho Chi Minh City
Flooded Areas
TL 1.50m TL 1.85m No Urban Zones Code
ha % ha %
Total Areas (ha)
3 Old Center Urban URB 2,102 3.3 4,488 4.8 13,412
2 New Urban NUR 10,804 17.2 15,969 17.2 31,065
1 Rural RUR 50,026 79.5 72,239 77.9 133,819
Total 62,931 100.0 92,695 100.0 178,296
To see insight distribution the flooded areas in Ho Chi Minh City, the figure 4.5 and
table 4.1 will show for this goal. Data in the table 4.1 shows that the flooded areas
increase gradually from urban to new urban and then rural at two tide levels 1.50m and
1.85m. The flooded areas in the rural hold the most because almost areas in this region

Chapter 4. Building Flood Model and Flooding Maps
Tran Thong Nhat 44
are mango forest in Can Gio rural district and rice - crop fields in southern regions of
Binh Chanh rural district.
The flooded area in the rural at tide level 1.50m makes up 80%, that of in the new
urban does 17% and 3% that in urban does. This shows that at the tide level 1.50m
almost flooded area is agricultural land in the southern regions so that it only impacts
to farmers who do on the rice –crop fields. At tide level 1.85m, the flooded area
distribution is similar to at the tide level 1.50m. In the rural, the flooded areas is also
major and then that is less than in new urban and the least one is urban with making up
for each of them ordinarily 78%, 17% and 5%. There are changes with few percents of
the flooded areas are reduced in the rural and increased in the urban.
Flooded Areas at Tide Levels in Urban Zones of Ho Chi Minh City
0
10
20
30
40
50
60
70
80x 103
ha
Old Center Urban 2102 4488
New Urban 10804 15969
Rural 50026 72239
Tide level 1.50m (ha) Tide level 1.85m (ha)
Fig. 4.5: Flooded areas at the tide levels in urban zones of Ho Chi Minh City
Therefore, there is an augmentation of flooded area. At tide level 1.85m the flooded
area is nearly 1.5 times as much as that does at tide level 1.50m. When the tide level
comes higher, each of the urban zones is raised flooded area as shown in the chart of
figure 4.5 and the table 4.1. About absolute values, the flooded area in rural is
extended the most and that does the least in urban. In the rural, flooded area is
extended in western regions of Binh Chanh rural district. The root is there are roads
which have elevation that is higher tide level 1.50m but their elevations are lower than
1.85m so that those regions are flooded when tide level reaches to 1.85m. However,
percentage increasing of flooded area in urban is the most with 2.1 times. The root is
there are many district in urban with low lands in Binh Thanh, District 4 but the low
Chapter 4. Building Flood Model and Flooding Maps
Tran Thong Nhat 45
lands are protected by the roads at tide level 1.50m and at tide level 1.85m they will be
new extended flooded areas.
6.3. Flooding depth modeling for the research
Flooding deep map is a map that shows depth values of flooding prone areas in the
study area at the specific tide level. The depth values are vertical differences between
terrain elevation and tide level. Similarly to duration map of flooding, the element of
depth of flooding will bring more information to assess the extent of flood risk to the
probability of the human loss and property damage caused by flooding.
6.3.1 Method
The flooding depth can be calculated differently by types of applied flood model. For
the flood models that use hydraulic model when wave equations are solved the
flooding depth at each pixel of DEM is known (Aronica, Tucciarelli and Nasello,
1998; Horritt & Bates, 2002; Lai, 2005; Nien, 1996; NSWDOC-MHL, 2006). For the
flood models that do not use any hydraulic model, the flooding depth is computed
based on DEM and water level at each pixel of DEM if DEM is used as an input
(Bates, 2004; Bates & De Roo, 2000; Nhat, 2011). With the second case, the flooding
depth is carried out very simply in a GIS environment. Because of this reason, some
researches when computation of the flooding depth a convert from TIN to DEM is
preprocess. However, this processing will lose accuracy of the TIN. To keep the
strength point of the TIN, this research computes flooding depth directly from TIN that
there is not converted from TIN to DEM. The procedure is conducted as followings.
To determine flooding depth, the model uses the difference between interested tide
level and terrain elevation in TIN. The interested regions for computation of flooding
depth are the flooded areas where are defined as shown in the flowchart 4.2.
The computation process of the flooding depth includes following steps. Based on
TIN, the terrain elevation is presented. At the interested tide level Ht, the flooding
depth is calculated by using Ht subtracts terrain elevation. If the different values are
positive that means the terrain elevation is lower than Ht and if the different values are
negative that means the terrain elevation is higher than Ht. The regions whose different
values are positive are able to inundate. However if the regions are connected to the
rivers and canals causing flood they are the flooded areas. By run the flowchart 4.2 for
Chapter 4. Building Flood Model and Flooding Maps
Tran Thong Nhat 46
these regions the result will determine the flooded areas enclosed the different values
or the flooding depth.
Thus in the TIN to compute flooding depth and make a flooding depth map the first
step is determination the grades that provide the boundaries of the flooding depth for
each grade. And then based on the boundaries of the each grade, a computation at a
flooding depth for each grade is carried out. And consequently, when completing of
the computation, the regions matching to each grade of the flooding depth will be
created. The dividing the flooding depth grades in the research are described and
explained in the section 6.3.2.
6.3.2 Result and discussion
To be convenient in the flood risk assessment, the research classifies of flooding depth
to depth grades. These depth grades are based on dangerous levels to human being in
the study area. Consequently, there are four depth grades are considered.
Depth grade 1 (D1): In the grade, the depth is above 0.0m and below 0.5m.
This is the least dangerous to the human being there.
Depth grade 2 (D2): In the grade, the depth is from 0.5m to below 1.2m.
This is the grade that can be dangerous to children and elderly people.
Depth grade 3 (D3): In the grade, the depth is from 1.2m to below 1.8m.
This is the grade that does not only damage properties but also is
dangerous to almost human living there.
Depth grade 4 (D4): In the grade the depth is more 1.8m. Almost people
can not living in this area if there is not any preparation for life conditions
when flood appears.
Separation of the flooding depth characteristic to different grades is to assess reliability
of human and properties that are impacted by flood in the study area. This is
distinguished of this research with the available researches. The available researches,
the flooding depth is also divided to the grades but they only aim to display on maps
(ADB, 2009a; ADB, 2009b; ADB, 2009c; WB, 2010) and not for assessment of flood
risk grades to the human being or the properties.

Chapter 4. Building Flood Model and Flooding Maps
Tran Thong Nhat 47
In order to identify impact depth grades of the flood risk for different regions, the
depth characteristic will be assessed based on three urban zones similar to flooded
area. The first zone is called old center urban which includes the old city center and
districts. The second zone is called new urban which includes the new districts that are
separated from the old rural (PMVG, 1997; PMVG, 2003). And the last one is calls
rural which the rest of Ho Chi Minh City is. The classification performs the
urbanization history in Ho Chi Minh City. Therefore this shows impacts of the
urbanization to land use changes and somehow the changes will impact to flood risk.
That is the research need to expose.
From the figure 4.6 and table 4.2, at the tide level 1.50m the most of flooded areas are
flooding depth grade 1 and 2 with more than 98%, and the major portion for each of
them is concentrated in the forest and field areas. The residential areas are not too
much impacted. The grade 3 and grade 4 are very small parts distribution in the areas
closing with the rivers. This shows at the tide level no much dangerousness relates to
human living there.
Tab. 4.2: Flooded areas of flooding depth grades at the tide levels in Ho Chi Minh City
Flooded Areas
TL 1.5m TL 1.85m No Depth Code
ha % ha %
1 0 -0.5m D1 30,771 48.9 21,687 23.4
2 0.5 - 1.2m D2 31,033 49.3 54,150 58.4
3 1.2 -1.8m D3 1,058 1.7 16,634 17.9
4 Deeper 1.8m D4 69 0.1 224 0.2
Total 62,931 100.0 92,695 100.0
With the tide level 1.85m, flooded area percentage of the depth grade 1 is reduced to
23% but there is a significant change in the grade 2 to 58% and grade 3 is also
increased to 18%. That shows flood risk is increasing much. Besides, grade 4 also
increase if compared with the tide level 1.5m. A notice is flooded areas of depth grade
1 reduced but that of the grade 2 and the grade 3 speeded up. That means elevation in
the flooded regions is very low but the regions are not inundated because of the roads.
But the roads can not help for the regions prevented when tide level reach 1.85m so
that the regions come to deep flooded areas. Almost flooded area of the depth grades is
extended exceptionally that of the depth grade 1 is reduced when tide rising from
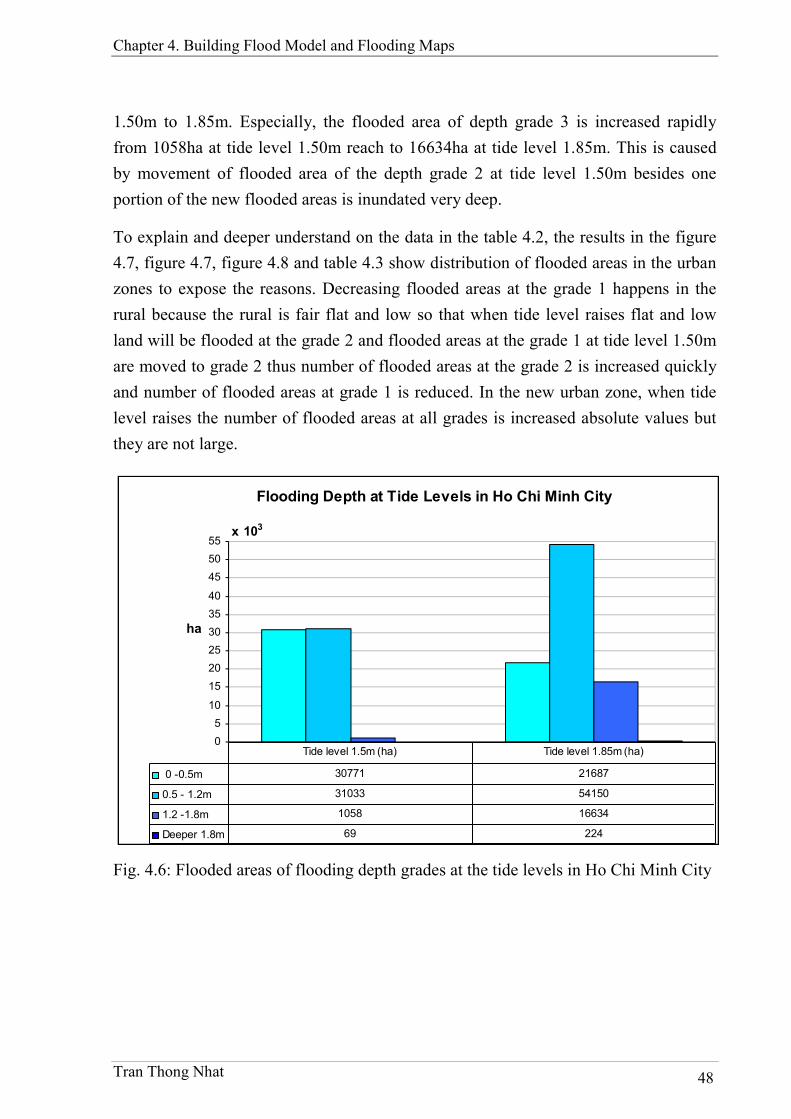
Chapter 4. Building Flood Model and Flooding Maps
Tran Thong Nhat 48
1.50m to 1.85m. Especially, the flooded area of depth grade 3 is increased rapidly
from 1058ha at tide level 1.50m reach to 16634ha at tide level 1.85m. This is caused
by movement of flooded area of the depth grade 2 at tide level 1.50m besides one
portion of the new flooded areas is inundated very deep.
To explain and deeper understand on the data in the table 4.2, the results in the figure
4.7, figure 4.7, figure 4.8 and table 4.3 show distribution of flooded areas in the urban
zones to expose the reasons. Decreasing flooded areas at the grade 1 happens in the
rural because the rural is fair flat and low so that when tide level raises flat and low
land will be flooded at the grade 2 and flooded areas at the grade 1 at tide level 1.50m
are moved to grade 2 thus number of flooded areas at the grade 2 is increased quickly
and number of flooded areas at grade 1 is reduced. In the new urban zone, when tide
level raises the number of flooded areas at all grades is increased absolute values but
they are not large.
Flooding Depth at Tide Levels in Ho Chi Minh City
0
5
10
15
20
25
30
35
40
45
50
55x 103
ha
0 -0.5m 30771 21687
0.5 - 1.2m 31033 54150
1.2 -1.8m 1058 16634
Deeper 1.8m 69 224
Tide level 1.5m (ha) Tide level 1.85m (ha)
Fig. 4.6: Flooded areas of flooding depth grades at the tide levels in Ho Chi Minh City
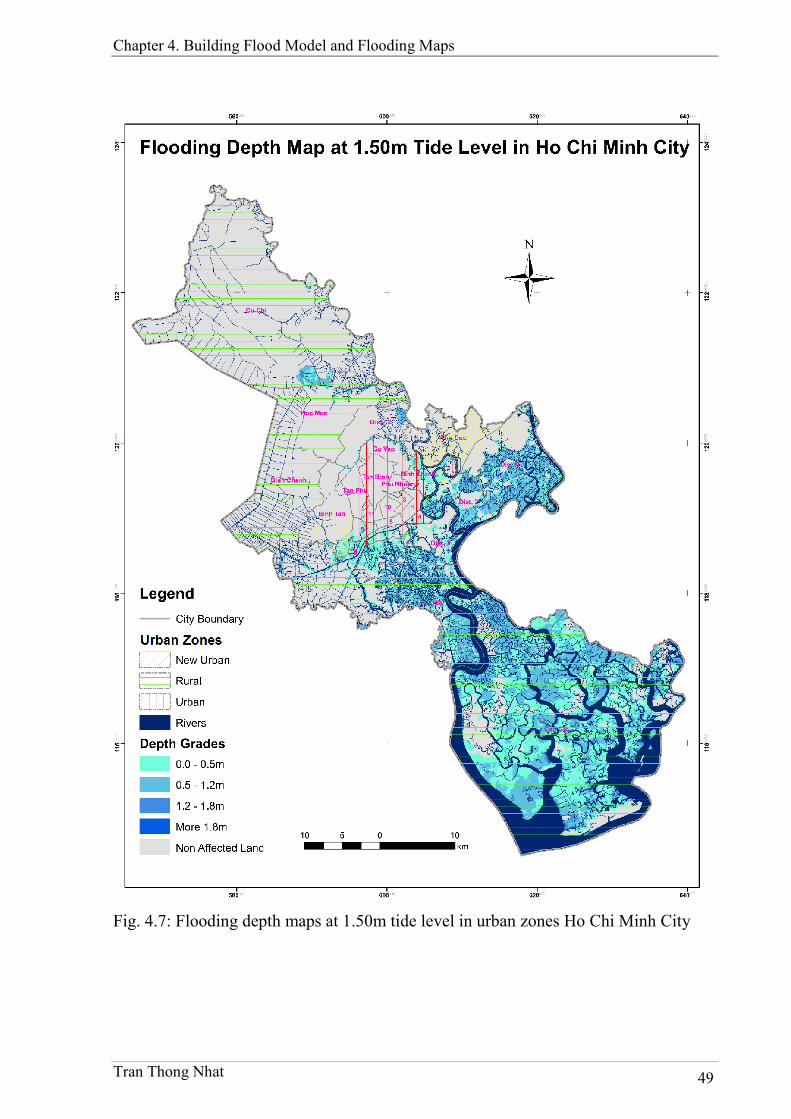
Chapter 4. Building Flood Model and Flooding Maps
Tran Thong Nhat 49
Fig. 4.7: Flooding depth maps at 1.50m tide level in urban zones Ho Chi Minh City
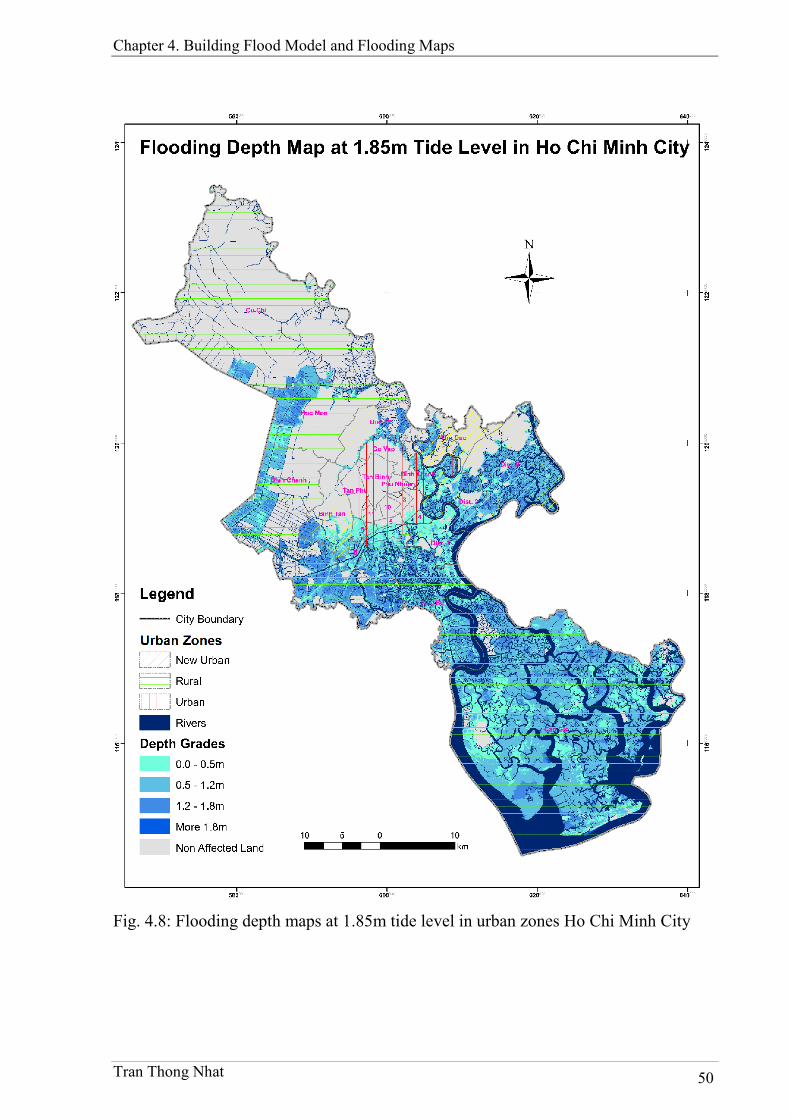
Chapter 4. Building Flood Model and Flooding Maps
Tran Thong Nhat 50
Fig. 4.8: Flooding depth maps at 1.85m tide level in urban zones Ho Chi Minh City

Chapter 4. Building Flood Model and Flooding Maps
Tran Thong Nhat 51
The flooded area at grade 3 is increased strongly in all the urban zones at tide level
1.85m. The first reason is the old center urban at the tide level 1.50m flooded areas at
grade 1 and grade 2 are moved to grade 3 at the tide level 1.85m and more new
flooded areas at tide level 1.85m are low land in Binh Thanh District, District 8,
District 6 and District 4 so that the new flooded areas are inundated deep in the grade
3. The second reason is the rural and new urban are low land so that the new flooded
areas will be inundated deep at the grade 3. The last reason is protection of roads for
the new flooded areas at tide level 1.50m but when tide level raises the roads can not
ensure for the low land preventing inundation and the areas will be deep flooded at the
grade 3 (shown in figure 4.7 and figure 4.8).
Tab. 4.3: Flooded areas of flooding depth grades at the tide levels in urban zones of Ho
Chi Minh City
Flooded Areas
TL1.50m TL 1.85m No Urban Zones Depth Code
ha % ha %
1 Rural 0 -0.5m RUR-D1 25,178 40.0 15,137 16.3
2 Rural 0.5 - 1.2m RUR-D2 24,007 38.1 44,309 47.8
3 Rural 1.2 -1.8m RUR-D3 772 1.2 12,588 13.6
4 Rural Deeper 1.8m RUR-D4 68 0.1 204 0.2
5 New Urban 0 -0.5m NUR-D1 3,821 6.1 3,996 4.3
6 New Urban 0.5 - 1.2m NUR-D2 6,700 10.6 8,169 8.8
7 New Urban 1.2 -1.8m NUR-D3 282 0.4 3,785 4.1
8 New Urban Deeper 1.8m NUR-D4 1 0.0 19 0.0
9 Old Center Urban 0 -0.5m URB-D1 1,772 2.8 2,554 2.8
10 Old Center Urban 0.5 - 1.2m URB-D2 326 0.5 1,673 1.8
11 Old Center Urban 1.2 -1.8m URB-D3 4 0.0 261 0.3
12 Old Center Urban Deeper 1.8m URB-D4 0 0.0 0 0.0
Total 62,931 100.0 92,695 100.0
Based on the results once again the terrain is not much fluctuation so that when the
tidal height change flooded area has a significant rise. A note is new flooded areas are
concentrated in the residential regions although flooding depth is grade 1 but people
living there need to be careful for their activities.
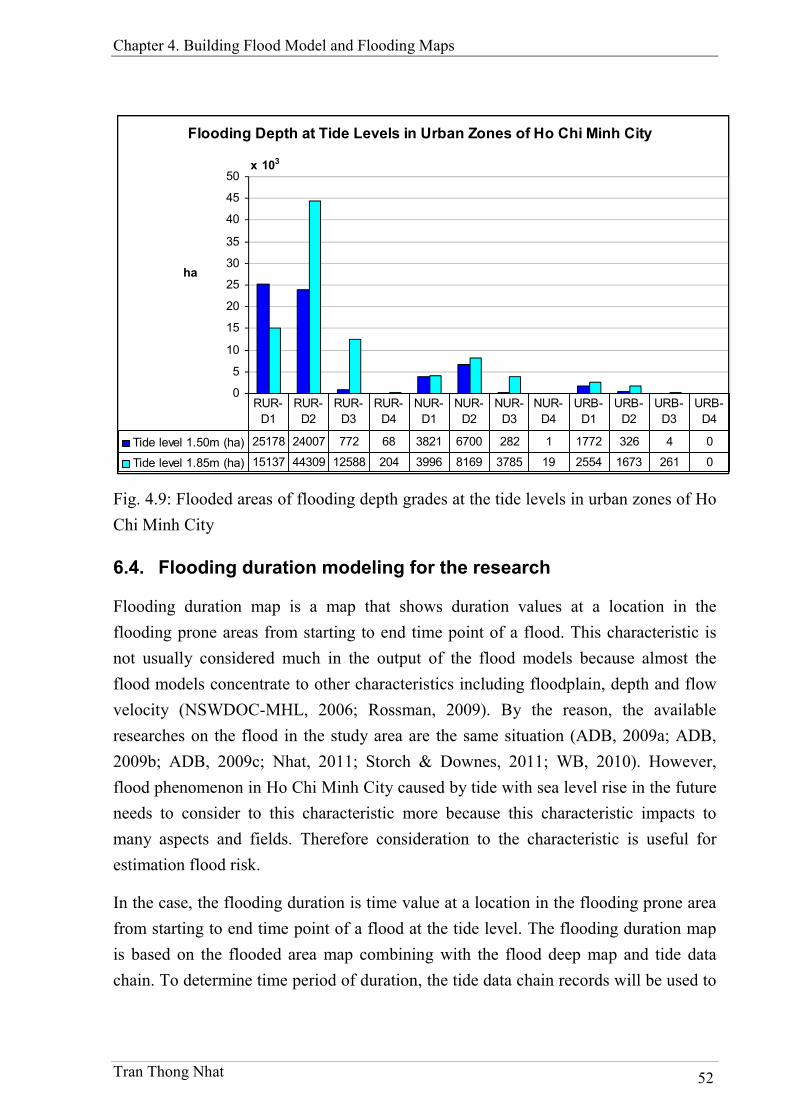
Chapter 4. Building Flood Model and Flooding Maps
Tran Thong Nhat 52
Flooding Depth at Tide Levels in Urban Zones of Ho Chi Minh City
0
5
10
15
20
25
30
35
40
45
50x 103
ha
Tide level 1.50m (ha) 25178 24007 772 68 3821 6700 282 1 1772 326 4 0
Tide level 1.85m (ha) 15137 44309 12588 204 3996 8169 3785 19 2554 1673 261 0
RUR-
D1
RUR-
D2
RUR-
D3
RUR-
D4
NUR-
D1
NUR-
D2
NUR-
D3
NUR-
D4
URB-
D1
URB-
D2
URB-
D3
URB-
D4
Fig. 4.9: Flooded areas of flooding depth grades at the tide levels in urban zones of Ho
Chi Minh City
6.4. Flooding duration modeling for the research
Flooding duration map is a map that shows duration values at a location in the
flooding prone areas from starting to end time point of a flood. This characteristic is
not usually considered much in the output of the flood models because almost the
flood models concentrate to other characteristics including floodplain, depth and flow
velocity (NSWDOC-MHL, 2006; Rossman, 2009). By the reason, the available
researches on the flood in the study area are the same situation (ADB, 2009a; ADB,
2009b; ADB, 2009c; Nhat, 2011; Storch & Downes, 2011; WB, 2010). However,
flood phenomenon in Ho Chi Minh City caused by tide with sea level rise in the future
needs to consider to this characteristic more because this characteristic impacts to
many aspects and fields. Therefore consideration to the characteristic is useful for
estimation flood risk.
In the case, the flooding duration is time value at a location in the flooding prone area
from starting to end time point of a flood at the tide level. The flooding duration map
is based on the flooded area map combining with the flood deep map and tide data
chain. To determine time period of duration, the tide data chain records will be used to
Chapter 4. Building Flood Model and Flooding Maps
Tran Thong Nhat 53
define tide height relating with its time. The element of duration of flooding will bring
more information to assess the extent of flood risk to the probability of the human loss
and property damage caused by flooding.
6.4.1 Method
For the flooding duration, processing is more complicated because requirement of
combination between tide duration, tide level and terrain elevation in TIN. This
processing requires a consideration of continuous tide level in a cycle on duration
progress to determine starting time and ending time of a flooded location.
The computation process of the flooding duration includes following steps. The first
step is analysis of progress for tide level and duration. At each interested tide level Ht.
the first one records starting time Ts when the tide level reaches Ht on the increasing
tide level of the cycle. Similarly on the decreasing tide level of the cycle, when the tide
level comes down to Ht, ending time Te is recorded. The flooding duration at tide level
Ht of a location is computed by subtracting Te with Ts. The process is conducted for all
tide levels and as a result, a table which shows relationship between tide level H and
duration T called table H-T is created. Then a join between the tables H-T to terrain
elevation TIN is implemented so that each of location in terrain is connected to a
duration value. At each of interested tide level of the research, the flowchart 4.1 is run.
This step is carried out because of elimination of locations where is not one of the
flooded areas at the tide level.
The process of this flood characteristic is very complicated because it needs much
more time and computation cost than flooding depth characteristic besides there are
many tide levels matching to terrain elevation and at each of the tide level the
flowchart 4.2 must be run to attach flooding duration value to the terrain elevation.
6.4.2 Result and discussion
Similarly to the depth characteristic of flood, because of convenience of assessment
the research classifies of flooding duration to grades. These duration grades are based
on impact levels to living activities of the residents in the study area. Consequently,
there are five depth grades are considered.
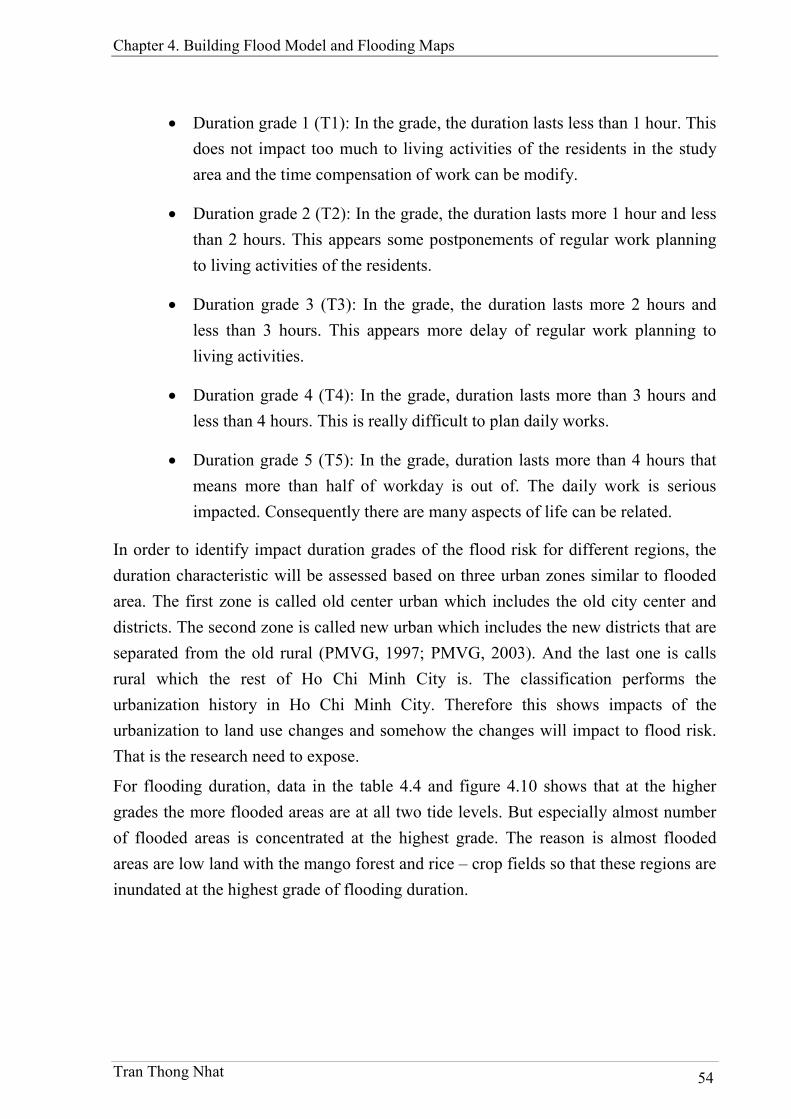
Chapter 4. Building Flood Model and Flooding Maps
Tran Thong Nhat 54
Duration grade 1 (T1): In the grade, the duration lasts less than 1 hour. This
does not impact too much to living activities of the residents in the study
area and the time compensation of work can be modify.
Duration grade 2 (T2): In the grade, the duration lasts more 1 hour and less
than 2 hours. This appears some postponements of regular work planning
to living activities of the residents.
Duration grade 3 (T3): In the grade, the duration lasts more 2 hours and
less than 3 hours. This appears more delay of regular work planning to
living activities.
Duration grade 4 (T4): In the grade, duration lasts more than 3 hours and
less than 4 hours. This is really difficult to plan daily works.
Duration grade 5 (T5): In the grade, duration lasts more than 4 hours that
means more than half of workday is out of. The daily work is serious
impacted. Consequently there are many aspects of life can be related.
In order to identify impact duration grades of the flood risk for different regions, the
duration characteristic will be assessed based on three urban zones similar to flooded
area. The first zone is called old center urban which includes the old city center and
districts. The second zone is called new urban which includes the new districts that are
separated from the old rural (PMVG, 1997; PMVG, 2003). And the last one is calls
rural which the rest of Ho Chi Minh City is. The classification performs the
urbanization history in Ho Chi Minh City. Therefore this shows impacts of the
urbanization to land use changes and somehow the changes will impact to flood risk.
That is the research need to expose.
For flooding duration, data in the table 4.4 and figure 4.10 shows that at the higher
grades the more flooded areas are at all two tide levels. But especially almost number
of flooded areas is concentrated at the highest grade. The reason is almost flooded
areas are low land with the mango forest and rice – crop fields so that these regions are
inundated at the highest grade of flooding duration.

Chapter 4. Building Flood Model and Flooding Maps
Tran Thong Nhat 55
Tab. 4.4: Flooded areas of flooding duration grades at the tide levels in Ho Chi Minh
City
Flooded Areas
TL 1.50m TL 1.85m No Frequency Code
ha % ha %
1 Less 1 t/m F1 10,089 16.0 12,966 14.0
2 1 - 3 t/m F2 5,336 8.5 6,302 6.8
3 3 - 7 t/m F3 6,679 10.6 10,505 11.3
4 More 7 t/m F4 40,827 64.9 62,921 67.9
Total 62,931 100.0 92,695 100.0
There is increases flooded area at almost of flooding duration grade when tidal level
changes from 1.5m to 1.85m exceptionally grade 1. This result points out the
developing flooded areas at tide level 1.85m in regions where are higher than 1.50m
are not so much or other words in Ho Chi Minh City there is not so much land where
has ground elevation higher than 1.50m.
Flooding Duration at Tide Levels in Ho Chi Minh City
0
10
20
30
40
50
60
70
80x 103
ha
Less 1h 609 370
1 - 2h 3713 6355
2 - 3h 5767 6241
3 - 4h 9063 11174
More 4h 43779 68555
Tide level 1.50m (ha) Tide level 1.85m (ha)
Fig. 4.10: Flooded areas of flooding duration grades at the tide levels in Ho Chi Minh
City

Chapter 4. Building Flood Model and Flooding Maps
Tran Thong Nhat 56
Moreover, the new flooded areas are almost low land and protected by roads whose
heights are not so different with tide level 1.50m so that the number of the new
flooded areas at grade 4 at tide level 1.80m equals to 1.5 time as many as that of tide
level 1.50m.
Tab. 4.5: Flooded areas of flooding duration grades at the tide levels in urban zones of
Ho Chi Minh City
Flooded Areas
TL 1.50m TL 1.85m No Urban Zones Duration Code
ha % ha %
1 Rural Less 1h RUR-T1 410 0.7 96 0.1
2 Rural 1 - 2h RUR-T2 2,668 4.2 5,165 5.6
3 Rural 2 - 3h RUR-T3 4,486 7.1 4,079 4.4
4 Rural 3 - 4h RUR-T4 7,496 11.9 8,384 9.0
5 Rural More 4h RUR-T5 34,966 55.6 54,515 58.8
6 New Urban Less 1h NUR-T1 147 0.2 235 0.3
7 New Urban 1 - 2h NUR-T2 612 1.0 771 0.8
8 New Urban 2 - 3h NUR-T3 796 1.3 1,644 1.8
9 New Urban 3 - 4h NUR-T4 1,035 1.6 1,855 2.0
10 New Urban More 4h NUR-T5 8,214 13.1 11,464 12.4
11 Old Center Urban Less 1h URB-T1 53 0.1 39 0.0
12 Old Center Urban 1 - 2h URB-T2 434 0.7 420 0.5
13 Old Center Urban 2 - 3h URB-T3 484 0.8 518 0.6
14 Old Center Urban 3 - 4h URB-T4 532 0.8 936 1.0
15 Old Center Urban More 4h URB-T5 599 1.0 2,576 2.8
Total 62,931 100.0 92,695 100.0
To explain and deeper understand which urban zones are impacted on the flooding
duration, the results in the figure 4.11, figure 4.12, figure 4.13 and table 4.5 answer
and expose this matter. As above mentions, the rural zones are inundated in the
mangrove forest and rice – crop fields. And similarly the new urban zones are
inundated in the low rice – crop fields. Therefore, the figure 4.11 and table 4.5 show
flooded areas of the high flooding duration grades in the new urban zones more than
that of the old center urban. Moreover number of flooded areas at the higher grades is
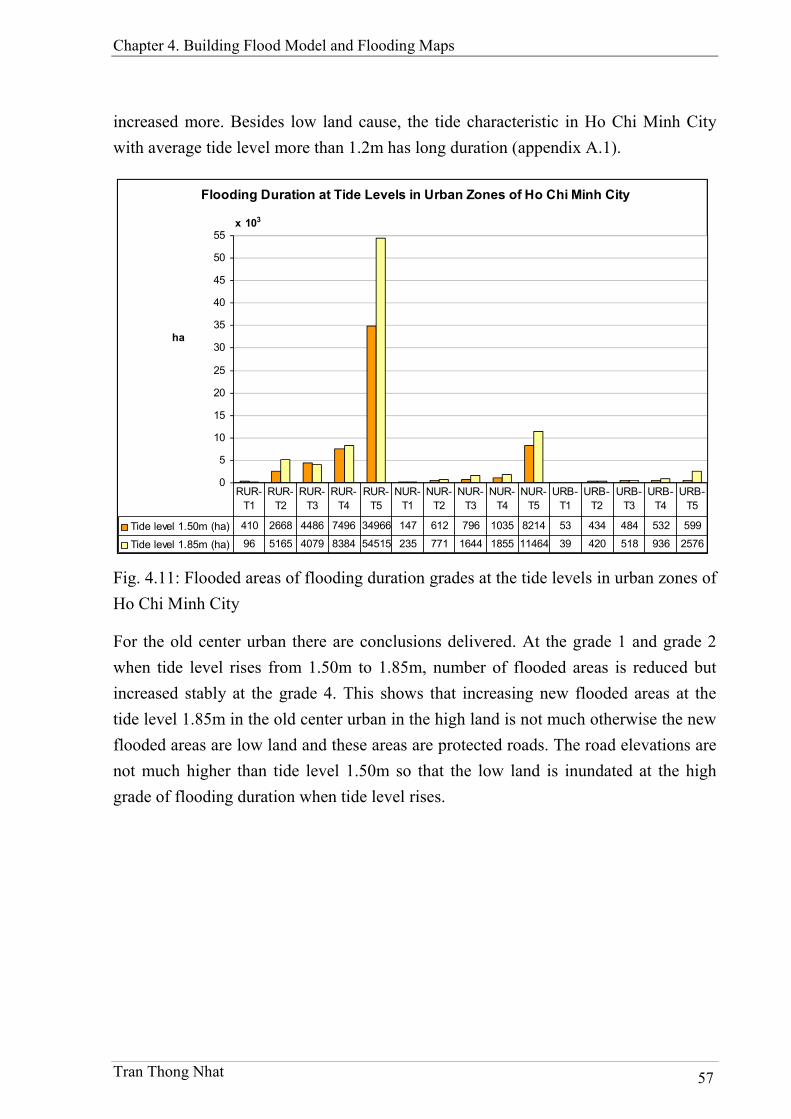
Chapter 4. Building Flood Model and Flooding Maps
Tran Thong Nhat 57
increased more. Besides low land cause, the tide characteristic in Ho Chi Minh City
with average tide level more than 1.2m has long duration (appendix A.1).
Flooding Duration at Tide Levels in Urban Zones of Ho Chi Minh City
0
5
10
15
20
25
30
35
40
45
50
55x 103
ha
Tide level 1.50m (ha) 410 2668 4486 7496 34966 147 612 796 1035 8214 53 434 484 532 599
Tide level 1.85m (ha) 96 5165 4079 8384 54515 235 771 1644 1855 11464 39 420 518 936 2576
RUR-
T1
RUR-
T2
RUR-
T3
RUR-
T4
RUR-
T5
NUR-
T1
NUR-
T2
NUR-
T3
NUR-
T4
NUR-
T5
URB-
T1
URB-
T2
URB-
T3
URB-
T4
URB-
T5
Fig. 4.11: Flooded areas of flooding duration grades at the tide levels in urban zones of
Ho Chi Minh City
For the old center urban there are conclusions delivered. At the grade 1 and grade 2
when tide level rises from 1.50m to 1.85m, number of flooded areas is reduced but
increased stably at the grade 4. This shows that increasing new flooded areas at the
tide level 1.85m in the old center urban in the high land is not much otherwise the new
flooded areas are low land and these areas are protected roads. The road elevations are
not much higher than tide level 1.50m so that the low land is inundated at the high
grade of flooding duration when tide level rises.
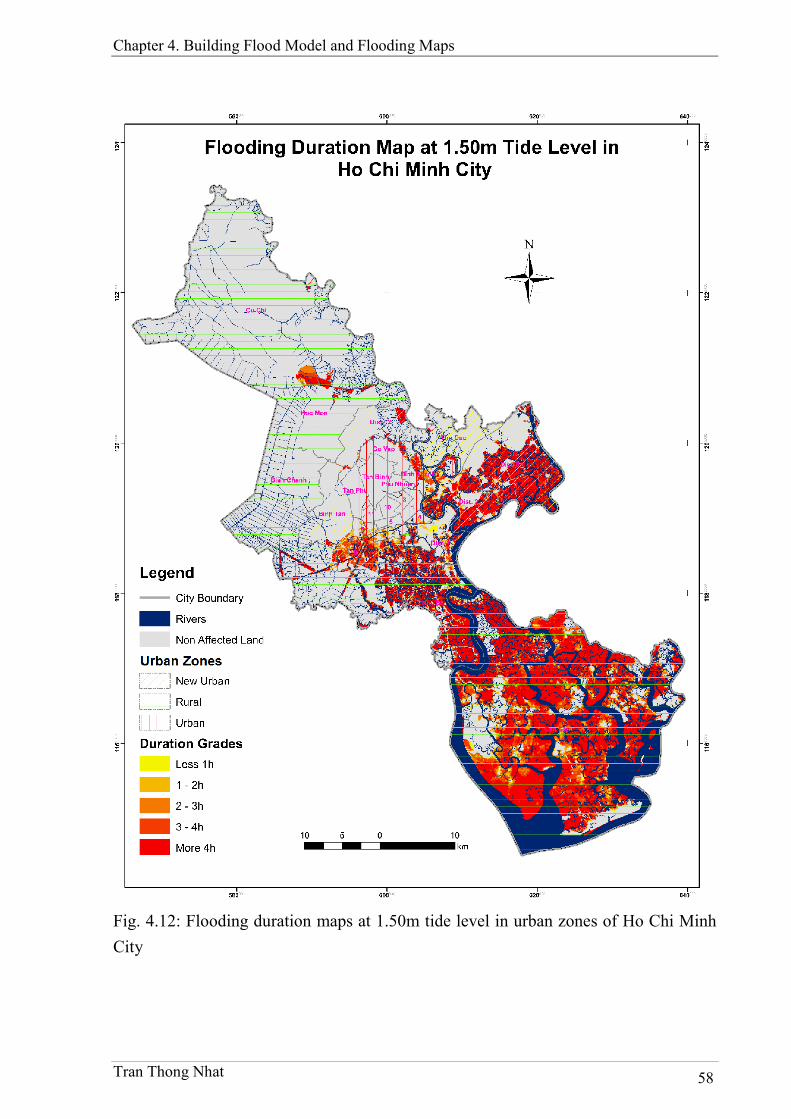
Chapter 4. Building Flood Model and Flooding Maps
Tran Thong Nhat 58
Fig. 4.12: Flooding duration maps at 1.50m tide level in urban zones of Ho Chi Minh
City
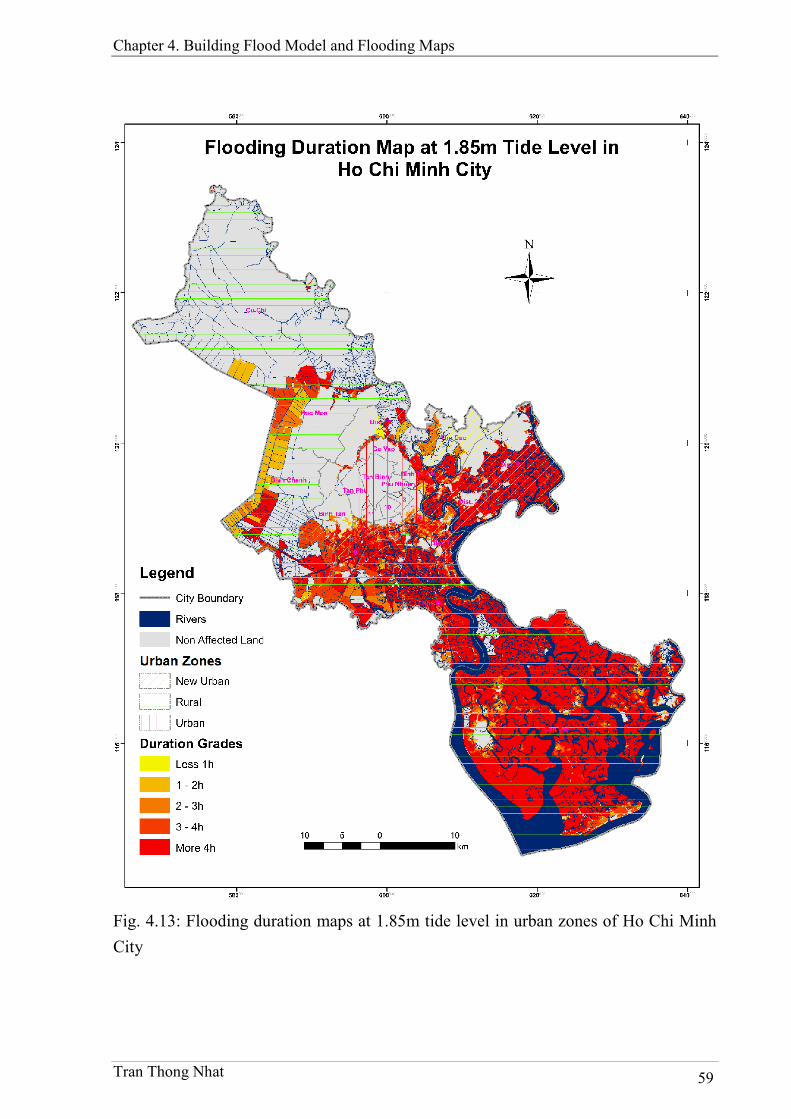
Chapter 4. Building Flood Model and Flooding Maps
Tran Thong Nhat 59
Fig. 4.13: Flooding duration maps at 1.85m tide level in urban zones of Ho Chi Minh
City
Chapter 4. Building Flood Model and Flooding Maps
Tran Thong Nhat 60
Generally, at the tide levels flooded areas are classified to the grade 4 that means
almost flooded areas is inundated for long time. However, these flooded areas shown
in figure 4.12 and figure 4.13 are located on the forest and agricultural land. These
regions are low lands and occupy many areas and as a result, these regions contribute
to flooded area at the grade 4. For the residential regions, the flooding duration is
grade 1. At the tide level 1.85m, a significant note for the residential regions in the
Binh Thanh District, District 4, District 6 and District 8 should be more careful
because the flooded areas in duration grade 4 increase rapidly.
6.5. Flooding frequency modeling for the research
Flooding frequency map is a map that shows frequent values in periods of time at
locations in the flooding prone areas. Usually, flooding frequency characteristic is only
interested with the appearance probability from observed data for a long time serial
and the probability is applied mainly for designing protection structures (NSWDOC-
MHL, 2006; Rossman, 2009). However, flood caused by tide is a phenomenon daily
appearing certainly. Therefore, the research is considering appearance number of flood
risk caused by tide based on the tide data record for time serial that is used to study
climate change in Ho Chi Minh City to determine sea level rise in the time period.
Depended on the tide height, the flooding frequency map is established based on the
floodplains of the flooded area map associated with frequency of tidal data chain at
different tide levels. Similarly to duration and depth maps of flooding, the element of
frequency of flooding will bring more information to assess the extent of flood risk to
the probability of the human loss and property damage caused by flooding.
6.5.1 Method
With the traditional researches on the flood phenomenon, the flooding frequency
characteristic is used for designing flood appearance probability depending on
requirements that the flood impacts to human, social aspects and properties. This
frequency is chosen from the past record serial of flood (NSWDOC-MHL, 2006;
Rossman, 2009). However, with flood caused by tide in the future combining with the
sea level rise, the flooding frequency characteristic needs to consider more detail. This
is difference of this research compared with the available researches (ADB, 2009a;
ADB, 2009b; ADB, 2009c; Nhat, 2011; Storch & Downes, 2011; WB, 2010).
Chapter 4. Building Flood Model and Flooding Maps
Tran Thong Nhat 61
Similarly to flooding duration characteristic, processing of the flooding frequency is
also complicated because requirement of combination between tide frequency, tide
level and terrain elevation in TIN. This processing requires a consideration of
continuous tide level in a cycle on duration progress to determine starting time and
ending time of a flooded location.
The computation process of the flooding frequency includes following steps. The first
step is calculation for tide peaks H and their appearances F. The process is conducted
for all peaks which appeared in the tide record data at the tide station for a period of
reference time for climate change. In the research, the period of reference time is from
1980 to 1999. As a result, a table which shows relationship between tide peaks H and
their frequency called table H-F is created. Then a join the table H-F to terrain
elevation TIN is implemented so that each of location in terrain is connected to a
frequency value. At each of interested tide level of the research, the flowchart 4.2 is
run. This step is carried out because of elimination of locations where is not one of the
flooded areas at the tide level.
The process of this flood characteristic is complicated because it needs much more
time and computation cost than flooding depth characteristic besides there are many
tide levels matching to terrain elevation and at each of the tide level the flowchart 4.2
must be run to attach flooding frequency value to the terrain elevation.
6.5.2 Result and discussion
Similarly to the other characteristics of flood, because of convenience of flood risk
assessment the research classifies of flooding frequency to grades. These frequency
grades are based on impact levels to living activities of the residents in the study area.
Consequently, there are four frequency grades are considered.
Frequency grade 1 (F1): In the grade, the frequency of flood appears less
than 1 time per month. This does not impact too much to living activities of
the residents in the study area.
Frequency grade 2 (F2): In the grade, the frequency of flood appears more
than 1 and less than 3 times per month. This begins to impact much about
living activities of the residents in the study area. The residents living in
the areas need solution for facing flood in their life.
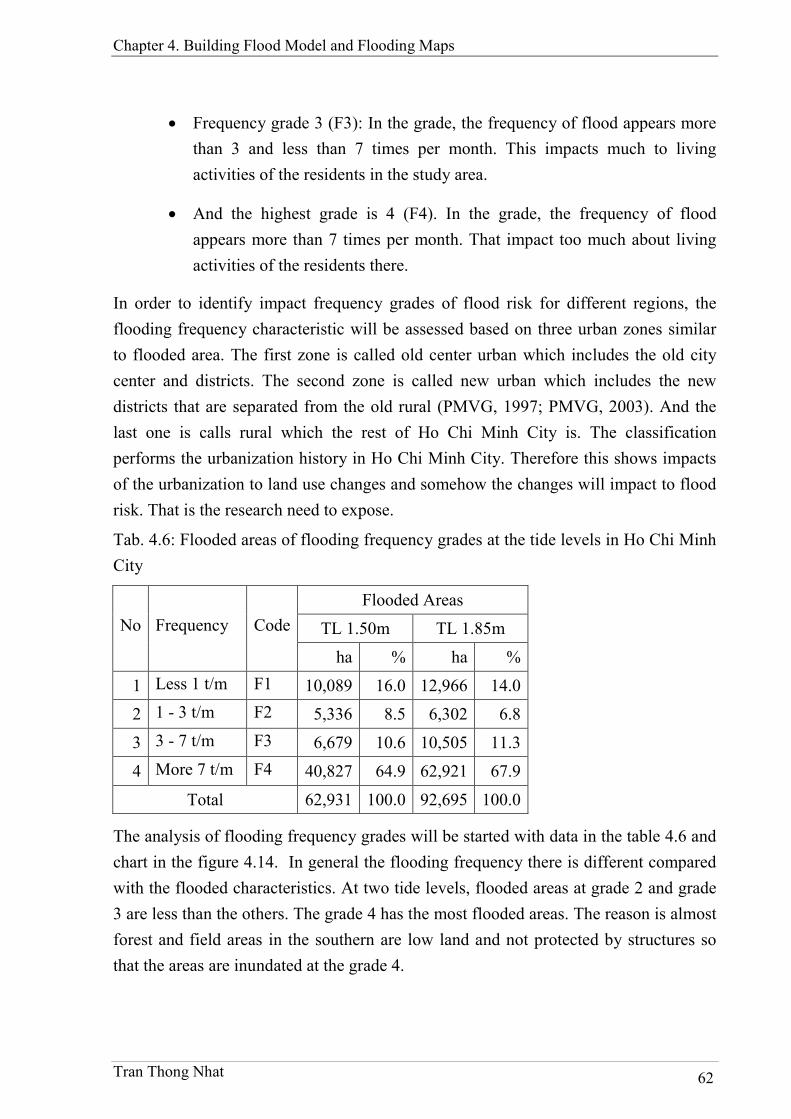
Chapter 4. Building Flood Model and Flooding Maps
Tran Thong Nhat 62
Frequency grade 3 (F3): In the grade, the frequency of flood appears more
than 3 and less than 7 times per month. This impacts much to living
activities of the residents in the study area.
And the highest grade is 4 (F4). In the grade, the frequency of flood
appears more than 7 times per month. That impact too much about living
activities of the residents there.
In order to identify impact frequency grades of flood risk for different regions, the
flooding frequency characteristic will be assessed based on three urban zones similar
to flooded area. The first zone is called old center urban which includes the old city
center and districts. The second zone is called new urban which includes the new
districts that are separated from the old rural (PMVG, 1997; PMVG, 2003). And the
last one is calls rural which the rest of Ho Chi Minh City is. The classification
performs the urbanization history in Ho Chi Minh City. Therefore this shows impacts
of the urbanization to land use changes and somehow the changes will impact to flood
risk. That is the research need to expose.
Tab. 4.6: Flooded areas of flooding frequency grades at the tide levels in Ho Chi Minh
City
Flooded Areas
TL 1.50m TL 1.85m No Frequency Code
ha % ha %
1 Less 1 t/m F1 10,089 16.0 12,966 14.0
2 1 - 3 t/m F2 5,336 8.5 6,302 6.8
3 3 - 7 t/m F3 6,679 10.6 10,505 11.3
4 More 7 t/m F4 40,827 64.9 62,921 67.9
Total 62,931 100.0 92,695 100.0
The analysis of flooding frequency grades will be started with data in the table 4.6 and
chart in the figure 4.14. In general the flooding frequency there is different compared
with the flooded characteristics. At two tide levels, flooded areas at grade 2 and grade
3 are less than the others. The grade 4 has the most flooded areas. The reason is almost
forest and field areas in the southern are low land and not protected by structures so
that the areas are inundated at the grade 4.
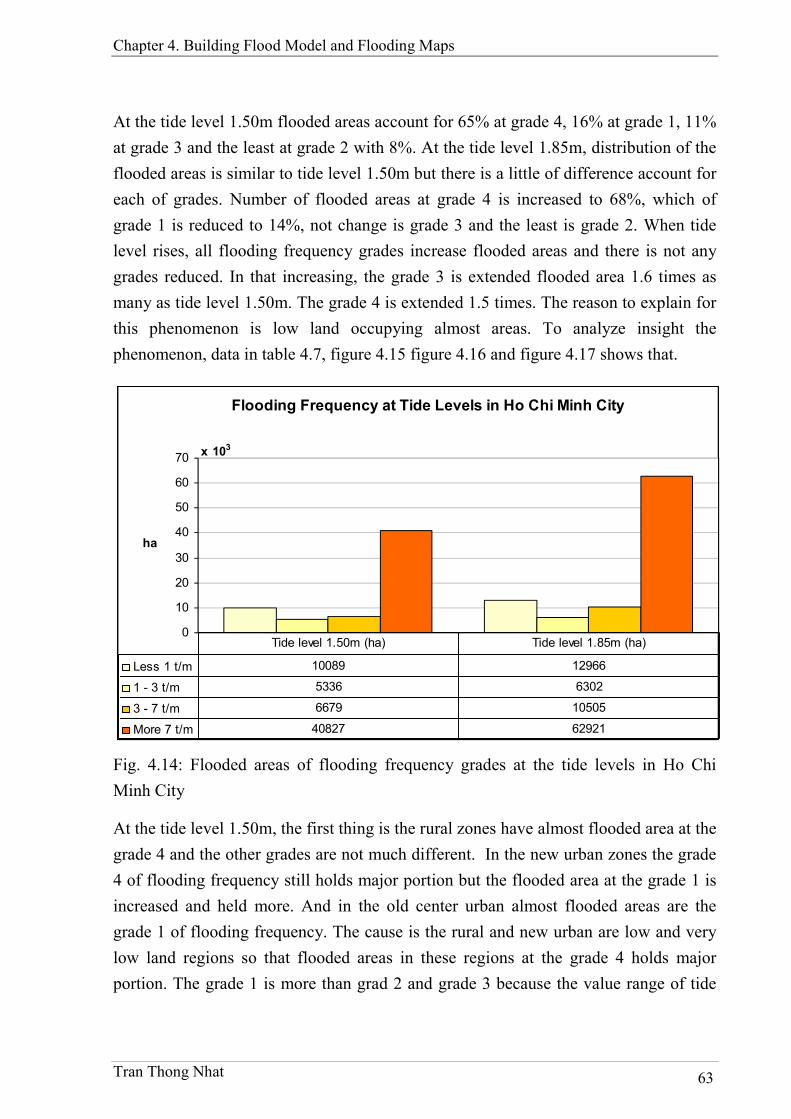
Chapter 4. Building Flood Model and Flooding Maps
Tran Thong Nhat 63
At the tide level 1.50m flooded areas account for 65% at grade 4, 16% at grade 1, 11%
at grade 3 and the least at grade 2 with 8%. At the tide level 1.85m, distribution of the
flooded areas is similar to tide level 1.50m but there is a little of difference account for
each of grades. Number of flooded areas at grade 4 is increased to 68%, which of
grade 1 is reduced to 14%, not change is grade 3 and the least is grade 2. When tide
level rises, all flooding frequency grades increase flooded areas and there is not any
grades reduced. In that increasing, the grade 3 is extended flooded area 1.6 times as
many as tide level 1.50m. The grade 4 is extended 1.5 times. The reason to explain for
this phenomenon is low land occupying almost areas. To analyze insight the
phenomenon, data in table 4.7, figure 4.15 figure 4.16 and figure 4.17 shows that.
Flooding Frequency at Tide Levels in Ho Chi Minh City
0
10
20
30
40
50
60
70x 103
ha
Less 1 t/m 10089 12966
1 - 3 t/m 5336 6302
3 - 7 t/m 6679 10505
More 7 t/m 40827 62921
Tide level 1.50m (ha) Tide level 1.85m (ha)
Fig. 4.14: Flooded areas of flooding frequency grades at the tide levels in Ho Chi
Minh City
At the tide level 1.50m, the first thing is the rural zones have almost flooded area at the
grade 4 and the other grades are not much different. In the new urban zones the grade
4 of flooding frequency still holds major portion but the flooded area at the grade 1 is
increased and held more. And in the old center urban almost flooded areas are the
grade 1 of flooding frequency. The cause is the rural and new urban are low and very
low land regions so that flooded areas in these regions at the grade 4 holds major
portion. The grade 1 is more than grad 2 and grade 3 because the value range of tide

Chapter 4. Building Flood Model and Flooding Maps
Tran Thong Nhat 64
level matching with the grade 1 is much larger than that of the grade 2 and grade 3 (see
Appendix A.2). For the old center urban, this region is higher land and has regular
slope so that almost flooded areas are at the grade 1.
Tab. 4.7: Flooded areas of flooding frequency grades at the tide levels in urban zones
of Ho Chi Minh City
Flooded Areas
TL1.50m TL1.85m No Urban Zones Frequency Code
ha % ha %
1 Rural Less 1 t/m RUR-F1 7,563 12.0 9,340 10.1
2 Rural 1 - 3 t/m RUR-F2 4,297 6.8 4,199 4.5
3 Rural 3 - 7 t/m RUR-F3 5,738 9.1 8,684 9.4
4 Rural More 7 t/m RUR-F4 32,427 51.5 50,016 54.0
5 New Urban Less 1 t/m NUR-F1 1,555 2.5 2,650 2.9
6 New Urban 1 - 3 t/m NUR-F2 656 1.0 1,476 1.6
7 New Urban 3 - 7 t/m NUR-F3 678 1.1 1,039 1.1
8 New Urban More 7 t/m NUR-F4 7,915 12.6 10,804 11.7
9 Old Center Urban Less 1 t/m URB-F1 971 1.5 976 1.1
10 Old Center Urban 1 - 3 t/m URB-F2 383 0.6 627 0.7
11 Old Center Urban 3 - 7 t/m URB-F3 263 0.4 782 0.8
12 Old Center Urban More 7 t/m URB-F4 485 0.8 2,102 2.3
Total 62,931 100.0 92,695 100.0
At the tide level 1.85m, there is much change in the old center urban and new urban. In
the new urban, flooded area is increased all grades but the most is grade 2 and grade 1.
The cause is movement from grade 1 to grade 2 when tide level rises from 1.50m to
1.85m. Besides, there are new flooded areas at the tide level 1.85m are low lands but
they are protected by roads at tide level 1.50m so that when tide level reaches 1.85m
these low lands are inundated at the grade 1. In the old center urban, an especial thing
is flooded area increased at the grade 3 and grade 4 when tide level rises from 1.50m
to 1.85m. There are two reasons to explain for this phenomenon. The first reason is
terrain in some districts of the old center urban such as District 4, District 6, District 8
and Binh Thanh District is low but these regions of low terrain are protected by roads
so that at the tide level 1.50m they are not inundated but flooded when tide level
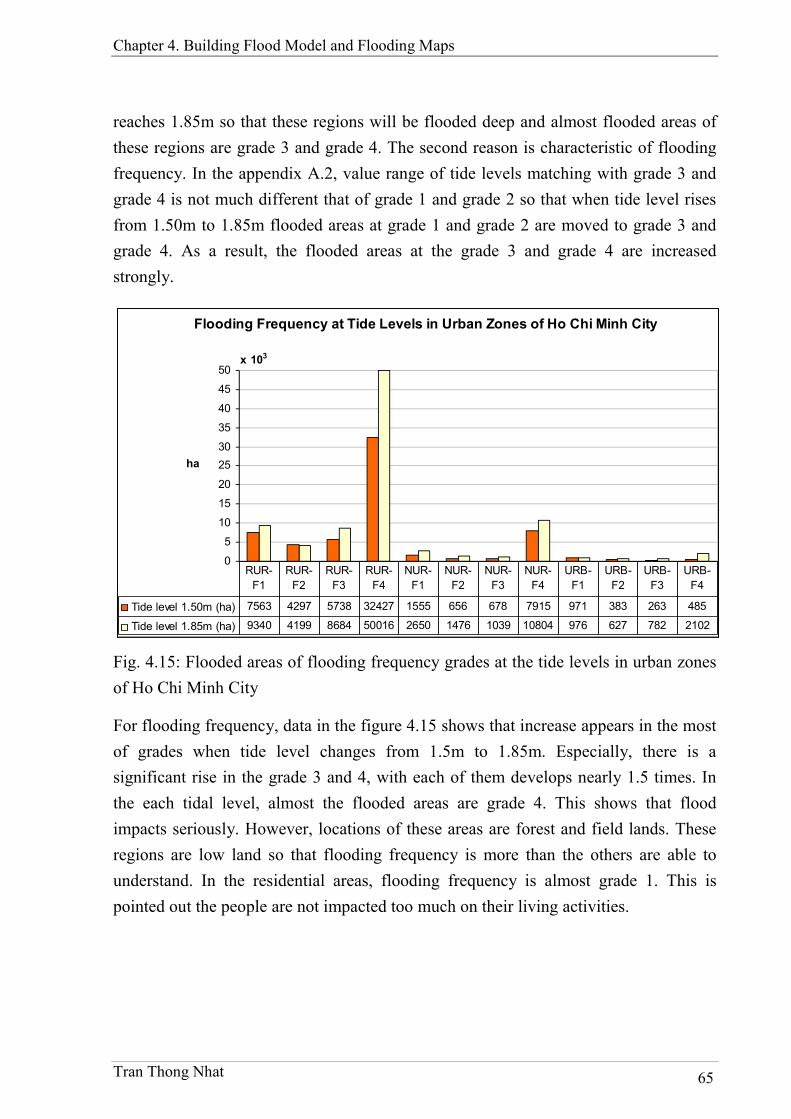
Chapter 4. Building Flood Model and Flooding Maps
Tran Thong Nhat 65
reaches 1.85m so that these regions will be flooded deep and almost flooded areas of
these regions are grade 3 and grade 4. The second reason is characteristic of flooding
frequency. In the appendix A.2, value range of tide levels matching with grade 3 and
grade 4 is not much different that of grade 1 and grade 2 so that when tide level rises
from 1.50m to 1.85m flooded areas at grade 1 and grade 2 are moved to grade 3 and
grade 4. As a result, the flooded areas at the grade 3 and grade 4 are increased
strongly.
Flooding Frequency at Tide Levels in Urban Zones of Ho Chi Minh City
0
5
10
15
20
25
30
35
40
45
50x 103
ha
Tide level 1.50m (ha) 7563 4297 5738 32427 1555 656 678 7915 971 383 263 485
Tide level 1.85m (ha) 9340 4199 8684 50016 2650 1476 1039 10804 976 627 782 2102
RUR-
F1
RUR-
F2
RUR-
F3
RUR-
F4
NUR-
F1
NUR-
F2
NUR-
F3
NUR-
F4
URB-
F1
URB-
F2
URB-
F3
URB-
F4
Fig. 4.15: Flooded areas of flooding frequency grades at the tide levels in urban zones
of Ho Chi Minh City
For flooding frequency, data in the figure 4.15 shows that increase appears in the most
of grades when tide level changes from 1.5m to 1.85m. Especially, there is a
significant rise in the grade 3 and 4, with each of them develops nearly 1.5 times. In
the each tidal level, almost the flooded areas are grade 4. This shows that flood
impacts seriously. However, locations of these areas are forest and field lands. These
regions are low land so that flooding frequency is more than the others are able to
understand. In the residential areas, flooding frequency is almost grade 1. This is
pointed out the people are not impacted too much on their living activities.

Chapter 4. Building Flood Model and Flooding Maps
Tran Thong Nhat 66
Fig. 4.16: Flooding frequency maps at 1.50m tide level in urban zones of Ho Chi Minh
City

Chapter 4. Building Flood Model and Flooding Maps
Tran Thong Nhat 67
Fig. 4.17: Flooding frequency maps at 1.85m tide level in urban zones of Ho Chi Minh
City
Chapter 5. Flood Risks of Houses
Tran Thong Nhat 68
Chapter 5. Flood Risks of Houses
1. Introduction
Flooding affects to a lot of fields and flood impact can be divided some types such as
direct and indirect impact or tangible and intangible value damage. Direct damage is
the physical damage caused to buildings, transport… and their contents, whereas
indirect damage represents the loss of industrial or business process. Tangible value
losses represent those that can be allocated a monetary value, and intangible value
losses are those to which it is impossible to allocate a monetary value (Proverbs &
Soetanto, 2004). With applying GIS to evaluate impacts and risks caused by flood
damage, the study will focus on the direct tangible losses.
The evaluation of a disaster or a hazard in consideration after all is impacts to the
human aspects such as human life, health, properties, income, and living
environment… in the interested regions. With a lot of those aspects that are able to
assess, this research focuses to aspects that impact directly mostly inhabitants in the
study area. In that analysis, the house objects are assessed by flood risk firstly. The
houses are defined as the residential buildings that citizens live in. The houses
influence mostly to inhabitant living and moreover they are environment to live human
and protect them. Additionally, the houses are usually one of the highest value
properties of inhabitants. Therefore, the assessment of flood risk for the houses is
necessary.
The assessment of flood risk will be performed on the time scenarios in 2030 with the
sea level rise in the highest scenario of climate change in Ho Chi Minh City as
mentioned in the section 4.4 of the chapter 3. In the scenario, the maximum tide level
is 1.85m and data of this scenario will be used to assess the flood risk for houses in the
study area. The assessment of flood risk is conducted at two levels that are 1.85m and
1.50m. The first level is the maximum and the second is the most dangerous warning
level at the current in Ho Chi Minh City at Phu An tidal station. Moreover, the second
level is interested as the delegation of the level at the current time.
Chapter 5. Flood Risks of Houses
Tran Thong Nhat 69
Additionally, risk analysis is the identification of the houses located in the areas
affected by the flooding with the parameters of flood risk including: flooding duration,
flooding depth and frequency of flooding. The houses that are considered to be at
flooding risk are the houses exposed to flooded areas.
Moreover, to identify impact risk grades of the flooding characteristics for different
regions, the assessment process is based on the flooding characteristics. Therefore, the
research classifies Ho Chi Minh City to three urban zones. The first zone is called old
center urban which includes the old city center and districts. The second zone is called
new urban which includes the new districts that are separated from the old rural
(PMVG, 1997; PMVG, 2003). And the last one is calls rural which the rest of Ho Chi
Minh City is.
At the current there are some available researches also conducted impacts of the
climate change to Ho Chi Minh City but the house object was not assessed (ADB,
2009a; ADB, 2009b; ADB, 2009c; WB, 2010). The reason of them can be difficult in
the collecting of house data because of Vietnamese national regulation to publish the
data and the data is not updated continuously. This is difficulty of the research as
shown in the chapter 3 with the building data is not updated to the present time.
However, to assess the flood risk to house objects that is helpful to generate a forecast
data for beyond researches and make a warning to the local authority in the
development plan of Ho Chi Minh City in the future. Consequently, this research uses
house data in the best ability to collect at the current time that is in 2006 for flood risk
assessment to houses.
2. Method
Generally, method of assessing the damage and affected by the flooding is based on
spatial relationship with a spatial analysis tool set, a powerful tool set of GIS. The
spatial analysis based on the correspondence between spatial data layers to consider
spatial relationships between objects on those layers (DeMers, 2009; ESRI, 2004; Loi
et al., 2008; Longley et al., 2005). For the assessment of flood risk in Ho Chi Minh
City, the analysis of the spatial relationship between interested features and flooding
maps will be done. From spatial relationship, the objects on the interested features
located in the flooded areas will be determined and based on the characteristics of the
Chapter 5. Flood Risks of Houses
Tran Thong Nhat 70
flooding at that location the flood risk will be assessed qualitative or quantitative
(Dutta, Herath and Musiake, 2003).
Particularly, method to apply for identification is considering the spatial relationship of
the building layer and the flooding maps, buildings were flooded and not flooded will
be determined. Similarly, using the characteristics of flooding such as depth, duration
and frequency of the flood, the damage of the buildings in the flooded area will
calculate a qualitative or quantitative assessment.
The inundated houses are calculated and assessed about areas for each of flood risk
grades based on flood characteristics including flooding depth, duration and frequency.
Approach of classification of the flood risk grades marches to that of the flood risk
grades of characteristics that are described in the sections 6.3.2, 6.4.2 and 6.5.2 in the
chapter 4. Exceptionally, with the flooding depth characteristic there is a new situation
for inundated houses that is the houses located in the flooded areas but their ground
floor is not below of the flood level so that no water flows into inner of the houses. To
evaluate this situation, the research suggests one more flood risk grade called depth
grade 0.
A summary for flood risk grades of houses is described as followings:
Depth grade 0 (D0): This grade is called for only affected houses. In the
grade, the houses are only located inside of the flooded areas but ground
floor is not below of the flood level so that no water flows into inner of the
houses.
Depth grade 1 (D1): In the grade, the depth is above 0.0m and below 0.5m.
This damages furniture and is the least dangerous to the human being there.
Depth grade 2 (D2): In the grade, the depth is from 0.5m to below 1.2m.
This is the grade that can be dangerous to children and elderly people and
damages almost the properties inner houses.
Depth grade 3 (D3): In the grade, the depth is from 1.2m to below 1.8m.
This is the grade that does not only damage properties but also is
dangerous to almost human living there.
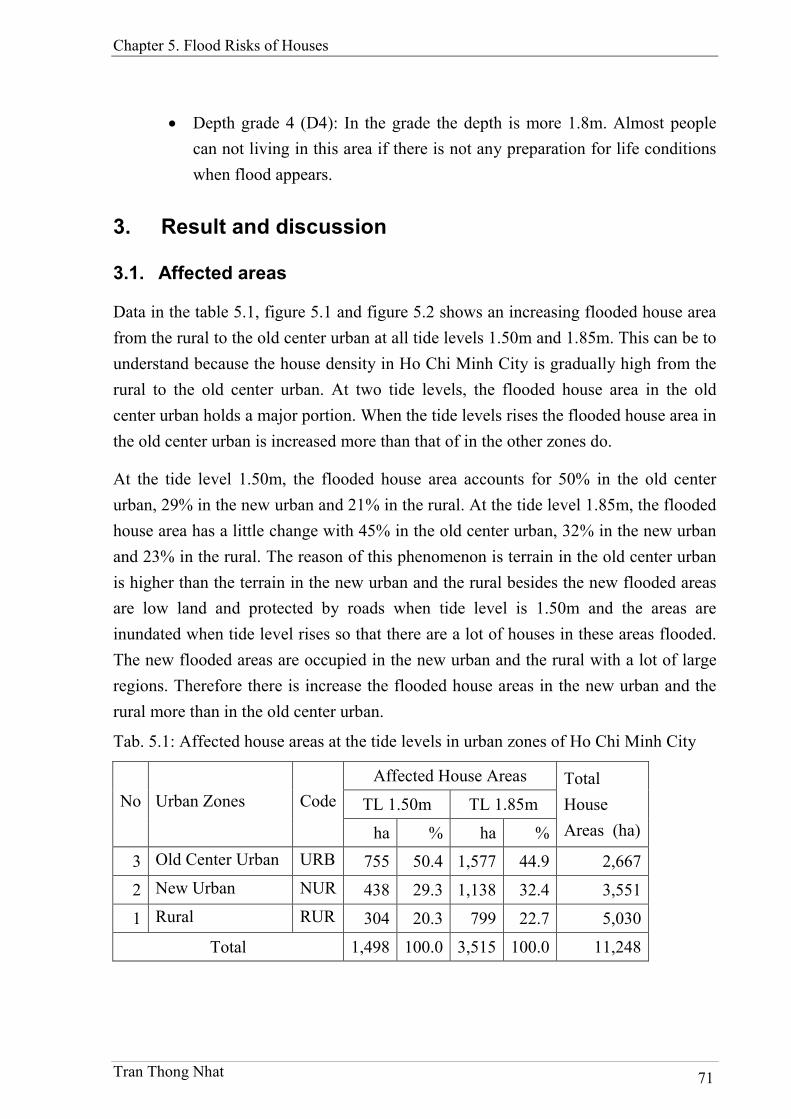
Chapter 5. Flood Risks of Houses
Tran Thong Nhat 71
Depth grade 4 (D4): In the grade the depth is more 1.8m. Almost people
can not living in this area if there is not any preparation for life conditions
when flood appears.
3. Result and discussion
3.1. Affected areas
Data in the table 5.1, figure 5.1 and figure 5.2 shows an increasing flooded house area
from the rural to the old center urban at all tide levels 1.50m and 1.85m. This can be to
understand because the house density in Ho Chi Minh City is gradually high from the
rural to the old center urban. At two tide levels, the flooded house area in the old
center urban holds a major portion. When the tide levels rises the flooded house area in
the old center urban is increased more than that of in the other zones do.
At the tide level 1.50m, the flooded house area accounts for 50% in the old center
urban, 29% in the new urban and 21% in the rural. At the tide level 1.85m, the flooded
house area has a little change with 45% in the old center urban, 32% in the new urban
and 23% in the rural. The reason of this phenomenon is terrain in the old center urban
is higher than the terrain in the new urban and the rural besides the new flooded areas
are low land and protected by roads when tide level is 1.50m and the areas are
inundated when tide level rises so that there are a lot of houses in these areas flooded.
The new flooded areas are occupied in the new urban and the rural with a lot of large
regions. Therefore there is increase the flooded house areas in the new urban and the
rural more than in the old center urban.
Tab. 5.1: Affected house areas at the tide levels in urban zones of Ho Chi Minh City
Affected House Areas
TL 1.50m TL 1.85m No Urban Zones Code
ha % ha %
Total
House
Areas (ha)
3 Old Center Urban URB 755 50.4 1,577 44.9 2,667
2 New Urban NUR 438 29.3 1,138 32.4 3,551
1 Rural RUR 304 20.3 799 22.7 5,030
Total 1,498 100.0 3,515 100.0 11,248
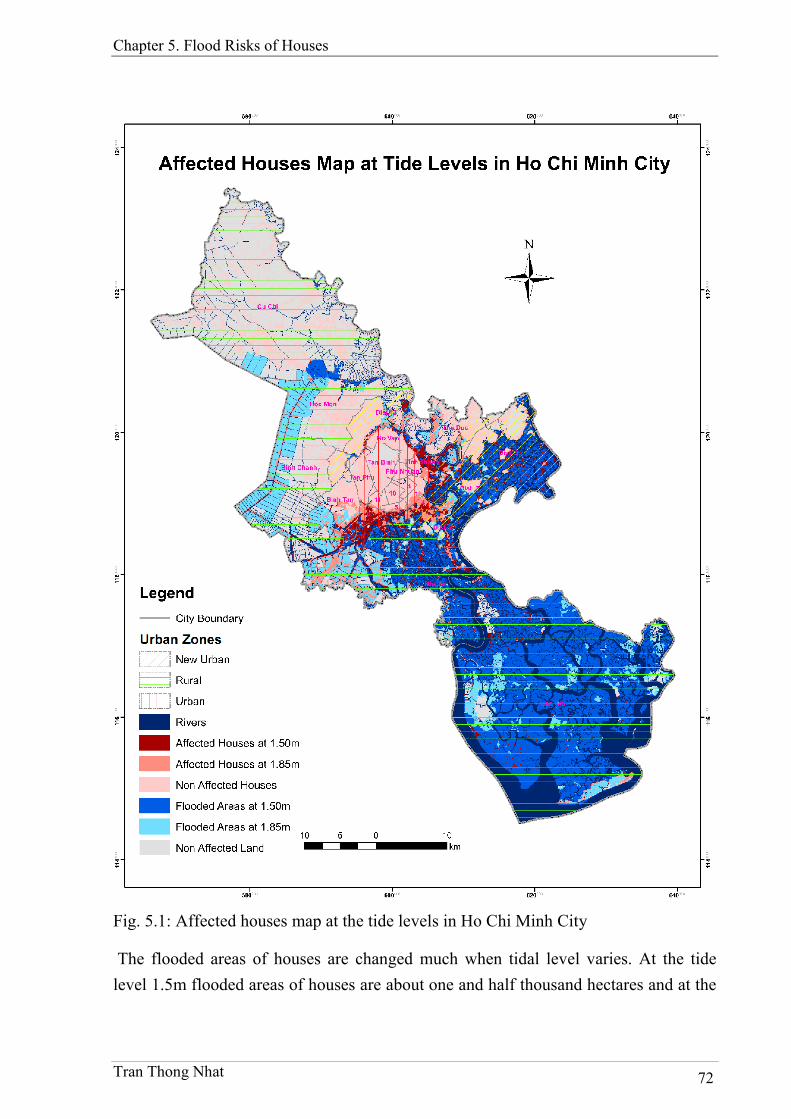
Chapter 5. Flood Risks of Houses
Tran Thong Nhat 72
Fig. 5.1: Affected houses map at the tide levels in Ho Chi Minh City
The flooded areas of houses are changed much when tidal level varies. At the tide
level 1.5m flooded areas of houses are about one and half thousand hectares and at the
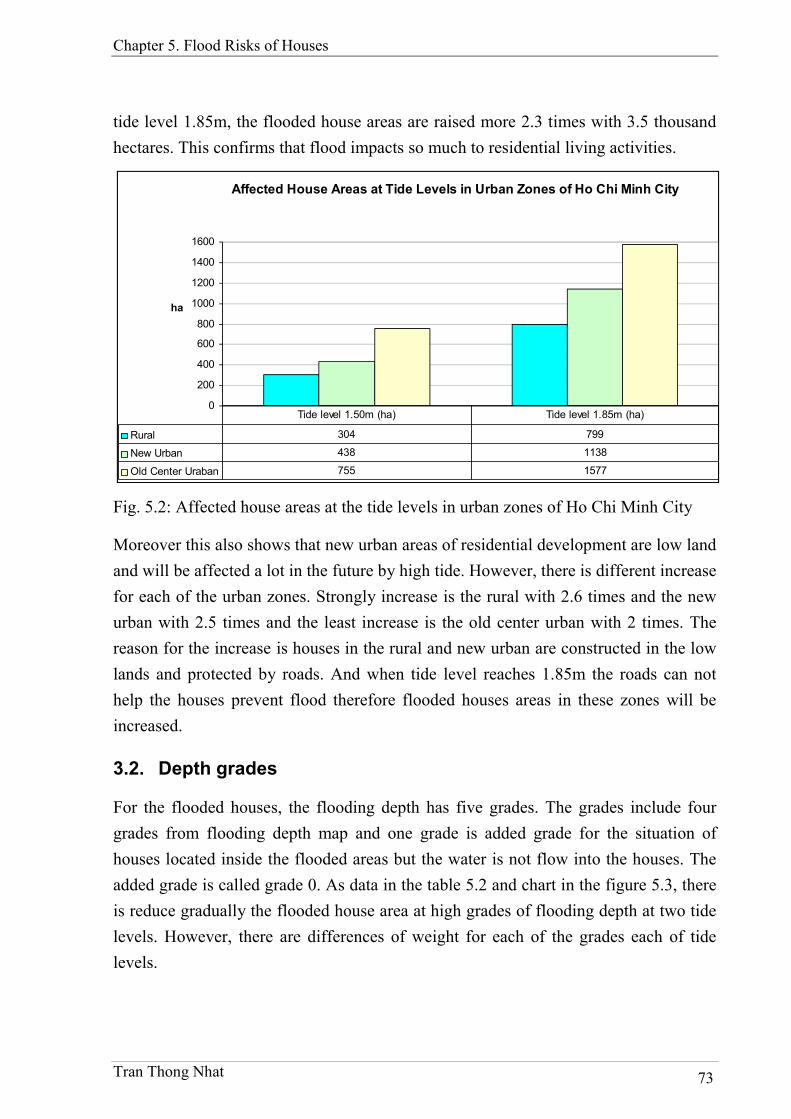
Chapter 5. Flood Risks of Houses
Tran Thong Nhat 73
tide level 1.85m, the flooded house areas are raised more 2.3 times with 3.5 thousand
hectares. This confirms that flood impacts so much to residential living activities.
Affected House Areas at Tide Levels in Urban Zones of Ho Chi Minh City
0
200
400
600
800
1000
1200
1400
1600
ha
Rural 304 799
New Urban 438 1138
Old Center Uraban 755 1577
Tide level 1.50m (ha) Tide level 1.85m (ha)
Fig. 5.2: Affected house areas at the tide levels in urban zones of Ho Chi Minh City
Moreover this also shows that new urban areas of residential development are low land
and will be affected a lot in the future by high tide. However, there is different increase
for each of the urban zones. Strongly increase is the rural with 2.6 times and the new
urban with 2.5 times and the least increase is the old center urban with 2 times. The
reason for the increase is houses in the rural and new urban are constructed in the low
lands and protected by roads. And when tide level reaches 1.85m the roads can not
help the houses prevent flood therefore flooded houses areas in these zones will be
increased.
3.2. Depth grades
For the flooded houses, the flooding depth has five grades. The grades include four
grades from flooding depth map and one grade is added grade for the situation of
houses located inside the flooded areas but the water is not flow into the houses. The
added grade is called grade 0. As data in the table 5.2 and chart in the figure 5.3, there
is reduce gradually the flooded house area at high grades of flooding depth at two tide
levels. However, there are differences of weight for each of the grades each of tide
levels.
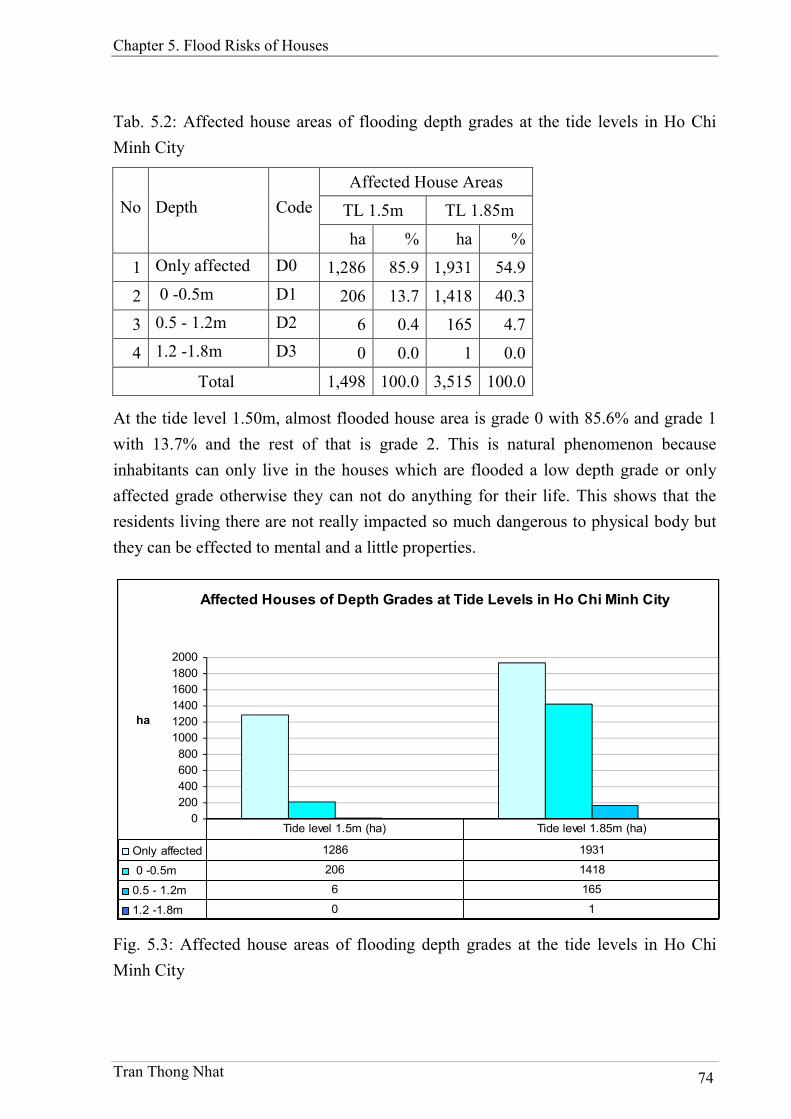
Chapter 5. Flood Risks of Houses
Tran Thong Nhat 74
Tab. 5.2: Affected house areas of flooding depth grades at the tide levels in Ho Chi
Minh City
Affected House Areas
TL 1.5m TL 1.85m No Depth Code
ha % ha %
1 Only affected D0 1,286 85.9 1,931 54.9
2 0 -0.5m D1 206 13.7 1,418 40.3
3 0.5 - 1.2m D2 6 0.4 165 4.7
4 1.2 -1.8m D3 0 0.0 1 0.0
Total 1,498 100.0 3,515 100.0
At the tide level 1.50m, almost flooded house area is grade 0 with 85.6% and grade 1
with 13.7% and the rest of that is grade 2. This is natural phenomenon because
inhabitants can only live in the houses which are flooded a low depth grade or only
affected grade otherwise they can not do anything for their life. This shows that the
residents living there are not really impacted so much dangerous to physical body but
they can be effected to mental and a little properties.
Affected Houses of Depth Grades at Tide Levels in Ho Chi Minh City
0
200
400
600
800
1000
1200
1400
1600
1800
2000
ha
Only affected 1286 1931
0 -0.5m 206 1418
0.5 - 1.2m 6 165
1.2 -1.8m 0 1
Tide level 1.5m (ha) Tide level 1.85m (ha)
Fig. 5.3: Affected house areas of flooding depth grades at the tide levels in Ho Chi
Minh City

Chapter 5. Flood Risks of Houses
Tran Thong Nhat 75
A notice in the result is there is a small area of flooded houses with grade 2 in the rural
and new urban as shown in the table 5.3 and figure 5.4. This may be errors of the
interpolation method of house foundations when the houses are located in the special
zones such as location near rivers and the houses have special characteristics but the
research has not gotten elevation information enough.
At the tide level 1.85m, flooded house area at all the grades of flooding depth is
increased with different amount so that there is a change of percentage for the flooding
depth grades compared with tide level 1.50m. The flooded house area at the grade 0
still holds the most with 55% and then is grade 1 with 40% and the third is grade 2
with 4.7% and the least is grade 3 with 0.3%. The flooded house areas increase at the
grade 1 significant. The cause of this a lot of flooded house areas from grade 0 at the
tide level 1.5m transfers to grade 1 at this tide level. This shows that the flooded
houses of the grade 0 at tide level 1.5m have ground floor elevation not much higher
than the tide level.
Tab. 5.3: Affected house areas of flooding depth grades at the tide levels in urban
zones of Ho Chi Minh City
Affected House Areas
TL 1.50m TL 1.85m No Urban Zones Depth Code
ha % ha %
1 Rural Only affected RUR-D0 251.5 16.8 370.4 10.5
2 Rural 0 -0.5m RUR-D1 49.4 3.3 374.3 10.7
3 Rural 0.5 - 1.2m RUR-D2 3.4 0.2 54.4 1.5
4 Rural 1.2 -1.8m RUR-D3 0.0 0.0 0.2 0.0
5 New Urban Only affected NUR-D0 393.2 26.3 703.6 20.0
6 New Urban 0 -0.5m NUR-D1 42.7 2.9 360.2 10.2
7 New Urban 0.5 - 1.2m NUR-D2 2.1 0.1 73.3 2.1
8 New Urban 1.2 -1.8m NUR-D3 0.0 0.0 1.2 0.0
9 Old Center Urban Only affected URB-D0 641.6 42.8 856.5 24.4
10 Old Center Urban 0 -0.5m URB-D1 113.5 7.6 683.3 19.4
11 Old Center Urban 0.5 - 1.2m URB-D2 0.0 0.0 37.5 1.1
Total 1,497.5 100.0 3,515.0 100.0

Chapter 5. Flood Risks of Houses
Tran Thong Nhat 76
Additionally, the new flooded houses are located at the low land and protected by
streets whose elevation is not so much higher than 1.5m. At the tide level 1.85m the
flooded house areas are also concentrated in the grade 0 and 1 and dominating more
than 95%. A warning is the flooded house area appears at the grade 3. This shows that
dangerousness to human at tide level 1.85m can be serious.
The data in the table 5.3 and chart of figure 5.4 shows more clearly about change and
distribution of flooding depth grades in the urban zones. At the tide level 1.50m in all
urban zones there is the flooded house area at the grade 0 and grade 1 but there is a
small flooded house area at the grade 2 in the rural and new urban. The reason can be
errors of the interpolation method for foundation elevation of the houses. The most
attention is the flooded house area is increased in all urban zones at the tide level
1.85m.
Affected House Areas of Depth Grades at Tide Levels in Urban Zones
of Ho Chi Minh City
0
100
200
300
400
500
600
700
800
900
ha
Tide level 1.50m (ha) 251.5 49.4 3.4 0.0 393.2 42.7 2.1 0.0 641.6 113.5 0.0
Tide level 1.85m (ha) 370.4 374.3 54.4 0.2 703.6 360.2 73.3 1.2 856.5 683.3 37.5
RUR-
D0
RUR-
D1
RUR-
D2
RUR-
D3
NUR-
D0
NUR-
D1
NUR-
D2
NUR-
D3
URB-
D0
URB-
D1
URB-
D2
Fig. 5.4: Affected house areas of flooding depth grades at the tide levels in urban
zones of Ho Chi Minh City
Moreover there are new grades in all urban zones. In the rural and new urban grade 3
is appeared and the old center urban occurs grade 2. The flooded house area is
increased very much at the grade 1and the flooded house area at this grade holds also
the major portion at the tide level 1.85m. The cause of the phenomenon is there is
much low land regions in all urban zones such as Thu Duc District, District 2, District
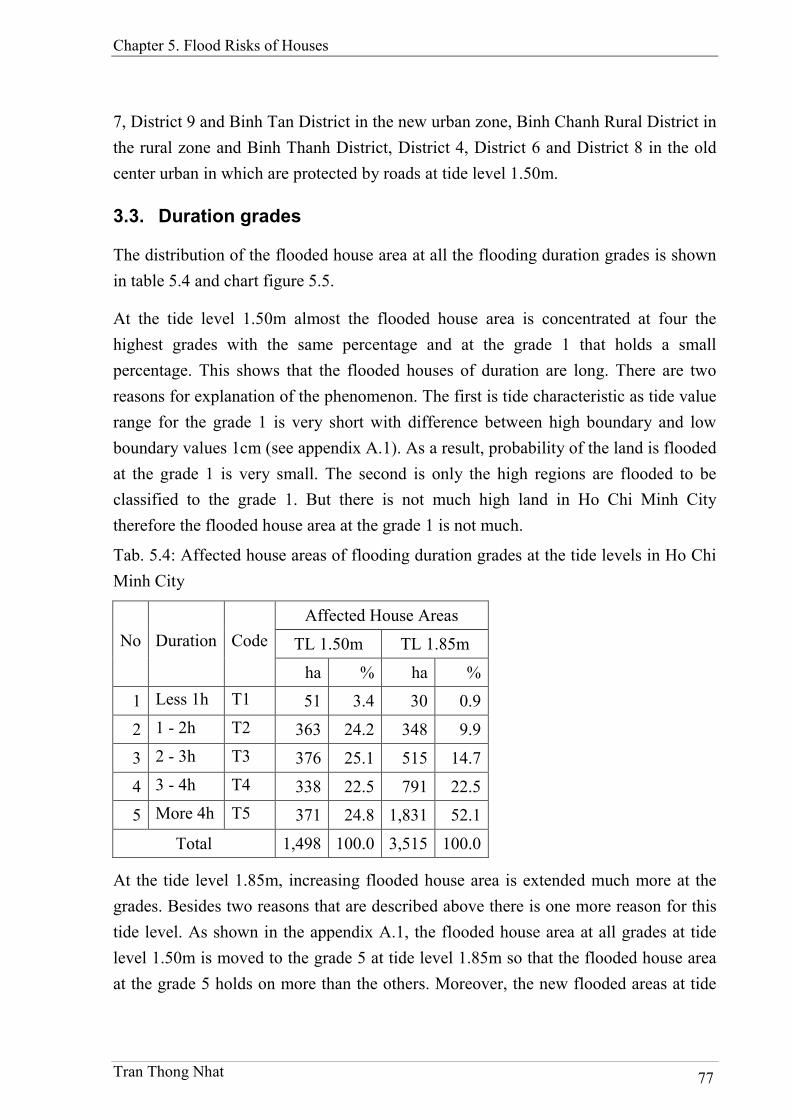
Chapter 5. Flood Risks of Houses
Tran Thong Nhat 77
7, District 9 and Binh Tan District in the new urban zone, Binh Chanh Rural District in
the rural zone and Binh Thanh District, District 4, District 6 and District 8 in the old
center urban in which are protected by roads at tide level 1.50m.
3.3. Duration grades
The distribution of the flooded house area at all the flooding duration grades is shown
in table 5.4 and chart figure 5.5.
At the tide level 1.50m almost the flooded house area is concentrated at four the
highest grades with the same percentage and at the grade 1 that holds a small
percentage. This shows that the flooded houses of duration are long. There are two
reasons for explanation of the phenomenon. The first is tide characteristic as tide value
range for the grade 1 is very short with difference between high boundary and low
boundary values 1cm (see appendix A.1). As a result, probability of the land is flooded
at the grade 1 is very small. The second is only the high regions are flooded to be
classified to the grade 1. But there is not much high land in Ho Chi Minh City
therefore the flooded house area at the grade 1 is not much.
Tab. 5.4: Affected house areas of flooding duration grades at the tide levels in Ho Chi
Minh City
Affected House Areas
TL 1.50m TL 1.85m No Duration Code
ha % ha %
1 Less 1h T1 51 3.4 30 0.9
2 1 - 2h T2 363 24.2 348 9.9
3 2 - 3h T3 376 25.1 515 14.7
4 3 - 4h T4 338 22.5 791 22.5
5 More 4h T5 371 24.8 1,831 52.1
Total 1,498 100.0 3,515 100.0
At the tide level 1.85m, increasing flooded house area is extended much more at the
grades. Besides two reasons that are described above there is one more reason for this
tide level. As shown in the appendix A.1, the flooded house area at all grades at tide
level 1.50m is moved to the grade 5 at tide level 1.85m so that the flooded house area
at the grade 5 holds on more than the others. Moreover, the new flooded areas at tide
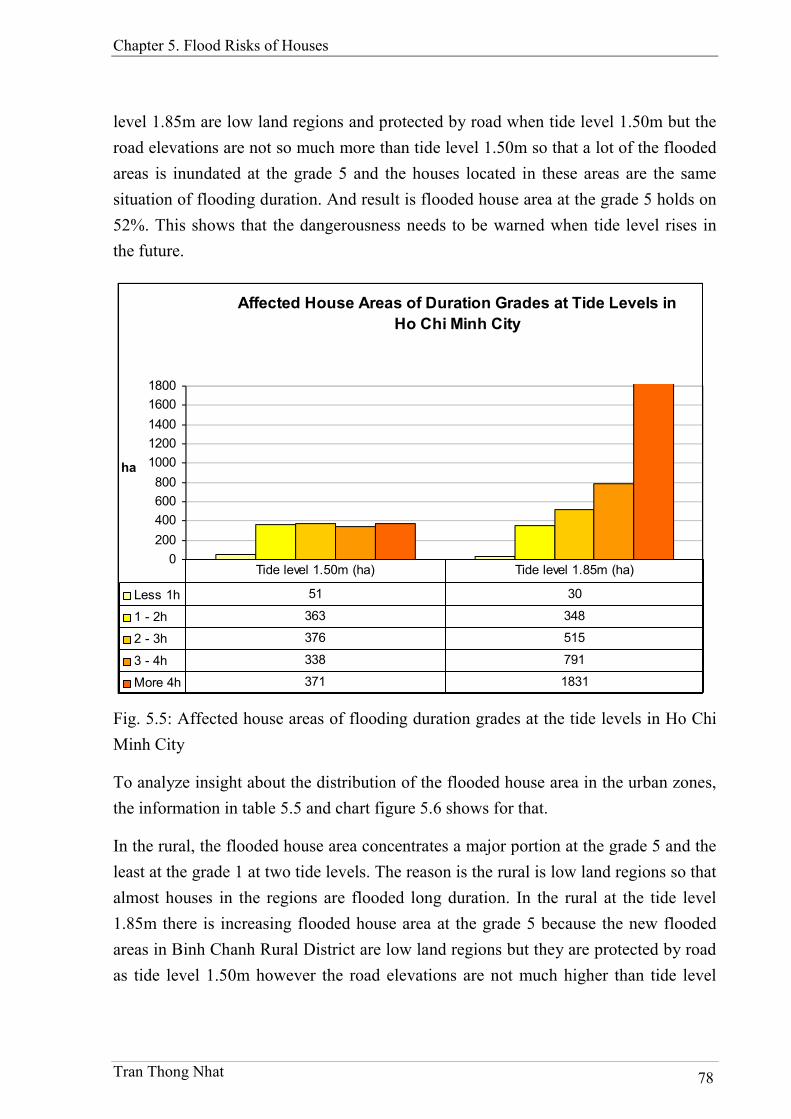
Chapter 5. Flood Risks of Houses
Tran Thong Nhat 78
level 1.85m are low land regions and protected by road when tide level 1.50m but the
road elevations are not so much more than tide level 1.50m so that a lot of the flooded
areas is inundated at the grade 5 and the houses located in these areas are the same
situation of flooding duration. And result is flooded house area at the grade 5 holds on
52%. This shows that the dangerousness needs to be warned when tide level rises in
the future.
Affected House Areas of Duration Grades at Tide Levels in
Ho Chi Minh City
0
200
400
600
800
1000
1200
1400
1600
1800
ha
Less 1h 51 30
1 - 2h 363 348
2 - 3h 376 515
3 - 4h 338 791
More 4h 371 1831
Tide level 1.50m (ha) Tide level 1.85m (ha)
Fig. 5.5: Affected house areas of flooding duration grades at the tide levels in Ho Chi
Minh City
To analyze insight about the distribution of the flooded house area in the urban zones,
the information in table 5.5 and chart figure 5.6 shows for that.
In the rural, the flooded house area concentrates a major portion at the grade 5 and the
least at the grade 1 at two tide levels. The reason is the rural is low land regions so that
almost houses in the regions are flooded long duration. In the rural at the tide level
1.85m there is increasing flooded house area at the grade 5 because the new flooded
areas in Binh Chanh Rural District are low land regions but they are protected by road
as tide level 1.50m however the road elevations are not much higher than tide level
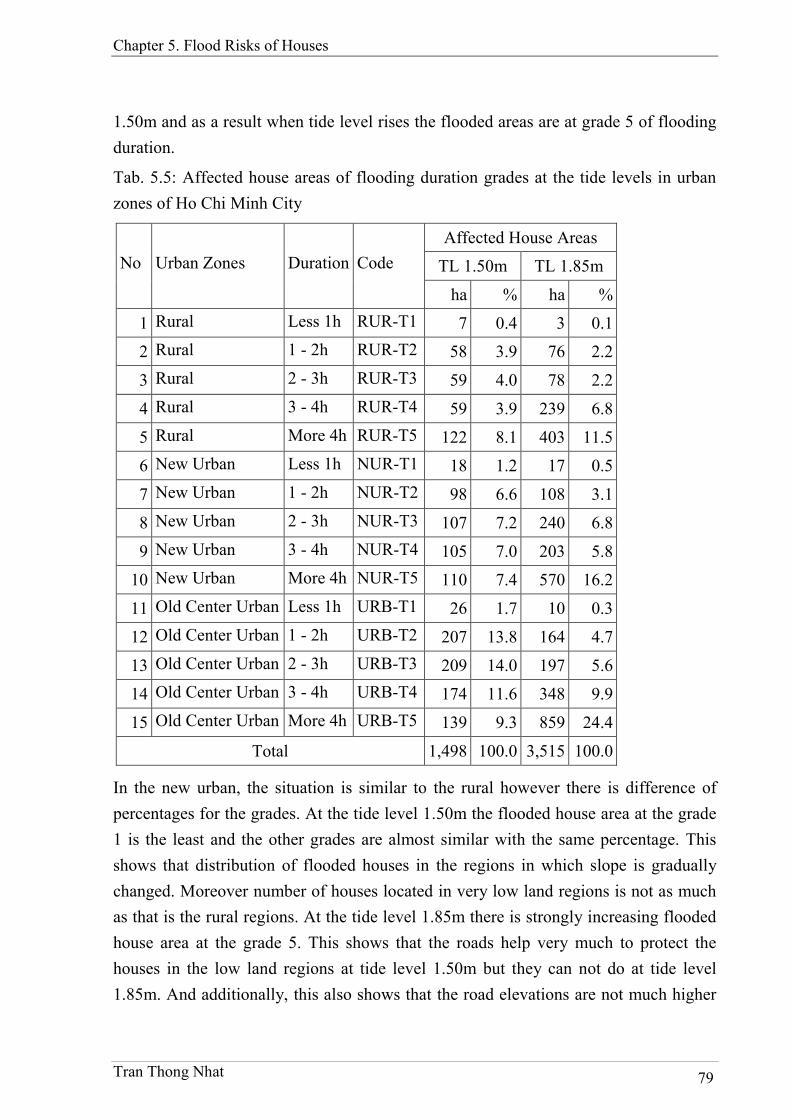
Chapter 5. Flood Risks of Houses
Tran Thong Nhat 79
1.50m and as a result when tide level rises the flooded areas are at grade 5 of flooding
duration.
Tab. 5.5: Affected house areas of flooding duration grades at the tide levels in urban
zones of Ho Chi Minh City
Affected House Areas
TL 1.50m TL 1.85m No Urban Zones Duration Code
ha % ha %
1 Rural Less 1h RUR-T1 7 0.4 3 0.1
2 Rural 1 - 2h RUR-T2 58 3.9 76 2.2
3 Rural 2 - 3h RUR-T3 59 4.0 78 2.2
4 Rural 3 - 4h RUR-T4 59 3.9 239 6.8
5 Rural More 4h RUR-T5 122 8.1 403 11.5
6 New Urban Less 1h NUR-T1 18 1.2 17 0.5
7 New Urban 1 - 2h NUR-T2 98 6.6 108 3.1
8 New Urban 2 - 3h NUR-T3 107 7.2 240 6.8
9 New Urban 3 - 4h NUR-T4 105 7.0 203 5.8
10 New Urban More 4h NUR-T5 110 7.4 570 16.2
11 Old Center Urban Less 1h URB-T1 26 1.7 10 0.3
12 Old Center Urban 1 - 2h URB-T2 207 13.8 164 4.7
13 Old Center Urban 2 - 3h URB-T3 209 14.0 197 5.6
14 Old Center Urban 3 - 4h URB-T4 174 11.6 348 9.9
15 Old Center Urban More 4h URB-T5 139 9.3 859 24.4
Total 1,498 100.0 3,515 100.0
In the new urban, the situation is similar to the rural however there is difference of
percentages for the grades. At the tide level 1.50m the flooded house area at the grade
1 is the least and the other grades are almost similar with the same percentage. This
shows that distribution of flooded houses in the regions in which slope is gradually
changed. Moreover number of houses located in very low land regions is not as much
as that is the rural regions. At the tide level 1.85m there is strongly increasing flooded
house area at the grade 5. This shows that the roads help very much to protect the
houses in the low land regions at tide level 1.50m but they can not do at tide level
1.85m. And additionally, this also shows that the road elevations are not much higher

Chapter 5. Flood Risks of Houses
Tran Thong Nhat 80
than tide level 1.50m and as a result the houses protected by the roads are very
vulnerable when tide level rises.
Affected House Areas of Duration Grades at Tide Levels in Urban Zones of Ho
Chi Minh City
0
100
200
300
400
500
600
700
800
900
ha
Tide level 1.50m (ha) 7 58 59 59 122 18 98 107 105 110 26 207 209 174 139
Tide level 1.85m (ha) 3 76 78 239 403 17 108 240 203 570 10 164 197 348 859
RUR-
T1
RUR-
T2
RUR-
T3
RUR-
T4
RUR-
T5
NUR-
T1
NUR-
T2
NUR-
T3
NUR-
T4
NUR-
T5
URB-
T1
URB-
T2
URB-
T3
URB-
T4
URB-
T5
Fig. 5.6: Affected house areas of flooding duration grades at the tide levels in urban
zones of Ho Chi Minh City
In the old center urban, at the tide level 1.50m the flooded house area concentrates a
major portion at the grade 2 and grade 3 and that reduces at the grade 4 and grade 5.
The cause of the phenomenon is because high land regions in the old center urban
occupy almost and the low land regions are protected by roads. However, when tide
level rises to 1.85m vulnerability to these houses is exposed with increasing of flooded
house area at grade 4 and grade 5 is extremely high. The flooded house area at the
grade 1, grade 2 and grade 3 is reduced. The reason may be movement of the flooded
house area of these grades at tide level 1.50m to the grade 4 and grade 5 at the tide
level 1.85m. Additionally, increasing of new flooded houses in the high land regions is
not as much as in the low land regions of Binh Thanh District, District 4, District 6 and
District 8. These regions at tide level 1.50m are controlled by the roads to protect them
for preventing inundation.
3.4. Frequency grades
From data in table 5.6 and chart in figure 5.7, some conclusions are found. At the tide
level 1.50m the flooded house area is the most with 53% at the grade 1 and that is the
least with 11% at grade 3, with 16% at the grade 2 and with 20% at the grade 4. This is

Chapter 5. Flood Risks of Houses
Tran Thong Nhat 81
because house density reduces gradually from high land to low land in Ho Chi Minh
City. Moreover, because tide level value ranges matching with the flooding frequency
grades are not the same as each of others as shown in appendix A.2. In the appendix,
the tide value range matching with flooding frequency grade 1 is large that of grade 2
and grade 3 so that the flooded house areas at the grade 2 and grade 3 are very little.
But why is the flooded house area at the grade 4 also little?
Tab. 5.6: Affected house areas of flooding frequency grades at the tide levels in Ho
Chi Minh City
Affected House Areas
TL 1.5m TL 1.85m No Frequency Code
ha % ha %
1 Less 1 t/m F1 789 52.7 893 25.4
2 1 - 3 t/m F2 240 16.0 494 14.0
3 3 - 7 t/m F3 174 11.6 631 17.9
4 More 7 t/m F4 295 19.7 1,498 42.6
Total 1,498 100.0 3,515 100.0
The cause of the phenomenon is the inhabitants do not like to build houses in the very
low land regions and the low land regions where can build houses are protected by
roads to prevent inundation. This reason is shown clearly when tide level rises to
1.85m. At the high tide level, although the flooded house area at all flooding frequency
grades is increased if that is compared with tide level 1.50m, increase the flooded
house area at the grade 2 is 2.1 times, at the grade 3 is 3.6 times and the most at grade
4 is 5.1 times as many as that of at tide level 1.50m. This shows that there are a lot of
houses in the new flooded areas and the elevations of the areas are much lower than
tide level 1.85m and they are inundated because the protecting roads can not help to
prevent flood at high tide level. As a result at the tide level 1.85m the houses are
covered by water with longer time, much deeper and more frequent appearance.
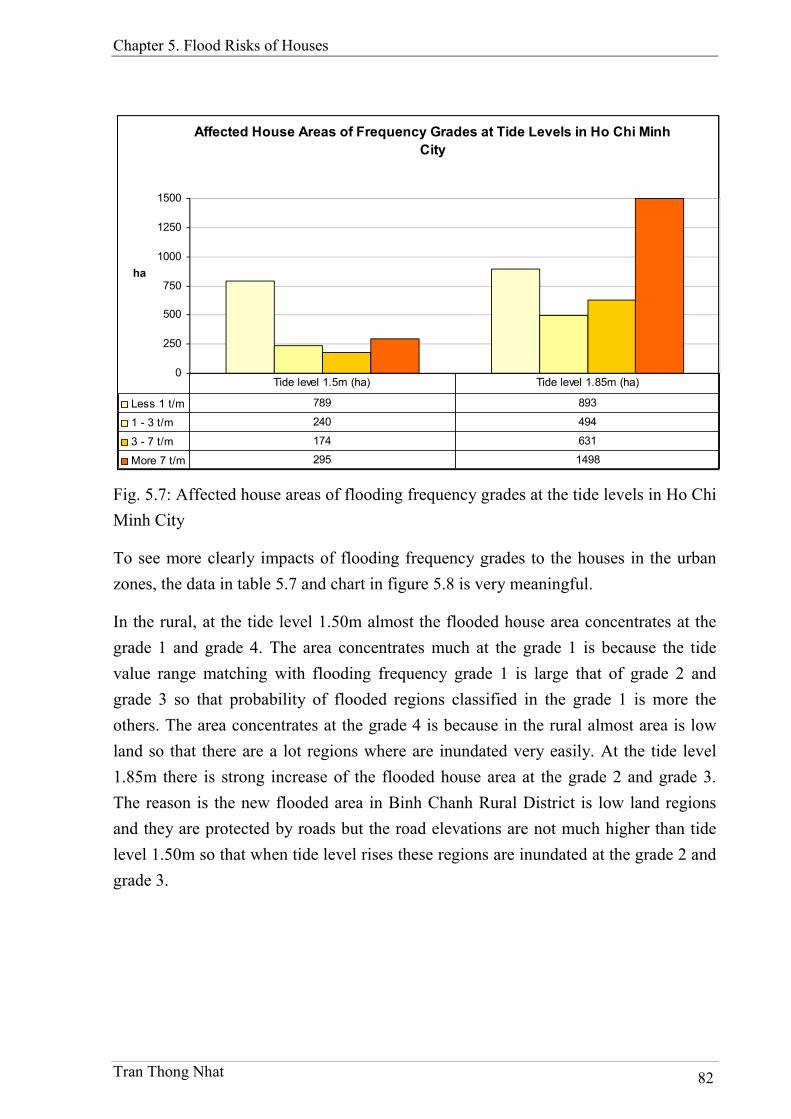
Chapter 5. Flood Risks of Houses
Tran Thong Nhat 82
Affected House Areas of Frequency Grades at Tide Levels in Ho Chi Minh
City
0
250
500
750
1000
1250
1500
ha
Less 1 t/m 789 893
1 - 3 t/m 240 494
3 - 7 t/m 174 631
More 7 t/m 295 1498
Tide level 1.5m (ha) Tide level 1.85m (ha)
Fig. 5.7: Affected house areas of flooding frequency grades at the tide levels in Ho Chi
Minh City
To see more clearly impacts of flooding frequency grades to the houses in the urban
zones, the data in table 5.7 and chart in figure 5.8 is very meaningful.
In the rural, at the tide level 1.50m almost the flooded house area concentrates at the
grade 1 and grade 4. The area concentrates much at the grade 1 is because the tide
value range matching with flooding frequency grade 1 is large that of grade 2 and
grade 3 so that probability of flooded regions classified in the grade 1 is more the
others. The area concentrates at the grade 4 is because in the rural almost area is low
land so that there are a lot regions where are inundated very easily. At the tide level
1.85m there is strong increase of the flooded house area at the grade 2 and grade 3.
The reason is the new flooded area in Binh Chanh Rural District is low land regions
and they are protected by roads but the road elevations are not much higher than tide
level 1.50m so that when tide level rises these regions are inundated at the grade 2 and
grade 3.
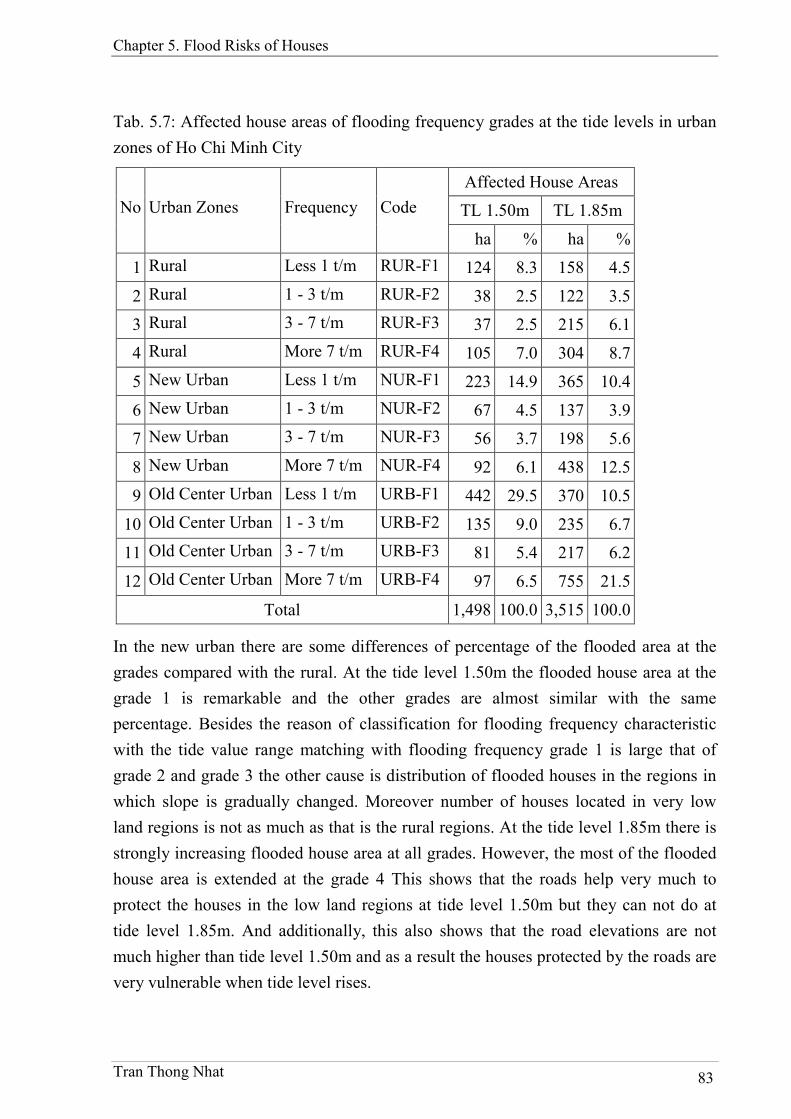
Chapter 5. Flood Risks of Houses
Tran Thong Nhat 83
Tab. 5.7: Affected house areas of flooding frequency grades at the tide levels in urban
zones of Ho Chi Minh City
Affected House Areas
TL 1.50m TL 1.85m No Urban Zones Frequency Code
ha % ha %
1 Rural Less 1 t/m RUR-F1 124 8.3 158 4.5
2 Rural 1 - 3 t/m RUR-F2 38 2.5 122 3.5
3 Rural 3 - 7 t/m RUR-F3 37 2.5 215 6.1
4 Rural More 7 t/m RUR-F4 105 7.0 304 8.7
5 New Urban Less 1 t/m NUR-F1 223 14.9 365 10.4
6 New Urban 1 - 3 t/m NUR-F2 67 4.5 137 3.9
7 New Urban 3 - 7 t/m NUR-F3 56 3.7 198 5.6
8 New Urban More 7 t/m NUR-F4 92 6.1 438 12.5
9 Old Center Urban Less 1 t/m URB-F1 442 29.5 370 10.5
10 Old Center Urban 1 - 3 t/m URB-F2 135 9.0 235 6.7
11 Old Center Urban 3 - 7 t/m URB-F3 81 5.4 217 6.2
12 Old Center Urban More 7 t/m URB-F4 97 6.5 755 21.5
Total 1,498 100.0 3,515 100.0
In the new urban there are some differences of percentage of the flooded area at the
grades compared with the rural. At the tide level 1.50m the flooded house area at the
grade 1 is remarkable and the other grades are almost similar with the same
percentage. Besides the reason of classification for flooding frequency characteristic
with the tide value range matching with flooding frequency grade 1 is large that of
grade 2 and grade 3 the other cause is distribution of flooded houses in the regions in
which slope is gradually changed. Moreover number of houses located in very low
land regions is not as much as that is the rural regions. At the tide level 1.85m there is
strongly increasing flooded house area at all grades. However, the most of the flooded
house area is extended at the grade 4 This shows that the roads help very much to
protect the houses in the low land regions at tide level 1.50m but they can not do at
tide level 1.85m. And additionally, this also shows that the road elevations are not
much higher than tide level 1.50m and as a result the houses protected by the roads are
very vulnerable when tide level rises.
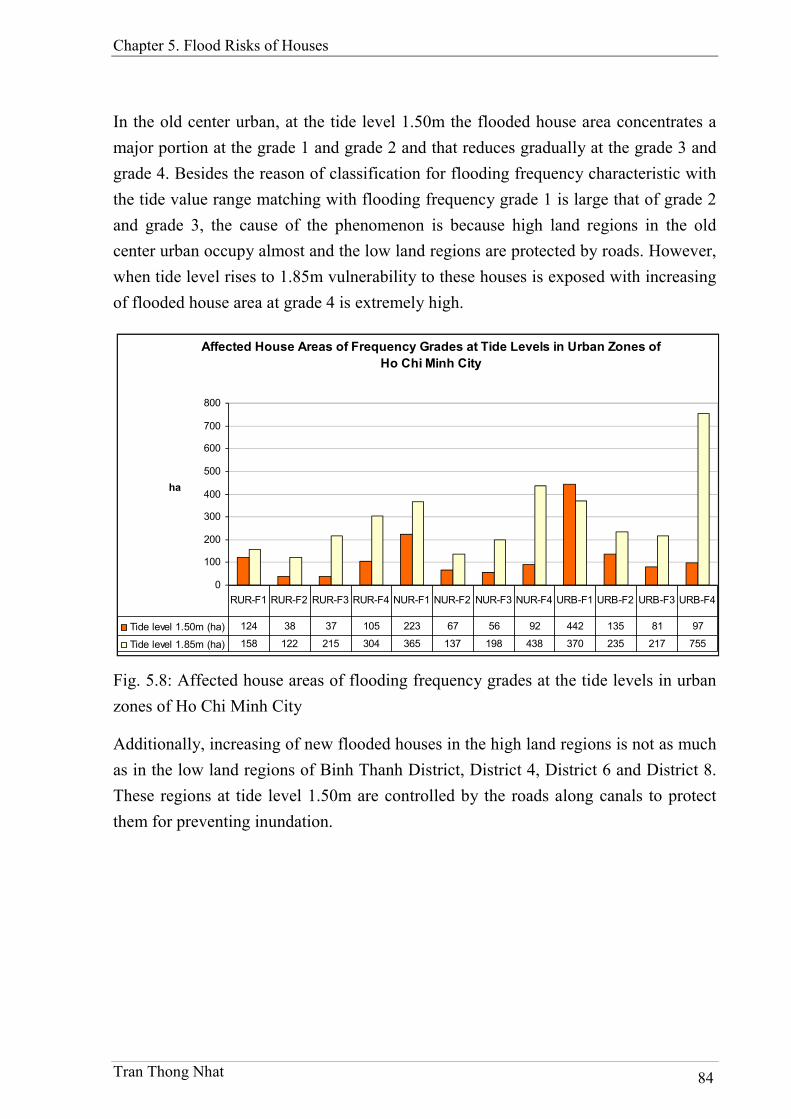
Chapter 5. Flood Risks of Houses
Tran Thong Nhat 84
In the old center urban, at the tide level 1.50m the flooded house area concentrates a
major portion at the grade 1 and grade 2 and that reduces gradually at the grade 3 and
grade 4. Besides the reason of classification for flooding frequency characteristic with
the tide value range matching with flooding frequency grade 1 is large that of grade 2
and grade 3, the cause of the phenomenon is because high land regions in the old
center urban occupy almost and the low land regions are protected by roads. However,
when tide level rises to 1.85m vulnerability to these houses is exposed with increasing
of flooded house area at grade 4 is extremely high.
Affected House Areas of Frequency Grades at Tide Levels in Urban Zones of
Ho Chi Minh City
0
100
200
300
400
500
600
700
800
ha
Tide level 1.50m (ha) 124 38 37 105 223 67 56 92 442 135 81 97
Tide level 1.85m (ha) 158 122 215 304 365 137 198 438 370 235 217 755
RUR-F1 RUR-F2 RUR-F3 RUR-F4 NUR-F1 NUR-F2 NUR-F3 NUR-F4 URB-F1 URB-F2 URB-F3 URB-F4
Fig. 5.8: Affected house areas of flooding frequency grades at the tide levels in urban
zones of Ho Chi Minh City
Additionally, increasing of new flooded houses in the high land regions is not as much
as in the low land regions of Binh Thanh District, District 4, District 6 and District 8.
These regions at tide level 1.50m are controlled by the roads along canals to protect
them for preventing inundation.
Chapter 6. Flood Risk of Population
Tran Thong Nhat 85
Chapter 6. Flood Risk of Population
1. Introduction
As mention in the chapter 5, assessment of the flood risk is classed to tangible,
intangible, direct and indirect damages (Proverbs & Soetanto, 2004). But with
applying GIS to evaluate impacts and risks caused by flood damage, the study will
focus on the direct tangible losses.
With the analysis of the important aspects to the human, continuously the assessment
of the flood risk comes identifying quantitative and qualitative of population in the
study area. This is the most essential in the research because inhabitant is host of the
society and subject of any activities. However, assessment method is based on GIS so
that population impacted by flood risk needs to be based on one of the spatial objects
that relate to inhabitant. In the research the spatial objects are houses therefore the
houses are evaluated firstly and the population is calculated later on.
Similarly in the chapter 5, the assessment of flood risk to population will be performed
on the time scenarios in 2030 with the sea level rise in the highest scenario of climate
change in Ho Chi Minh City as mentioned in the section 4.4 of the chapter 3. In the
scenario, the maximum tide level is 1.85m and data of this scenario will be used to
assess the flood risk for houses in the study area. The assessment of flood risk is
conducted at two levels that are 1.85m and 1.50m. The first level is the maximum and
the second is the most dangerous warning level at the current in Ho Chi Minh City at
Phu An tidal station. Moreover, the second level is interested as the delegation of the
level at the current time.
Risk analysis is the identification of the number of population located in the areas
affected by the flooding with the parameters of flood risk including: flooding duration,
flooding depth and frequency of flooding. The number of the population that is
considered to be at flooding risk is the inhabitant exposed to flooded areas.
Similarly to the houses, identifying impact grades of the flood characteristics to
population for different regions, the assessment process is based on the flooding

Chapter 6. Flood Risk of Population
Tran Thong Nhat 86
characteristics. Therefore, the research classifies Ho Chi Minh City to three urban
zones (PMVG, 1997; PMVG, 2003). The first zone is called old center urban which
includes the old city center and districts. The second zone is called new urban which
includes the new districts that are separated from the old rural. And the last one is calls
rural which the rest of Ho Chi Minh City is.
2. Method
Analysis of the number of people affected is a problem because of movement of
human and so that the precision and methods somehow to proceed are often more
resources and time costs. Human are not the ground objects so that the assessment can
only be relative, forecast even if applying traditional methods which are the actual
investigation. The cause of these is because of the constantly changing and often of
residents in the study area.
For GIS, measuring number of living creatures is usually based on the spatial regions
where the creatures are settling. Like wisely to define amount of affected people by
flood needs to calculate quantification of spatial zones where residents are locating is
flooded. Then based on the affected area of the spatial zones will determine the
number of flood affected people from density value at the administrative level such as
district, commune or city. The spatial zones for inhabitants living are usually used
administration units (ADB, 2009a; ADB, 2009b; ADB, 2009c; WB, 2010) such as
communes, districts… or areas of residential land use type or areas of houses
(Maantay et al., 2010; Nhat, 2011). With three types of the spatial zones to calculate
the population living on there, the spatial zones are the areas of the houses are the best
accuracy because theoretically, these areas are the most fixing and suiting with the
inhabitants living. In this study, population is data collected in 2009 but the houses
data is captured 2006 therefore there are a conflict within time but the data is the
general problem in the research. But theoretically approach based on the areas of
houses is the best and in the research, the spatial zones are the areas of the houses are
still selected.
The population data is enclosed in the commune administration. Therefore, to
calculate the affected number of inhabitants the first step is computation of the density
of inhabitant per house area for each commune. The second step is determined the
affected house areas. And the final is calculation of the number of the affected
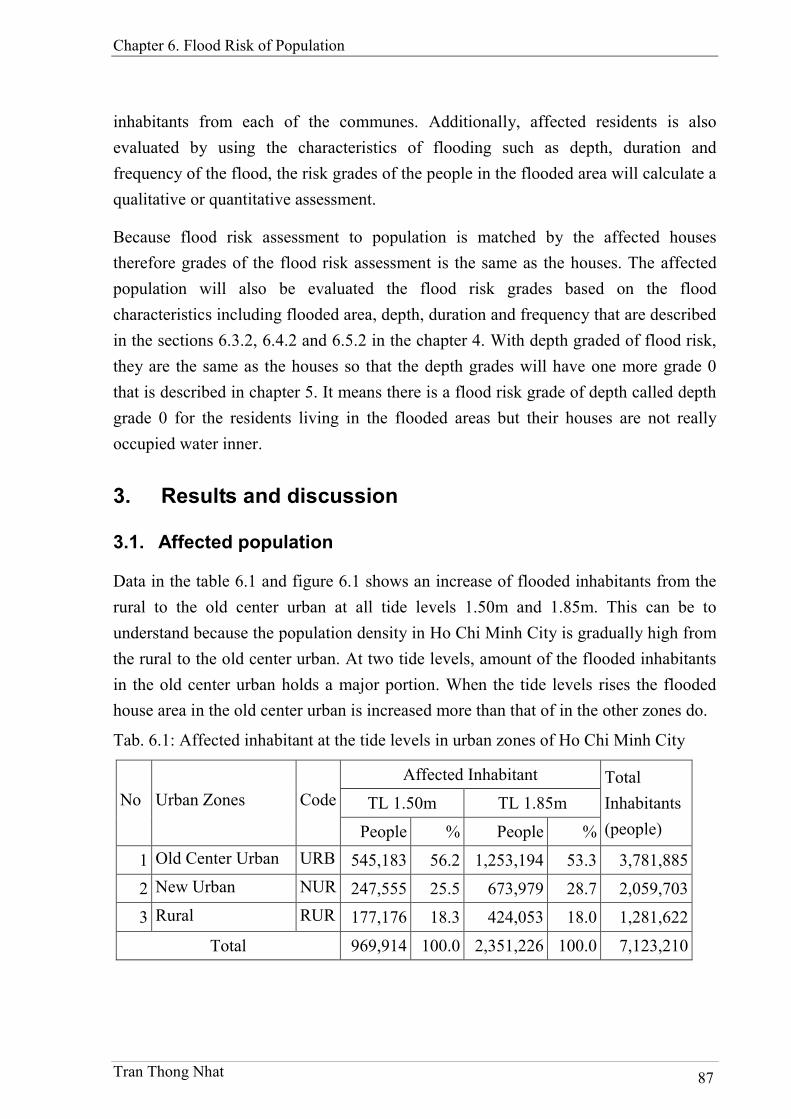
Chapter 6. Flood Risk of Population
Tran Thong Nhat 87
inhabitants from each of the communes. Additionally, affected residents is also
evaluated by using the characteristics of flooding such as depth, duration and
frequency of the flood, the risk grades of the people in the flooded area will calculate a
qualitative or quantitative assessment.
Because flood risk assessment to population is matched by the affected houses
therefore grades of the flood risk assessment is the same as the houses. The affected
population will also be evaluated the flood risk grades based on the flood
characteristics including flooded area, depth, duration and frequency that are described
in the sections 6.3.2, 6.4.2 and 6.5.2 in the chapter 4. With depth graded of flood risk,
they are the same as the houses so that the depth grades will have one more grade 0
that is described in chapter 5. It means there is a flood risk grade of depth called depth
grade 0 for the residents living in the flooded areas but their houses are not really
occupied water inner.
3. Results and discussion
3.1. Affected population
Data in the table 6.1 and figure 6.1 shows an increase of flooded inhabitants from the
rural to the old center urban at all tide levels 1.50m and 1.85m. This can be to
understand because the population density in Ho Chi Minh City is gradually high from
the rural to the old center urban. At two tide levels, amount of the flooded inhabitants
in the old center urban holds a major portion. When the tide levels rises the flooded
house area in the old center urban is increased more than that of in the other zones do.
Tab. 6.1: Affected inhabitant at the tide levels in urban zones of Ho Chi Minh City
Affected Inhabitant
TL 1.50m TL 1.85m No Urban Zones Code
People % People %
Total
Inhabitants
(people)
1 Old Center Urban URB 545,183 56.2 1,253,194 53.3 3,781,885
2 New Urban NUR 247,555 25.5 673,979 28.7 2,059,703
3 Rural RUR 177,176 18.3 424,053 18.0 1,281,622
Total 969,914 100.0 2,351,226 100.0 7,123,210
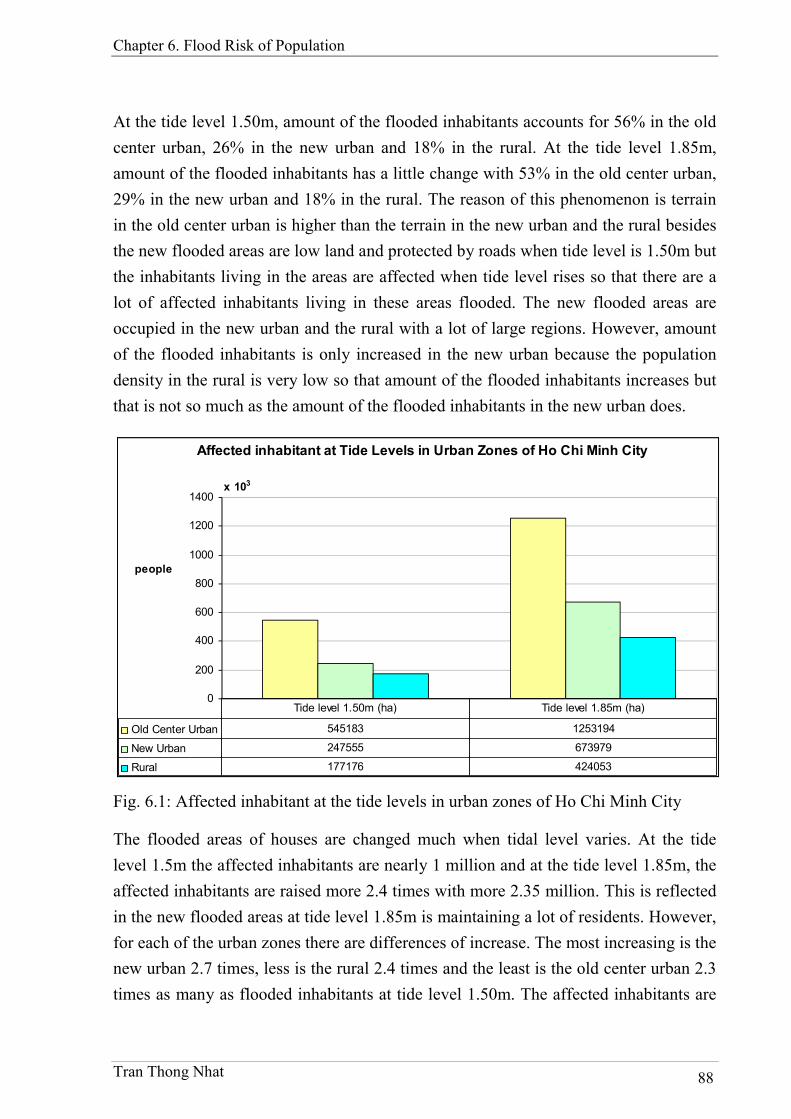
Chapter 6. Flood Risk of Population
Tran Thong Nhat 88
At the tide level 1.50m, amount of the flooded inhabitants accounts for 56% in the old
center urban, 26% in the new urban and 18% in the rural. At the tide level 1.85m,
amount of the flooded inhabitants has a little change with 53% in the old center urban,
29% in the new urban and 18% in the rural. The reason of this phenomenon is terrain
in the old center urban is higher than the terrain in the new urban and the rural besides
the new flooded areas are low land and protected by roads when tide level is 1.50m but
the inhabitants living in the areas are affected when tide level rises so that there are a
lot of affected inhabitants living in these areas flooded. The new flooded areas are
occupied in the new urban and the rural with a lot of large regions. However, amount
of the flooded inhabitants is only increased in the new urban because the population
density in the rural is very low so that amount of the flooded inhabitants increases but
that is not so much as the amount of the flooded inhabitants in the new urban does.
Affected inhabitant at Tide Levels in Urban Zones of Ho Chi Minh City
0
200
400
600
800
1000
1200
1400x 103
people
Old Center Urban 545183 1253194
New Urban 247555 673979
Rural 177176 424053
Tide level 1.50m (ha) Tide level 1.85m (ha)
Fig. 6.1: Affected inhabitant at the tide levels in urban zones of Ho Chi Minh City
The flooded areas of houses are changed much when tidal level varies. At the tide
level 1.5m the affected inhabitants are nearly 1 million and at the tide level 1.85m, the
affected inhabitants are raised more 2.4 times with more 2.35 million. This is reflected
in the new flooded areas at tide level 1.85m is maintaining a lot of residents. However,
for each of the urban zones there are differences of increase. The most increasing is the
new urban 2.7 times, less is the rural 2.4 times and the least is the old center urban 2.3
times as many as flooded inhabitants at tide level 1.50m. The affected inhabitants are
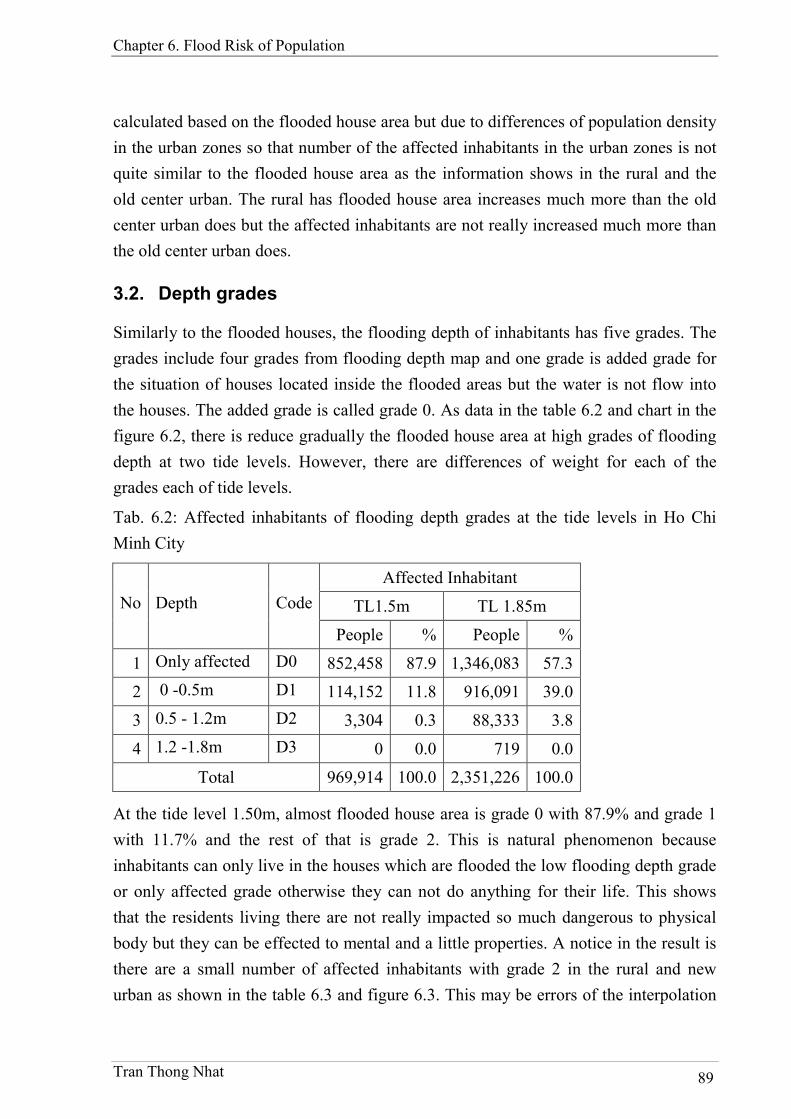
Chapter 6. Flood Risk of Population
Tran Thong Nhat 89
calculated based on the flooded house area but due to differences of population density
in the urban zones so that number of the affected inhabitants in the urban zones is not
quite similar to the flooded house area as the information shows in the rural and the
old center urban. The rural has flooded house area increases much more than the old
center urban does but the affected inhabitants are not really increased much more than
the old center urban does.
3.2. Depth grades
Similarly to the flooded houses, the flooding depth of inhabitants has five grades. The
grades include four grades from flooding depth map and one grade is added grade for
the situation of houses located inside the flooded areas but the water is not flow into
the houses. The added grade is called grade 0. As data in the table 6.2 and chart in the
figure 6.2, there is reduce gradually the flooded house area at high grades of flooding
depth at two tide levels. However, there are differences of weight for each of the
grades each of tide levels.
Tab. 6.2: Affected inhabitants of flooding depth grades at the tide levels in Ho Chi
Minh City
Affected Inhabitant
TL1.5m TL 1.85m No Depth Code
People % People %
1 Only affected D0 852,458 87.9 1,346,083 57.3
2 0 -0.5m D1 114,152 11.8 916,091 39.0
3 0.5 - 1.2m D2 3,304 0.3 88,333 3.8
4 1.2 -1.8m D3 0 0.0 719 0.0
Total 969,914 100.0 2,351,226 100.0
At the tide level 1.50m, almost flooded house area is grade 0 with 87.9% and grade 1
with 11.7% and the rest of that is grade 2. This is natural phenomenon because
inhabitants can only live in the houses which are flooded the low flooding depth grade
or only affected grade otherwise they can not do anything for their life. This shows
that the residents living there are not really impacted so much dangerous to physical
body but they can be effected to mental and a little properties. A notice in the result is
there are a small number of affected inhabitants with grade 2 in the rural and new
urban as shown in the table 6.3 and figure 6.3. This may be errors of the interpolation
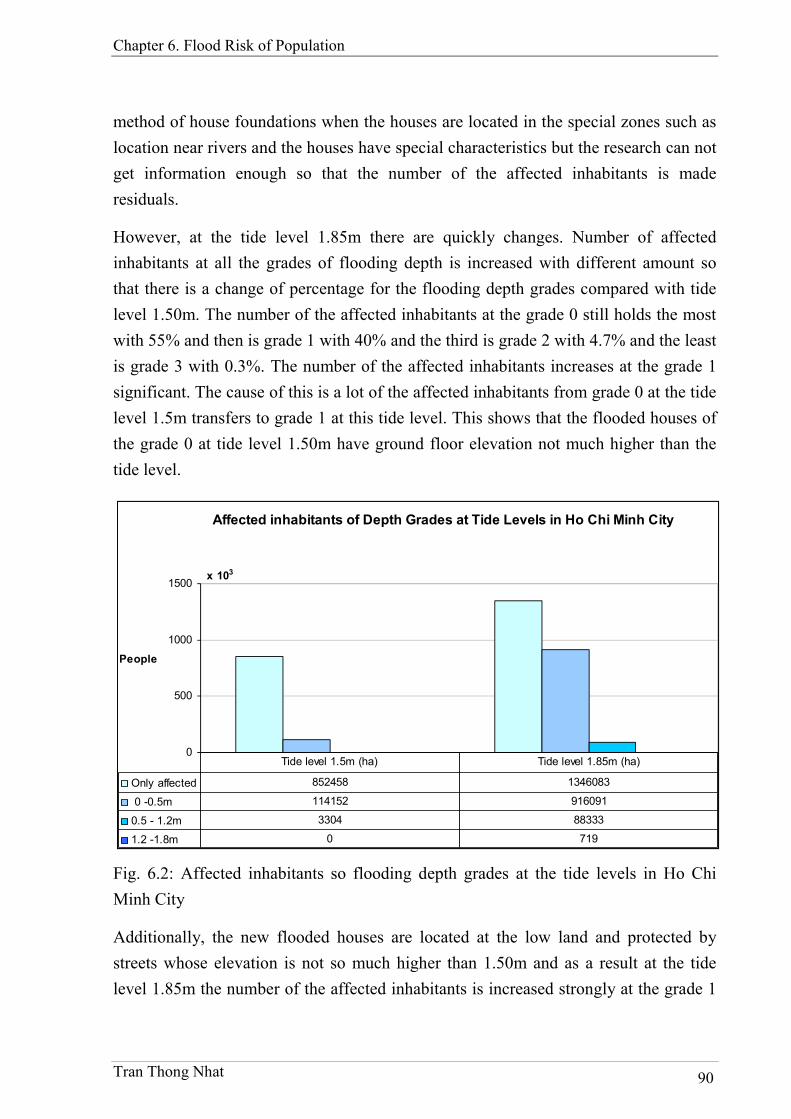
Chapter 6. Flood Risk of Population
Tran Thong Nhat 90
method of house foundations when the houses are located in the special zones such as
location near rivers and the houses have special characteristics but the research can not
get information enough so that the number of the affected inhabitants is made
residuals.
However, at the tide level 1.85m there are quickly changes. Number of affected
inhabitants at all the grades of flooding depth is increased with different amount so
that there is a change of percentage for the flooding depth grades compared with tide
level 1.50m. The number of the affected inhabitants at the grade 0 still holds the most
with 55% and then is grade 1 with 40% and the third is grade 2 with 4.7% and the least
is grade 3 with 0.3%. The number of the affected inhabitants increases at the grade 1
significant. The cause of this is a lot of the affected inhabitants from grade 0 at the tide
level 1.5m transfers to grade 1 at this tide level. This shows that the flooded houses of
the grade 0 at tide level 1.50m have ground floor elevation not much higher than the
tide level.
Affected inhabitants of Depth Grades at Tide Levels in Ho Chi Minh City
0
500
1000
1500x 103
People
Only affected 852458 1346083
0 -0.5m 114152 916091
0.5 - 1.2m 3304 88333
1.2 -1.8m 0 719
Tide level 1.5m (ha) Tide level 1.85m (ha)
Fig. 6.2: Affected inhabitants so flooding depth grades at the tide levels in Ho Chi
Minh City
Additionally, the new flooded houses are located at the low land and protected by
streets whose elevation is not so much higher than 1.50m and as a result at the tide
level 1.85m the number of the affected inhabitants is increased strongly at the grade 1
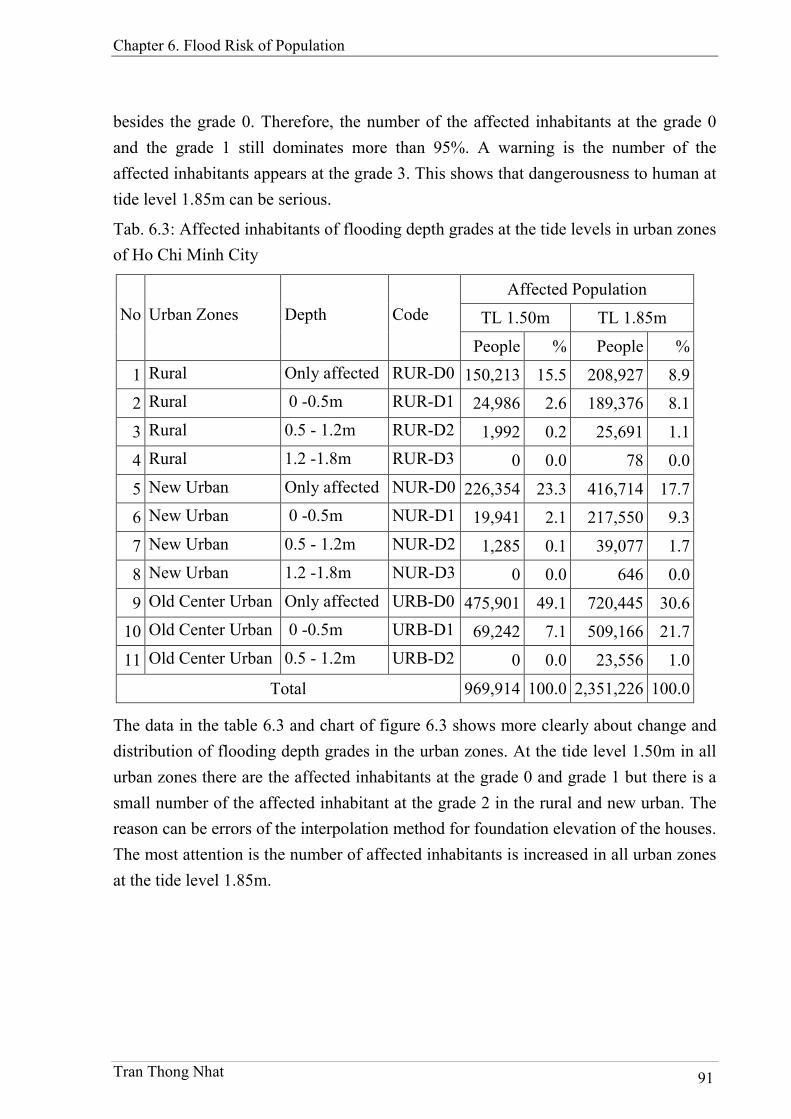
Chapter 6. Flood Risk of Population
Tran Thong Nhat 91
besides the grade 0. Therefore, the number of the affected inhabitants at the grade 0
and the grade 1 still dominates more than 95%. A warning is the number of the
affected inhabitants appears at the grade 3. This shows that dangerousness to human at
tide level 1.85m can be serious.
Tab. 6.3: Affected inhabitants of flooding depth grades at the tide levels in urban zones
of Ho Chi Minh City
Affected Population
TL 1.50m TL 1.85m No Urban Zones Depth Code
People % People %
1 Rural Only affected RUR-D0 150,213 15.5 208,927 8.9
2 Rural 0 -0.5m RUR-D1 24,986 2.6 189,376 8.1
3 Rural 0.5 - 1.2m RUR-D2 1,992 0.2 25,691 1.1
4 Rural 1.2 -1.8m RUR-D3 0 0.0 78 0.0
5 New Urban Only affected NUR-D0 226,354 23.3 416,714 17.7
6 New Urban 0 -0.5m NUR-D1 19,941 2.1 217,550 9.3
7 New Urban 0.5 - 1.2m NUR-D2 1,285 0.1 39,077 1.7
8 New Urban 1.2 -1.8m NUR-D3 0 0.0 646 0.0
9 Old Center Urban Only affected URB-D0 475,901 49.1 720,445 30.6
10 Old Center Urban 0 -0.5m URB-D1 69,242 7.1 509,166 21.7
11 Old Center Urban 0.5 - 1.2m URB-D2 0 0.0 23,556 1.0
Total 969,914 100.0 2,351,226 100.0
The data in the table 6.3 and chart of figure 6.3 shows more clearly about change and
distribution of flooding depth grades in the urban zones. At the tide level 1.50m in all
urban zones there are the affected inhabitants at the grade 0 and grade 1 but there is a
small number of the affected inhabitant at the grade 2 in the rural and new urban. The
reason can be errors of the interpolation method for foundation elevation of the houses.
The most attention is the number of affected inhabitants is increased in all urban zones
at the tide level 1.85m.
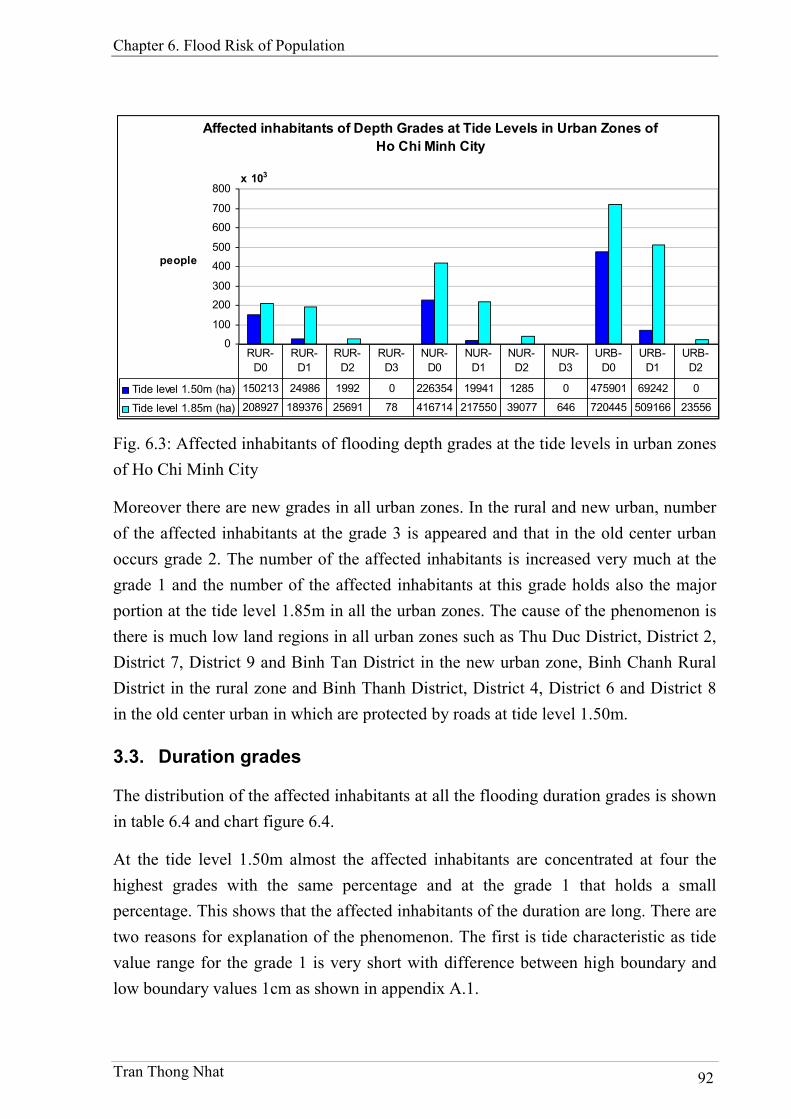
Chapter 6. Flood Risk of Population
Tran Thong Nhat 92
Affected inhabitants of Depth Grades at Tide Levels in Urban Zones of
Ho Chi Minh City
0
100
200
300
400
500
600
700
800x 103
people
Tide level 1.50m (ha) 150213 24986 1992 0 226354 19941 1285 0 475901 69242 0
Tide level 1.85m (ha) 208927 189376 25691 78 416714 217550 39077 646 720445 509166 23556
RUR-
D0
RUR-
D1
RUR-
D2
RUR-
D3
NUR-
D0
NUR-
D1
NUR-
D2
NUR-
D3
URB-
D0
URB-
D1
URB-
D2
Fig. 6.3: Affected inhabitants of flooding depth grades at the tide levels in urban zones
of Ho Chi Minh City
Moreover there are new grades in all urban zones. In the rural and new urban, number
of the affected inhabitants at the grade 3 is appeared and that in the old center urban
occurs grade 2. The number of the affected inhabitants is increased very much at the
grade 1 and the number of the affected inhabitants at this grade holds also the major
portion at the tide level 1.85m in all the urban zones. The cause of the phenomenon is
there is much low land regions in all urban zones such as Thu Duc District, District 2,
District 7, District 9 and Binh Tan District in the new urban zone, Binh Chanh Rural
District in the rural zone and Binh Thanh District, District 4, District 6 and District 8
in the old center urban in which are protected by roads at tide level 1.50m.
3.3. Duration grades
The distribution of the affected inhabitants at all the flooding duration grades is shown
in table 6.4 and chart figure 6.4.
At the tide level 1.50m almost the affected inhabitants are concentrated at four the
highest grades with the same percentage and at the grade 1 that holds a small
percentage. This shows that the affected inhabitants of the duration are long. There are
two reasons for explanation of the phenomenon. The first is tide characteristic as tide
value range for the grade 1 is very short with difference between high boundary and
low boundary values 1cm as shown in appendix A.1.
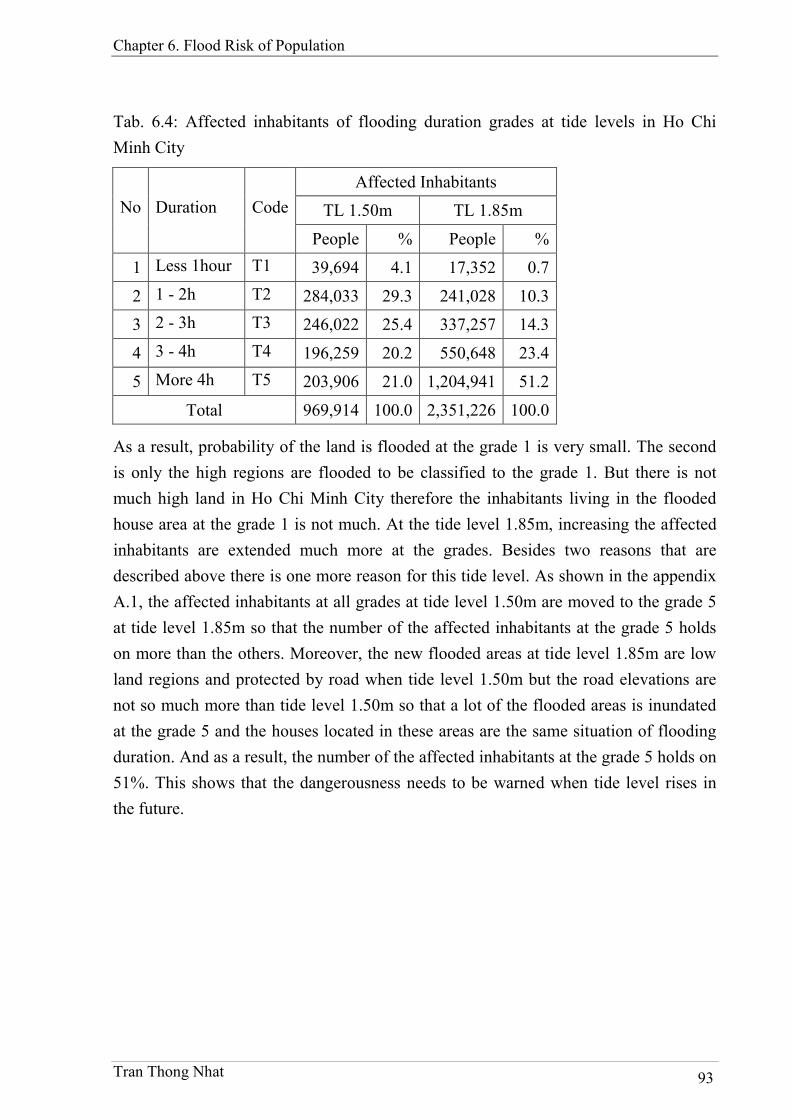
Chapter 6. Flood Risk of Population
Tran Thong Nhat 93
Tab. 6.4: Affected inhabitants of flooding duration grades at tide levels in Ho Chi
Minh City
Affected Inhabitants
TL 1.50m TL 1.85m No Duration Code
People % People %
1 Less 1hour T1 39,694 4.1 17,352 0.7
2 1 - 2h T2 284,033 29.3 241,028 10.3
3 2 - 3h T3 246,022 25.4 337,257 14.3
4 3 - 4h T4 196,259 20.2 550,648 23.4
5 More 4h T5 203,906 21.0 1,204,941 51.2
Total 969,914 100.0 2,351,226 100.0
As a result, probability of the land is flooded at the grade 1 is very small. The second
is only the high regions are flooded to be classified to the grade 1. But there is not
much high land in Ho Chi Minh City therefore the inhabitants living in the flooded
house area at the grade 1 is not much. At the tide level 1.85m, increasing the affected
inhabitants are extended much more at the grades. Besides two reasons that are
described above there is one more reason for this tide level. As shown in the appendix
A.1, the affected inhabitants at all grades at tide level 1.50m are moved to the grade 5
at tide level 1.85m so that the number of the affected inhabitants at the grade 5 holds
on more than the others. Moreover, the new flooded areas at tide level 1.85m are low
land regions and protected by road when tide level 1.50m but the road elevations are
not so much more than tide level 1.50m so that a lot of the flooded areas is inundated
at the grade 5 and the houses located in these areas are the same situation of flooding
duration. And as a result, the number of the affected inhabitants at the grade 5 holds on
51%. This shows that the dangerousness needs to be warned when tide level rises in
the future.
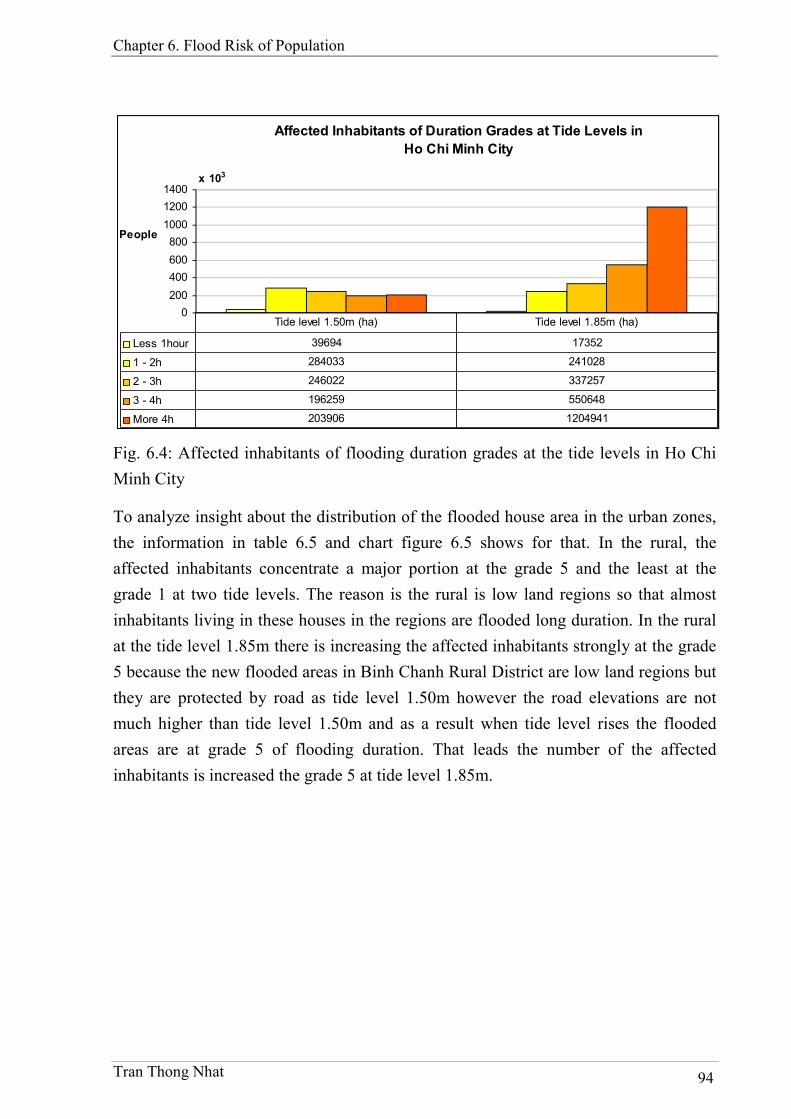
Chapter 6. Flood Risk of Population
Tran Thong Nhat 94
Affected Inhabitants of Duration Grades at Tide Levels in
Ho Chi Minh City
0
200
400
600
800
1000
1200
1400x 103
People
Less 1hour 39694 17352
1 - 2h 284033 241028
2 - 3h 246022 337257
3 - 4h 196259 550648
More 4h 203906 1204941
Tide level 1.50m (ha) Tide level 1.85m (ha)
Fig. 6.4: Affected inhabitants of flooding duration grades at the tide levels in Ho Chi
Minh City
To analyze insight about the distribution of the flooded house area in the urban zones,
the information in table 6.5 and chart figure 6.5 shows for that. In the rural, the
affected inhabitants concentrate a major portion at the grade 5 and the least at the
grade 1 at two tide levels. The reason is the rural is low land regions so that almost
inhabitants living in these houses in the regions are flooded long duration. In the rural
at the tide level 1.85m there is increasing the affected inhabitants strongly at the grade
5 because the new flooded areas in Binh Chanh Rural District are low land regions but
they are protected by road as tide level 1.50m however the road elevations are not
much higher than tide level 1.50m and as a result when tide level rises the flooded
areas are at grade 5 of flooding duration. That leads the number of the affected
inhabitants is increased the grade 5 at tide level 1.85m.
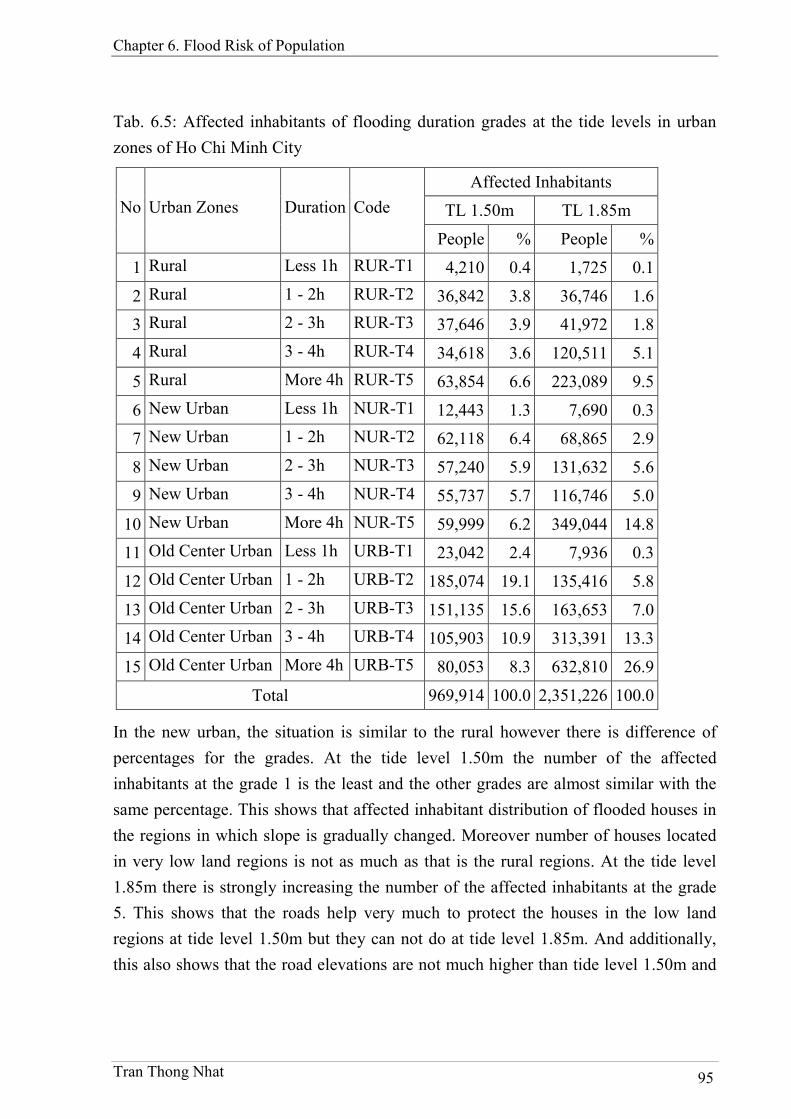
Chapter 6. Flood Risk of Population
Tran Thong Nhat 95
Tab. 6.5: Affected inhabitants of flooding duration grades at the tide levels in urban
zones of Ho Chi Minh City
Affected Inhabitants
TL 1.50m TL 1.85m No Urban Zones Duration Code
People % People %
1 Rural Less 1h RUR-T1 4,210 0.4 1,725 0.1
2 Rural 1 - 2h RUR-T2 36,842 3.8 36,746 1.6
3 Rural 2 - 3h RUR-T3 37,646 3.9 41,972 1.8
4 Rural 3 - 4h RUR-T4 34,618 3.6 120,511 5.1
5 Rural More 4h RUR-T5 63,854 6.6 223,089 9.5
6 New Urban Less 1h NUR-T1 12,443 1.3 7,690 0.3
7 New Urban 1 - 2h NUR-T2 62,118 6.4 68,865 2.9
8 New Urban 2 - 3h NUR-T3 57,240 5.9 131,632 5.6
9 New Urban 3 - 4h NUR-T4 55,737 5.7 116,746 5.0
10 New Urban More 4h NUR-T5 59,999 6.2 349,044 14.8
11 Old Center Urban Less 1h URB-T1 23,042 2.4 7,936 0.3
12 Old Center Urban 1 - 2h URB-T2 185,074 19.1 135,416 5.8
13 Old Center Urban 2 - 3h URB-T3 151,135 15.6 163,653 7.0
14 Old Center Urban 3 - 4h URB-T4 105,903 10.9 313,391 13.3
15 Old Center Urban More 4h URB-T5 80,053 8.3 632,810 26.9
Total 969,914 100.0 2,351,226 100.0
In the new urban, the situation is similar to the rural however there is difference of
percentages for the grades. At the tide level 1.50m the number of the affected
inhabitants at the grade 1 is the least and the other grades are almost similar with the
same percentage. This shows that affected inhabitant distribution of flooded houses in
the regions in which slope is gradually changed. Moreover number of houses located
in very low land regions is not as much as that is the rural regions. At the tide level
1.85m there is strongly increasing the number of the affected inhabitants at the grade
5. This shows that the roads help very much to protect the houses in the low land
regions at tide level 1.50m but they can not do at tide level 1.85m. And additionally,
this also shows that the road elevations are not much higher than tide level 1.50m and
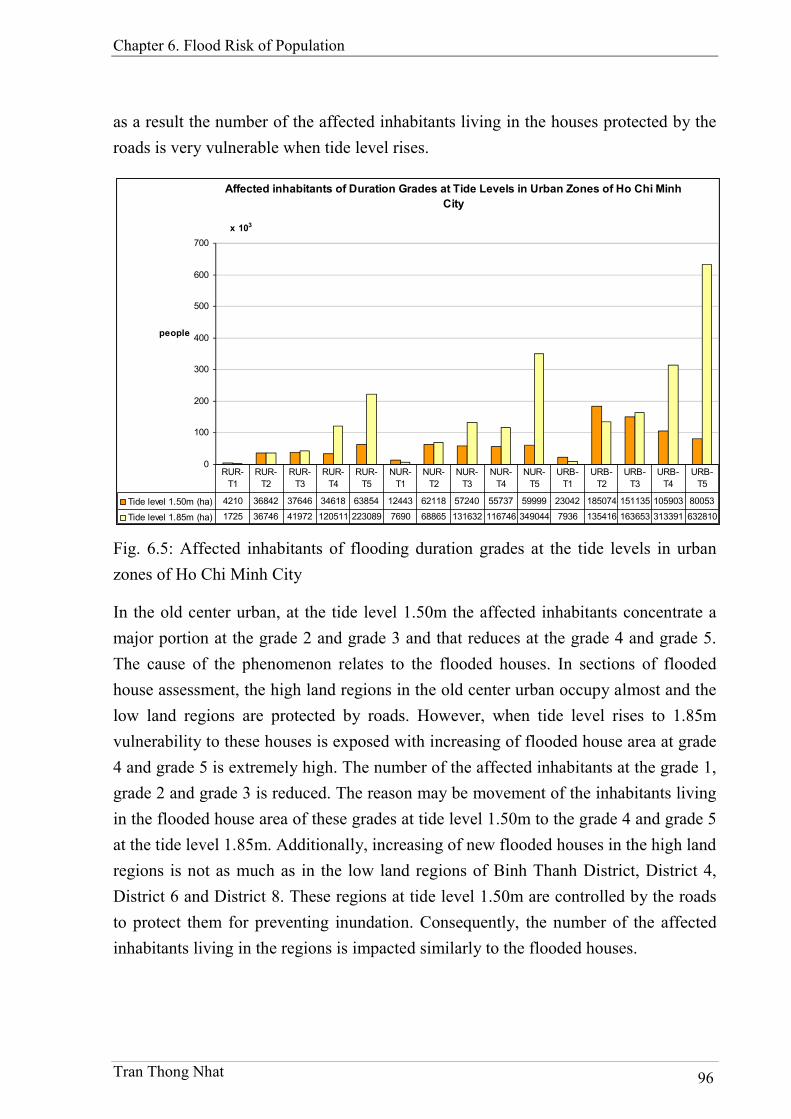
Chapter 6. Flood Risk of Population
Tran Thong Nhat 96
as a result the number of the affected inhabitants living in the houses protected by the
roads is very vulnerable when tide level rises.
Affected inhabitants of Duration Grades at Tide Levels in Urban Zones of Ho Chi Minh
City
0
100
200
300
400
500
600
700
x 103
people
Tide level 1.50m (ha) 4210 36842 37646 34618 63854 12443 62118 57240 55737 59999 23042 185074 151135 105903 80053
Tide level 1.85m (ha) 1725 36746 41972 120511 223089 7690 68865 131632 116746 349044 7936 135416 163653 313391 632810
RUR-
T1
RUR-
T2
RUR-
T3
RUR-
T4
RUR-
T5
NUR-
T1
NUR-
T2
NUR-
T3
NUR-
T4
NUR-
T5
URB-
T1
URB-
T2
URB-
T3
URB-
T4
URB-
T5
Fig. 6.5: Affected inhabitants of flooding duration grades at the tide levels in urban
zones of Ho Chi Minh City
In the old center urban, at the tide level 1.50m the affected inhabitants concentrate a
major portion at the grade 2 and grade 3 and that reduces at the grade 4 and grade 5.
The cause of the phenomenon relates to the flooded houses. In sections of flooded
house assessment, the high land regions in the old center urban occupy almost and the
low land regions are protected by roads. However, when tide level rises to 1.85m
vulnerability to these houses is exposed with increasing of flooded house area at grade
4 and grade 5 is extremely high. The number of the affected inhabitants at the grade 1,
grade 2 and grade 3 is reduced. The reason may be movement of the inhabitants living
in the flooded house area of these grades at tide level 1.50m to the grade 4 and grade 5
at the tide level 1.85m. Additionally, increasing of new flooded houses in the high land
regions is not as much as in the low land regions of Binh Thanh District, District 4,
District 6 and District 8. These regions at tide level 1.50m are controlled by the roads
to protect them for preventing inundation. Consequently, the number of the affected
inhabitants living in the regions is impacted similarly to the flooded houses.
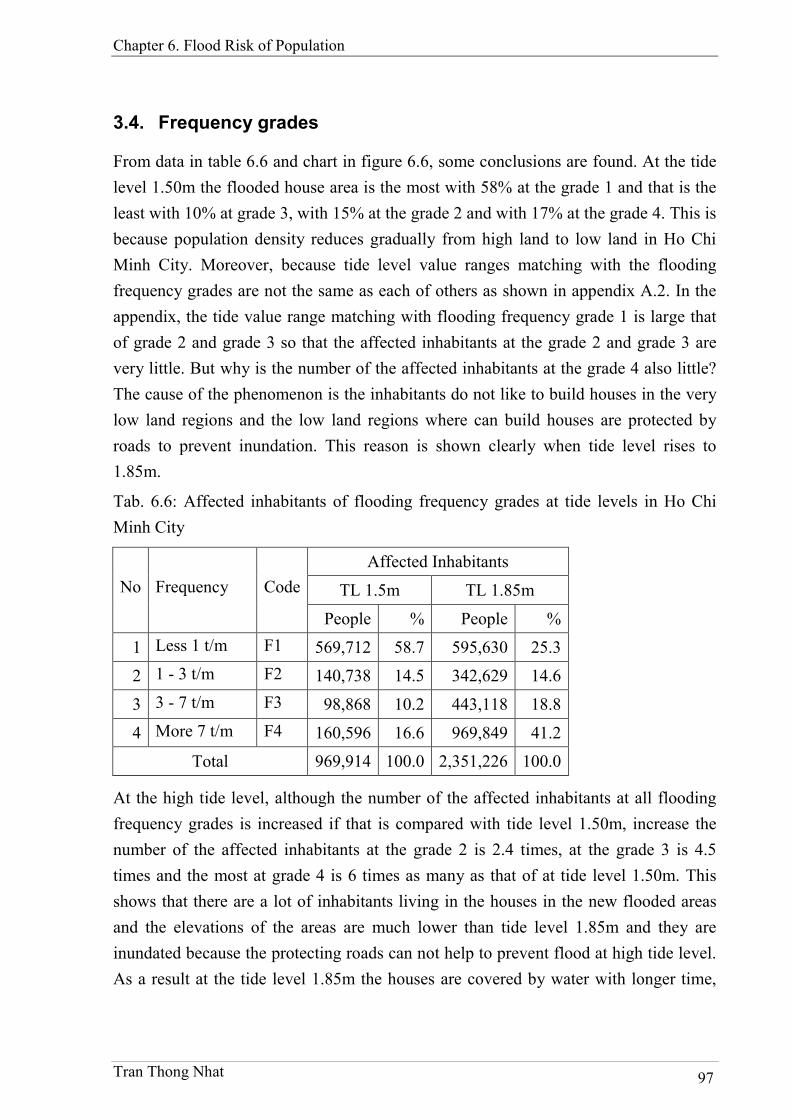
Chapter 6. Flood Risk of Population
Tran Thong Nhat 97
3.4. Frequency grades
From data in table 6.6 and chart in figure 6.6, some conclusions are found. At the tide
level 1.50m the flooded house area is the most with 58% at the grade 1 and that is the
least with 10% at grade 3, with 15% at the grade 2 and with 17% at the grade 4. This is
because population density reduces gradually from high land to low land in Ho Chi
Minh City. Moreover, because tide level value ranges matching with the flooding
frequency grades are not the same as each of others as shown in appendix A.2. In the
appendix, the tide value range matching with flooding frequency grade 1 is large that
of grade 2 and grade 3 so that the affected inhabitants at the grade 2 and grade 3 are
very little. But why is the number of the affected inhabitants at the grade 4 also little?
The cause of the phenomenon is the inhabitants do not like to build houses in the very
low land regions and the low land regions where can build houses are protected by
roads to prevent inundation. This reason is shown clearly when tide level rises to
1.85m.
Tab. 6.6: Affected inhabitants of flooding frequency grades at tide levels in Ho Chi
Minh City
Affected Inhabitants
TL 1.5m TL 1.85m No Frequency Code
People % People %
1 Less 1 t/m F1 569,712 58.7 595,630 25.3
2 1 - 3 t/m F2 140,738 14.5 342,629 14.6
3 3 - 7 t/m F3 98,868 10.2 443,118 18.8
4 More 7 t/m F4 160,596 16.6 969,849 41.2
Total 969,914 100.0 2,351,226 100.0
At the high tide level, although the number of the affected inhabitants at all flooding
frequency grades is increased if that is compared with tide level 1.50m, increase the
number of the affected inhabitants at the grade 2 is 2.4 times, at the grade 3 is 4.5
times and the most at grade 4 is 6 times as many as that of at tide level 1.50m. This
shows that there are a lot of inhabitants living in the houses in the new flooded areas
and the elevations of the areas are much lower than tide level 1.85m and they are
inundated because the protecting roads can not help to prevent flood at high tide level.
As a result at the tide level 1.85m the houses are covered by water with longer time,
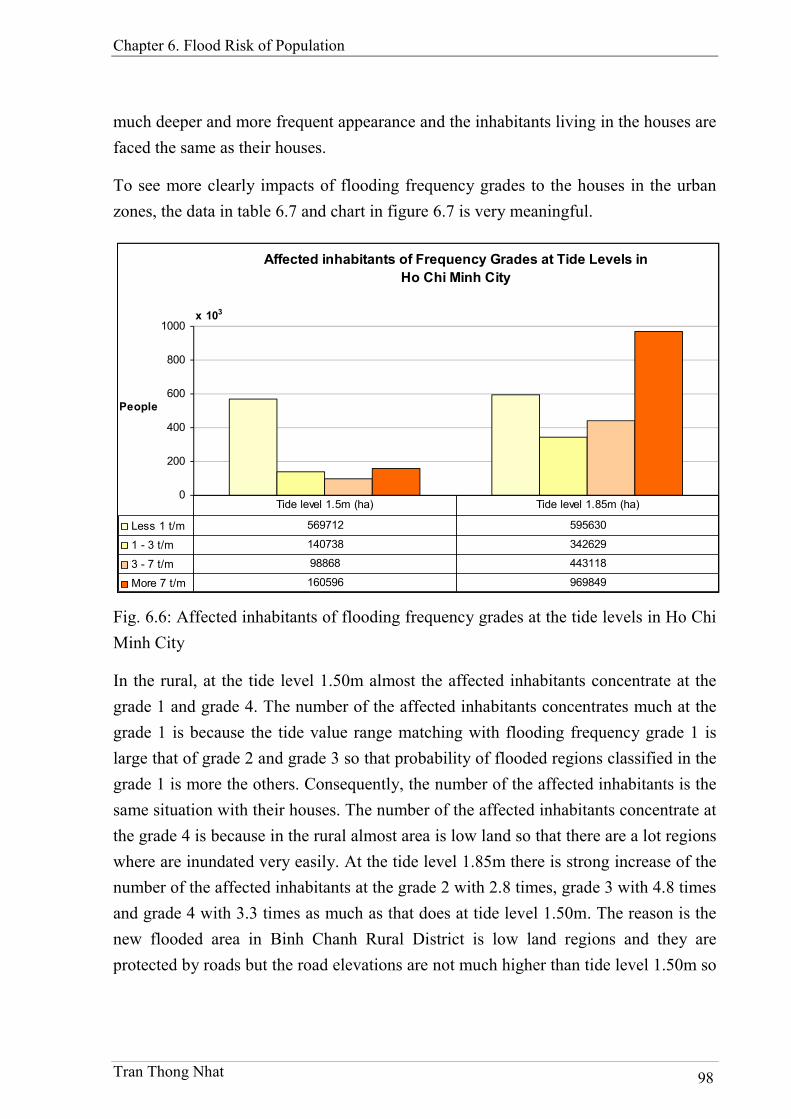
Chapter 6. Flood Risk of Population
Tran Thong Nhat 98
much deeper and more frequent appearance and the inhabitants living in the houses are
faced the same as their houses.
To see more clearly impacts of flooding frequency grades to the houses in the urban
zones, the data in table 6.7 and chart in figure 6.7 is very meaningful.
Affected inhabitants of Frequency Grades at Tide Levels in
Ho Chi Minh City
0
200
400
600
800
1000x 103
People
Less 1 t/m 569712 595630
1 - 3 t/m 140738 342629
3 - 7 t/m 98868 443118
More 7 t/m 160596 969849
Tide level 1.5m (ha) Tide level 1.85m (ha)
Fig. 6.6: Affected inhabitants of flooding frequency grades at the tide levels in Ho Chi
Minh City
In the rural, at the tide level 1.50m almost the affected inhabitants concentrate at the
grade 1 and grade 4. The number of the affected inhabitants concentrates much at the
grade 1 is because the tide value range matching with flooding frequency grade 1 is
large that of grade 2 and grade 3 so that probability of flooded regions classified in the
grade 1 is more the others. Consequently, the number of the affected inhabitants is the
same situation with their houses. The number of the affected inhabitants concentrate at
the grade 4 is because in the rural almost area is low land so that there are a lot regions
where are inundated very easily. At the tide level 1.85m there is strong increase of the
number of the affected inhabitants at the grade 2 with 2.8 times, grade 3 with 4.8 times
and grade 4 with 3.3 times as much as that does at tide level 1.50m. The reason is the
new flooded area in Binh Chanh Rural District is low land regions and they are
protected by roads but the road elevations are not much higher than tide level 1.50m so
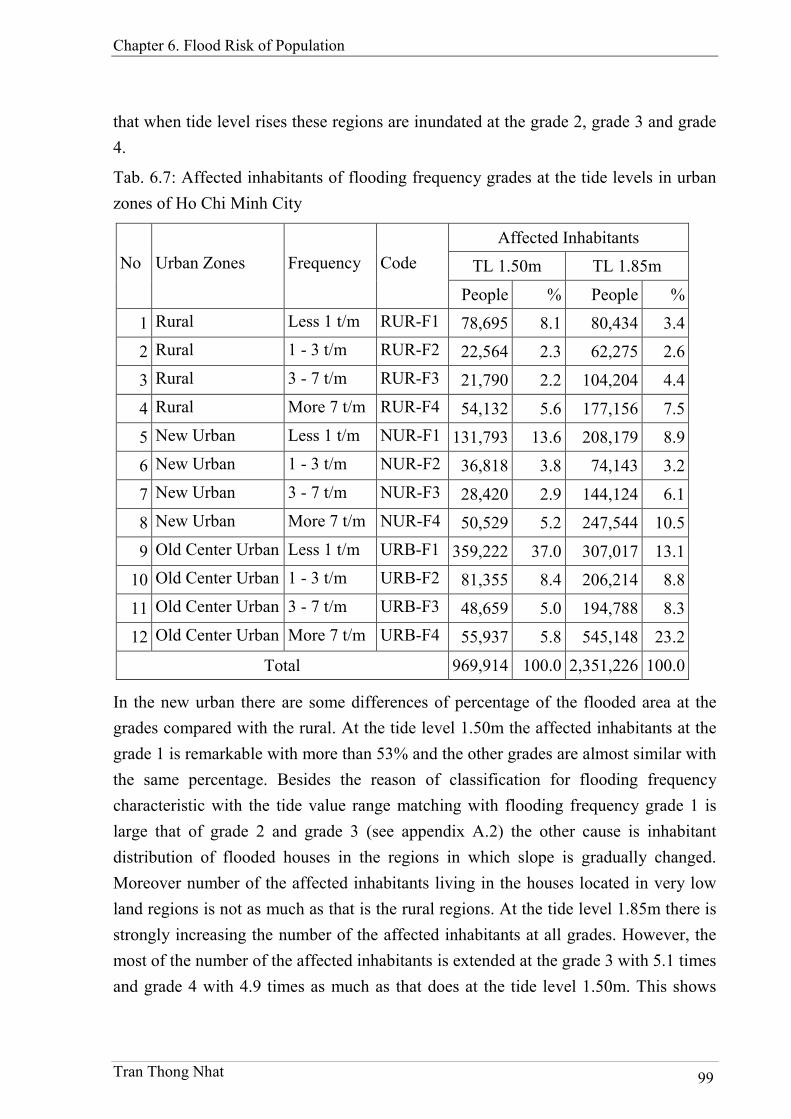
Chapter 6. Flood Risk of Population
Tran Thong Nhat 99
that when tide level rises these regions are inundated at the grade 2, grade 3 and grade
4.
Tab. 6.7: Affected inhabitants of flooding frequency grades at the tide levels in urban
zones of Ho Chi Minh City
Affected Inhabitants
TL 1.50m TL 1.85m No Urban Zones Frequency Code
People % People %
1 Rural Less 1 t/m RUR-F1 78,695 8.1 80,434 3.4
2 Rural 1 - 3 t/m RUR-F2 22,564 2.3 62,275 2.6
3 Rural 3 - 7 t/m RUR-F3 21,790 2.2 104,204 4.4
4 Rural More 7 t/m RUR-F4 54,132 5.6 177,156 7.5
5 New Urban Less 1 t/m NUR-F1 131,793 13.6 208,179 8.9
6 New Urban 1 - 3 t/m NUR-F2 36,818 3.8 74,143 3.2
7 New Urban 3 - 7 t/m NUR-F3 28,420 2.9 144,124 6.1
8 New Urban More 7 t/m NUR-F4 50,529 5.2 247,544 10.5
9 Old Center Urban Less 1 t/m URB-F1 359,222 37.0 307,017 13.1
10 Old Center Urban 1 - 3 t/m URB-F2 81,355 8.4 206,214 8.8
11 Old Center Urban 3 - 7 t/m URB-F3 48,659 5.0 194,788 8.3
12 Old Center Urban More 7 t/m URB-F4 55,937 5.8 545,148 23.2
Total 969,914 100.0 2,351,226 100.0
In the new urban there are some differences of percentage of the flooded area at the
grades compared with the rural. At the tide level 1.50m the affected inhabitants at the
grade 1 is remarkable with more than 53% and the other grades are almost similar with
the same percentage. Besides the reason of classification for flooding frequency
characteristic with the tide value range matching with flooding frequency grade 1 is
large that of grade 2 and grade 3 (see appendix A.2) the other cause is inhabitant
distribution of flooded houses in the regions in which slope is gradually changed.
Moreover number of the affected inhabitants living in the houses located in very low
land regions is not as much as that is the rural regions. At the tide level 1.85m there is
strongly increasing the number of the affected inhabitants at all grades. However, the
most of the number of the affected inhabitants is extended at the grade 3 with 5.1 times
and grade 4 with 4.9 times as much as that does at the tide level 1.50m. This shows
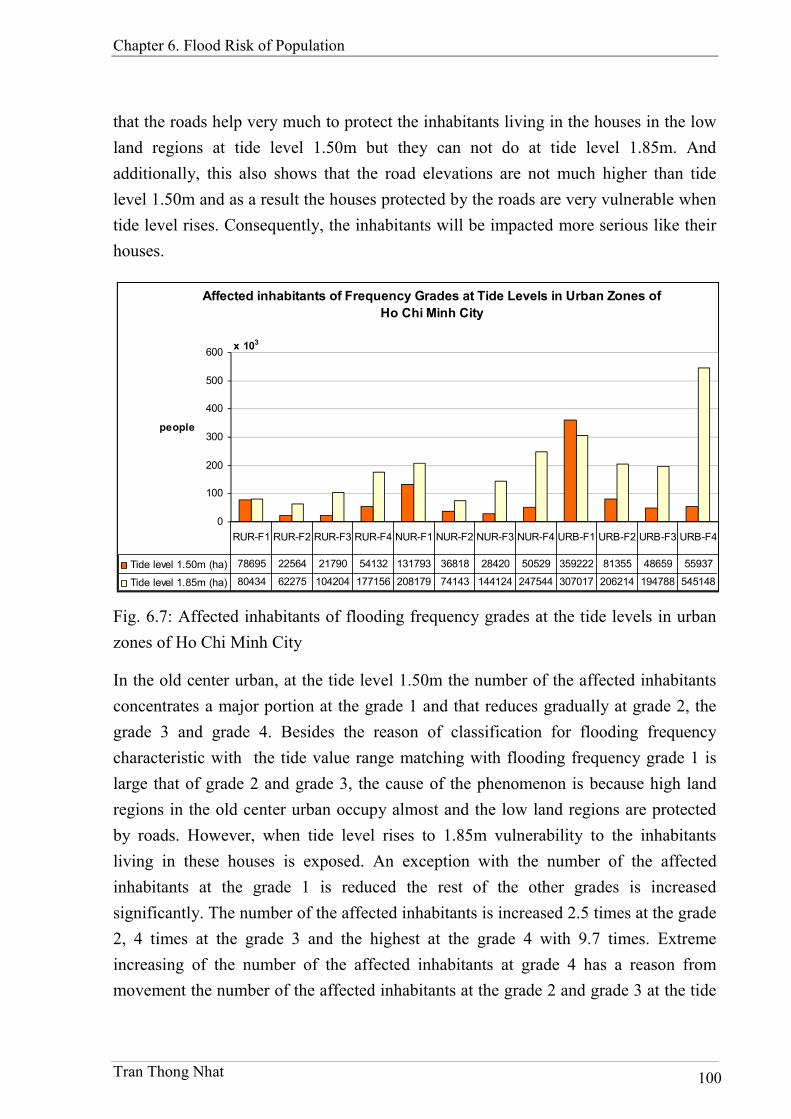
Chapter 6. Flood Risk of Population
Tran Thong Nhat 100
that the roads help very much to protect the inhabitants living in the houses in the low
land regions at tide level 1.50m but they can not do at tide level 1.85m. And
additionally, this also shows that the road elevations are not much higher than tide
level 1.50m and as a result the houses protected by the roads are very vulnerable when
tide level rises. Consequently, the inhabitants will be impacted more serious like their
houses.
Affected inhabitants of Frequency Grades at Tide Levels in Urban Zones of
Ho Chi Minh City
0
100
200
300
400
500
600x 103
people
Tide level 1.50m (ha) 78695 22564 21790 54132 131793 36818 28420 50529 359222 81355 48659 55937
Tide level 1.85m (ha) 80434 62275 104204 177156 208179 74143 144124 247544 307017 206214 194788 545148
RUR-F1 RUR-F2 RUR-F3 RUR-F4 NUR-F1 NUR-F2 NUR-F3 NUR-F4 URB-F1 URB-F2 URB-F3 URB-F4
Fig. 6.7: Affected inhabitants of flooding frequency grades at the tide levels in urban
zones of Ho Chi Minh City
In the old center urban, at the tide level 1.50m the number of the affected inhabitants
concentrates a major portion at the grade 1 and that reduces gradually at grade 2, the
grade 3 and grade 4. Besides the reason of classification for flooding frequency
characteristic with the tide value range matching with flooding frequency grade 1 is
large that of grade 2 and grade 3, the cause of the phenomenon is because high land
regions in the old center urban occupy almost and the low land regions are protected
by roads. However, when tide level rises to 1.85m vulnerability to the inhabitants
living in these houses is exposed. An exception with the number of the affected
inhabitants at the grade 1 is reduced the rest of the other grades is increased
significantly. The number of the affected inhabitants is increased 2.5 times at the grade
2, 4 times at the grade 3 and the highest at the grade 4 with 9.7 times. Extreme
increasing of the number of the affected inhabitants at grade 4 has a reason from
movement the number of the affected inhabitants at the grade 2 and grade 3 at the tide

Chapter 6. Flood Risk of Population
Tran Thong Nhat 101
level 1.50m to that at the grade 4. Additionally, increasing of new flooded houses in
the high land regions is not as much as in the low land regions of Binh Thanh District,
District 4, District 6 and District 8. These regions at tide level 1.50m are controlled by
the roads along canals to protect them for preventing inundation. Consequently, the
inhabitants living in the low land regions will be faced with the inundation similar to
their houses.

Chapter 7. Flood Risk of Land Use
Tran Thong Nhat 102
Chapter 7. Flood Risk of Land Use
1. Introduction
As mention in the chapter 5, assessment of the flood risk is classed to tangible,
intangible, direct and indirect damages (Proverbs & Soetanto, 2004). But with
applying GIS to evaluate impacts and risks caused by flood damage, the study will
focus on the direct tangible losses.
Continuously, the research conducts an assessment of the flood risk for the urban
system in Ho Chi Minh City. An urban system is general definition and it presents for
a lot of factors of an urban area such as: land use, transport, electric network,
houses…. The flood can impact to all of the urban system. In the available researches
these factors of the urban system in Ho Chi Minh City are studied (ADB, 2009a; ADB,
2009b; ADB, 2009c; WB, 2010). However, in this research with limitation of the
human, time and finance resources one of the factors of the urban system in Ho Chi
Minh City that is used for the assessment of flood risk is land use.
The land use is one of important system in each of regions especially in the very large
urban areas like Ho Chi Minh City. The land use types are usually presented
distribution and structure of the economy in the area. Therefore, the flood risk that
influences inhabitant living is land use. This assessment of the flood risk will generate
a forecast data that is helpful for the authority in the preparation for making adaptation
plan in the development in the future of Ho Chi Minh City.
Similarly to houses and population, the assessment of flood risk to land use will also
be performed on the time scenarios in 2030 with the sea level rise in the highest
scenario of climate change in Ho Chi Minh City as mentioned in the section 4.4 of the
chapter 3. In the scenario, the maximum tide level is 1.85m and data of this scenario
will be used to assess the flood risk for houses in the study area. The assessment of
flood risk is conducted at two levels 1.85m and 1.50m. The first level is the maximum
and the second is the most dangerous warning level at the current in Ho Chi Minh City
at Phu An tidal station. Moreover, the second level is interested as the delegation of
the level at the current time.
Chapter 7. Flood Risk of Land Use
Tran Thong Nhat 103
Additionally, risk analysis is the identification of the land use types located in the
areas affected by the flooding with the parameters of flood risk including: flooding
duration, flooding depth and frequency of flooding. The area of the land use types that
are considered to be at flooding risk is the area of the land use types exposed to
flooded areas.
And the final of the assessment process of the flood risk is consideration of identifying
impact grades of flooding characteristics in different regions. The assessment process
is based on the flooding characteristics. Therefore, similarly to houses and population
the research classifies Ho Chi Minh City to three urban zones. The first zone is called
old center urban which includes the old city center and districts. The second zone is
called new urban which includes the new districts that are separated from the old rural
(PMVG, 1997; PMVG, 2003). And the last one is calls rural which the rest of Ho Chi
Minh City is.
2. Method
In indentifying a spatial relationship of the ground objects, GIS is one of the most
convenient environments for operating this task. Almost GIS systems are built sets of
tool and function to support for the implementation for works that connect to the
spatial relationship (DeMers, 2009; ESRI, 2004; Loi et al., 2008; Longley et al., 2005).
Nowadays, these functions are applied to many disciplines relating to the spatial
phenomenon such as monitoring (Gehlot & Hanssen, 2008), spatial statistic (Sarhadi,
Soltani and Modarres, 2012), detecting disaster (Marfai, 2003), hazard and risk
analysis (Chau, Holland, Cassells and Tuohy, 2013; Daniel, Florax and Rietveld, 2009;
Nayak & Zlatanova, 2008; Sinnakaudan & Bakar, 2005; Zhaoli, Hongliang,
Chengguang and Haijuan, 2012), simulation (Merwade, Cook and Coonrod, 2008;
Usery et al., 2010; Vieux, 2005; Werner, 2000)… about environment and resource
management (Baky, Zaman and Khan, 2012; Banzhaf, Kindler, Mueller, Metz, Reyes-
Paecke and Weiland, 2013; Carrasco, Ferreira, Matias and Freire, 2012; Dewan, 2013;
Qi & Altinakar, 2011; Zhou, Mikkelsen, Halsnæs and Arnbjerg-Nielsen, 2012), urban
system (Campagna, 2006; Lai & Mak, 2007; Parker & Asencio, 2009; Showalter &
Lu, 2010; Todini, 1999).
In this case, the research needs to identify the area of land use types which are within
the flooded areas, the first thing needs to catch the flooded areas. Then based on the
Chapter 7. Flood Risk of Land Use
Tran Thong Nhat 104
spatial relationship between the area of land use types and the flooded areas and
applying the spatial analysis function clip on GIS (DeMers, 2009; Loi, Dinh and Nhat,
2008; Longley, Goodchild and Maguire, 2005), the objects that locate inside the
potential retention areas are found.
Method to apply for identification in the land use case is considering the spatial
relationship of the land use layer and the flooding maps, areas of land use types were
flooded and not flooded will be determined. In the case clip function with input feature
class is land use data and clip layer is the flooded areas. As a result, the types of land
use that are not located inside the flooded areas are eliminated. And with the objects
inside of the flooded areas, analysis about their areas, distribution of types of land use
is carried out.
Risk analysis is the identification of the land use types located in the areas affected by
the flooding with the parameters of flood risk including: flooding duration, flooding
depth and frequency of flooding. The land use types that are considered to be at
flooding risk are the regions of land use types exposed to flooded areas. Therefore,
similarly to the houses and population, the land use types will be evaluated grades of
flood risk based on the flood characteristics including flooded area, depth, duration
and frequency. The analysis and assessment of flood risk on land use types are
followed classifying the grades of flood characteristics that are described in the
sections 6.3.2, 6.4.2 and 6.5.2 in the chapter 4.
The land use data in the research is based on the urban structure types (UST) from the
project Megacity City Research Project. Ho Chi Minh - Integrative Urban and
Environmental Planning Adaptation to Climate Change Framework. And the land use
classes are reclassified for suitable assessment in the research. Land use is usually
classified to a lot of types based on the use purposes so that there are too many land
use types in the detail. However, to assess the flood risk to the settlement areas, the
research classifies land use in Ho Chi Minh City to four classes.
The first is industry land use type which is zones for manufactories and factories of the
producing companies or organizations. The second is public land use type which is
zones with the constructions for services including public service and government
structures. The third is resident land use type which is zones for inhabitants living and
Chapter 7. Flood Risk of Land Use
Tran Thong Nhat 105
the last one is open space land use type which is the rest in Ho Chi Minh City. The
matching between UST and classes of land use types is shown in the appendix C.
Tab. 7.1: Land use types in the research
No Land Use Abbreviation
1 Industry IND
2 Public PUB
3 Resident RES
4 Open Space OSP
This classification of land use types to assess of flood risk is different to the available
researches. In the available researches, the land use types are classified by
consideration of land cover types that influence to the hydrological and hydraulic
processes of the surface flow impacting to the flood simulation (ADB, 2009a; ADB,
2009b; ADB, 2009c; WB, 2010). Otherwise, the classification of the land use types
focuses flood risk can cause losses of economic aspects for the development plan in
Ho Chi Minh City in the future so that there is a change in the structure of the
distribution of the economic fields caused by losses of the matching land use types
with the economic fields.
3. Results and discussion
3.1. Affected areas
The result of flooded land use types is shown in the figure 7.1 and figure 7.2 at two
levels 1.50m and 1.85m. Additionally, data in the table 7.2 and figure 7.3 shows
flooded area of the land use types at all tide levels. At all tide levels, the open space
area is flooded the most and the resident is the second, the third is industry and the
least is public. This is because the total areas of these land use types hold on with the
same situation. Total area of open space area is the most, the resident is the second, the
next is industry and the least is public.
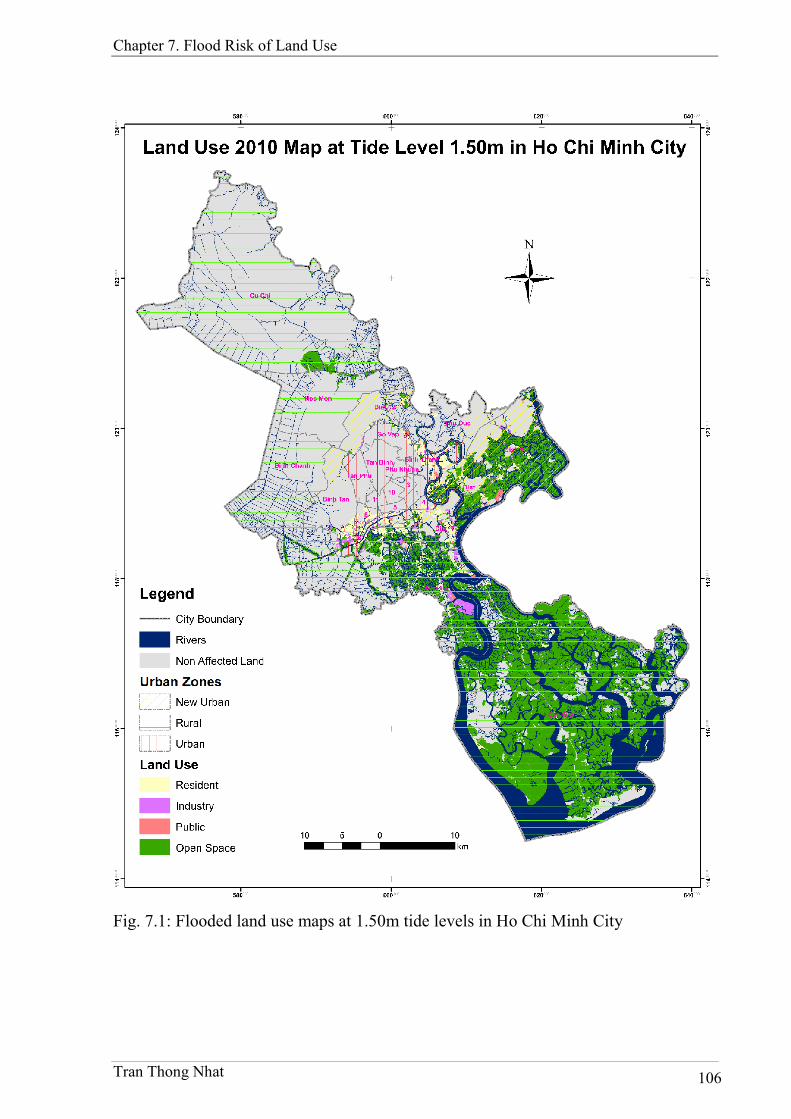
Chapter 7. Flood Risk of Land Use
Tran Thong Nhat 106
Fig. 7.1: Flooded land use maps at 1.50m tide levels in Ho Chi Minh City
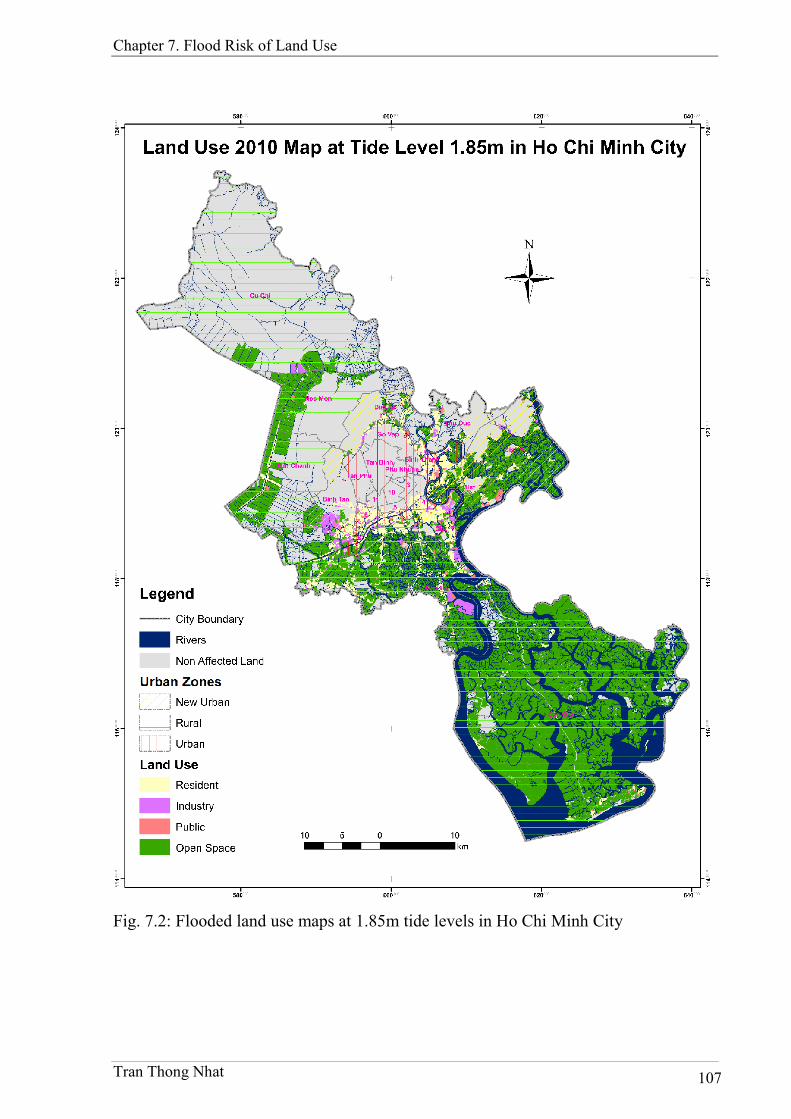
Chapter 7. Flood Risk of Land Use
Tran Thong Nhat 107
Fig. 7.2: Flooded land use maps at 1.85m tide levels in Ho Chi Minh City
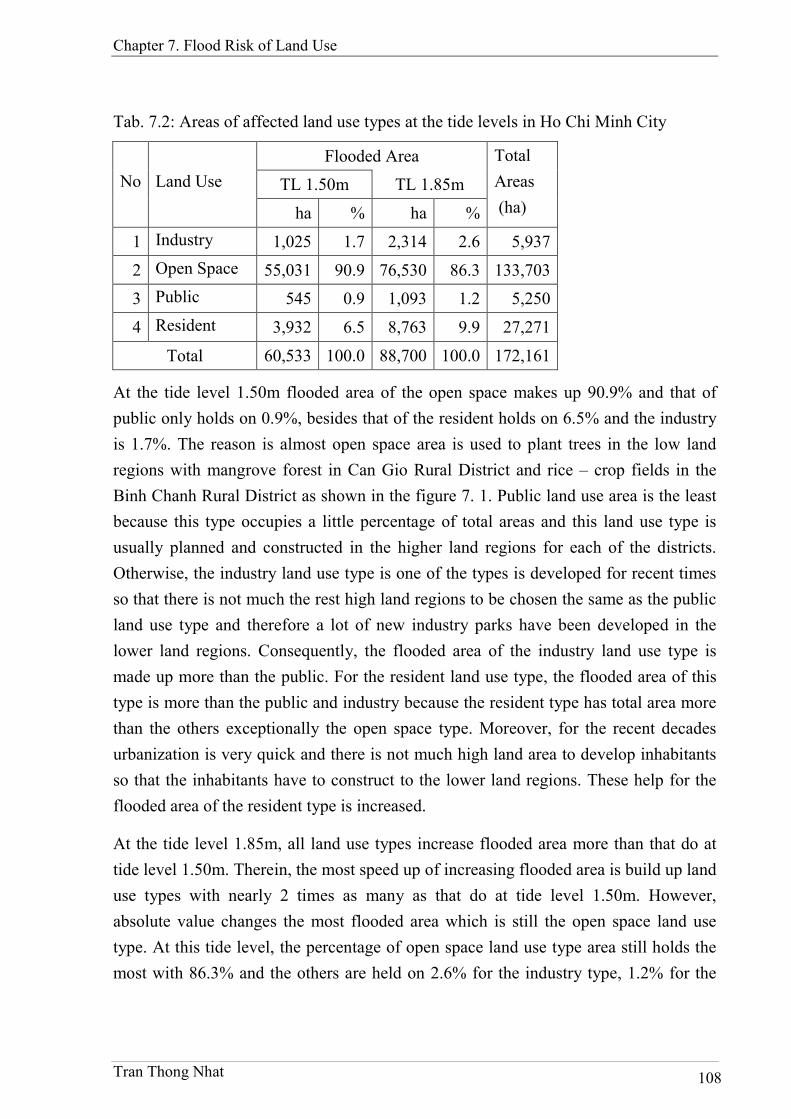
Chapter 7. Flood Risk of Land Use
Tran Thong Nhat 108
Tab. 7.2: Areas of affected land use types at the tide levels in Ho Chi Minh City
Flooded Area
TL 1.50m TL 1.85m No Land Use
ha % ha %
Total
Areas
(ha)
1 Industry 1,025 1.7 2,314 2.6 5,937
2 Open Space 55,031 90.9 76,530 86.3 133,703
3 Public 545 0.9 1,093 1.2 5,250
4 Resident 3,932 6.5 8,763 9.9 27,271
Total 60,533 100.0 88,700 100.0 172,161
At the tide level 1.50m flooded area of the open space makes up 90.9% and that of
public only holds on 0.9%, besides that of the resident holds on 6.5% and the industry
is 1.7%. The reason is almost open space area is used to plant trees in the low land
regions with mangrove forest in Can Gio Rural District and rice – crop fields in the
Binh Chanh Rural District as shown in the figure 7. 1. Public land use area is the least
because this type occupies a little percentage of total areas and this land use type is
usually planned and constructed in the higher land regions for each of the districts.
Otherwise, the industry land use type is one of the types is developed for recent times
so that there is not much the rest high land regions to be chosen the same as the public
land use type and therefore a lot of new industry parks have been developed in the
lower land regions. Consequently, the flooded area of the industry land use type is
made up more than the public. For the resident land use type, the flooded area of this
type is more than the public and industry because the resident type has total area more
than the others exceptionally the open space type. Moreover, for the recent decades
urbanization is very quick and there is not much high land area to develop inhabitants
so that the inhabitants have to construct to the lower land regions. These help for the
flooded area of the resident type is increased.
At the tide level 1.85m, all land use types increase flooded area more than that do at
tide level 1.50m. Therein, the most speed up of increasing flooded area is build up land
use types with nearly 2 times as many as that do at tide level 1.50m. However,
absolute value changes the most flooded area which is still the open space land use
type. At this tide level, the percentage of open space land use type area still holds the
most with 86.3% and the others are held on 2.6% for the industry type, 1.2% for the
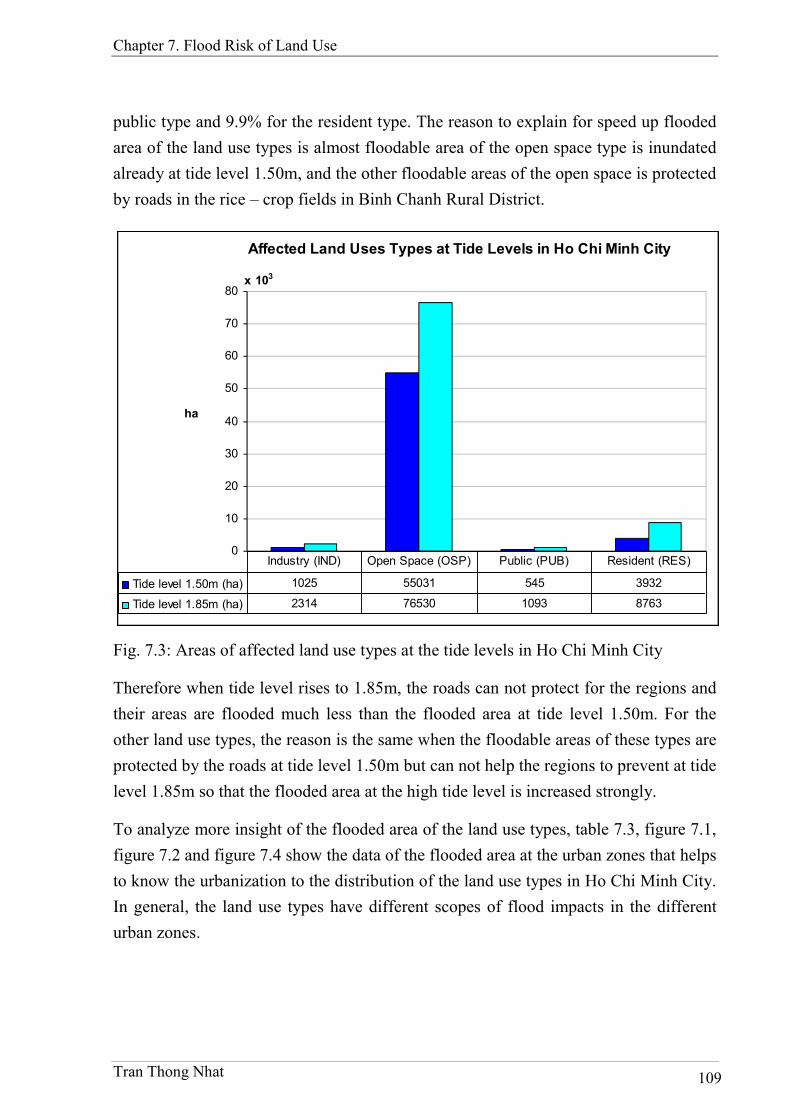
Chapter 7. Flood Risk of Land Use
Tran Thong Nhat 109
public type and 9.9% for the resident type. The reason to explain for speed up flooded
area of the land use types is almost floodable area of the open space type is inundated
already at tide level 1.50m, and the other floodable areas of the open space is protected
by roads in the rice – crop fields in Binh Chanh Rural District.
Affected Land Uses Types at Tide Levels in Ho Chi Minh City
0
10
20
30
40
50
60
70
80x 103
ha
Tide level 1.50m (ha) 1025 55031 545 3932
Tide level 1.85m (ha) 2314 76530 1093 8763
Industry (IND) Open Space (OSP) Public (PUB) Resident (RES)
Fig. 7.3: Areas of affected land use types at the tide levels in Ho Chi Minh City
Therefore when tide level rises to 1.85m, the roads can not protect for the regions and
their areas are flooded much less than the flooded area at tide level 1.50m. For the
other land use types, the reason is the same when the floodable areas of these types are
protected by the roads at tide level 1.50m but can not help the regions to prevent at tide
level 1.85m so that the flooded area at the high tide level is increased strongly.
To analyze more insight of the flooded area of the land use types, table 7.3, figure 7.1,
figure 7.2 and figure 7.4 show the data of the flooded area at the urban zones that helps
to know the urbanization to the distribution of the land use types in Ho Chi Minh City.
In general, the land use types have different scopes of flood impacts in the different
urban zones.
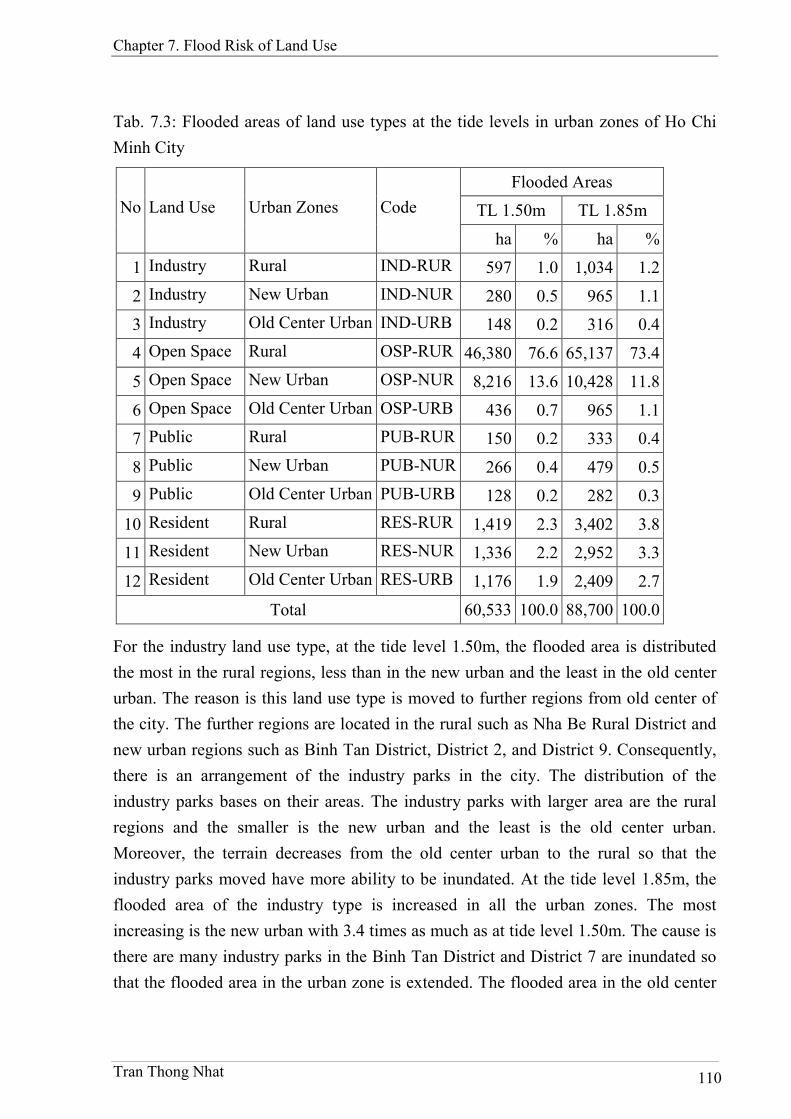
Chapter 7. Flood Risk of Land Use
Tran Thong Nhat 110
Tab. 7.3: Flooded areas of land use types at the tide levels in urban zones of Ho Chi
Minh City
Flooded Areas
TL 1.50m TL 1.85m No Land Use Urban Zones Code
ha % ha %
1 Industry Rural IND-RUR 597 1.0 1,034 1.2
2 Industry New Urban IND-NUR 280 0.5 965 1.1
3 Industry Old Center Urban IND-URB 148 0.2 316 0.4
4 Open Space Rural OSP-RUR 46,380 76.6 65,137 73.4
5 Open Space New Urban OSP-NUR 8,216 13.6 10,428 11.8
6 Open Space Old Center Urban OSP-URB 436 0.7 965 1.1
7 Public Rural PUB-RUR 150 0.2 333 0.4
8 Public New Urban PUB-NUR 266 0.4 479 0.5
9 Public Old Center Urban PUB-URB 128 0.2 282 0.3
10 Resident Rural RES-RUR 1,419 2.3 3,402 3.8
11 Resident New Urban RES-NUR 1,336 2.2 2,952 3.3
12 Resident Old Center Urban RES-URB 1,176 1.9 2,409 2.7
Total 60,533 100.0 88,700 100.0
For the industry land use type, at the tide level 1.50m, the flooded area is distributed
the most in the rural regions, less than in the new urban and the least in the old center
urban. The reason is this land use type is moved to further regions from old center of
the city. The further regions are located in the rural such as Nha Be Rural District and
new urban regions such as Binh Tan District, District 2, and District 9. Consequently,
there is an arrangement of the industry parks in the city. The distribution of the
industry parks bases on their areas. The industry parks with larger area are the rural
regions and the smaller is the new urban and the least is the old center urban.
Moreover, the terrain decreases from the old center urban to the rural so that the
industry parks moved have more ability to be inundated. At the tide level 1.85m, the
flooded area of the industry type is increased in all the urban zones. The most
increasing is the new urban with 3.4 times as much as at tide level 1.50m. The cause is
there are many industry parks in the Binh Tan District and District 7 are inundated so
that the flooded area in the urban zone is extended. The flooded area in the old center

Chapter 7. Flood Risk of Land Use
Tran Thong Nhat 111
urban is increased for the second with 2.1 times. Industry areas in the old center urban
are extended because there are a lot of regions of low land in District 4, District 6,
District 8 and Binh Thanh District are impacted by flood. These regions have low
elevation but they are protected by roads so that at the tide level 1.50m they are not
inundated. In the rural the low speed up of the flooded industry area but the absolute
value is still very high. This is because at the tide level 1.50m there are a lot of the
flooded area of the industry land use type in Nha Be Rural District is inundated
already and when tide level rises there is a small flooded industry area in the Cu Chi
Rural District is impacted.
Affected Land Uses at Tide Levels in Urban Classes of Ho Chi Minh City
0
10
20
30
40
50
60
70x 103
ha
Tide level 1.50m (ha) 597 280 148 46380 8216 436 150 266 128 1419 1336 1176
Tide level 1.85m (ha) 1034 965 316 65137 10428 965 333 479 282 3402 2952 2409
IND-
RUR
IND-
NUR
IND-
URB
OSP-
RUR
OSP-
NUR
OSP-
URB
PUB-
RUR
PUB-
NUR
PUB-
URB
RES-
RUR
RES-
NUR
RES-
URB
Fig. 7.4: Flooded areas of land use types at the tide levels in urban zones Ho Chi Minh
City
For the open space land use type, there is not unusual for distribution in the urban
zones. At two tide levels, the flooded area is still distributed the most in the rural
regions, less than in the new urban and the least in the old center urban. This is a
understandable thing because urbanization processing the old center urban regions
have very little open space area and then the new urban is developed therefore area of
the open space type in the new urban is more than that in the old center urban and the
most area of the open space type is distributed in the rural regions. Besides, the terrain
changes lowly from the old center urban to the rural so that the flooded area of the
open space type increases from the old center urban to the rural.

Chapter 7. Flood Risk of Land Use
Tran Thong Nhat 112
For the public land use type, at the tide level 1.50m the most flooded area is the new
urban and the less is the rural and the least is the old center urban. A question is given
here. Why is there a lot of the public land use type in the old center urban but the
flooded area of the public type in the new urban is the most? The reason is the old
center urban has terrain is higher than the new urban and the low land regions are
protected by roads. In the rural, this land use type is not much and concentrated in the
town where have roads to protect low land regions so that the public type in the rural is
inundated less than the new urban. In the new urban there is a problem with some area
of the public type is constructed close the rivers but there is no really structures to
protect such as harbors in the District 2 and District 7. At the tide level 1.85m, the
flooded area of the public type is increased all the urban zones with 2 times as much as
that is tide level 1.50m. The flooded area holds on the most in the new urban because
all the districts in this urban zone are impacted by flood at the tide level 1.85m. In the
rural there are public regions in Binh Chanh Rural District, Hoc Mon Rural District
and Can Gio Rural District are flooded additionally. In the old center urban, there are
low land regions in District 4, District 6, District 8 and Binh Thanh District are
inundated. The new flooded areas in all the urban zones are inundated at the tide level
1.85m but they are not impacted at tide level 1.50m because they are protected by the
roads but the road elevations are not high enough at tide level 1.85m so that these
regions can not prevent an inundation.
For the resident land use type, at the tide level 1.50m the flooded area of all urban
zones is inundated similarly. The reason is the residential regions in all the urban
zones are normal protected by roads, there are only some regions where have not good
infrastructures are inundated. However, at the tide level 1.85m the flooded area of the
resident type is extended in all the urban zones but the most is the rural and the least is
the old center urban. The cause is the rural contains very much low land and when tide
level rises the roads can not support for preventing inundation so that there are a lot of
large regions Binh Chanh Rural District and Nha Be Rural District are flooded. The
increasing flooded area in the new urban and the old center urban is similar but why in
these urban zones the new flooded area is less than the rural? Because the new flooded
area in these urban zones is less than the rural. Therefore distribution of the flooded
area is reduced from the rural to the old center urban as shown in the figure 7.4.

Chapter 7. Flood Risk of Land Use
Tran Thong Nhat 113
Affected Built Up at Tide Levels in Urban Zones of Ho Chi Minh City
0
1000
2000
3000
4000
ha
Tide level 1.50m (ha) 597 280 148 150 266 128 1419 1336 1176
Tide level 1.85m (ha) 1034 965 316 333 479 282 3402 2952 2409
IND-RUR IND-NUR IND-URB PUB-RUR PUB-NUR PUB-URB RES-RUR RES-NUR RES-URB
Fig. 7.5: Flooded areas of built up types at the tide levels in urban zones of Ho Chi
Minh City
If consideration of the flood impacts to only the build up land use types as shown in
the figure 7.5 the flooded area of the resident type holds on the most and the extension
of flooded area when tide level rises is the highest. The least flooded area is the public
type. This is because the total area of the resident type is the most, the less is the
resident is the industry type and the least is public.
As above analysis, the flooded area of the open space land use type always holds on
more 90% of the total flooded area therefore when the flooded area of this type is
shown with each others in the same chart so that the values of the others are not very
visible and analyzed. Moreover, the build up land use types are very important for the
analysis because they relate to the damage of inhabitants and their properties.
Consequently, in the next sections of analysis for the flooding characteristics, charts
will be displayed with the build up land use types. But in the tables the open space
land use type is still kept and analyze.
3.2. Depth grades
The result of the flooded area for all land use types at the grades of the flooding depth
is shown in table 7.4 and chart in the figure 7.6. In the general, at the tide level 1.50m
area of all the build up land use types is flooded at the highest grade that is grade 3 and
the open space land use type is flooded deeper with the highest grade is grade 4. But
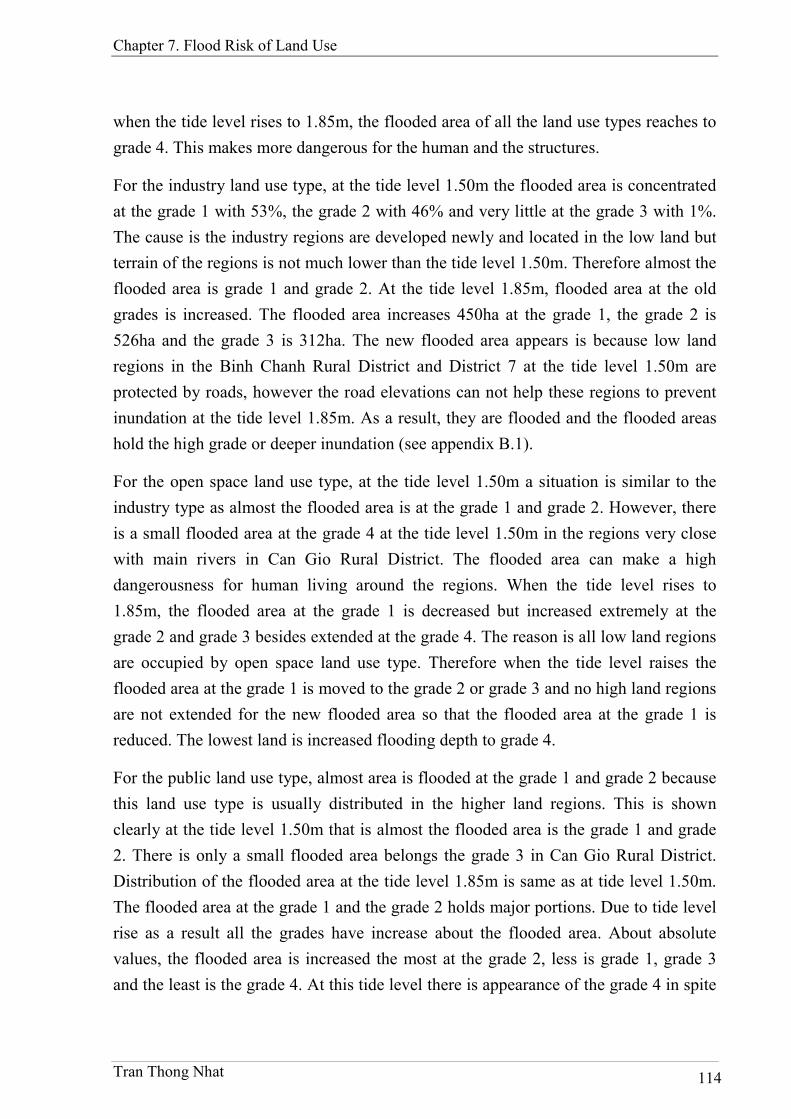
Chapter 7. Flood Risk of Land Use
Tran Thong Nhat 114
when the tide level rises to 1.85m, the flooded area of all the land use types reaches to
grade 4. This makes more dangerous for the human and the structures.
For the industry land use type, at the tide level 1.50m the flooded area is concentrated
at the grade 1 with 53%, the grade 2 with 46% and very little at the grade 3 with 1%.
The cause is the industry regions are developed newly and located in the low land but
terrain of the regions is not much lower than the tide level 1.50m. Therefore almost the
flooded area is grade 1 and grade 2. At the tide level 1.85m, flooded area at the old
grades is increased. The flooded area increases 450ha at the grade 1, the grade 2 is
526ha and the grade 3 is 312ha. The new flooded area appears is because low land
regions in the Binh Chanh Rural District and District 7 at the tide level 1.50m are
protected by roads, however the road elevations can not help these regions to prevent
inundation at the tide level 1.85m. As a result, they are flooded and the flooded areas
hold the high grade or deeper inundation (see appendix B.1).
For the open space land use type, at the tide level 1.50m a situation is similar to the
industry type as almost the flooded area is at the grade 1 and grade 2. However, there
is a small flooded area at the grade 4 at the tide level 1.50m in the regions very close
with main rivers in Can Gio Rural District. The flooded area can make a high
dangerousness for human living around the regions. When the tide level rises to
1.85m, the flooded area at the grade 1 is decreased but increased extremely at the
grade 2 and grade 3 besides extended at the grade 4. The reason is all low land regions
are occupied by open space land use type. Therefore when the tide level raises the
flooded area at the grade 1 is moved to the grade 2 or grade 3 and no high land regions
are not extended for the new flooded area so that the flooded area at the grade 1 is
reduced. The lowest land is increased flooding depth to grade 4.
For the public land use type, almost area is flooded at the grade 1 and grade 2 because
this land use type is usually distributed in the higher land regions. This is shown
clearly at the tide level 1.50m that is almost the flooded area is the grade 1 and grade
2. There is only a small flooded area belongs the grade 3 in Can Gio Rural District.
Distribution of the flooded area at the tide level 1.85m is same as at tide level 1.50m.
The flooded area at the grade 1 and the grade 2 holds major portions. Due to tide level
rise as a result all the grades have increase about the flooded area. About absolute
values, the flooded area is increased the most at the grade 2, less is grade 1, grade 3
and the least is the grade 4. At this tide level there is appearance of the grade 4 in spite
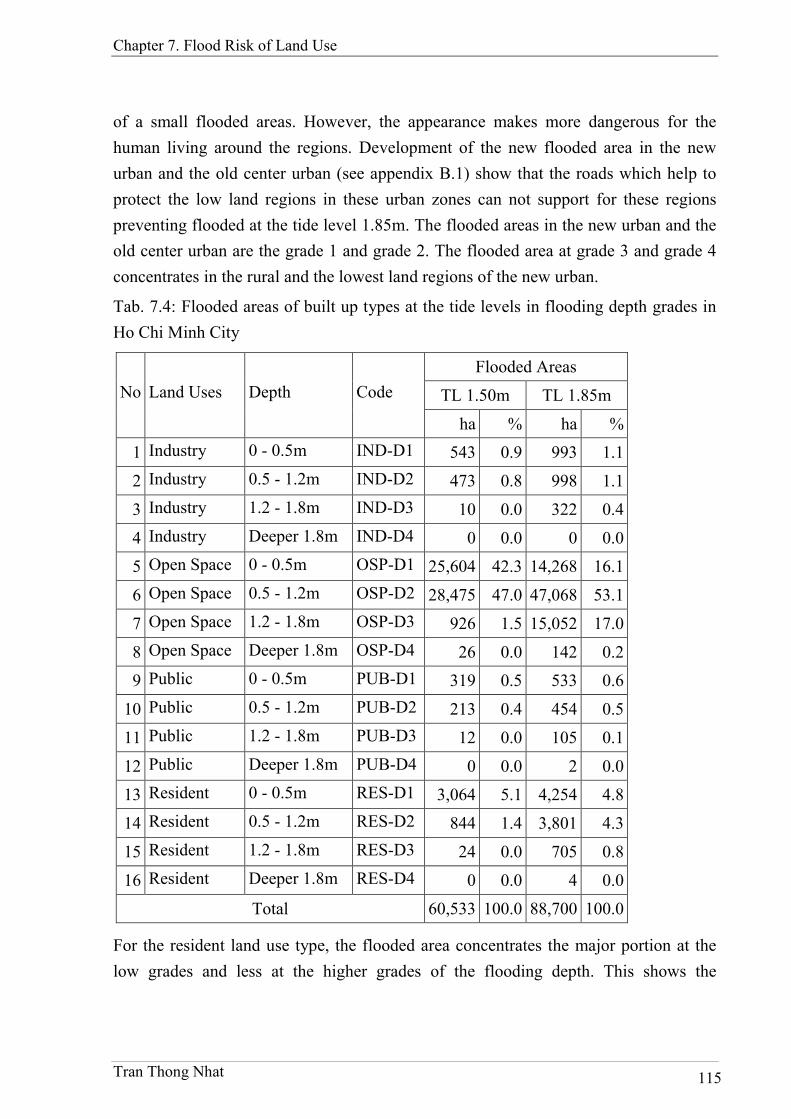
Chapter 7. Flood Risk of Land Use
Tran Thong Nhat 115
of a small flooded areas. However, the appearance makes more dangerous for the
human living around the regions. Development of the new flooded area in the new
urban and the old center urban (see appendix B.1) show that the roads which help to
protect the low land regions in these urban zones can not support for these regions
preventing flooded at the tide level 1.85m. The flooded areas in the new urban and the
old center urban are the grade 1 and grade 2. The flooded area at grade 3 and grade 4
concentrates in the rural and the lowest land regions of the new urban.
Tab. 7.4: Flooded areas of built up types at the tide levels in flooding depth grades in
Ho Chi Minh City
Flooded Areas
TL 1.50m TL 1.85m No Land Uses Depth Code
ha % ha %
1 Industry 0 - 0.5m IND-D1 543 0.9 993 1.1
2 Industry 0.5 - 1.2m IND-D2 473 0.8 998 1.1
3 Industry 1.2 - 1.8m IND-D3 10 0.0 322 0.4
4 Industry Deeper 1.8m IND-D4 0 0.0 0 0.0
5 Open Space 0 - 0.5m OSP-D1 25,604 42.3 14,268 16.1
6 Open Space 0.5 - 1.2m OSP-D2 28,475 47.0 47,068 53.1
7 Open Space 1.2 - 1.8m OSP-D3 926 1.5 15,052 17.0
8 Open Space Deeper 1.8m OSP-D4 26 0.0 142 0.2
9 Public 0 - 0.5m PUB-D1 319 0.5 533 0.6
10 Public 0.5 - 1.2m PUB-D2 213 0.4 454 0.5
11 Public 1.2 - 1.8m PUB-D3 12 0.0 105 0.1
12 Public Deeper 1.8m PUB-D4 0 0.0 2 0.0
13 Resident 0 - 0.5m RES-D1 3,064 5.1 4,254 4.8
14 Resident 0.5 - 1.2m RES-D2 844 1.4 3,801 4.3
15 Resident 1.2 - 1.8m RES-D3 24 0.0 705 0.8
16 Resident Deeper 1.8m RES-D4 0 0.0 4 0.0
Total 60,533 100.0 88,700 100.0
For the resident land use type, the flooded area concentrates the major portion at the
low grades and less at the higher grades of the flooding depth. This shows the
Chapter 7. Flood Risk of Land Use
Tran Thong Nhat 116
urbanization is inhabitants move and live in the high land regions firstly and then in
the lower land regions and further city center. Besides the resident regions in the low
land are protected by the roads so that they can not be flooded deep. At the tide level
1.50m, there is 78% the flooded area at the grade 1 and 21% the flooded area at the
grade 2 and a small rest of the flooded area at the grade 3. Distribution of the flooded
area at the grade 1 in the all urban zones is similar. At the grade 2 the flooded area in
the rural is major because in the rural there are low lands are developed to resident but
they have no high roads for protecting inundation (see appendix B.1).
Affected Built Up Land Use at Tide Levels in Flooding Depth
Grades in Ho Chi Minh City
0
1000
2000
3000
4000
5000
ha
Tide level 1.50m (ha) 542.6 472.7 10.0 0.0 318.8 213.4 12.4 0.0 3063.8 843.7 24.0 0.0
Tidel level 1.85m (ha) 992.7 998.4 322.1 0.5 532.6 453.9 104.7 2.1 4253.73801.1 704.7 3.8
IND-
D1
IND-
D2
IND-
D3
IND-
D4
PUB-
D1
PUB-
D2
PUB-
D3
PUB-
D4
RES-
D1
RES-
D2
RES-
D3
RES-
D4
Fig. 7.6: Flooded areas of built up types at the tide levels in flooding depth grades in
Ho Chi Minh City
When the tide level raises to 1.85m all the grades of flooding depth are increased
flooded area. The flooded area holds on the most is the grade 1 but increasing flooded
area is the grade 2. This gives information that is the roads can not protect for the low
lands when tide level reaches to 1.85m. Extension of the flooded area occurs at the
grade 1 the most popularly in the District 4, District 6, District 8 and Binh Thanh
District in the old center urban. The old center urban contributes almost the flooded
area at the grade 1 because this urban zone is capturing the higher land than the others
so that the flooded area is less serious. At the grade 2, the flooded area in the rural is
increased the most and less is the new urban because movement of the flooded area
from grade 1 at the tide level 1.50m to grade 2 when tide level rises. At the grade 3,
the flooded area is increased almost in the rural and the new urban and in the old
Chapter 7. Flood Risk of Land Use
Tran Thong Nhat 117
center urban is very little because the old center urban is usually the higher land. There
is a small flooded area at the grade 4. This makes a warning to the inhabitants living
there for precautions of the dangerousness.
3.3. Duration grades
The result of the flooded area for all land use types at the grades of the flooding
duration is shown in table 7.5 and chart in the figure 7.7. In the general, all the land
use types are flooded at all the flooding duration grades at two tide levels.
Additionally, the information in the table shows a trend of the flooded area that is
increasing gradually flooded area from the low grade to high grade. That means the
higher grade is the more flooded area does. This show there is a lot of the regions are
impacted by flood for a long duration. The reason is tide characteristic as tide value
range for the grade 1 is very short with difference between high boundary and low
boundary values 1cm (see appendix A.1). And otherwise, the tide value range for the
grade 5 is very large. As a result, probability of the land is flooded at the grade 1 is
lower and at the grade 5 is higher. The other reason is almost the regions in Ho Chi
Minh City are low land and area of the low land increases gradually matching with
decreasing terrain elevation. Consequently, the higher grade is the more flooded area
does. Another general conclusion is flooded area of each of the land use types is
increased when tide level rises from 1.50m to 1.85m.
For the industry land use type, at the tide level 1.50m the flooded area is concentrated
at the grade 5 with 58% and the least is the grade 3 with 1%. The flooded area of the
other grades is similar with 13%. The first reason is tide characteristic that is tide
value range for the grade 1 is very short with difference between high boundary and
low boundary values 1cm (see appendix A.1). And otherwise, the tide value range for
the grade 5 is very large. The second reason is the industry regions are developed
newly and located in the low land of the rural and new urban regions and terrain of the
regions is lower than 1.30m. Therefore there is difference of flooded area between
grade 1 and grade 5. At the tide level 1.85m, flooded area at all grades is increased.
The increasing flooded area at the grade 4 is the most and the least is grade 5. The
reason is the new flooded area in low land regions in the Binh Chanh Rural District
and District 7 at the tide level 1.50m are protected by roads, however the road
elevations can not help these regions to prevent inundation at the tide level 1.85m. As

Chapter 7. Flood Risk of Land Use
Tran Thong Nhat 118
a result, they are flooded and the flooded areas hold the high grade or deeper
inundation (see appendix B.2, figure 7.1 and figure 7.2).
Tab. 7.5: Flooded areas of built up types at the tide levels in flooding duration grades
in Ho Chi Minh City
Flooded Areas
TL 1.50m TL 1.85m No Land Uses Duration Code
ha % ha %
1 Industry Less 1 hour IND-T1 13 0.0 34 0.0
2 Industry 1 - 2 hours IND-T2 120 0.2 150 0.2
3 Industry 2 - 3 hours IND-T3 145 0.2 272 0.3
4 Industry 3 - 4 hours IND-T4 151 0.2 716 0.8
5 Industry More 4 hours IND-T5 597 1.0 1,141 1.3
6 Open Space Less 1 hour OSP-T1 406 0.7 171 0.2
7 Open Space 1 - 2 hours OSP-T2 2,561 4.2 4,834 5.4
8 Open Space 2 - 3 hours OSP-T3 4,458 7.4 4,204 4.7
9 Open Space 3 - 4 hours OSP-T4 7,627 12.6 7,927 8.9
10 Open Space More 4 hours OSP-T5 39,980 66.0 59,394 67.0
11 Public Less 1 hour PUB-T1 15 0.0 26 0.0
12 Public 1 - 2 hours PUB-T2 78 0.1 93 0.1
13 Public 2 - 3 hours PUB-T3 93 0.2 155 0.2
14 Public 3 - 4 hours PUB-T4 87 0.1 181 0.2
15 Public More 4 hours PUB-T5 271 0.4 639 0.7
16 Resident Less 1 hour RES-T1 134 0.2 112 0.1
17 Resident 1 - 2 hours RES-T2 734 1.2 932 1.1
18 Resident 2 - 3 hours RES-T3 814 1.3 1,202 1.4
19 Resident 3 - 4 hours RES-T4 880 1.5 1,761 2.0
20 Resident More 4 hours RES-T5 1,369 2.3 4,756 5.4
Total 60,533 100.0 88,700 100.0
In a general trend, for the open space land use type, the flooded area still concentrates
the most in the highest grade of the flooding duration. At the tide level 1.50m almost
the flooded area is at the grade 4 with 14% and grade 5 with 73%. The other grades
Chapter 7. Flood Risk of Land Use
Tran Thong Nhat 119
hold on less than the flooded area at the grade 4 and grade 5. The least is grade 1 with
1%. The reason is open space land use type is distributed in the lowest regions of Ho
Chi Minh City. When the tide level rises to 1.85m, the flooded area at the grade 5 is
still increased and reached to 78%. The other grades are changed with the different
amount. The flooded area at the grade 1 is decreased because there is not much high
land to be inundated. As shown in the appendix A.1, the flooded area at all grades at
tide level 1.50m are moved to the grade 5 at tide level 1.85m so that the number of the
flooded area at the grade 5 holds on more than the others. Besides the new flooded
areas are low lands in rice – crop fields of Binh Chanh Rural District and the areas are
protected by roads as tide level 1.50m but the road elevations are not much higher than
1.50m so that at tide level 1.85m the areas are inundated at the high grades of the
flooding duration (see appendix B.2, figure 7.1 and figure 7.2).
For the public land use type, there is always a priority of this land use type when
planners make land use planning. This type is disposed in the higher lands of districts.
As a result, the flooded area is less than the other land use types. For the flooding
duration, the flooded area at the different grades has more variations than the other
land use types. This show at the tide level 1.50m, the flooded area at the grade 5 still
makes up 50% but the flooded area at the lower grades holds on a large percentage.
The reasons are similar with the other land use types. The urban zone where the
flooded area occupies the most is the new urban in District 2 because there are some
new harbors constructed and developed here. And in these regions almost area is low
terrain so that the flooded area is inundated long duration. The distribution of the
flooded area at the tide level 1.85m is the same as tide level 1.50m. The most flooded
area is grade 5 and the least is grade 1. When the tide level raises to 1.85m all the
grades of flooding duration are increased flooded area. The absolute values of change
the flooded area is increased the most at the grade 5 and then the flooded area is
reduced gradually matching with the lower grades. In the all urban zones the flooded
area of the public type is extended. In the rural the flooded area is extended in Binh
Chanh Rural District, Can Gio Rural District, Nha Be Rural District and Hoc Mon
Rural District. In the new urban the flooded area is increased in Thu Duc District, Binh
Tan District, District 7 and District 12. In the other urban zone, the flooded area is
added in District 4, District 6, and District 8 (see appendix B.2, figure 7.1 and figure
7.2). These new flooded areas show that the road elevations can not protected for the
low lands in all the urban zones at the tide level 1.85m.
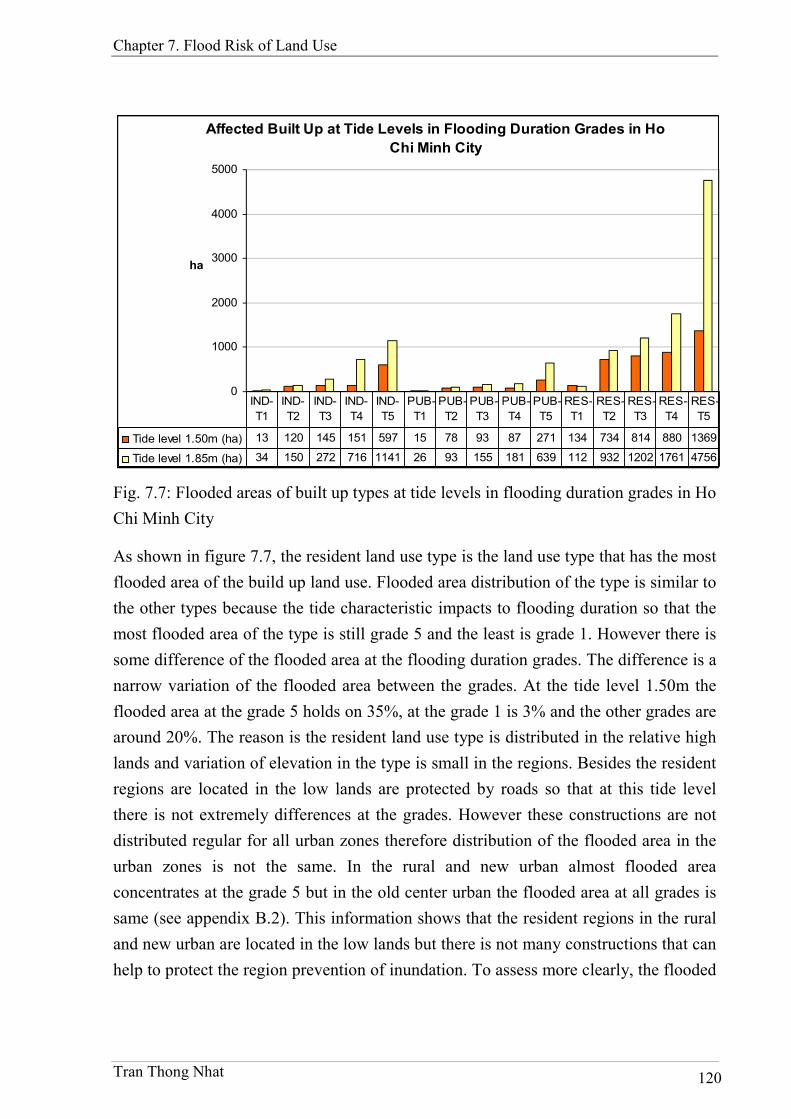
Chapter 7. Flood Risk of Land Use
Tran Thong Nhat 120
Affected Built Up at Tide Levels in Flooding Duration Grades in Ho
Chi Minh City
0
1000
2000
3000
4000
5000
ha
Tide level 1.50m (ha) 13 120 145 151 597 15 78 93 87 271 134 734 814 880 1369
Tide level 1.85m (ha) 34 150 272 716 1141 26 93 155 181 639 112 932 1202 1761 4756
IND-
T1
IND-
T2
IND-
T3
IND-
T4
IND-
T5
PUB-
T1
PUB-
T2
PUB-
T3
PUB-
T4
PUB-
T5
RES-
T1
RES-
T2
RES-
T3
RES-
T4
RES-
T5
Fig. 7.7: Flooded areas of built up types at tide levels in flooding duration grades in Ho
Chi Minh City
As shown in figure 7.7, the resident land use type is the land use type that has the most
flooded area of the build up land use. Flooded area distribution of the type is similar to
the other types because the tide characteristic impacts to flooding duration so that the
most flooded area of the type is still grade 5 and the least is grade 1. However there is
some difference of the flooded area at the flooding duration grades. The difference is a
narrow variation of the flooded area between the grades. At the tide level 1.50m the
flooded area at the grade 5 holds on 35%, at the grade 1 is 3% and the other grades are
around 20%. The reason is the resident land use type is distributed in the relative high
lands and variation of elevation in the type is small in the regions. Besides the resident
regions are located in the low lands are protected by roads so that at this tide level
there is not extremely differences at the grades. However these constructions are not
distributed regular for all urban zones therefore distribution of the flooded area in the
urban zones is not the same. In the rural and new urban almost flooded area
concentrates at the grade 5 but in the old center urban the flooded area at all grades is
same (see appendix B.2). This information shows that the resident regions in the rural
and new urban are located in the low lands but there is not many constructions that can
help to protect the region prevention of inundation. To assess more clearly, the flooded
Chapter 7. Flood Risk of Land Use
Tran Thong Nhat 121
area data at the tide level 1.85m can answer. When tide level rises to 1.85m, almost
flooded area at the grades is increase exceptional that does grade 1. Moreover, the
higher grade is the more flooded area increased. The most increasing of the flooded
area is grade 5 with 3.5 times as many as that does at tide level 1.50m. The explanation
for this phenomenon is there are not much more the high land resident regions in all
the urban zones to flood when tide level rises. Only the low lands which are protected
by the roads but the roads can not help to prevent the regions inundation at the high
tide so that the low lands are flooded for long duration. In the rural the low lands are
extended for inundation is Binh Chanh Rural District and Nha Be Rural District. In
the new urban that is Binh Tan District, Thu Duc District, District 2, District 7 and
District 12. And in the old center urban that are District 4, District 6, District 8 and
Binh Thanh District. One general reason is the flooded areas at all grades at tide level
1.50m are moved to the grade 5 at tide level 1.85m so that the number of the flooded
area at the grade 5 increases more than the others (see appendix B.2, figure 7.1 and
figure 7.2).
3.4. Frequency grades
The result of the flooded area for all land use types at the grades of the flooding
frequency is shown in table 7.6 and chart in the figure 7.8. In the general, all the land
use types are flooded at all the flooding frequency grades at two tide levels.
Additionally, the information in the table shows a rule of the flooded area that the
flooded area at two tide levels has the grade 1 and grade 4 more than that does the
grade 2 and grade 3. The reason is tide characteristic as tide value range for the grade 2
and grade 3 is shorter than that does for grade 1 and grade 4 (see appendix A.2). As a
result, probability of the land is flooded at the grade 2 and grade 3 is lower than that
does at the grade 1 and grade 4. Moreover, the largest value range is the grade 4 so that
the flooded area at the grade 4 is the most, less is grade 1, much less is grade 2 and the
least is grade 3 for all the land use types. Another general conclusion is flooded area of
each of the land use types is increased when tide level rises from 1.50m to 1.85m.
For the industry land use type, at the tide level 1.50m the flooded area is concentrated
at the grade 4 with 55%, the flooded area holds on at the grade 1 with 27%, the least is
the grade 3 with 8% and the rest is grade 2 with 10%. The first reason is tide
characteristic that is tide value range for the grade 4 and grade 1 is larger than the
others. The second reason is the industry regions are developed newly and located in
Chapter 7. Flood Risk of Land Use
Tran Thong Nhat 122
the low land of the rural and new urban regions so that the flooded area of this type
makes up a lot of area impacted at the grade 4. Therefore there is difference of flooded
area between grade 1 and grade 4 (see appendix B.3, figure 7.2 and figure 7.3). At the
tide level 1.85m, flooded area at all grades is increased. The increasing flooded area at
the grade 2 is the most and a few less is grade 4. The reason is the new flooded area of
the industry type in the rural such as in the Binh Chanh Rural District and Cu Chi
Rural District, and the new urban such as District 7, Thu Duc District and Binh Tan
District at the tide level 1.50m are protected by roads, however the road elevations can
not help these regions to prevent inundation at the tide level 1.85m. However, the
roads help for the flooding frequency in the regions reduces fairly (see appendix B.3,
figure 7.1 and figure 7.2).
In a general trend, for the open space land use type, the flooded area still concentrates
the most in the highest grade of the flooding frequency. At the tide level 1.50m the
most flooded area is at the grade 4 holds on 69%. The second is grade 1 holds on 13%
but the flooded area at the grade 1 is not much more than that does grade 2 and grade
3. Besides the general reason is the tide characteristic, another reason is open space
land use type is distributed in the lowest regions of Ho Chi Minh City so that the
flooded area at the grade 4 is occupied much more the others. When the tide level rises
to 1.85m, the flooded area at the grade 4 is still increased and reached to 72%. The
other grades are changed with the different amount. The flooded area at the grade 1
and grade 2 is decreased because there is not much high land to be inundated. As
shown in the appendix A.2, the flooded area at all grades at tide level 1.50m are
moved to the grade 4 at tide level 1.85m so that the number of the flooded area at the
grade 4 holds on more than the others. Besides the new flooded areas are low lands in
rice – crop fields of Binh Chanh Rural District, Nha Be Rural District and forest in
Can Gio Rural District and these areas are protected by roads as tide level 1.50m but
the road elevations are not much higher than 1.50m so that at tide level 1.85m the
areas are inundated at the high grades of the flooding frequency (see appendix B.3,
figure 7.1 and figure 7.2).
For the public land use type, there is always a priority of this land use type when
planners make land use planning. This type is disposed in the higher lands of districts.
As a result, the flooded area is less than the other land use types. For the flooding
frequency, the flooded area distribution at the grades has similar to the other build up
Chapter 7. Flood Risk of Land Use
Tran Thong Nhat 123
types with the most flooded area is grade 4, the second is grade 1 and much less is
grade 2 and grade 3. This show at the tide level 1.50m, the most flooded area at the
grade 4 still makes up 48%, the second is grade 1 with 34%, and the third is grade 2
with 12% and the least is grade 3 with 6% as much as total flooded area at the tide
level 1.50m. The reasons are similar with the other land use types. The most flooded
area at the grade 4 is distributed in the new urban in District 2 and Nha Be Rural
District because there are some new harbors constructed and developed here. And in
these regions almost area is low terrain so that the flooded area is inundated much
more appearances. The major portion of the flooded area at the grade 1 is the old
center urban in Binh Thanh District and Go Vap District and one of portion in the new
urban in District 7. These regions are low lands but they are protected by roads so that
the appearance of the inundation is reduced. As a result these regions almost area is
flooded at the grade 1. The flooded area distribution of the public land use type at tide
level 1.85m is similar to tide level 1.50m. The most flooded area is still grade 4 and
grade 1. However, there is increasing of flooded area at grade 2 and grade 3. About
absolute value of the flooded area, when the tide level raises to 1.85m all the grades of
flooding frequency are increased area. The absolute values of change the flooded area
is increased the most at the grade 4 with 285ha and grade 3 with 113ha. However, the
speed up the new flooded area is grade 3 with 4.2 times as much as at tide level 1.50m.
The reason is at the tide level 1.50m the flooded area at the grade 3 is less than the
grade 4 so that the speed up the new flooded area at the grade 3 more than the grade 4.
In the all urban zones the flooded area of the public type is extended. In the rural the
flooded area is extended in Binh Chanh Rural District, Can Gio Rural District, Nha Be
Rural District and Hoc Mon Rural District. In the new urban the flooded area is
increased in Thu Duc District, Binh Tan District, District 7 and District 12. In the other
urban zone, the flooded area is added in District 4, District 6, and District 8 (see
appendix B.3, figure 7.1 and figure 7.2). These new flooded areas show that the road
elevations can not protected for the low lands in all the urban zones at the tide level
1.85m.
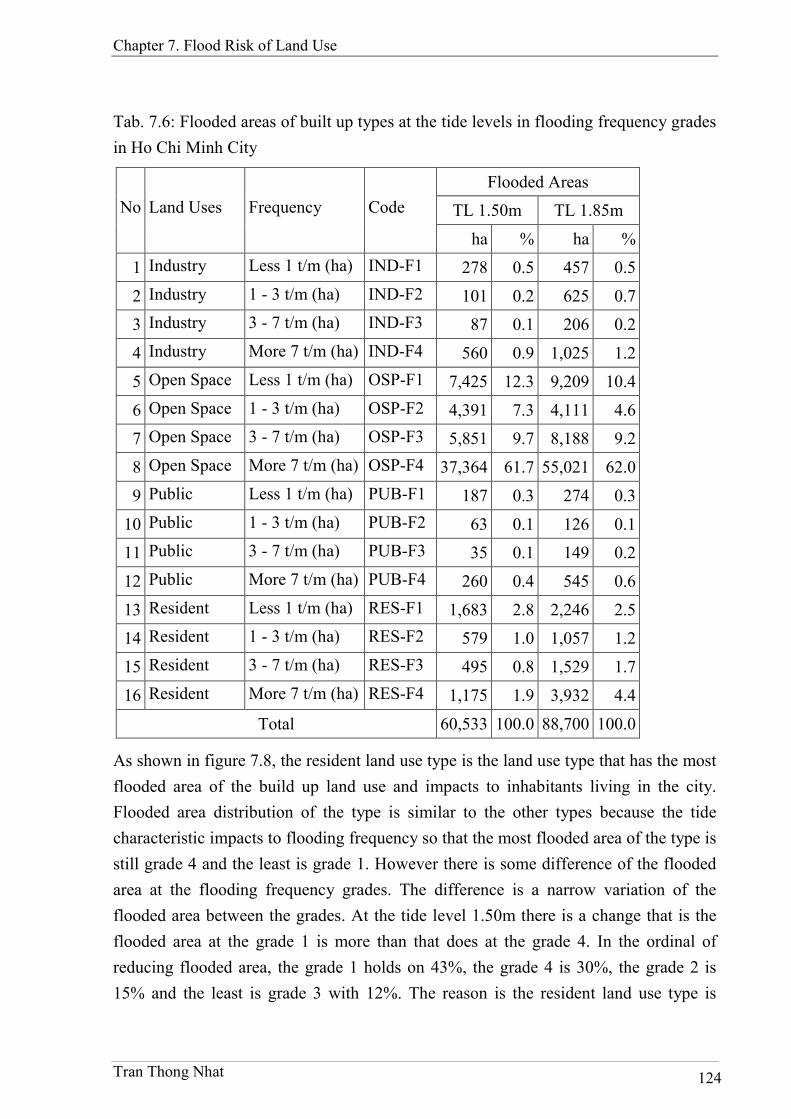
Chapter 7. Flood Risk of Land Use
Tran Thong Nhat 124
Tab. 7.6: Flooded areas of built up types at the tide levels in flooding frequency grades
in Ho Chi Minh City
Flooded Areas
TL 1.50m TL 1.85m No Land Uses Frequency Code
ha % ha %
1 Industry Less 1 t/m (ha) IND-F1 278 0.5 457 0.5
2 Industry 1 - 3 t/m (ha) IND-F2 101 0.2 625 0.7
3 Industry 3 - 7 t/m (ha) IND-F3 87 0.1 206 0.2
4 Industry More 7 t/m (ha) IND-F4 560 0.9 1,025 1.2
5 Open Space Less 1 t/m (ha) OSP-F1 7,425 12.3 9,209 10.4
6 Open Space 1 - 3 t/m (ha) OSP-F2 4,391 7.3 4,111 4.6
7 Open Space 3 - 7 t/m (ha) OSP-F3 5,851 9.7 8,188 9.2
8 Open Space More 7 t/m (ha) OSP-F4 37,364 61.7 55,021 62.0
9 Public Less 1 t/m (ha) PUB-F1 187 0.3 274 0.3
10 Public 1 - 3 t/m (ha) PUB-F2 63 0.1 126 0.1
11 Public 3 - 7 t/m (ha) PUB-F3 35 0.1 149 0.2
12 Public More 7 t/m (ha) PUB-F4 260 0.4 545 0.6
13 Resident Less 1 t/m (ha) RES-F1 1,683 2.8 2,246 2.5
14 Resident 1 - 3 t/m (ha) RES-F2 579 1.0 1,057 1.2
15 Resident 3 - 7 t/m (ha) RES-F3 495 0.8 1,529 1.7
16 Resident More 7 t/m (ha) RES-F4 1,175 1.9 3,932 4.4
Total 60,533 100.0 88,700 100.0
As shown in figure 7.8, the resident land use type is the land use type that has the most
flooded area of the build up land use and impacts to inhabitants living in the city.
Flooded area distribution of the type is similar to the other types because the tide
characteristic impacts to flooding frequency so that the most flooded area of the type is
still grade 4 and the least is grade 1. However there is some difference of the flooded
area at the flooding frequency grades. The difference is a narrow variation of the
flooded area between the grades. At the tide level 1.50m there is a change that is the
flooded area at the grade 1 is more than that does at the grade 4. In the ordinal of
reducing flooded area, the grade 1 holds on 43%, the grade 4 is 30%, the grade 2 is
15% and the least is grade 3 with 12%. The reason is the resident land use type is

Chapter 7. Flood Risk of Land Use
Tran Thong Nhat 125
distributed in the relative high lands and variation of elevation in the type is small in
the regions. Besides the resident regions are located in the low lands are protected by
roads so that at this tide level there is not extremely differences at the grades. However
these constructions are not distributed regular for all urban zones therefore distribution
of the flooded area in the urban zones is not the same. In the rural and new urban
almost flooded area concentrates at the grade 4 and grade 1 with the same number of
the flooded area but in the old center urban the flooded area holds on the most at the
grade 1 and the other grades is very little including the least flooded area is grade 4
(see appendix B.3). This information shows that the resident regions in the rural and
new urban are located in the low lands but there is not many constructions that can
help to protect the region for prevention of inundation as in the old center urban.
Affected Built Up at Tide Levels in Flooding Frequency Grades in
Ho Chi Minh City
0
1000
2000
3000
4000
ha
Tide level 1.50m (ha) 278 101 87 560 187 63 35 260 1683 579 495 1175
Tide level 1.85m (ha) 457 625 206 1025 274 126 149 545 2246 1057 1529 3932
IND-
F1
IND-
F2
IND-
F3
IND-
F4
PUB-
F1
PUB-
F2
PUB-
F3
PUB-
F4
RES-
F1
RES-
F2
RES-
F3
RES-
F4
Fig. 7.8: Flooded areas of built up types at tide levels in flooding frequency grades in
Ho Chi Minh City
To assess more clearly, the flooded area data at the tide level 1.85m can answer. When
tide level raises to 1.85m, almost flooded area at all the grades is increase. The most
increasing of the flooded area is grade 3 with 3.1 times and grade 4 with 3.5 times as
many as that does at tide level 1.50m. The explanation for this phenomenon is there
are not much more the high land resident regions in all the urban zones to flood when
tide level rises. Only the low lands which are protected by the roads but the roads can
not help to prevent the regions inundation at the high tide so that the low lands are
flooded for long duration. In the rural the low lands are extended for inundation is
Binh Chanh Rural District and Nha Be Rural District. In the new urban that is Binh
Chapter 7. Flood Risk of Land Use
Tran Thong Nhat 126
Tan District, Thu Duc District, District 2, District 7 and District 12. And in the old
center urban that are District 4, District 6, District 8 and Binh Thanh District. One
general reason is the flooded areas at all grades at tide level 1.50m are moved to the
grade 5 at tide level 1.85m so that the number of the flooded area at the grade 5
increases more than the others (see appendix B.3, figure 7.1 and figure 7.2).
Chapter 8. Conclusion and Recommendation
Tran Thong Nhat 127
Chapter 8. Conclusion and Recommendation
1. Conclusions
Nowadays, climate change is an issue that has a very large scope with affecting many
aspects of human society. In Ho Chi Minh City the impact of the climate change
influences to human by severe consequences that cause rising sea level so that there
are a lot of flood risk to development of the city in the future. Therefore, this research
aims another approach to assess flood risk by the application of GIS in improving the
accuracy of the inputs for flood model and reducing time cost.
As mentioned in the research aims and objectives, there are two major aims for this
research. The first aim is applying GIS to improve the accuracy of data input for a
flood model besides using this technology to compute the other characteristics of flood
caused by high tide in Ho Chi Minh City. The second one is to determine qualitative
information of the elements of urban system effectively by GIS so that the result can
be captured rapidly and be useful for decision makers and planners for development in
Ho Chi Minh City in the future.
The archives of the research are summarized in the next sections of this chapter.
Besides, each section is also make remarks that research has not yet reached to
improve in future further researches.
1.1. Flood model and flooded areas in Ho Chi Minh City
This is part that addresses conclusions of the targets and remarks of the first objective
in the research. The objective relates to improving the precision of the digital terrain
model that is one of the important inputs to the flood model and moreover a
calculation of flooding characteristics that are caused by tide levels from the flood
model based on GIS.
This research has proposed a new method to increase the accuracy of
terrain that is one of the most important inputs of any flood model. The
terrain is simulated in the digital terrain model with providing for
elevations of roads, houses and irrigation networks. This is really important
Chapter 8. Conclusion and Recommendation
Tran Thong Nhat 128
when running flood model in urban areas because the terrain surface is
more accurate so that its results make the more accurate floodplain.
Giving a specific approach for determining the frequency and duration of
tidal flooding was caused by tide combining sea level rise. This
determining makes many advantages in assessing the flood risk as well as
helping for more comprehensive assessment of the flood risk.
When the tide level rises, the flooded area is increased much in all urban
zones and high risk grades of flooding characteristics.
The flooded areas increase from urban zones to new urban zones and the
highest in rural zones. The flooded areas are concentrated in the southern
and eastern regions of the city at both tide levels 1.50m and 1.85m.
Many areas are not flooded at tide level 1.50m but they are not sustainable
due to they are protected by the roads that have elevation to be not much
higher than 1.50m. So when the tide reaches to 1.85m a lot of these areas
are inundated seriously.
As the tide level rises, the flooded areas of the high depth grades hold on
major that can make human damage and affect more inhabitants living in
the flooded areas.
Almost areas are flooded for longer than 4 hours. This requires special
attention due to the flood impact to works of the inhabitants in especial
problems of environment, health and income.
Flooding frequency of almost flooded areas is more than 7 time per month.
And more risk when the tide level increases, the urban areas are regions
where have increase of flooded areas with high flooding frequency. This is
against convenient life of the inhabitants who are living there.
There is a remark that is due to the problem in collecting observed data is missed so
that the flood model was not able to calibrate and verify. And so, the flooded areas will
make a trend to be larger. That means flood prone areas and their impacts are more
than that is in reality.

Chapter 8. Conclusion and Recommendation
Tran Thong Nhat 129
Another thing is the elements of uncertainty of the factors influencing to flood risk in
the future. The first element is the climate change. This is one of the forecast scenarios
of emission that shows population development and technology used in the future on
over the world. The second factor is the change in the structures of the urban system
such as traffic, land use… that influent to flood processes. Moreover the second one
leads to the third element of uncertainty that is changed topography of the city. The
reason of the element is any locations where are used for development of urban the
ground surfaces in there will be impacted a lot of terrain height.
1.2. Flood risk of houses
Houses are the one of objects that is main interested goal for assessment of the flood
risk in the research. For houses, the research has come up with data that can use to
assess the flood risk on all flooding characteristics. Moreover, it also analyzes the
areas where houses are impacted in the different grades of the flooding characteristics.
The archives of the research are detailed as shown below:
Although flooded areas increase gradually from old center urban to the
rural but the flooded houses do opposite direction at the tide levels. And
there is more dangerous that is the most areas are flooded in the old center
urban at the high tide level. This is a notice for the inhabitant living.
Almost houses are flooded areas but they are only affected that mean no
water is inside of the houses. However, the tide level 1.85m there are many
houses sunk in the water of flood and the flooded house areas are increased
rapidly. This arise problems of environment, health and income for the
inhabitants.
All the urban zones in the city are increased flooded area of the 0 - 0.5m
deep at the tide level 1.85m so that there should be more attention of the
authorities and inhabitants. An essential of delivering information and
announcements that can help to improve understanding for the inhabitants
in the low lands of the flood risk in future should be carried out for
adaptation.
Chapter 8. Conclusion and Recommendation
Tran Thong Nhat 130
As the tide level increases, flooded houses at the high grades of flooding
duration are extended a lot. That means the risk is promoted so that living
activities of the inhabitants are more and more impacted.
Flooded house areas at the high grades of flooding frequency are increased
the most in the old center urban and new urban. This shows that the
protective structures with the roads are not really sustainable to help the
low land prevented flood by high tide in the future.
For flooding frequency, at the tide level 1.50m almost flooded house areas
are low grades but at the tide level 1.85m flooded house areas at the
highest grade are increased very seriously besides extension of flooded
areas at the others grades does. And more interesting that is the flooded
house areas at the highest grade are developed rapidly in the old center
urban and new urban where population density is very high. Consequently
this impacts to living activities of inhabitants a lot in the future.
There is a remark for the calculation result data of the houses. The remark concerns the
problem of asynchronous time of existing data that are collected in this study. The
elevation points are extracted from aerial photos captured older than house data.
Therefore, this can also lead to the calculation that is not perfect on the results.
However, a forecast result of the flood risk in the future that can use to predict risks for
the development in Ho Chi Minh City is useful entirely for the planning and
orientation in the study area.
1.3. Flood risk of population
Inhabitants are the most important object that the research is interested for assessment
of the flood risk. For population, the research has come up with data that can use to
assess the flood risk on all flooding characteristics. Moreover, it also analyzes the
areas where inhabitants are impacted in the different grades of the flooding
characteristics. The archives of the research are detailed as shown below:
There is a large number of flooded inhabitants is increased 2.5 times as
many as that does when tide level rises from 1.50m to 1.85m.
Number of the flooded inhabitants is increased gradually from the rural to
the old center urban at the two tide levels. The reason is amount of flooded
Chapter 8. Conclusion and Recommendation
Tran Thong Nhat 131
house areas also occur the same situation and additionally the population
density does as well.
About flooding depth, almost inhabitants are impacted by flooded at the
lowest grade and the number of affected inhabitants is decreased gradually
with the higher grades at two tide levels. However, when the tide level
rises, the number inhabitants of the higher grades of the flooding depth are
more increased. This is a matter that makes more dangerous for the
inhabitants in the future.
The amount of affected inhabitants in the urban zones is impacted
differently. The most dangerous concentrates in the rural and the new
urban as tide level rises. In these urban zones there is a number of affected
inhabitants is more increased than that is in the old center urban when tide
level rises. The cause is in the rural and new urban have a lot of the lowest
land in Ho Chi Minh City and besides the population is raised day by day.
This makes a notice that the authority should have a warnings about the
flood risk in the future to the inhabitants who are living and would move to
live in these zones.
Amount of inhabitants at the flooding duration grades at the tide level
1.50m is not different but at the tide level 1.85m the amount of inhabitants
is increased gradually risk grades of the flooding duration. Additionally,
when tide level raises amount of affected inhabitants is increased at almost
the flooding duration grades but increasing strongly at the high grades. It is
a notice for insurance of economic activities of the inhabitants.
The number of the affected inhabitants at the grades of the flooding
duration in all urban zones when the tide level rises is increased. The most
increasing is the old center urban and concentrated at the longest flooding
duration. The increasing is reduced gradually from the old center urban to
the rural. This means in the future the low lands in the old center urban will
be flooded longer than the other urban zones and so that activities of
inhabitant living there will be impacted more and more.
When the tide level is low almost the inhabitants are impacted by flood
with less than 1 time per month and the flooded area at the high frequency
Chapter 8. Conclusion and Recommendation
Tran Thong Nhat 132
grades is not much and equal to each of the others. However, when tide
level raises to 1.85m the number of the affected inhabitants is increased
rapidly. And the more dangerous the flooded area is held on the more
strongly that is increased. This concludes that in the future there are a lot of
the inhabitants are impacted more serious because the number of flooding
frequency is speeded up.
Moreover, the number of flooding frequency is increased in all urban zones
and the increasing trend more than in the old center urban and less than in
the rural. In the future there are a lot of regions in the old center urban are
inundated with high flooding frequency so that with the high population
density, number of affected inhabitants with more than 7 times/month in
these regions is increased 10 times as much as at tide level 1.50m. This is
serious problem that needs to resolve as soon as possible. If there is not a
suitable solution there are a lot of environmental troubles that impact to
inhabitant health, income and other activities of their life.
There is a remark for the calculation result data of the population. The remark
concerns the problem of asynchronous time of existing data that are collected in this
study. Besides the elevation points are extracted from aerial photos captured older than
house data, the house data are also older than population data. Therefore, this can also
lead to the calculation that is not perfect on the results. However, a forecast result of
the flood risk in the future that can use to predict risks for the development in Ho Chi
Minh City is useful entirely for the planning and orientation in the study area.
1.4. Flood risk of land use
The final object is interested in the research is land use. This object relates to urban
system of the region. Therefore assessment of the flood risk is necessary for this
research. For land-use types, the research has come up with data that can use to assess
the flood risk on all flooding characteristics. Moreover, it also analyzes the areas
where the land use types are impacted in the different grades of the flooding
characteristics. The archives of the research are detailed as shown below:
Almost flooded area is open space land use type because the open space
type is distributed in the lowest regions which are located in southern and
eastern Ho Chi Minh City with the forest and rice – crop fields. In the build
Chapter 8. Conclusion and Recommendation
Tran Thong Nhat 133
up land use types, the resident type is flooded the most at two tide levels.
When tide level rises, all land use types are increased flooded area. For the
industry type is almost flooded area in the rural and new urban because
policies requires industry regions must be located further from the old
center urban therefore there are almost old industry and new industry parks
that must move to the rural or new urban nowadays. For the public land use
type the flooded area is the new urban because there are some new harbors
in the District 2 and District 7 are inundated. With the resident land use
type at the tide level 1.50m there is not much difference of the flooded area
in each of the urban zones but at the tide level 1.85m there are a lot of new
flooded area in the old center urban and new urban because many regions
in these urban zones are protected by roads at low tide level but they can
not protect at tide level 1.85m.
About flooding depth impact to land use types, all land use types have
almost flooded area is not much deep at two tide levels. However, number
of the flooded area that is inundated deep at the tide level 1.85m is
increased. This conclusion issues a warning for preparation to adapt with
more flood impact in the future. Distribution of the land use types in the
different urban zones is not the same and there is not a general trend for all
land use types in the flooding depth.
In the contrast to characteristic of the flooding depth, in the flooding
duration all land use types have a trend that is the higher grade is the more
flooded area concentrates at two tide levels. And when tide level raises,
almost the grades of flooding duration, flooded area of all land use types is
increased in different degrees. And a special notice is the most increasing
of the flooded area is the highest grade of the flooding duration. This
means the income and works of the inhabitants living in the flooded area
will be impacted more serious by the flooding duration characteristic.
Distribution of the flooded area in the urban zones of the flooding duration
characteristic is not followed any rule for all land use types. For the
industry and open space types the change of the flooded area in the urban
zones as tide level raises is not clear. And for the public and resident types
Chapter 8. Conclusion and Recommendation
Tran Thong Nhat 134
the flooded area at all flooding duration grades is increased almost urban
zones.
All land use types have flooded area at all flooding frequency grades. The
most flooded area is the highest grade with more than 7 times per month.
When tide level raises almost flooded area of the land use types is
increased. The most increasing of the flooded area is the highest grade.
This is again that reminds there is more attention of the flood impact to
inhabitants living activities in the flooded regions. For the different land
use types in each of the urban zones, increasing of the flooded area is not
similar to each of others. Industry and open space land use types are
extended mostly new flooded area in the rural. Otherwise, the public and
resident land use types, the new flooded area is increased nearly equally in
all the urban zones.
There is a remark for the calculation result data of the land use types. Similarly to
houses and population, the remark concerns the problem of asynchronous time of
existing data that are collected in this study. Besides the elevation points are extracted
from aerial photos captured older than land use types. Therefore, this can also lead to
the calculation that is not perfect on the results. However, a forecast result of the flood
risk in the future that can use to predict risks for the development in Ho Chi Minh City
is useful entirely for the planning and orientation in the study area.
2. Recommendations
Each research can only meet some specific goals. And this research is not an
exception. Therefore, the results of this research will be useful data for policy makers
and planners to make development plans in the future for Ho Chi Minh City. Besides,
the research results are the foundation data to address directions of further applied
researches in the human social aspects affected by flood risk. Therefore, this part of
the thesis provides some suggestions for decision makers and researchers who are able
to conduct and create much more results that can be applied wider other fields that
help Ho Chi Minh City to be able to develop more sustainable in the future.
2.1. Authorities and decision makers
Chapter 8. Conclusion and Recommendation
Tran Thong Nhat 135
For the authorities and decision makers who make the policies, regulations and
decisions in Ho Chi Minh City, the research recommends some suggestions that help
for reducing of impacts of flood by sea level rise in the future to social economic
development. Additionally, beyond researches should be projected based on the results
of the research so that more policies and regulations improve the suitable and
sustainable development in Ho Chi Minh City in the future under climate change
especially with sea level rise:
Need further researches on flood impacts to the social economic fields and
based on those results, the authorities deliver policies that can support for
groups of people who are impacted and help them to improve resistibility
to flood risk in the future.
Enhance construction management to minimize spontaneous urbanization
by inhabitants in the flooded potential areas. Consequently, there is at least
the flood risk when the sea level will rise in the future for human and
properties.
The local government should conduct a research to build guide lines to
help inhabitants who are living in the flooded areas adaptations behaviors
when the sea level rises in the future.
2.2. Planner
The planners are one of the user groups from the results of the research because
planning is to lead and orient direction of the development in a region. Therefore, with
the forecast results of this research about flood risk in the future in Ho Chi Minh City,
the author of the research has some suggestions to the planners as followings:
Should make a plan of land use that moves the developing urban areas to
west northern and east northern regions. Reducing and make low
residential density in the low land regions where are able to flood in the
future.
Research and suggest land use types that are adaptable for the flooded
areas.
Chapter 8. Conclusion and Recommendation
Tran Thong Nhat 136
Research and suggest house types that can adapt and be reliable in the
flooded areas.
Construct guide lines that instruct for inhabitants living in the flooded areas
to be able to build their houses which are secure and resilient with flood in
the future.
2.3. Outlooks and further researches
As shown in the results of the research, some results can be used directly to policy
makers and planners. However, society is a system of human aspects, so with limited
time and resources, the research certainly can not cover all the fields to what influence
the flood risk. Therefore, research results that should be used as a based one to conduct
further researches on other fields in Ho Chi Minh City to serve more sustainable
development are to continue. Some directions of the further researches should be
studied extension based on this research as mentioned following:
The research has defined and calculated the flooding duration characteristic
causing by tide in the flood model. However, the flooding characteristic is
only right when the flooded areas are not barrier to flow back as tide is
decreased. For the others terrain with closing or small out let that has gate
to discharge volume of water equal to the tide decreasing real flooding
duration will be longer than value of the flooding duration is calculated by
the flood model in the research. Therefore consideration of this problem
should be improved in the further study to make the reliable and stable
value of the flooding characteristic.
Improve more for the data accuracy especially for terrain data with the
river bed data so that it is helpful for applying advance flood models such
as 2D, Couple 1D and 2D… to determine the flood characteristics. Those
results will be better and more accurate.
Applying the flood models that can implement set of flood causes such as
tide combine with rainfall and discharge from upstream reservoirs. This
will make the results that are more real situations.
Should be more attention with the land subsidence phenomenon to flood
problem. Nowadays, there are a lot of evidences that show the land
Chapter 8. Conclusion and Recommendation
Tran Thong Nhat 137
subsidence in Ho Chi Minh City is appearing with high speed and perhaps
the land subsidence is more than sea level rise (Dinh et al., 2008; Nga,
2006; Trung, 2009; Trung & Dinh, 2009). Therefore, the land subsidence is
not mention in the flood problem in the future so that the research results of
the flood problem are not accurate to use in the reality.
Make more study about impacts of the dike system for flood problem when
it is rain. This situation has a high probability of appearance because tide
and rainfall come together at the same time. And if the dike system protects
flood caused by tide but the system also blocks the water flow so that the
flood will appear. Therefore, a demand for understanding of water volume
from the rainfall in the situation and that is helpful for authorities to
prepare resources to face with the situation such as build more pumping
stations, control lakes and reservoirs in the areas where are accumulation
flow from rainfall.
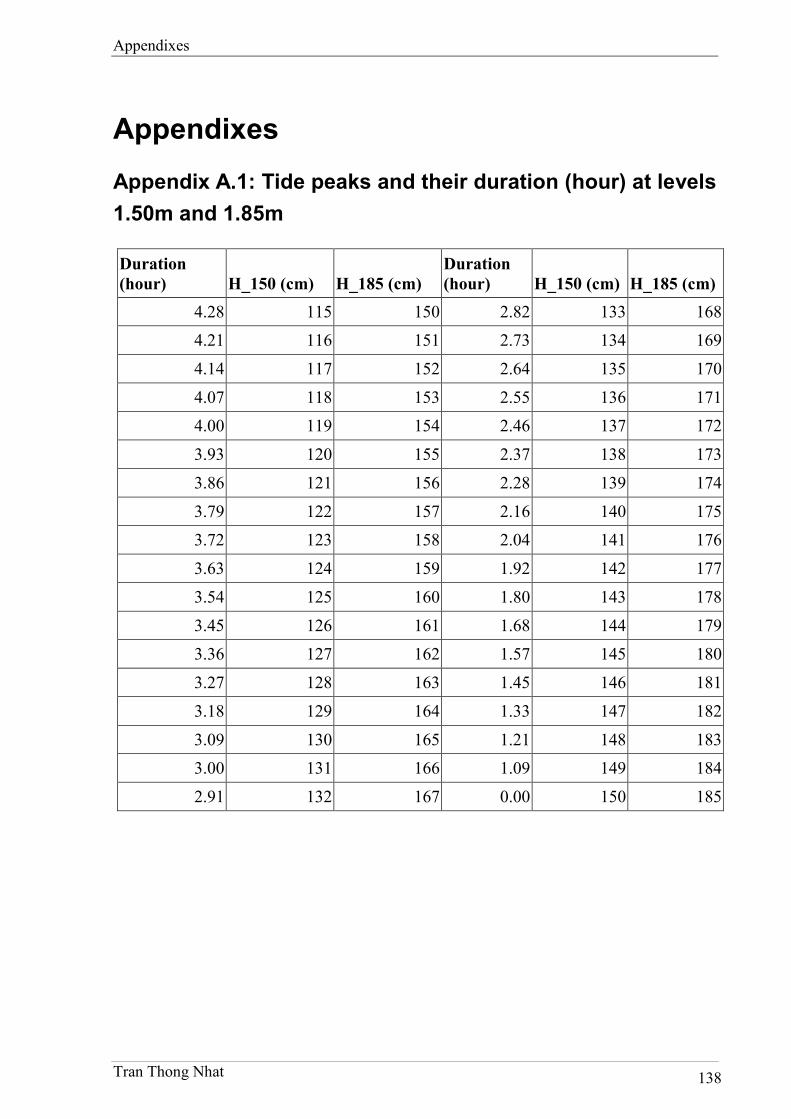
Appendixes
Tran Thong Nhat 138
Appendixes
Appendix A.1: Tide peaks and their duration (hour) at levels
1.50m and 1.85m
Duration (hour) H_150 (cm) H_185 (cm)
Duration (hour) H_150 (cm) H_185 (cm)
4.28 115 150 2.82 133 168
4.21 116 151 2.73 134 169
4.14 117 152 2.64 135 170
4.07 118 153 2.55 136 171
4.00 119 154 2.46 137 172
3.93 120 155 2.37 138 173
3.86 121 156 2.28 139 174
3.79 122 157 2.16 140 175
3.72 123 158 2.04 141 176
3.63 124 159 1.92 142 177
3.54 125 160 1.80 143 178
3.45 126 161 1.68 144 179
3.36 127 162 1.57 145 180
3.27 128 163 1.45 146 181
3.18 129 164 1.33 147 182
3.09 130 165 1.21 148 183
3.00 131 166 1.09 149 184
2.91 132 167 0.00 150 185
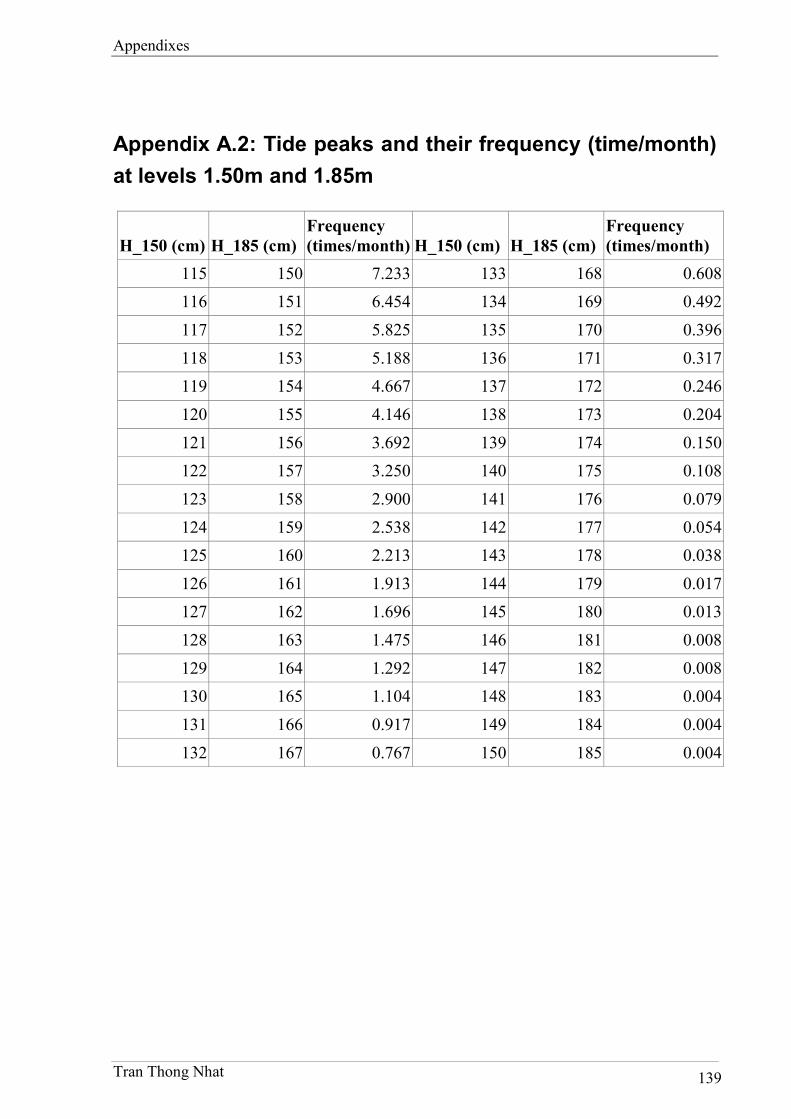
Appendixes
Tran Thong Nhat 139
Appendix A.2: Tide peaks and their frequency (time/month)
at levels 1.50m and 1.85m
H_150 (cm) H_185 (cm) Frequency (times/month) H_150 (cm) H_185 (cm)
Frequency (times/month)
115 150 7.233 133 168 0.608
116 151 6.454 134 169 0.492
117 152 5.825 135 170 0.396
118 153 5.188 136 171 0.317
119 154 4.667 137 172 0.246
120 155 4.146 138 173 0.204
121 156 3.692 139 174 0.150
122 157 3.250 140 175 0.108
123 158 2.900 141 176 0.079
124 159 2.538 142 177 0.054
125 160 2.213 143 178 0.038
126 161 1.913 144 179 0.017
127 162 1.696 145 180 0.013
128 163 1.475 146 181 0.008
129 164 1.292 147 182 0.008
130 165 1.104 148 183 0.004
131 166 0.917 149 184 0.004
132 167 0.767 150 185 0.004
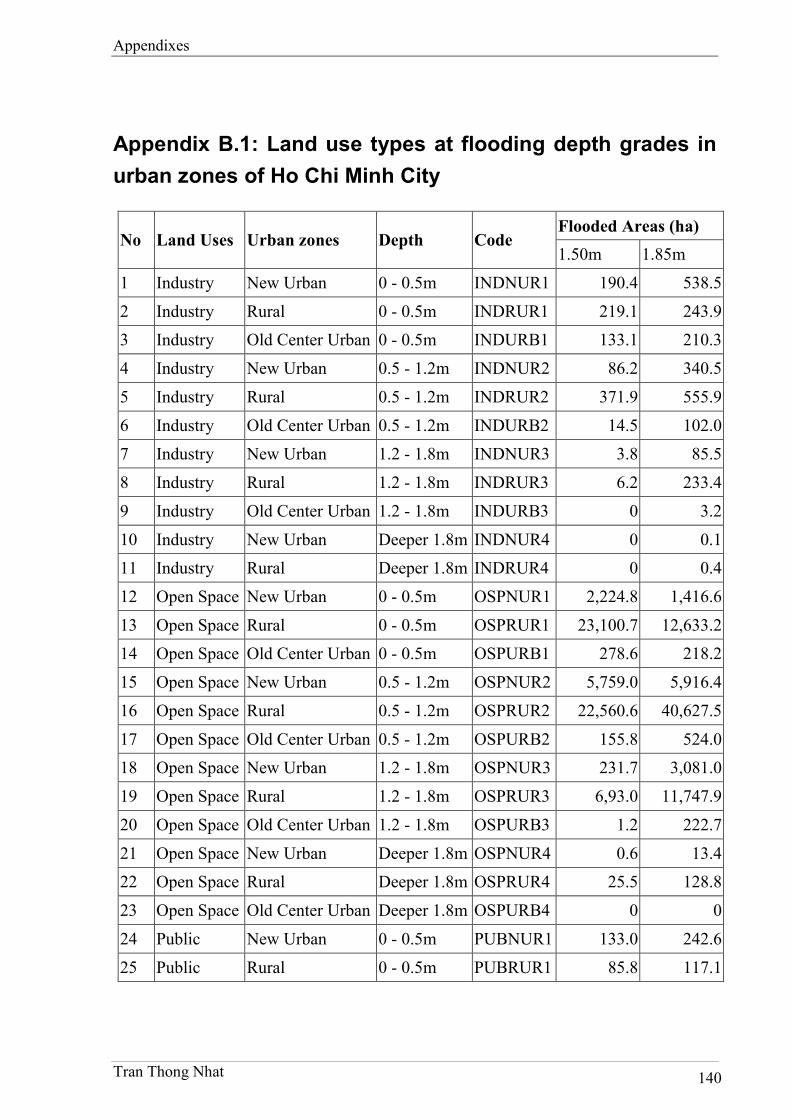
Appendixes
Tran Thong Nhat 140
Appendix B.1: Land use types at flooding depth grades in
urban zones of Ho Chi Minh City
Flooded Areas (ha) No Land Uses Urban zones Depth Code
1.50m 1.85m
1 Industry New Urban 0 - 0.5m INDNUR1 190.4 538.5
2 Industry Rural 0 - 0.5m INDRUR1 219.1 243.9
3 Industry Old Center Urban 0 - 0.5m INDURB1 133.1 210.3
4 Industry New Urban 0.5 - 1.2m INDNUR2 86.2 340.5
5 Industry Rural 0.5 - 1.2m INDRUR2 371.9 555.9
6 Industry Old Center Urban 0.5 - 1.2m INDURB2 14.5 102.0
7 Industry New Urban 1.2 - 1.8m INDNUR3 3.8 85.5
8 Industry Rural 1.2 - 1.8m INDRUR3 6.2 233.4
9 Industry Old Center Urban 1.2 - 1.8m INDURB3 0 3.2
10 Industry New Urban Deeper 1.8m INDNUR4 0 0.1
11 Industry Rural Deeper 1.8m INDRUR4 0 0.4
12 Open Space New Urban 0 - 0.5m OSPNUR1 2,224.8 1,416.6
13 Open Space Rural 0 - 0.5m OSPRUR1 23,100.7 12,633.2
14 Open Space Old Center Urban 0 - 0.5m OSPURB1 278.6 218.2
15 Open Space New Urban 0.5 - 1.2m OSPNUR2 5,759.0 5,916.4
16 Open Space Rural 0.5 - 1.2m OSPRUR2 22,560.6 40,627.5
17 Open Space Old Center Urban 0.5 - 1.2m OSPURB2 155.8 524.0
18 Open Space New Urban 1.2 - 1.8m OSPNUR3 231.7 3,081.0
19 Open Space Rural 1.2 - 1.8m OSPRUR3 6,93.0 11,747.9
20 Open Space Old Center Urban 1.2 - 1.8m OSPURB3 1.2 222.7
21 Open Space New Urban Deeper 1.8m OSPNUR4 0.6 13.4
22 Open Space Rural Deeper 1.8m OSPRUR4 25.5 128.8
23 Open Space Old Center Urban Deeper 1.8m OSPURB4 0 0
24 Public New Urban 0 - 0.5m PUBNUR1 133.0 242.6
25 Public Rural 0 - 0.5m PUBRUR1 85.8 117.1
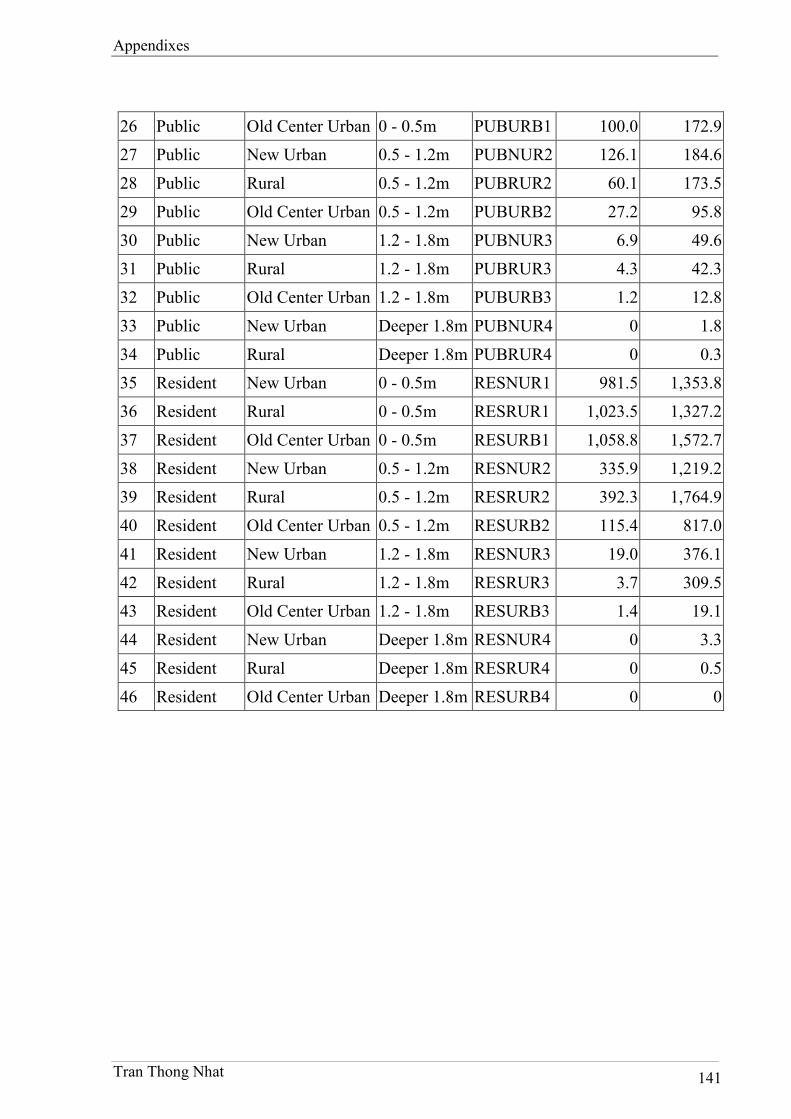
Appendixes
Tran Thong Nhat 141
26 Public Old Center Urban 0 - 0.5m PUBURB1 100.0 172.9
27 Public New Urban 0.5 - 1.2m PUBNUR2 126.1 184.6
28 Public Rural 0.5 - 1.2m PUBRUR2 60.1 173.5
29 Public Old Center Urban 0.5 - 1.2m PUBURB2 27.2 95.8
30 Public New Urban 1.2 - 1.8m PUBNUR3 6.9 49.6
31 Public Rural 1.2 - 1.8m PUBRUR3 4.3 42.3
32 Public Old Center Urban 1.2 - 1.8m PUBURB3 1.2 12.8
33 Public New Urban Deeper 1.8m PUBNUR4 0 1.8
34 Public Rural Deeper 1.8m PUBRUR4 0 0.3
35 Resident New Urban 0 - 0.5m RESNUR1 981.5 1,353.8
36 Resident Rural 0 - 0.5m RESRUR1 1,023.5 1,327.2
37 Resident Old Center Urban 0 - 0.5m RESURB1 1,058.8 1,572.7
38 Resident New Urban 0.5 - 1.2m RESNUR2 335.9 1,219.2
39 Resident Rural 0.5 - 1.2m RESRUR2 392.3 1,764.9
40 Resident Old Center Urban 0.5 - 1.2m RESURB2 115.4 817.0
41 Resident New Urban 1.2 - 1.8m RESNUR3 19.0 376.1
42 Resident Rural 1.2 - 1.8m RESRUR3 3.7 309.5
43 Resident Old Center Urban 1.2 - 1.8m RESURB3 1.4 19.1
44 Resident New Urban Deeper 1.8m RESNUR4 0 3.3
45 Resident Rural Deeper 1.8m RESRUR4 0 0.5
46 Resident Old Center Urban Deeper 1.8m RESURB4 0 0
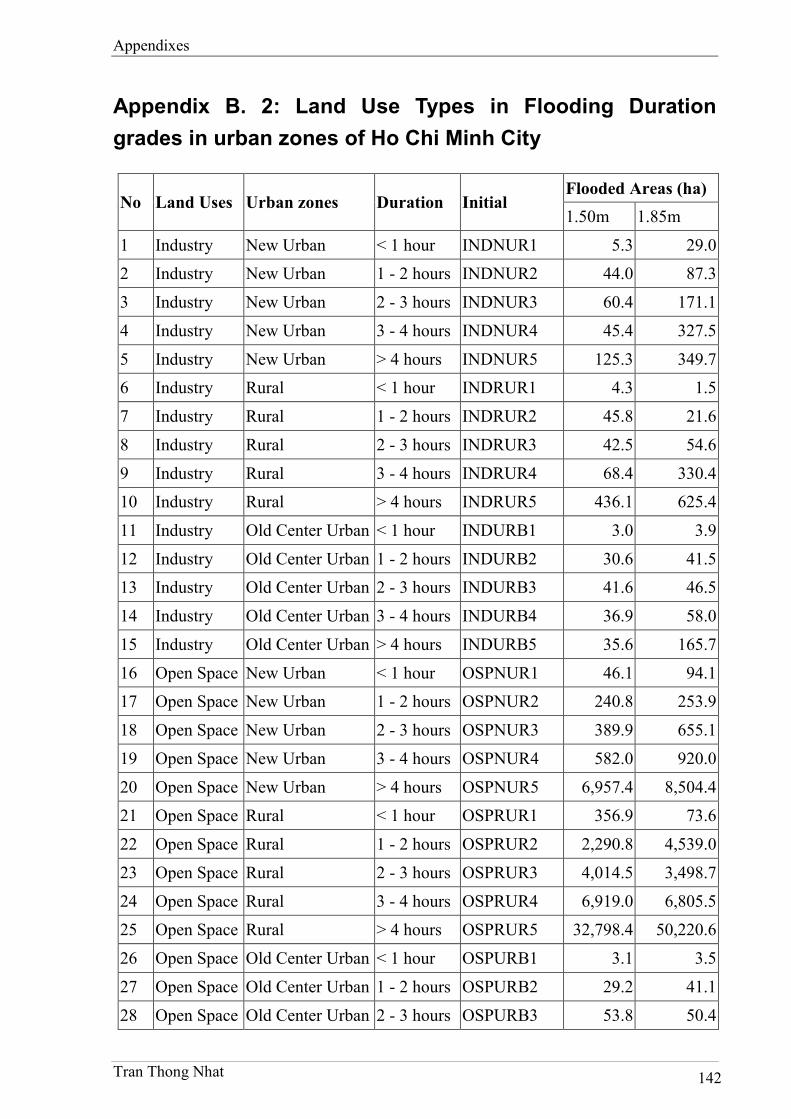
Appendixes
Tran Thong Nhat 142
Appendix B. 2: Land Use Types in Flooding Duration
grades in urban zones of Ho Chi Minh City
Flooded Areas (ha) No Land Uses Urban zones Duration Initial
1.50m 1.85m
1 Industry New Urban < 1 hour INDNUR1 5.3 29.0
2 Industry New Urban 1 - 2 hours INDNUR2 44.0 87.3
3 Industry New Urban 2 - 3 hours INDNUR3 60.4 171.1
4 Industry New Urban 3 - 4 hours INDNUR4 45.4 327.5
5 Industry New Urban > 4 hours INDNUR5 125.3 349.7
6 Industry Rural < 1 hour INDRUR1 4.3 1.5
7 Industry Rural 1 - 2 hours INDRUR2 45.8 21.6
8 Industry Rural 2 - 3 hours INDRUR3 42.5 54.6
9 Industry Rural 3 - 4 hours INDRUR4 68.4 330.4
10 Industry Rural > 4 hours INDRUR5 436.1 625.4
11 Industry Old Center Urban < 1 hour INDURB1 3.0 3.9
12 Industry Old Center Urban 1 - 2 hours INDURB2 30.6 41.5
13 Industry Old Center Urban 2 - 3 hours INDURB3 41.6 46.5
14 Industry Old Center Urban 3 - 4 hours INDURB4 36.9 58.0
15 Industry Old Center Urban > 4 hours INDURB5 35.6 165.7
16 Open Space New Urban < 1 hour OSPNUR1 46.1 94.1
17 Open Space New Urban 1 - 2 hours OSPNUR2 240.8 253.9
18 Open Space New Urban 2 - 3 hours OSPNUR3 389.9 655.1
19 Open Space New Urban 3 - 4 hours OSPNUR4 582.0 920.0
20 Open Space New Urban > 4 hours OSPNUR5 6,957.4 8,504.4
21 Open Space Rural < 1 hour OSPRUR1 356.9 73.6
22 Open Space Rural 1 - 2 hours OSPRUR2 2,290.8 4,539.0
23 Open Space Rural 2 - 3 hours OSPRUR3 4,014.5 3,498.7
24 Open Space Rural 3 - 4 hours OSPRUR4 6,919.0 6,805.5
25 Open Space Rural > 4 hours OSPRUR5 32,798.4 50,220.6
26 Open Space Old Center Urban < 1 hour OSPURB1 3.1 3.5
27 Open Space Old Center Urban 1 - 2 hours OSPURB2 29.2 41.1
28 Open Space Old Center Urban 2 - 3 hours OSPURB3 53.8 50.4
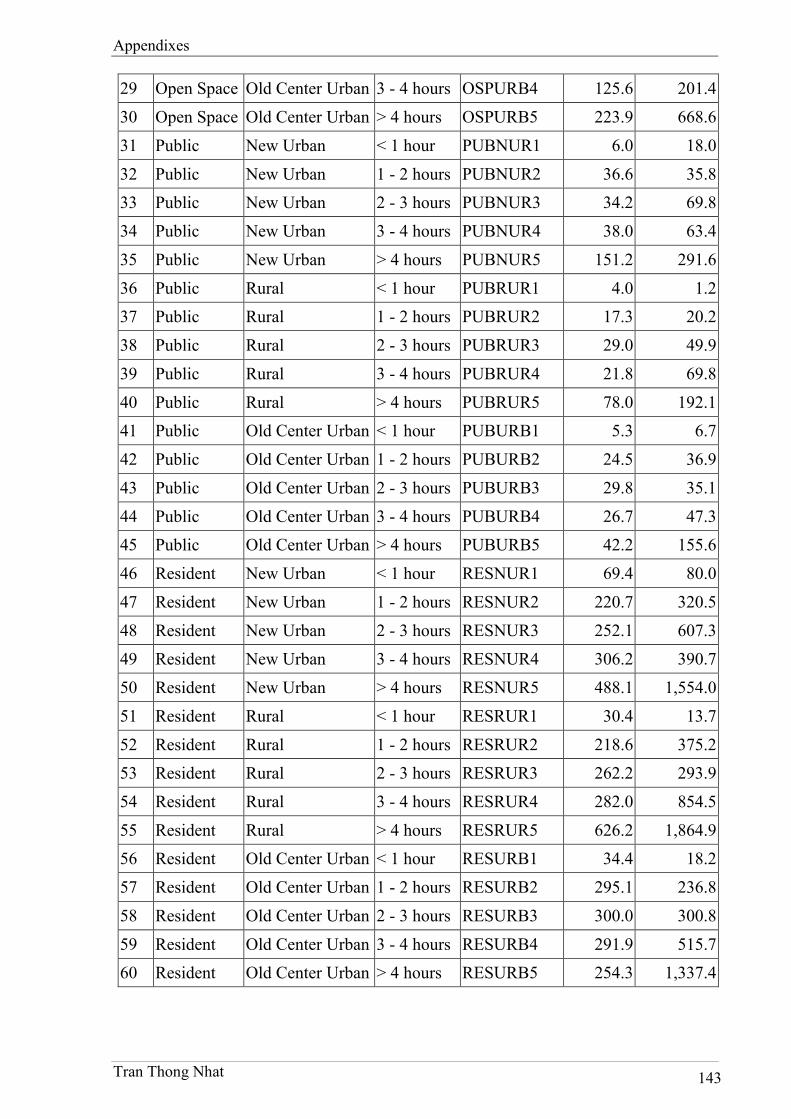
Appendixes
Tran Thong Nhat 143
29 Open Space Old Center Urban 3 - 4 hours OSPURB4 125.6 201.4
30 Open Space Old Center Urban > 4 hours OSPURB5 223.9 668.6
31 Public New Urban < 1 hour PUBNUR1 6.0 18.0
32 Public New Urban 1 - 2 hours PUBNUR2 36.6 35.8
33 Public New Urban 2 - 3 hours PUBNUR3 34.2 69.8
34 Public New Urban 3 - 4 hours PUBNUR4 38.0 63.4
35 Public New Urban > 4 hours PUBNUR5 151.2 291.6
36 Public Rural < 1 hour PUBRUR1 4.0 1.2
37 Public Rural 1 - 2 hours PUBRUR2 17.3 20.2
38 Public Rural 2 - 3 hours PUBRUR3 29.0 49.9
39 Public Rural 3 - 4 hours PUBRUR4 21.8 69.8
40 Public Rural > 4 hours PUBRUR5 78.0 192.1
41 Public Old Center Urban < 1 hour PUBURB1 5.3 6.7
42 Public Old Center Urban 1 - 2 hours PUBURB2 24.5 36.9
43 Public Old Center Urban 2 - 3 hours PUBURB3 29.8 35.1
44 Public Old Center Urban 3 - 4 hours PUBURB4 26.7 47.3
45 Public Old Center Urban > 4 hours PUBURB5 42.2 155.6
46 Resident New Urban < 1 hour RESNUR1 69.4 80.0
47 Resident New Urban 1 - 2 hours RESNUR2 220.7 320.5
48 Resident New Urban 2 - 3 hours RESNUR3 252.1 607.3
49 Resident New Urban 3 - 4 hours RESNUR4 306.2 390.7
50 Resident New Urban > 4 hours RESNUR5 488.1 1,554.0
51 Resident Rural < 1 hour RESRUR1 30.4 13.7
52 Resident Rural 1 - 2 hours RESRUR2 218.6 375.2
53 Resident Rural 2 - 3 hours RESRUR3 262.2 293.9
54 Resident Rural 3 - 4 hours RESRUR4 282.0 854.5
55 Resident Rural > 4 hours RESRUR5 626.2 1,864.9
56 Resident Old Center Urban < 1 hour RESURB1 34.4 18.2
57 Resident Old Center Urban 1 - 2 hours RESURB2 295.1 236.8
58 Resident Old Center Urban 2 - 3 hours RESURB3 300.0 300.8
59 Resident Old Center Urban 3 - 4 hours RESURB4 291.9 515.7
60 Resident Old Center Urban > 4 hours RESURB5 254.3 1,337.4
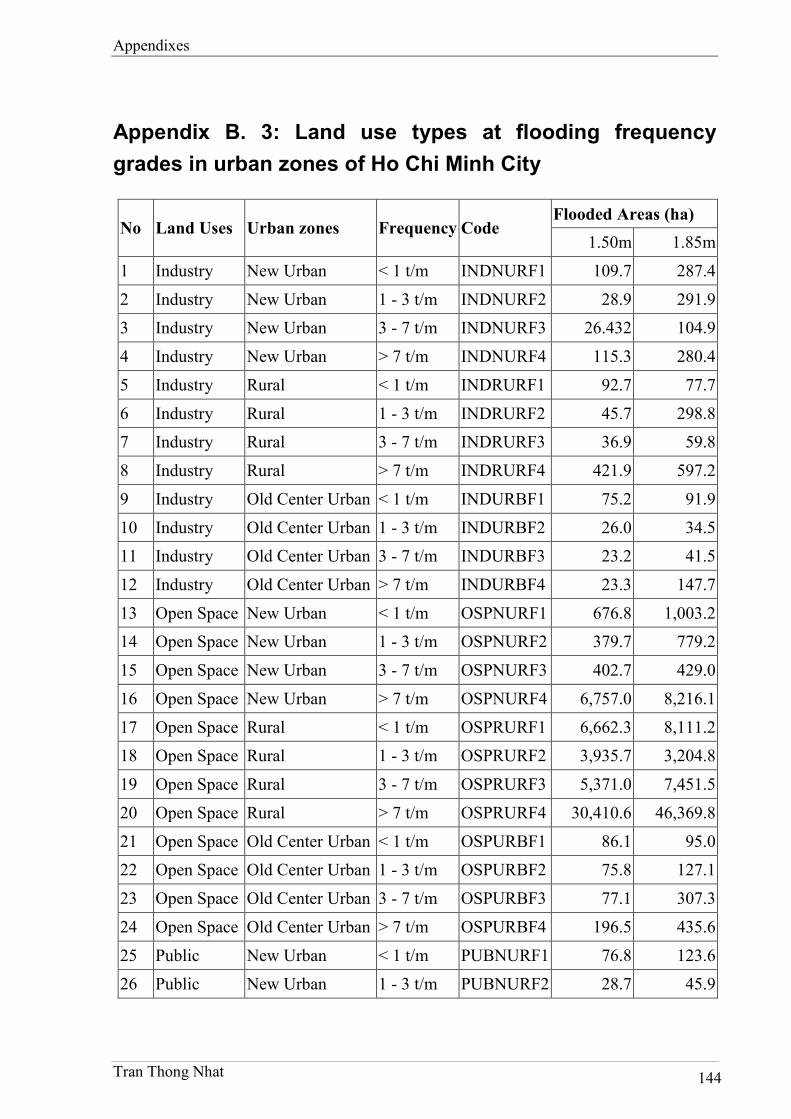
Appendixes
Tran Thong Nhat 144
Appendix B. 3: Land use types at flooding frequency
grades in urban zones of Ho Chi Minh City
Flooded Areas (ha) No Land Uses Urban zones Frequency Code
1.50m 1.85m
1 Industry New Urban < 1 t/m INDNURF1 109.7 287.4
2 Industry New Urban 1 - 3 t/m INDNURF2 28.9 291.9
3 Industry New Urban 3 - 7 t/m INDNURF3 26.432 104.9
4 Industry New Urban > 7 t/m INDNURF4 115.3 280.4
5 Industry Rural < 1 t/m INDRURF1 92.7 77.7
6 Industry Rural 1 - 3 t/m INDRURF2 45.7 298.8
7 Industry Rural 3 - 7 t/m INDRURF3 36.9 59.8
8 Industry Rural > 7 t/m INDRURF4 421.9 597.2
9 Industry Old Center Urban < 1 t/m INDURBF1 75.2 91.9
10 Industry Old Center Urban 1 - 3 t/m INDURBF2 26.0 34.5
11 Industry Old Center Urban 3 - 7 t/m INDURBF3 23.2 41.5
12 Industry Old Center Urban > 7 t/m INDURBF4 23.3 147.7
13 Open Space New Urban < 1 t/m OSPNURF1 676.8 1,003.2
14 Open Space New Urban 1 - 3 t/m OSPNURF2 379.7 779.2
15 Open Space New Urban 3 - 7 t/m OSPNURF3 402.7 429.0
16 Open Space New Urban > 7 t/m OSPNURF4 6,757.0 8,216.1
17 Open Space Rural < 1 t/m OSPRURF1 6,662.3 8,111.2
18 Open Space Rural 1 - 3 t/m OSPRURF2 3,935.7 3,204.8
19 Open Space Rural 3 - 7 t/m OSPRURF3 5,371.0 7,451.5
20 Open Space Rural > 7 t/m OSPRURF4 30,410.6 46,369.8
21 Open Space Old Center Urban < 1 t/m OSPURBF1 86.1 95.0
22 Open Space Old Center Urban 1 - 3 t/m OSPURBF2 75.8 127.1
23 Open Space Old Center Urban 3 - 7 t/m OSPURBF3 77.1 307.3
24 Open Space Old Center Urban > 7 t/m OSPURBF4 196.5 435.6
25 Public New Urban < 1 t/m PUBNURF1 76.8 123.6
26 Public New Urban 1 - 3 t/m PUBNURF2 28.7 45.9
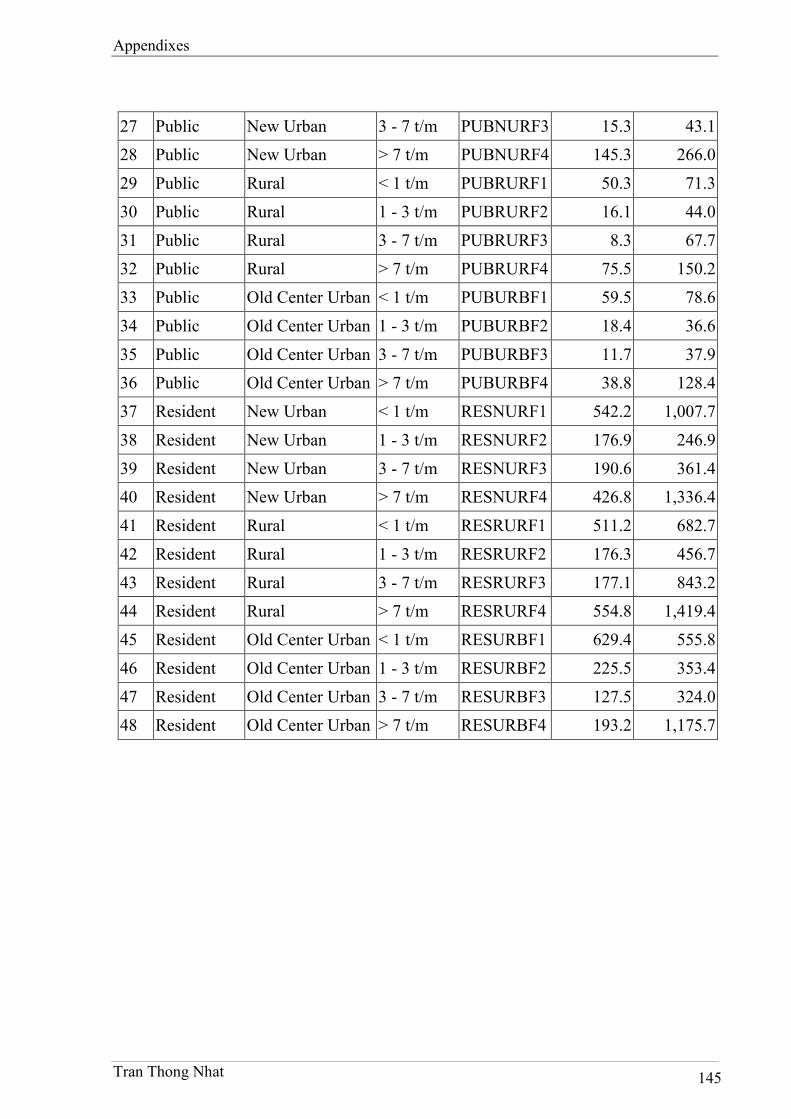
Appendixes
Tran Thong Nhat 145
27 Public New Urban 3 - 7 t/m PUBNURF3 15.3 43.1
28 Public New Urban > 7 t/m PUBNURF4 145.3 266.0
29 Public Rural < 1 t/m PUBRURF1 50.3 71.3
30 Public Rural 1 - 3 t/m PUBRURF2 16.1 44.0
31 Public Rural 3 - 7 t/m PUBRURF3 8.3 67.7
32 Public Rural > 7 t/m PUBRURF4 75.5 150.2
33 Public Old Center Urban < 1 t/m PUBURBF1 59.5 78.6
34 Public Old Center Urban 1 - 3 t/m PUBURBF2 18.4 36.6
35 Public Old Center Urban 3 - 7 t/m PUBURBF3 11.7 37.9
36 Public Old Center Urban > 7 t/m PUBURBF4 38.8 128.4
37 Resident New Urban < 1 t/m RESNURF1 542.2 1,007.7
38 Resident New Urban 1 - 3 t/m RESNURF2 176.9 246.9
39 Resident New Urban 3 - 7 t/m RESNURF3 190.6 361.4
40 Resident New Urban > 7 t/m RESNURF4 426.8 1,336.4
41 Resident Rural < 1 t/m RESRURF1 511.2 682.7
42 Resident Rural 1 - 3 t/m RESRURF2 176.3 456.7
43 Resident Rural 3 - 7 t/m RESRURF3 177.1 843.2
44 Resident Rural > 7 t/m RESRURF4 554.8 1,419.4
45 Resident Old Center Urban < 1 t/m RESURBF1 629.4 555.8
46 Resident Old Center Urban 1 - 3 t/m RESURBF2 225.5 353.4
47 Resident Old Center Urban 3 - 7 t/m RESURBF3 127.5 324.0
48 Resident Old Center Urban > 7 t/m RESURBF4 193.2 1,175.7
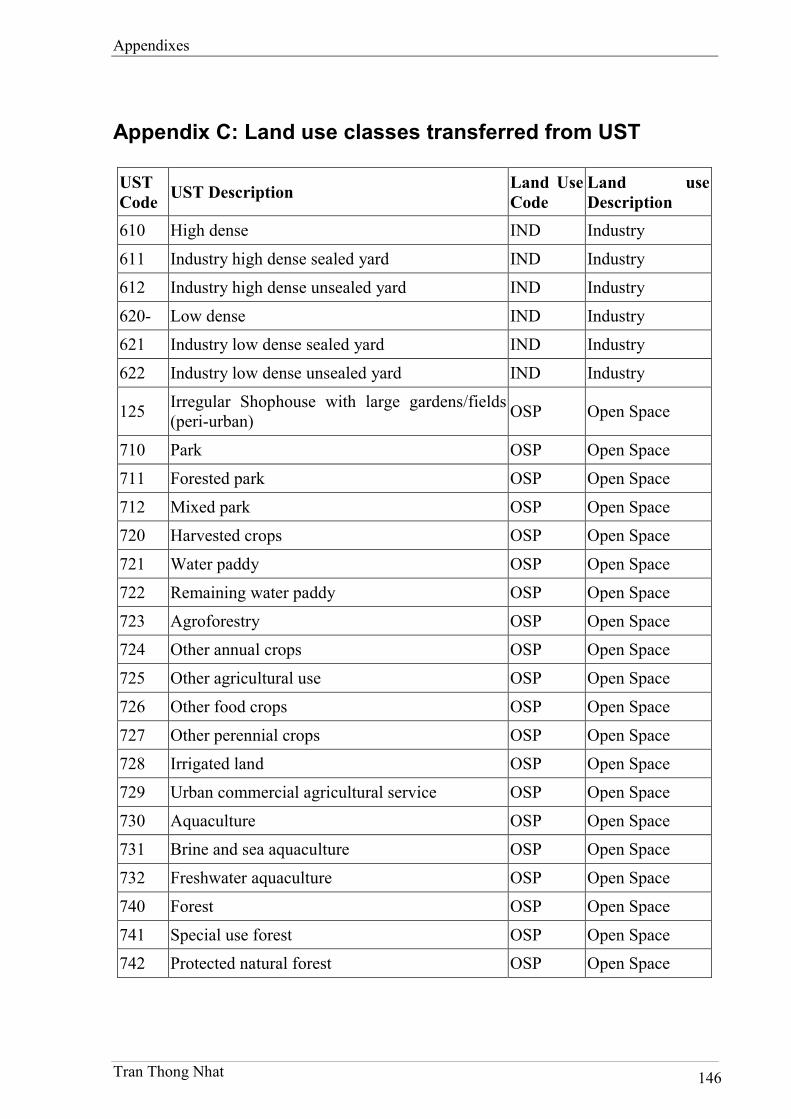
Appendixes
Tran Thong Nhat 146
Appendix C: Land use classes transferred from UST
UST Code
UST Description Land Use Code
Land use Description
610 High dense IND Industry
611 Industry high dense sealed yard IND Industry
612 Industry high dense unsealed yard IND Industry
620- Low dense IND Industry
621 Industry low dense sealed yard IND Industry
622 Industry low dense unsealed yard IND Industry
125 Irregular Shophouse with large gardens/fields (peri-urban)
OSP Open Space
710 Park OSP Open Space
711 Forested park OSP Open Space
712 Mixed park OSP Open Space
720 Harvested crops OSP Open Space
721 Water paddy OSP Open Space
722 Remaining water paddy OSP Open Space
723 Agroforestry OSP Open Space
724 Other annual crops OSP Open Space
725 Other agricultural use OSP Open Space
726 Other food crops OSP Open Space
727 Other perennial crops OSP Open Space
728 Irrigated land OSP Open Space
729 Urban commercial agricultural service OSP Open Space
730 Aquaculture OSP Open Space
731 Brine and sea aquaculture OSP Open Space
732 Freshwater aquaculture OSP Open Space
740 Forest OSP Open Space
741 Special use forest OSP Open Space
742 Protected natural forest OSP Open Space
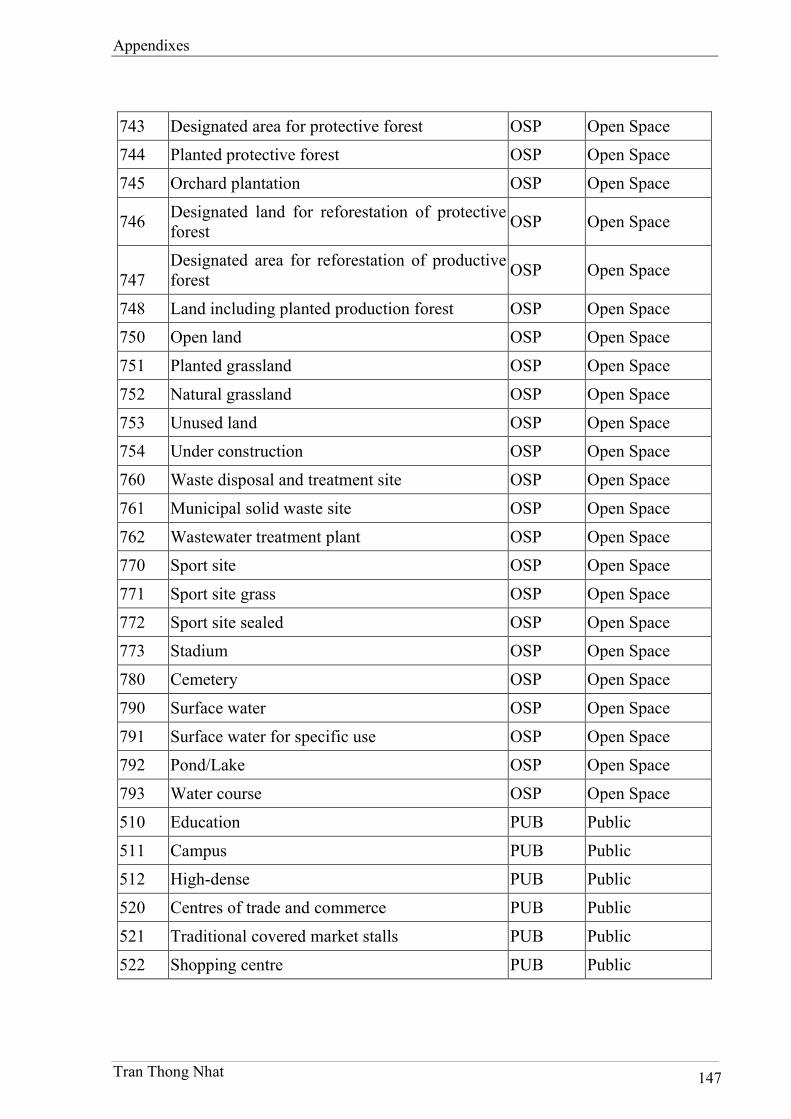
Appendixes
Tran Thong Nhat 147
743 Designated area for protective forest OSP Open Space
744 Planted protective forest OSP Open Space
745 Orchard plantation OSP Open Space
746 Designated land for reforestation of protective forest
OSP Open Space
747 Designated area for reforestation of productive forest
OSP Open Space
748 Land including planted production forest OSP Open Space
750 Open land OSP Open Space
751 Planted grassland OSP Open Space
752 Natural grassland OSP Open Space
753 Unused land OSP Open Space
754 Under construction OSP Open Space
760 Waste disposal and treatment site OSP Open Space
761 Municipal solid waste site OSP Open Space
762 Wastewater treatment plant OSP Open Space
770 Sport site OSP Open Space
771 Sport site grass OSP Open Space
772 Sport site sealed OSP Open Space
773 Stadium OSP Open Space
780 Cemetery OSP Open Space
790 Surface water OSP Open Space
791 Surface water for specific use OSP Open Space
792 Pond/Lake OSP Open Space
793 Water course OSP Open Space
510 Education PUB Public
511 Campus PUB Public
512 High-dense PUB Public
520 Centres of trade and commerce PUB Public
521 Traditional covered market stalls PUB Public
522 Shopping centre PUB Public
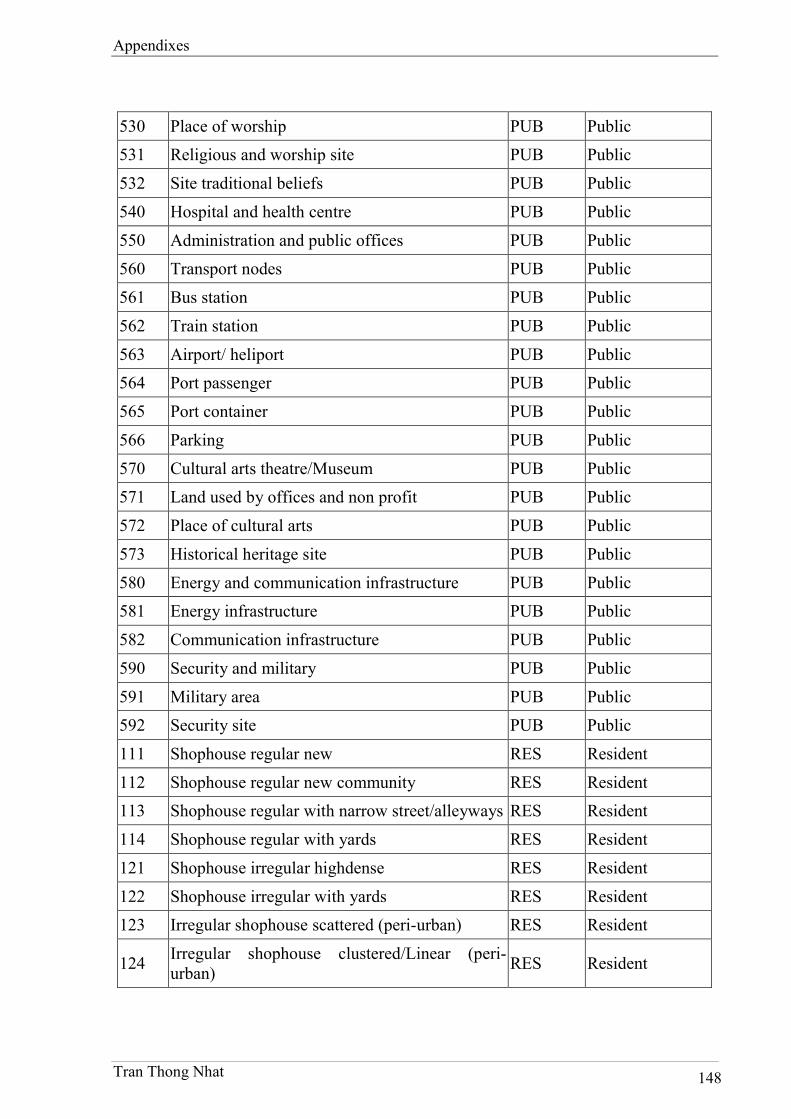
Appendixes
Tran Thong Nhat 148
530 Place of worship PUB Public
531 Religious and worship site PUB Public
532 Site traditional beliefs PUB Public
540 Hospital and health centre PUB Public
550 Administration and public offices PUB Public
560 Transport nodes PUB Public
561 Bus station PUB Public
562 Train station PUB Public
563 Airport/ heliport PUB Public
564 Port passenger PUB Public
565 Port container PUB Public
566 Parking PUB Public
570 Cultural arts theatre/Museum PUB Public
571 Land used by offices and non profit PUB Public
572 Place of cultural arts PUB Public
573 Historical heritage site PUB Public
580 Energy and communication infrastructure PUB Public
581 Energy infrastructure PUB Public
582 Communication infrastructure PUB Public
590 Security and military PUB Public
591 Military area PUB Public
592 Security site PUB Public
111 Shophouse regular new RES Resident
112 Shophouse regular new community RES Resident
113 Shophouse regular with narrow street/alleyways RES Resident
114 Shophouse regular with yards RES Resident
121 Shophouse irregular highdense RES Resident
122 Shophouse irregular with yards RES Resident
123 Irregular shophouse scattered (peri-urban) RES Resident
124 Irregular shophouse clustered/Linear (peri-urban)
RES Resident

Appendixes
Tran Thong Nhat 149
126 Shophouse irregular temporary RES Resident
131 Shophouse with industry RES Resident
132 Shophouse irregular with regular RES Resident
211 Villa RES Resident
212 Luxury villa RES Resident
213 Gated villa community RES Resident
221 Villa in establish UST RES Resident
231 Colonial villa RES Resident
311 Lowrise apartment < 9 floors RES Resident
312 Highrise apartment > 9 floors RES Resident
321 Chinese apartment RES Resident
322 American apartment RES Resident
323 Social housing RES Resident
411 Central business district RES Resident
412 Central business district with highrise RES Resident
Literatures and References
Tran Thong Nhat 150
Literatures and References
Abdul-Rahman A. & Pilouk M., 2008. Spatial Data Modelling for 3D GIS, Springer:
Berlin.
ADB (Asian Development Bank), 2009a. Ho Chi Minh City Adaptation To Climate
Change - Volume1: Executive Summary - Final Report. Management
International Centre for Environmental, 35 pp. Available:
http://icem.com.au/portfolio-items/vol-1-ho-chi-minh-city-adaptation-to-
climate-change-executive-summary/ [Accessed July 31 2013].
ADB (Asian Development Bank), 2009b. Ho Chi Minh City Adaptation To Climate
Change - Volume 2: Main Report - Final Report. ICEM International Centre for
Environmental Management, 177 pp. Available: http://icem.com.au/portfolio-
items/vol-2-ho-chi-minh-city-adaptation-to-climate-change-main-report/
[Accessed July 31 2013].
ADB (Asian Development Bank), 2009c. Ho Chi Minh City Adaptation To Climate
Change - Volume 3: Annexes - Final Report. ICEM International Centre for
Environmental Management, 165 pp. Available: http://icem.com.au/portfolio-
items/vol-3-ho-chi-minh-city-adaptation-to-climate-change-annexes/ [Accessed
July 31 2013].
ADB (Asian Development Bank), 2010. Ho Chi Minh City Adaptation to Climate
Change: Summary report. Mandaluyong, 43 pp. Available:
http://www.adb.org/documents/reports/hcmc-climate-change/hcmc-climate-
change-summary.pdf [Accessed 20 December 2010].
Ahmadabadian A. H., Robson S., Boehm J., Shortis M., Wenzel K. & Fritsch D.,
2013. A comparison of dense matching algorithms for scaled surface
reconstruction using stereo camera rigs. ISPRS Journal of Photogrammetry and
Remote Sensing, 78, 157-167. doi: 10.1016/j.isprsjprs.2013.01.015.
Altmaier A. & Kany C., 2002. Digital surface model generation from CORONA
satellite images. ISPRS Journal of Photogrammetry & Remote Sensing, 56 (12),
221 - 235.
Literatures and References
Tran Thong Nhat 151
Apel H., Aronica G. T., Kreibich H. & Thieken A. H., 2009. Flood risk analyses—how
detailed do we need to be? Natural Hazards, 49 (1), 79-98. doi:
10.1007/s11069-008-9277-8.
Aronica G. T., Hankin B. & Beven K., 1998a. Uncertainty and equifinality in
calibrating distributed roughness coefficients in a flood propagation model with
limited data. Advances in Water Resources Conservation and Recycling, 22 (4),
349-365. doi: 10.1016/S0309-1708(98)00017-7.
Aronica G. T., Tucciarelli T. & Nasello C., 1998b. 2D multilevel model for flood
wave propagation in flood-affected areas. Journal of Water Resources Planning
and Management, 124 (4), 210-217. doi: 10.1061/(ASCE)0733-
9496(1998)124:4(210).
Baky A. A., Zaman A. M. & Khan A. U., 2012. Managing Flood Flows for Crop
Production Risk Management with Hydraulic and GIS Modeling: Case study of
Agricultural Areas in Shariatpur. APCBEE Procedia, 1, 318-324. doi:
10.1016/j.apcbee.2012.03.052.
Baltsavias E. P., 1999. A comparison between photogrammetry and laser scanning.
ISPRS Journal of Photogrammetry & Remote Sensing, 54 (2–3), 83 - 94. doi:
10.1016/S0924-2716(99)00014-3.
Banzhaf E., Kindler A., Mueller A., Metz K., Reyes-Paecke S. & Weiland U., 2013.
Land-Use Change, Risk and Land-Use Management. In: Heinrichs D.,
Krellenberg K., Hansjürgens B., et al. (eds.) Risk Habitat Megacity. Springer:
Berlin Heidelberg, 127 -154. doi: 10.1007/978-3-642-11544-8_7.
Barnea S. & Filin S., 2013. Segmentation of terrestrial laser scanning data using
geometry and image information. ISPRS Journal of Photogrammetry and
Remote Sensing, 76, 33-48. doi: 10.1016/j.isprsjprs.2012.05.001.
Bates P. D. & De Roo A. P. J, 2000. A simple raster-based model for flood inundation
simulation. Journal of Hydrology, 236 (1-2), 54-77. doi: 10.1016/S0022-
1694(00)00278-X.
Bizimana J. P. & Schilling M., 2010. Geo-Information Technology for Infrastructural
Flood Risk Analysis in Unplanned Settlements: A Case Study of Informal
Settlement Flood Risk in the Nyabugogo Flood Plain, Kigali City, Rwanda. In:
Literatures and References
Tran Thong Nhat 152
Showalter P. S. & Lu Y. (eds.) GeoSpatial Techniques In Urban Hazard And
Analysics. Springer: Dordrecht Heidelberg London New York, 99-124. doi:
10.1007/978-90-481-2238-7.
Booij M., 2005. Impact of climate change on river flooding assessed with different
spatial model resolutions. Journal of Hydrology, 303 (1-4), 176-198. doi:
10.1016/j.jhydrol.2004.07.013.
Campagna M., 2006. GIS for Sustainable Development, CRC Press: Boca Raton.
Carrasco A. R., Ferreira Ó, Matias A. & Freire P., 2012. Flood hazard assessment and
management of fetch-limited coastal environments. Ocean & Coastal
Management, 65, 15-25. doi: 10.1016/j.ocecoaman.2012.04.016.
Carrivick J. L., 2006. Application of 2D hydrodynamic modelling to high-magnitude
outburst floods: An example from Kverkfjöll, Iceland. Journal of Hydrology,
321 (1-4), 187-199. doi: 10.1016/j.jhydrol.2005.07.042.
Chau V. N., Holland J., Cassells S. & Tuohy M., 2013. Using GIS to map impacts
upon agriculture from extreme floods in Vietnam. Applied Geography, 41, 65-
74. doi: 10.1016/j.apgeog.2013.03.014.
Chaudhry M. H., 2008. Open-Channel Flow Second Edition, Springer: New York.
Chow V. T., 1973. Open-Channel Hydraulics, McGraw-Hill: New York.
Cobby D. M., Mason D. C. & Davenport I. J., 2001. Image processing of airborne
scanning laser altimetry data for improved river flood modelling. ISPRS Journal
of Photogrammetry & Remote Sensing, 56 (2), 121 - 138.
Cunge J. A., 1975. Two-dimensional modeling of floodplains. Water Resources
Publications, 2, 705-762.
Cunge J. A., 2003. Of data and models. Journal of Hydroinformatics, 5, 75-98.
Dac N. T., 2005. Mathematical method for modelling flows and water quality in
channels, Agriculture Publishing House: Ho Chi Minh City, (Vietnamese).
Daniel V. E., Florax R. J. G. M. & Rietveld P., 2009. Flooding risk and housing
values: An economic assessment of environmental hazard. Ecological
Economics, 69 (2), 355-365. doi: 10.1016/j.ecolecon.2009.08.018.
Literatures and References
Tran Thong Nhat 153
Deckers P., Kellens W., Reyns J., Vanneuville W. & Maeyer P. D., 2010. A GIS for
Flood Risk Management in Flanders. In: Showalter P. S. & Lu Y. (eds.)
GeoSpatial Techniques In Urban Hazard And Analysics. Springer: Dordrecht
Heidelberg London New York, 51-69. doi: 10.1007/978-90-481-2238-7.
DeMers M. N., 2009. GIS for Dummies, Wilez Publishing, Inc.: Indiana.
Dewan A. M., 2013. Spatial and Temporal Distribution of Floods. In: Dewan A. M.
(ed.) Floods in a Megacity: Geospatial Techniques in Assessing Hazards, Risk
and Vulnerability. Springer: Dordrecht, 103-127. doi: 10.1007/978-94-007-
5875-9_4.
DHI (Danish Hydraulic Institute), 2004. MIKE 11 - A Modelling System for Rivers and
Channels, DHI Water & Environment.
DHI (Danish Hydraulic Institute), 2007a. MIKE 21 Flow Model - Hydrodynami
module scientific document.
DHI (Danish Hydraulic Institute), 2007b. MIKE FLOOD: 1D-2D Modelling user
manual.
Dinh H. T. M., Trung L. V., Sarti F., Dransfeld S. & Hanssen R. 2008. Measuring land
subsidence in ho chi minh city by means of radar interferometry techniques. In:
The Geoinfomatics for Spatial-Infrastructure Development in Earth and Allied
Science 2008, 4-6 December 2008 Hanoi, Vietnam. 365-370.
Dung N. V. 2008. Hydrodynamic modeling of floods in the Mekong Delta on different
scales. In: IWRM / WISDOM Modeling-Workshop, Bochum.
Dung N. V. 2011. Multi-objective automatic calibration of hydrodynamic models –
development of the concept and an application in the Mekong Delta. Doctor,
Doctoral dissertation, Institute for Water and Environmental Systems Modeling
- Universität Stuttgart, Available: http://elib.uni-stuttgart.de/opus/volltexte/2012
/6831/
Dutta D., Herath S. & Musiake K., 2003. A mathematical model for flood loss
estimation. Journal of Hydrology, 277 (1-2), 24-49. doi: 10.1016/s0022-
1694(03)00084-2.
Literatures and References
Tran Thong Nhat 154
El-Omari S. & Moselhi O., 2008. Integrating 3D laser scanning and photogrammetry
for progress measurement of construction work. Automation in Construction, 18
(1), 1-9. doi: 10.1016/j.autcon.2008.05.006.
El-Rabbany A., 2002. Introduction to GPS The Global Positioning System, Artech
House: Boston, London.
ESRI (Environmental Systems Research Institute), 2004. Defining relationship classes.
ArcGIS 9: Building a Geodatabase. Redlands, 99-155.
ESRI (Environmental Systems Research Institute), 2011. How Feature To 3D By
Attribute (3D Analyst) works. ArcGIS 10 Help.
FC (FLOODsite Consortium), 2009. Flood risk assessment and flood risk
management; An introduction and guidance based on experiences and findings
of FLOODsite (an EU-funded Integrated project). In: Klijn F., Bruijn K. de ,
Ölfert A., et al. (eds.) 2 ed., Available:
http://www.floodsite.net/html/partner_area/project_docs/T29_09_01_Guidance_
Screen_Version_D29_1_v2_0_P02.pdf [Accessed July 31 2013].
Frank E., Ostan A., Coccato M. & Stelling G. S. 2001. Use of an integrated one
dimensional modelling approach for flood hazard and risk mapping. In: The
1st Conference on River Basin Management, Southampton. 99-108.
Gabet L., Giraudon G. & Renouard L., 1997. Automatic generation of high resolution
urban zone digital elevation models ISPRS Journal of Photogrammetry &
Remote Sensing, 52 (1), 33 - 47. doi: 10.1016/S0924-2716(96)00030-5.
Gehlot S. & Hanssen R. F., 2008. Monitoring and Interpretation of Urban Land
Subsidence Using Radar Interferometric Time Series and Multi-Source GIS
Database. In: Zlatanova S. & Nayak S. (eds.) Remote Sensing and GIS
Technologies for Monitoring and Prediction of Disasters. Springer: Berlin
Heidelberg, 137 - 148.
Gold C., 2005. Digital terrain modeling: Principles and Methodology, CRC Press:
Boca Raton.
Grewal M. S., Weill L. R. & Andrews A. P., 2007. Global Positioning Systems,
Inertial Navigation, and Integration, A John Wiley & Sons Inc.: New Jersey.
Literatures and References
Tran Thong Nhat 155
HCMCPC (Ho Chi Minh City's People Commitee). 2010. Natural conditions [Online].
Available: http://www.eng.hochiminhcity.gov.vn/eng/news/default.aspx?cat_id
=566 [Accessed 20 December 2010]. (Vietnamese).
HCMCPC (Ho Chi Minh City's People Commitee). 2011. Where is Ho Chi Minh City?
[Online]. Available: http://www.hochiminhcity.gov.vn/thongtinthanhpho/
gioithieu/Lists/Posts/Post.aspx?CategoryId=9&ItemID=5530&PublishedDate=2
011-07-01T01:10:00Z [Accessed June 23 2013]. (Vietnamese).
HCMCSO (Ho Chi Minh City Statistical Office), 2011. Statistical Yearbook,
Statistical Publishing House: Ho Chi Minh City.
Hervouet J. M., Hubert J.-L., Janin J.-M., Lepeintre F. & Peltier E., 1994. The
computation of free surface flows with TELEMAC. An example of evolution
towards hydroinformatics. Journal of Hydraulic Research, 32 (1), 45-64. doi:
10.1080/00221689409498804.
Hoa L. T. V., Nhan N. H., Wolanski E., Tran T. C. & Haruyama S., 2007. The
combined impact on the flooding in Vietnam's Mekong River delta of local
man-made structures, sea level rise, and dams upstream in the river catchment.
Estuarine, Coastal and Shelf Science, 71, 110-116.
Hoanh C. T., Phong N. D., Trung N. H., Dung L. C., Hien N. X., Ngoc N. V. & Tuong
T. P., 2012. Modeling to support land and water management: experiences from
the Mekong River Delta, Vietnam. Water International iFirst, 1 -19.
Horritt M., 2004. Development and testing of simple 2D finite volume model of sub-
critical shallow water flow. International Journal for Numerical Methods in
Fluids, 44 (11), 1231-1255. doi: 10.1002/fld.684.
Horritt M. S. & Bates P. D., 2001. Predicting floodplain inundation: Raster-based
modelling versus the finite-element approach,. Hydrological Processes, 15 (5),
825-842. doi: 10.1002/hyp.188.
Horritt M. S. & Bates P. D., 2002. Evaluation of 1D and 2D numerical models for
predicting river flood inundation. Journal of Hydrology 268 (1-4), 87-99.
Literatures and References
Tran Thong Nhat 156
Hunter N. M., 2005. Development and assessment of dynamic storage cell codes for
flood inundation modelling, School of Geographical Sciences, University of
Bristol: Bristol.
IPCC (Intergovernmental Panel on Climate Change), 2001. Climate Change 2001:
Synthesis Report. A Contribution of Working Groups I, II, and III to the Third
Assessment Report of the Integovernmental Panel on Climate Change. In:
Watson R.T. & the Core Writing Team (eds.). Press Cambridge University,
Cambridge, United Kingdom, and New York, NY, USA, 398 pp.
IPCC (Intergovernmental Panel on Climate Change), 2007. Climate Change 2007: The
Physical Science Basis. Contribution of Working Group I to the Fourth
Assessment Report of the Intergovernmental Panel on Climate Change. In:
Solomon S., Qin D., Manning M., et al. (eds.). Press Cambridge University,
Cambridge,United Kingdom, and New York, NY, USA, 996 pp.
JICA (Japan International Cooperation Agency), 2004. The study on urban transport
master plan and feasibility study in Ho Chi Minh metropolitan area
(HOUTRANS). Tokyo: ALMEC.
Johnson L. E., 2009. Geographic Information Systems in Water Sources Engineering,
CRC Press: Boca Raton London New York.
Lai P. C. & Mak A. S.H., 2007. GIS for Health and the Environment: Development in
the Asia-Pacific Region, In: Cartwright W., Gartner G., Meng L., et al. (eds.)
Lecture Notes in Geoinformation and Cartography, Springer: Berlin Heidelberg
New York.
Lai T. X. 2005. Comprehensive Approaches to Develop and Maintain
Drainage/Sewerage Systems in Urban Areas of Vietnam”, . In: Hands-on
Workshop on Sanitation and Wastewater Management ADB Headquarters, 19-
20 September 2005 Manila, Philipine.
Loi N. K., Dinh L. C. & Nhat T. T., 2008. Advanced of GIS, Agriculture Publishing
House: Ho Chi Minh City, (Vietnamese).
Longley P. A., Goodchild M. F. & Maguire D. J., 2005. Geographical Information
Systems and Science, John Wiley & Sons Inc.: Hoboken.
Literatures and References
Tran Thong Nhat 157
Maantay J., Maroko A. & Culp G., 2010. Using Geographic Information Science to
Estimate Vulnerable Urban Populations for Flood Hazard and Risk Assessment
in New York City. In: Showalter P. S. & Lu Y. (eds.) Geospatial Techniques in
Urban Hazard and Disaster Analysis. Springer: Dordrecht Heidelberg London
New York, 71-97. doi: 10.1007/978-90-481-2238-7_5.
Madhavan B. B., Wang C., Tanahashi H., Hirayu H., Niwa Y., Yamamoto K.,
Tachibana K. & Sasagawa T., 2006. A computer vision based approach for 3D
building modelling of airborne laser scanner DSM data. Computers,
Environment and Urban Systems, 30 (1), 54-77. doi:
10.1016/j.compenvurbsys.2005.01.001.
Marfai M. A. 2003. GIS Modelling of River and Tidal Flood Hazards in a Waterfront
City Case Study: Semarang City, Central Java, Indonesia. Master, Master
Thesis, International Institute For Geo-information Science and Earth
Observation Enschede, the Netherlands (ITC)
Merwade V., Cook A. & Coonrod J., 2008. GIS techniques for creating river terrain
models for hydrodynamic modeling and flood inundation mapping.
Environmental Modelling & Software, 23 (10-11), 1300-1311. doi:
10.1016/j.envsoft.2008.03.005.
MONRE (Ministry of Natural Resources and Environment). 2009. Climate change,
sea level rise scenarios in Vietnam. 'Retried from'
http://www.preventionweb.net/files/11348_ClimateChangeSeaLevelScenariosfo
rVi.pdf.
Mudelsee M., 2010. Climate Time Series Analysis: Classical Statistical and Bootstrap
Methods, In: Mysak L. A. & Hamilton K. (eds.) Atmospheric and
Oceanographic Sciences Library, Springer: Dordrecht Heidelberg London New
York, (English).
Nayak S. & Zlatanova S., 2008. Remote Sensing and GIS Technologies for Monitoring
and Prediction of Disasters, In: Allan R., Förstner U. & Salomons W. (eds.)
Environmental Science and Engineering, Springer: Berlin Heidelberg.
Nga N. V. 2006. The Ability to Exploit Groundwater and Land Subsidence Prediction
by Water Extraction in Ho Chi Minh City Southwest Region. Master, Master
Literatures and References
Tran Thong Nhat 158
Thesis, University of Social Sciences and Humanities Ho Chi Minh City.
(Vietnamese).
Nhan N. H. 2006. The Environment in Ho Chi Minh City Harbors. In: Wolanski E.,
ed. The Environment in Asia Pacific Harbours, Amsterdam. Springer
Netherlands, pp. 261-291.
Nhan N. H., Hoa L. T. V., Cong T. T. & Diep H. N., 2009. The Integrated model
HydroGis for modelling/predicting Flood and Mass Transport and its
Applications in River Deltas of Viet Nam Available:
http://www.typhooncommittee.org/TRCG%20portal/Documents/TCAR05/Chap
ter3/ChapterIII3.15TheIntegratedmodelHydroGisfor.pdf.
Nhat T. T. 2011. Land Use and Flood Risk of Buildings in Ho Chi Minh City. In:
Future Megacities in Balance” Young Researchers´ Symposium in Essen,
Essen.
Nhat T. T., 2012. Along Road Height Interpolation Based on Discrete Elevation
Points. Journal of Earth Science and Engineering, 2 (11), 691-695.
Nhat T. T. & Loi N. K. 2010. Urbanization and risk to houses in the resident areas in
Ho Chi Minh City under the medium emission scenarios of climate change. In:
National Conference on Applied GIS in 2010, Ho Chi Minh City.
(Vietnamese).
Nien N. A. 1996. KOD model for flood computation in Cuu Long river delta. In:
Conference on Flood Modeling in Cuu Long river delta, Ho Chi Minh City.
(Vietnamese).
NSWDOC-MHL (New South Wales Department of Commerce - Manly Hydraulics
Laboratory), 2006. Review and Assessment of Hydrologic/Hydraulic Flood
Models. Resources Department of Natural.
Oude-Elberink S. & Vosselman G., 2011. Quality analysis on 3D building models
reconstructed from airborne laser scanning data. ISPRS Journal of
Photogrammetry and Remote Sensing, 66 (2), 157-165. doi:
10.1016/j.isprsjprs.2010.09.009.
Literatures and References
Tran Thong Nhat 159
Pappenberger F., Frodsham K., Beven K., Romanowicz R. & Matgen P., 2007. Fuzzy
set approach to calibrating distributed flood inundation models using remote
sensing observations. Hydrology and Earth System Sciences, 11 (2), 739-752.
doi: 10.5194/hess-11-739-2007.
Parker R. N. & Asencio E. K., 2009. GIS and Spatial Analysis for the Social Sciences:
Coding, Mapping and Modeling, Routledge Taylor & Francis: New York,
Oxon.
Pavri F., 2010. Urban Expansion and Sea-Level Rise Related Flood Vulnerability for
Mumbai (Bombay), India Using Remotely Sensed Data. In: Showalter P. S. &
Lu Y. (eds.) GeoSpatial Techniques In Urban Hazard And Analysics. Springer:
Dordrecht Heidelberg London New York, 31-49.
Phi H. L. 2007. Climate change and urban flooding in Ho Chi Minh City. In:
Proceedings of the Third International Conference on Climate and Water, 3-6
September 2007 Helsinki, Finland. 194-199.
Phi H. L. 2009. Local climate change and Urban Flooding in Ho Chi Minh City.
[Online]. Ho Chi Minh City: Vietnam National University Ho Chi Minh City.
Available: http://dungdothi.files.wordpress.com/2010/11/holongphi.pdf
[Accessed July 31 2013]. (Vietnamese).
Phung N. K. & Working Project Team, 2011. Study to build an evaluable model of
climate change impacts to natural, human and social economy in Ho Chi Minh
City Ho Chi Minh City: Sub Institute of Hydrometeology and Environment of
South Viet Nam.
PMVG (Prime Ministry of Vietnamese Goverment). 1997. Decree No. 03/CP dated
01/06/1997 of the Government on the establishment of Thu Duc District,
District 2, District 7, District 9, District 12 and the establishment of wards in the
new district - Ho Chi Minh City.
PMVG (Prime Ministry of Vietnamese Government). 2003. Decree No. 130/2003/ND-
CP dated 11/06/2003 of the Government on the establishment of the Tan Binh,
Tan Phu and their Wards; adjust the administrative boundaries of wards in Tan
Binh District, established communes and towns in the Rural District Binh
Chanh, Rural District Can Gio and Rural District Hoc Mon, Ho Chi Minh city.

Literatures and References
Tran Thong Nhat 160
Pollefeys M., Koch R., Vergauwen M. & Van-Gool L., 2000. Automated
reconstruction of 3D scenes from sequences of images. ISPRS Journal of
Photogrammetry & Remote Sensing, 55 (4), 251 - 267.
Priestnall G., Jaafar J. & Duncan A., 2000. Extracting urban features from LiDAR
digital surface models. Computers, Environment and Urban Systems, 24 (2), 65-
78.
Proverbs D. G. & Soetanto R., 2004. Flood Damaged Property: A Guide to Repair,
Blackwell Publishing Ltd: Pondicherry, India.
Pu S., Rutzinger M., Vosselman G. & S. Oude E., 2011. Recognizing basic structures
from mobile laser scanning data for road inventory studies. ISPRS Journal of
Photogrammetry and Remote Sensing, 66 (6), S28-S39. doi:
10.1016/j.isprsjprs.2011.08.006.
Qi H. & Altinakar M. S., 2011. A GIS-based decision support system for integrated
flood management under uncertainty with two dimensional numerical
simulations. Environmental Modelling & Software, 26 (6), 817-821. doi:
10.1016/j.envsoft.2010.11.006.
Rossman L. A., 2009. Storm Water Management Model: User's Manual, National
Risk Management Research Laboratory, Office Of Research And Development,
U.S. Environmental Protection Agency: Cincinnati.
Samama N., 2008. Global Positioning: Techonolies and Performance, A John Wiley
& Sons, Inc., Publication: New Jersey.
Sanders B. F., 2007. Evaluation of on-line DEMs for flood inundation modeling.
Advances in Water Resources, 30 (8), 1831-1843.
Sarhadi A., Soltani S. & Modarres R., 2012. Probabilistic flood inundation mapping of
ungauged rivers: Linking GIS techniques and frequency analysis. Journal of
Hydrology, 458-459, 68-86. doi: 10.1016/j.jhydrol.2012.06.039.
SCFC (Steering Center of the urban flood control program Ho Chi Minh City). 2010.
Current situation and solution against urban flooding in Ho Chi Minh City. In:
Sustainable urban development, Ho Chi Minh City. Available:

Literatures and References
Tran Thong Nhat 161
http://www.hids.hochiminhcity.gov.vn/Hoithao/phattrienbenvung/TTchongngap
.pdf [Accessed 16 January 2011]. (Vietnamese).
SF (Structure Forum). 2007. Elevation of house foundation [Online]. Available:
http://www.ketcau.com/forum/archive/index.php?t-5655.html [Accessed 20 July
2012].
Shamsi U. M., 2005. GIS Applications for Water Wastewater and Stormwater
Systems, CRC Press: Boca Raton.
Sheimy N. El -, Valeo C. & Habib A., 2005. Digital Terrain Modeling Acquisition,
Manipulation, and Applications, Artech House, Inc.: Nordwood.
Showalter P. S. & Lu Y., 2010. GeoSpatial Techniques In Urban Hazard And
Analysics, In: Gatrell Jay D. & Jensen Ryan R. (eds.) Geotechnologies and the
Environment, Springer: Dordrecht Heidelberg London New York.
Sinnakaudan S. K. & Bakar S. H. A., 2005. Tight Coupling of SFlood and ArcView
GIS 3.2 for Flood Risk Analysis. In: Oosterom P., Zlatanova S. & Fendel E. M.
(eds.) Geo-information for Disaster Management. Springer: Berlin Heidelberg,
1413 - 1425.
Sourceforge.net. 2012. Freemat [Online]. Available: http://freemat.sourceforge.net/
[Accessed 28 July 2012].
Storch H. & Downes N. K., 2011. A scenario-based approach to assess Ho Chi Minh
City’s urban development strategies against the impact of climate change.
Cities, 28 (6), 517-526. doi: 10.1016/j.cities.2011.07.002.
Storch H., Downes N., Thinh N. X., Thamm H-P., Phi H. L., Thuc T., Thuan N. T. H.,
Emberger G., Goedecke M., Welsch J. & Schmidt M. 2009. Adaptation
Planning Framework to Climate Change for the Urban Area Of Ho Chi Minh
City, Vietnam. In: 5th Urban Research Symposium on Cities and Climate
Change: Responding to an Urgent Agenda, Marseille, France
Thai T. H., 2011. Assessment of climate change impacts on flooding in the
downstream of the Dong Nai River. VNU Journal of Science, Earth Sciences
[Online], 27. Available: http://tapchi.vnu.edu.vn/khtd_1_11/3.pdf [Accessed
July 30 2013].
Literatures and References
Tran Thong Nhat 162
Thang V. D. 2010. Source of urban flooding by offset between hydro-meteorology
science and drainage standards. In: Sustainable urban development, Ho Chi
Minh City, Viet Nam. Available: http://www.hids.hochiminhcity.gov.vn
/Hoithao/phattrienbenvung/vuducthang.pdf [Accessed 16 November 2010].
(Vietnamese).
Todini E., 1999. An operational decision support system for flood risk
mapping,forecasting and management. Urban Water Journal, 1, 131 - 143.
Townsend P. A. & Foster J. R., 2002. A synthetic aperture radar–based model to
assess historical changes in lowland floodplain hydroperiod. Water Resour.
Res., 38 (2), 1-10. doi: 10.1029/2001WR001046.
Trung L. V. 2009. Outline of the Waterlog and Flood Prevention Solutions in Ho Chi
Minh City In: 7th FIG Regional Conference Spatial Data Serving People: Land
Governance and the Environment – Building the Capacity 19-22 October 2009
Hanoi, Vietnam.
Trung L. V. & Dinh H. T. M. 2009. Monitoring Land Deformation Using Permanent
Scatterer INSAR Techniques (case study: Ho Chi Minh City). In: 7th FIG
Regional Conference on Spatial Data Serving People: Land Governance and the
Environment – Building the Capacity, Hanoi, Vietnam.
Usery E. L., Choi J. & Finn M. P., 2010. Modeling Sea-Level Rise and Surge in Low-
Lying Urban Areas Using Spatial Data, Geographic Information Systems, and
Animation Methods. In: Showalter P. S. & Lu Y. (eds.) GeoSpatial Techniques
In Urban Hazard And Analysics. Springer: Dordrecht Heidelberg London New
York, 11-29.
Van T. T., 2008. Urbanization and quality of urban environment from remote sensing
of impervious surfaces: case study in Ho Chi Minh City. Science & Technology
Development, 11 (4), 68-78.
Viet L. V. 2008. The urbanization and Climate Changes in Ho Chi Minh City. In: The
10th Conference of Res. Inst. of Hydrology and Environment, Ho Chi Minh
City. 369-375.
Literatures and References
Tran Thong Nhat 163
Vieux B. E., 2005. Distributed Hydrologic Modeling Using GIS, In: Singh V. P.,
Anderson M., Bengtsson L., et al. (eds.) Water Science and Technology Library,
Kluwer Academic Publishers: New York Dordrecht Boston London Moscow.
VNGov. (Vietnamese Government). 2008. Decision number 158/2008/QĐ-TTg
National Target Program to Respond to Climate Change dated 2 December
2008.
Vorogushyn S., Merz B., Lindenschmidt K.-E. & Apel H., 2010. A new methodology
for flood hazard assessment considering dike breaches. Water Resources
Research, 46 (8), W08541. doi: 10.1029/2009WR008475.
Wahr J., 1996. Geodesy and Gravity, Samizdat Press: Boulder.
WB (World Bank), 2007. The Impact of Sea Level Rise on Developing Countries: A
Comparative Analysis. In: Dasgupt S., Laplante B., Meisner C., et al. (eds.).
Development Research Group World Bank, 51. Available: http://www-
wds.worldbank.org/external/default/WDSContentServer/IW3P/IB/2007/02/09/0
00016406_20070209161430/Rendered/PDF/wps4136.pdf [Accessed 20
December 2010].
WB (World Bank), 2010. Climate Risks and Adaptation in Asian Coastal Megacities:
A Synthesis Report. The International Bank for Reconstruction and
Development, 97. Available: http://siteresources.worldbank.org
/EASTASIAPACIFICEXT/Resources/226300-1287600424406/coastal_
megacities_fullreport.pdf [Accessed 20 December 2010].
Werner M. G. F., 2000. Impact of Grid Size in GIS Based Flood Extent
Mapping Using a 1D Flow Model. Physics and Chemistry of the Earth, Part
B: Hydrology, Oceans and Atmosphere, 26 (7-8), 517 - 522. doi:
10.1016/S1464-1909(01)00043-0.
Werner M. G. F., 2004. A comparison of flood extent modelling approaches through
constraining uncertainties on gauge data. Hydrology and Earth System Sciences,
8 (6), 1141-1152.
Wikipedia. 2013. Ho Chi Minh City [Online]. Available:
https://vi.wikipedia.org/wiki/Th%C3%A0nh_ph%E1%BB%91_H%E1%BB%9
3_Ch%C3%AD_Minh [Accessed 23 June 2013].
Literatures and References
Tran Thong Nhat 164
Wilson C., Yagci O., Rauch H. & Olsen N., 2006. 3D numerical modelling of a willow
vegetated river/floodplain system. Journal of Hydrology, 327 (1-2), 13-21. doi:
10.1016/j.jhydrol.2005.11.027.
Wilson J. P. & Gallant J. C., 2000. Terrain Analysis: Principles and Applications,
Earth Sciences/Geography, John Willy & Sons: New York.
Yang B., Fang L. & Li J., 2013. Semi-automated extraction and delineation of 3D
roads of street scene from mobile laser scanning point clouds. ISPRS Journal of
Photogrammetry and Remote Sensing, 79, 80-93. doi:
10.1016/j.isprsjprs.2013.01.016.
Yoon J.-S., Sagong M., Lee J. S. & Lee K.-S., 2009. Feature extraction of a concrete
tunnel liner from 3D laser scanning data. NDT & E International, 42 (2), 97-
105. doi: 10.1016/j.ndteint.2008.10.001.
Zebedin L., Klaus A., Gruber-Geymayer B. & Karner K., 2006. Towards 3D map
generation from digital aerial images. ISPRS Journal of Photogrammetry and
Remote Sensing, 60 (6), 413-427. doi: 10.1016/j.isprsjprs.2006.06.005.
Zhaoli W., Hongliang M., Chengguang L. & Haijuan S., 2012. Set Pair Analysis
Model Based on GIS to Evaluation for Flood Damage Risk. Procedia
Engineering, 28, 196-201. doi: 10.1016/j.proeng.2012.01.705.
Zhou Q., Lees B. & Tang G. A., 2008. Advances in Digital Terrain Analysis, In:
Cartwright W., Gartner G., Meng L., et al. (eds.) Lecture Notes in
Geoinformation and Cartography, Springer: Berlin.
Zhou Q., Mikkelsen P. S., Halsnæs K. & Arnbjerg-Nielsen K., 2012. Framework for
economic pluvial flood risk assessment considering climate change effects and
adaptation benefits. Journal of Hydrology, 414-415, 539-549. doi:
10.1016/j.jhydrol.2011.11.031.