Embed Size (px)
Citation preview

Error! Use the Home tab to apply Überschrift 1 to the text that you want to appear here.
I
Improving bio-based succinate production with
Basfia succiniciproducens through evolutionary engineering
Dissertation
zur Erlangung des Grades
des Doktors der Ingenieurwissenschaften
der Naturwissenschaftlich-Technischen Fakultät III
Chemie, Pharmazie, Bio- und Werkstoffwissenschaften
der Universität des Saarlandes
von
René Stellmacher
Saarbrücken
05. Juni 2014

Error! Use the Home tab to apply Überschrift 1 to the text that you want to appear here.
II
Tag des Kolloquiums: 26. September 2014
Dekan: Prof. Dr. Volkhard Helms
Berichterstatter: Prof. Dr. Christoph Wittmann
Prof. Dr. Gert-Wieland Kohring
Vorsitz: Prof. Dr. Elmar Heinzle
Akad. Mitarbeiter: Dr. Björn Becker

Error! Use the Home tab to apply Überschrift 1 to the text that you want to appear here.
III
Publications
Partial results of this work have been published in advance under the authorization of the Department
of Mechanical Engineering of the Technischen Universität Braunschweig, Institute of Biochemical
Engineering, represented by Prof. Dr. C. Wittmann.
Peer-reviewed Journals
Becker, J., Reinefeld, J., Stellmacher, R., Schäfer, R., Lange, A., Meyer, H., Lalk, M., Zelder, O., von
Abendroth, G., Schröder, H., Haefner, S., Wittmann, C. (2013): Systems-wide analysis and
engineering of metabolic pathway fluxes in bio-succinate producing Basfia succiniciproducens.
Biotechnol. Bioeng. 110(11): 3013-23
Stellmacher, R., Hangebrauk, J., von Abendroth, G., Scholten, E., Wittmann, C. (2010). Fermentative
Herstellung von Bernsteinsäure mit Basfia succiniciproducens DD1 in Serumflaschen. Chem.-Ing.-
Tech. 82(8): 1223-29.
Conference contributions
Becker, J., Kind, S., Stellmacher, R., Wittmann, C.: Towards superior bio-processes – shaken
bioreactors in systems biotechnology. 1st European Congress of Applied Biotechnology,
September 25-29, 2011, Berlin, Germany.
Stellmacher, R., Hangebrauk, J., von Abendroth, G., Wittmann, C.: Bio-based production of succinic
acid by Basfia succiniciproducens DD1. Biotransformations 2011, August 22-25, 2011,
Bad Herrenalb, Germany.
Stellmacher, R., Hangebrauk, J., Schäfer, R., von Abendroth, G., Wittmann, C.: Bio-based production
of succinic acid by Basfia succiniciproducens DD1 – Systems metabolic engineering and bioprocess
development. Annual conference of the Association for General and Applied Microbiology, April 3-6,
Karlsruhe, Germany.
Hangebrauk, J.; Stellmacher, R., Fürch, T., von Abendroth, G., Schröder, H., Haefner, S., Wittmann,
C.: Biotechnological production of succinic acid. ProcessNet Conference, January 20-21, 2010,
Frankfurt on the Main, Germany.

Error! Use the Home tab to apply Überschrift 1 to the text that you want to appear here.
IV
Danke
„Was wir wissen, ist ein Tropfen; was wir nicht wissen, ein Ozean.“ – Isaac Newton
Besonders bedanken möchte ich mich bei Herrn Prof. Dr. Christoph Wittmann, der es mir ermöglichte,
diese Arbeit unter seiner Betreuung anzufertigen. Viele spannende fachliche Gespräche und
Diskussionen sowie nützliche Ratschläge haben meine wissenschaftliche Weiterentwicklung gefördert
und maßgeblich zur erfolgreichen Bearbeitung des Projektes beigetragen.
Herrn Prof. Dr. Elmar Heinzle und Herrn Prof. Dr. Gert-Wieland Kohring danke ich für das Interesse
an meiner Arbeit und für die Bereitschaft zur Übernahme des Prüfungsvorsitzes und der
Zweitbegutachtung.
„Nur mittels der Wissenschaften vom Leben kann die Beschaffenheit des Lebens von Grund auf
verändert werden.“ – Aldous Huxley
Dem Bundesministerium für Bildung und Forschung danke ich für die Förderung des Projektes im
Rahmen der Bioindustrie2021 – „Herstellung von Polyestern auf Basis fermentativ hergestellter
Bernsteinsäure bzw. 1,4-Butandiol“ (Nr. 0315238) in Kooperation mit der BASF SE. Der BASF SE
möchte ich zudem für die Fortführung der Zusammenarbeit im Rahmen einer Industriekooperation
danken. Mein Dank geht dabei an Dr. Gregory von Abendroth, Dr. Hartwig Schröder, Dr. Stefan
Häfner, Dr. Joanna-Martyna Krawczyk, Dr. Esther Dantas Costa, Dr. Marvin Schulz, Dr. Holger
Hartmann und Dr. Oskar Zelder für die vielen faszinierenden Gespräche und konstruktiven
Diskussionen während der Meetings in Braunschweig und Ludwigshafen. Bei Dr. Krawczyk möchte
ich mich insbesondere für die Bereitstellung von Stämmen und Plasmiden bedanken. Bei Dr. Schulz
und Dr. Hartmann bedanke ich mich für die Zusammenarbeit und vor allem für die Bearbeitung der
Genomdaten. Dr. von Abendroth und Dr. Dantas Costa danke ich für die Möglichkeit der
kurzweiligen, hochinteressanten Forschungsaufenthalte bei der BASF SE. In diesem Zusammenhang
bedanke ich mich auch bei Klaus, Oliver, Torsten, Julia und Samy für die freundliche und kooperative
Zusammenarbeit im Labor.
„Die Wissenschaft kennt kein Mitleid.“ – Romain Rolland
In diesem Sinne geht ein ganz besonders großer Dank an mein Ingenieurbüro – Gena und Jan, für die
Unterstützung, die Hilfsbereitschaft und das stets offene Ohr während unserer gemeinsamen Zeit im
Büro. Es hat mir immer viel Freude bereitet, mit euch Probleme und Themen, auch mal nicht
wissenschaftlicher Natur, zu diskutieren oder über die täglichen Herausforderungen des Labor- und
Versuchsalltags zu fachsimpeln – natürlich auch die erfolgreichen Momente mit euch zu teilen oder
einfach nur ein „paar“ Gummibärchen zu verdrücken.

Error! Use the Home tab to apply Überschrift 1 to the text that you want to appear here.
V
„Inmitten der Schwierigkeiten liegt die Möglichkeit.“ – Albert Einstein
Riesigen Dank auch an Jasper, Rudolf und den Rest des Basfia-Teams, für die vielen Ideen, die
gemeinsamen schweren und guten Zeiten und die „Basfia Challenge Meetings“. Genauso möchte ich
mich bei allen Spielmännern und Gaußsträßlern bedanken, für die phantastische Arbeitsatmosphäre im
Labor und die erfolgreiche Zeit, die wir zusammen hatten. Ein großes Dankeschön geht auch an alle
ehemaligen ibvt’ler, die mir zu guten Freunden geworden sind: Becky, Claudi, Franzi, CBo, Micha,
Tille, ….
„Alles Große in unserer Welt geschieht nur, weil jemand mehr tut, als er muss.“ – Hermann Gmeiner
Ich bedanke mich bei Dr. Rebekka Biedendieck vom Institut für Mikrobiologie für die großartige
Hilfe bei der Durchführung und Auswertung der Microarrays. Nelli Bill und Maike Sest vom Institut
für Biochemie, Biotechnologie und Bioinformatik danke ich für die Hilfe bei der Durchführung der
Biolog-Versuche.
„Studieren macht Vergnügen, bildet den Geist und erhöht die Fähigkeiten.“ – Sir Francis Bacon
Ich möchte allen meinen Studenten danken, die mich während meiner Arbeit mit unermüdlichem Fleiß
tatkräftig unterstützt haben: Sarah, Marco, Jörn, Felix, Mareike, Anja und Teresa.
„Der beste Weg, einen Freund zu haben, ist der, selbst einer zu sein.“ – Ralph Waldo Emerson
Vielen Dank auch an meine langjährigen Freunde und Kommilitonen Robert, Hobbit, Jojo und Stefan;
für die vielen extensiven Lernsessions während des Studiums, die Bond-Abende, die WG-Zeit und die
Super Bowl Nächte.
„Allein ist der Mensch ein unvollkommenes Ding; er muss einen zweiten finden, um glücklich zu
sein.“ – Blaise Pascal
[fillmoːls mɛrˈsiː] Steffi, du bist mir Inspiration, Antrieb und Rückhalt. Ohne dich würde diese Arbeit
nicht das sein, was sie ist. Ich danke dir für die phantastische Zeit während und neben der Arbeit, und
dafür, dass du immer für mich da bist.
„Reichen die Wurzeln tief, gedeihen die Zweige gut.“ (chinesisches Sprichwort)
Abschließend möchte ich den größten Dank meinen Eltern und Großeltern aussprechen. Ihr habt mich
bei allem unterstützt und habt immer viel Geduld bewiesen.

Error! Use the Home tab to apply Überschrift 1 to the text that you want to appear here.
VI
Table of contents
Summary ............................................................................................................................................... IX
Zusammenfassung .................................................................................................................................. X
1 Introduction ..................................................................................................................................... 1
2 Objectives ........................................................................................................................................ 2
3 Theoretical Background .................................................................................................................. 3
3.1 From amber to bio-succinic acid ............................................................................................. 3
3.2 Succinate production by Basfia succiniciproducens ............................................................... 7
3.2.1 Physiology and basic properties ...................................................................................... 7
3.2.2 Biochemistry of succinate synthesis ................................................................................ 8
3.2.3 Optimal production performance................................................................................... 10
3.3 Key criteria for successful industrial production of succinate............................................... 12
3.4 Towards superior succinate production strains ..................................................................... 13
3.4.1 Systems biotechnology approaches ............................................................................... 13
3.4.2 Metabolic engineering of succinate production strains ................................................. 15
3.5 Creating robust industrial phenotypes through evolutionary engineering ............................. 17
4 Material and Methods .................................................................................................................... 23
4.1 Chemicals .............................................................................................................................. 23
4.2 Growth media ........................................................................................................................ 23
4.2.1 Media for genetic engineering ....................................................................................... 23
4.2.2 Media for growth and succinate production .................................................................. 24
4.3 Genetic engineering ............................................................................................................... 27
4.3.1 Strains and plasmids ...................................................................................................... 27
4.3.2 Isolation of chromosomal DNA from B. succiniciproducens ....................................... 28
4.3.3 Polymerase chain reaction ............................................................................................. 29
4.3.4 Gel electrophoresis ........................................................................................................ 30
4.3.5 Construction of transformation vectors ......................................................................... 31
4.3.6 Transformation .............................................................................................................. 32
4.3.7 Plasmid DNA purification ............................................................................................. 33
4.4 Cultivation ............................................................................................................................. 34
4.4.1 Strain conservation ........................................................................................................ 34
4.4.2 Batch cultivation in serum bottles ................................................................................. 34
4.4.3 Sequential batch fermentation in serum bottles for evolutionary adaptation ................ 34

Error! Use the Home tab to apply Überschrift 1 to the text that you want to appear here.
VII
4.4.4 Sequential batch fermentation in small scale bioreactors for evolutionary adaptation . 35
4.4.5 Bioreactor cultivation .................................................................................................... 35
4.5 Analytical procedures ............................................................................................................ 36
4.5.1 Cell concentration .......................................................................................................... 36
4.5.2 Quantification of glucose .............................................................................................. 36
4.5.3 Quantification of organic acids ..................................................................................... 36
4.5.4 Quantification of intracellular amino acids ................................................................... 36
4.5.5 Analysis of mass isotopomers by GC/MS ..................................................................... 37
4.5.6 Genome sequencing of B. succiniciproducens strains ................................................... 38
4.5.7 Gene expression analysis ............................................................................................... 39
4.5.8 Metabolome analysis ..................................................................................................... 41
4.5.9 Enzyme activity assays .................................................................................................. 41
4.5.10 Metabolic flux analysis.................................................................................................. 42
4.5.11 Phenotypic microarray analysis ..................................................................................... 43
5 Results and Discussion .................................................................................................................. 44
5.1 Production performance and basic physiological properties of B. succiniciproducens ........ 44
5.2 Evolutionary adaptation of B. succiniciproducens DD3 towards high temperature ............. 50
5.2.1 Evolutionary adaptation towards a new temperature phenotype ................................... 50
5.2.2 Physiological characterization of evolutionary derived phenotypes ............................. 51
5.2.3 Metabolic pathway fluxes of B. succiniciproducens DD3-T2 ....................................... 54
5.2.4 Gene expression profile of the temperature tolerant mutant B. succiniciproducens
DD3-T2 ......................................................................................................................... 58
5.2.5 Genome sequencing reveals distinct mutations evolved during temperature adaptation
in B. succiniciproducens DD3-T2 ................................................................................. 61
5.3 Increasing succinate tolerance in B. succiniciproducens ....................................................... 63
5.3.1 Sequential batch adaptation of B. succiniciproducens DD3 towards high succinate
stress .............................................................................................................................. 63
5.3.2 Physiological characterization of B. succiniciproducens DD3-Suc1, DD3-Suc2 and
DD3-Suc3 adapted towards higher succinate levels ...................................................... 64
5.3.3 Metabolic pathway fluxes in the succinate-tolerant B. succiniciproducens strains DD3-
Suc2 and DD3-Suc3 ...................................................................................................... 66
5.3.4 Intracellular amino acid pools in succinate-tolerant B. succiniciproducens DD3-Suc3 71
5.3.5 Gene expression profile in succinate-adapted B. succiniciproducens DD3-Suc2 and
DD3-Suc3 ...................................................................................................................... 72
5.3.6 Identification of genomic mutations acquired in B. succiniciproducens DD1-Suc1,
DD3-Suc2 and DD3-Suc3 during evolutionary adaptation ........................................... 79
5.4 Evolutionary adaptation of B. succiniciproducens towards lower pH-values ....................... 82

Error! Use the Home tab to apply Überschrift 1 to the text that you want to appear here.
VIII
5.4.1 Adaptation of B. succiniciproducens towards pH 5.3 ................................................... 82
5.4.2 Physiology of the pH-tolerant strain B. succiniciproducens DD3-pH1 ........................ 83
5.4.3 Adaptation derived genetic modifications in DD3-pH1 ................................................ 84
5.5 Metabolic engineering of B. succiniciproducens exploiting targets identified from evolutionary
adaptation ................................................................................................................................. 85
5.5.1 Modification of the pyruvate node at the level of pyruvate kinase ............................... 85
5.5.2 Transcription machinery engineering of B. succiniciproducens through overexpression
of a mutated rpoC .......................................................................................................... 87
5.5.3 Engineering of cell envelope metabolism through a mutation in a sugar transferase ... 89
5.5.4 Improving cellular sedimentation by engineering cell envelope metabolism ............... 90
5.5.5 Metabolic engineering of lysine biosynthesis through expression of modified
diaminopimelate decarboxylase .................................................................................... 91
5.5.6 Metabolic engineering of by-product spectrum through expression of a modified
phosphate acetyltransferase ........................................................................................... 94
5.6 Succinate production of evolved strains in industrial glycerol medium ................................ 96
6 Conclusion and Outlook ................................................................................................................ 98
7 Abbreviations and Symbols ......................................................................................................... 100
8 References ................................................................................................................................... 103
9 Appendix ..................................................................................................................................... 112
9.1 Data related to 13
C metabolic flux analysis ......................................................................... 112
9.2 Gene expression analysis of evolved B. succiniciproducens phenotypes ........................... 117
9.3 Rational strain construction ................................................................................................. 119

Summary
IX
Summary
The contemporary public and economic awareness for sustainable and ecological technologies drive
the industrial development of superior biotechnological processes for bulk and fine chemicals.
Regarding top-value compounds within this context, production of bio-based succinate is a highly
anticipated industrial process due to its wide industrial applicability. In this work, naturally succinate
producing Basfia succiniciproducens was systematically evolved towards improved production and
tolerance properties. Small scale CO2-enriched sequential batch cultivations enabled for successful
adaptation, evaluated by cell growth and production performance. Evolved phenotypes exhibited
improved abilities to cope with the applied stress such as growing at 42 °C, at a pH of 5.2 and with
25 g L-1
succinate – conditions not feasible for the wild-type strain. In addition, they outperformed the
parent strain at standard conditions in respect to growth and succinate production reaching a maximum
productivity of 2.9 g L-1
h-1
. Systems biology approaches were then applied to identify the underlying
genotype-phenotype correlations. Most promising targets thereof were selectively introduced into
defined production hosts and demonstrated clear improvements regarding temperature tolerance,
productivity and cell separation. Taken together, this work is an important contribution to the breeding
of superior cell factories of B. succiniciproducens for bio-based succinate production.

Zusammenfassung
X
Zusammenfassung
Das öffentliche und wirtschaftliche Interesse an nachhaltigen, ökologischen Technologien ist Antrieb
für die Entwicklung innovativer biotechnologischer Prozesse für Bulk- und Feinchemikalien. Ein
Schwerpunkt liegt hier auf der biobasierten Herstellung von Succinat, einem Produkt mit vielfältigen
Anwendungsbereichen. In dieser Arbeit wurde Basfia succiniciproducens, ein natürlicher Succinat-
Produzent, zur Verbesserung der Produktions- und Toleranzeigenschaften systematisch adaptiert. Ein
sequentielles Kultivierungsverfahren unter CO2-Atmosphäre ermöglichte die erfolgreiche Adaption,
mit Zellwachstum und Produktivität als Indikatoren. Die generierten Phänotypen zeichneten sich
durch verbesserte Stresseigenschaften gegenüber erhöhter Temperatur und Produktkonzentration
sowie niedrigerem pH-Wert aus (42 °C, 25 g L-1
Succinat, pH 5.2) – Bedingungen, unter denen der
Wildtyp kein Wachstum aufweist. Zudem übertrafen Wachstums- und Produktionseigenschaften unter
Standardbedingungen die des Ausgangsstamms (Pmax = 2.9 g L-1
h-1
). Zur Identifizierung der
zugrundeliegenden Genotyp-Phänotyp Beziehungen wurden systembiologische Methoden
herangezogen. Erfolgsversprechende Targets wurden in definierte Produktionsstämme eingebracht und
führten zu signifikanter Verbesserung von Temperaturtoleranz, Produktivität und Zellseparation.
Diese Arbeit stellt somit einen wichtigen Schritt auf dem Weg zur Etablierung von
B. succiniciproducens als Zellfabrik für die biobasierte Succinatproduktion dar.

Introduction
1
1 Introduction
Nowadays, the global chemical industry is continuously challenged by decreasing oil reserves and
increasing public demand for green chemicals and additional products. These emerging ecological and
undeniably economic aspects triggered the concept of bioeconomy that comprises the development of
new and innovative biotechnological processes. The processes will then provide attractive alternatives
to common industrial routes by conversion of renewable resources to e.g. platform chemicals. Among
several petrochemically produced building blocks, succinate is described as a top value-added
chemical (Werpy and Peterson 2004) and attracted growing attention by various global players of the
chemical market in the last few years (Beauprez et al. 2010). It is projected that the succinate market
reaches about 250.000 tons by the year 2018 with a potential market value of $ 840 Mio.
(MarketsandMarkets 2012; Transparency Market Research 2013). These numbers can be easily
explained by the myriad of applications of succinate. Sustainably produced commodity chemicals like
1,4-butandiol or tetrahydrofuran or various specialty and fine chemicals promote this high demand in
the chemical industry sector. A combination of succinate with biotechnologically produced diamines
can be applied to synthesize commercially profitable bio-based polymers (Kind and Wittmann 2011).
Further application fields comprise the pharmaceutical, neutraceutical and agrochemical industry
sector (McKinlay et al. 2007). From a metabolic viewpoint, succinate is a ubiquitous intermediate in
almost all organisms. In this line, genetic engineering of well-known platform organisms seemed
encouraging. However, naturally succinate producing microorganisms were isolated throughout the
last two decades (Guettler et al. 1999; Lee et al. 2002; Scholten and Dägele 2008) and currently
represent the most auspicious production hosts. Among them, Basfia succiniciproducens shows
promising features in terms of a future bioprocess application (Scholten and Dägele 2008; Scholten et
al. 2009; Stellmacher et al. 2010).
Establishing a competitive bioprocess for succinate production is obviously linked to key challenges
regarding a successful implementation into the industrial landscape. The most challenging features
comprise the overall productivity of a production host, its ability to convert supplemented carbon
sources to the desired product with high titers and the specific yield in doing so (Werpy and Peterson
2004; Patel et al. 2006) as well as its robustness concerning the bioprocess. Most of these goals can be
achieved using widely applied metabolic engineering strategies. However, an integral process
consideration also recommends the contemplation of further microbial physiology associated
characteristics. The applied fermentation plants are mostly running semi-sterile, which increases the
contamination risk. High substrate and product titers demand for strong tolerances. Some up- or
downstream processes require presettings to enable economic feasibility. In this line, evolutionary
adaptation represents a promising approach regarding tolerance and performance improvements.

Objectives
2
2 Objectives
The present work aimed for the generation of B. succiniciproducens phenotypes, featuring optimized
characteristics regarding their tolerance against fermentation associated perturbance, i.e. high
temperature, high succinate levels and low pH and their overall production performance. For this
purpose, evolutionary adaptation should be used to gain evolved phenotypes. In this line, strain
specific physiologic limitations served as starting points. Initially, the double mutant
B. succiniciproducens DD3 was chosen as starting strain. It harbors deletions of the genes ldh and
pflD, i.e. the pathways for lactate and formate production, respectively. This yields a minimized
degree of freedom on which the strain could adapt evolutionary. State-of-the-art systems biology tools,
combined with sophisticated cultivation experiments should be applied to shed some light into the
metabolic response regarding the adaptation approaches. Obtained phenotype profiles, consisting of
fluxomics, transcriptomics and genomics should help to identify promising targets for rational strain
improvement. The final objective was the implementation of identified targets into production strains
and to validate their contribution to observed tolerance and performance improvements of the adapted
strains. Additionally, this work should provide a promising starting point, based on the establishment
of evolutionary adaptation as valid tool in industrial strain development and encourage further
approaches to achieve sustainable and competitive bioprocesses in context with the bioeconomy.

Theoretical Background
3
3 Theoretical Background
3.1 From amber to bio-succinic acid
Succinic acid, a well-known chemical that was already described in the 16th century when it was
obtained from amber (Agricola 1955), is a four carbon dicarboxylic acid, systematically denoted as
butanedioic acid. Throughout the past centuries, the compound was extensively used in medical
treatment for joint pain, arthritic symptoms or teething (Amber Artisans 2013; Markman 2009).
Nowadays it is known to represent a ubiquitous substance in the metabolism of almost all living
organisms, where it serves as intermediate in cellular processes or as metabolic end-product of
fermentative growth. Beyond its widespread biochemical occurrence, succinic acid has received
increasing interest during the last decades by ranking it as “Top 12 Candidate” for high value added
chemicals from biomass (Werpy and Peterson 2004). So far it was preferably used for food and
pharmaceutical applications (Hayes et al. 2006; USDA 2009; Transparency Market Research 2013).
For these purposes, petrochemical based processes provided 15.000 tons of succinic acid per year (Lee
et al. 2005). The primary production route involves catalytic hydrogenation of maleic acid, a derivate
of maleic anhydride, which is obtained during the oxidation of butane, a cracking product of fossil oil
(Patel et al. 2006; Bechthold et al. 2008). However, this dependency on ultimate fossil resources
shortens the succinic acid production volume by directly coupling it to increasing oil prices thus
limiting the opportunities for further industrial application. Alternatively, succinic acid can be
produced by microbial fermentation employing renewable feedstocks while fixing external carbon
dioxide. This meets the growing demand for ecological substitutes of chemicals or building blocks and
the development of a clean and efficient industry regarding the progressing climate change. Lately,
these ecologic and undoubtedly economic concerns have raised global companies interest in a
competitive succinic acid bioprocess based on stable feedstock costs and optimal availability, efficient
succinic acid recovery and purification and process optimized microorganisms (Bastidon 2012). The
accomplishment of these key challenges will boost the economic viability of bio-succinic acid as a
mainstay of the biorefinery concept and points out the major driving force for upvaluing the
introduction of a sustainable bio-succinic acid market. In this line, bio-succinic acid’s rising popularity
has tremendously increased the potential of its market position accompanied by an excellent and
innovative portfolio of renewable and sustainable products (Tweel 2010).

Theoretical Background
4
Figure 3.1 Application routes for bio-based succinic acid and its respective derivatives in various industrial sectors.
Current reports predict a market value of about $ 840 Mio by 2018, linked to a strong growth rate of
19 % reaching an annual market volume of 250,000 tons per year until 2018 (MarketsandMarkets
2012; Transparency Market Research 2013). This is particularly driven by the various possible
applications of succinic acid in the chemical sector. Obviously, the compound displays a versatile C4
building block with outstanding industrial potential (Figure 3.1) due to its molecular character as a
dicarboxylic acid. It might partly replace maleic anhydride with a total market share of 210,000 tons
per year (Sauer et al. 2008) or maleic acid which is constantly increasing in both, demand and price
(Cukalovic and Stevens 2008). In this line, succinic acid can serve as precursor for different
commodity and specialty chemicals. Among them, 1,4-butanediol and its derivatives tetrahydrofuran
or γ-butyrolacton cover a cumulated market volume of about 500,000 tons. Their application fields
include the production of polyurethane, polyesters, adhesives, or coating resins (Paster et al. 2004;
Müller 2005). They are further used as raw materials for pharmaceuticals and as components of
herbicides and rubber additives (Cukalovic and Stevens 2008). Synthesis of the derivative N-methyl-
2-pyrrolidone could further extend possible applications of succinic acid towards chemical synthesis
and process solvents, with additional application in the pharmaceutical industry. Adipic acid,
synthesized with succinic acid as ligand in combination with hydrogen peroxide or from 1,4-
butanediol by carbonylation could facilitate the access to a polymer market for e.g. PA 6.6 (nylon)
with a production volume of about 900,000 tons (Paster et al. 2004). Furthermore, succinic acid is an
alternative monomer for the bio-polymer chemistry, e.g. for bio-based polyamides like PA 5.4 (Kind
and Wittmann 2011) that involve an annual production volume of 3.5 Mio tons (Becker et al. 2012) or

Theoretical Background
5
for polyesters like polyethylene succinate (PES) or polybutylene succinate (PBS) (Fujimaki 1998;
Oishi et al. 2006). Regarding these refining products, succinic acid’s economic feasibility additionally
depends on optimization and innovation of chemical engineering approaches to competitively
synthesize the above mentioned compounds from fermentation derived succinic acid. However, its
acid residue anion succinate, which represents the physiologically occurring variant and will thus be
used as term instead of succinic acid throughout the following chapters, can also be applied as salt and
contribute to the application in the fields of pharmacology, toxicology and for medical purposes as
well as in the food industry sector as pH-modifier, flavoring or antimicrobial agent (Cukalovic and
Stevens 2008).
Table 3.1 List of bio-succinate joint-ventures formed in the last years, the respectively applied strain and estimated
production volumes for future bio-based succinate production.
Strategic alliance Year Microorganism Product volume
BioAmber / Mitsubishi Chemicals (in JV with
Ajinomoto since 2006)
2008 Yeast biocatalyst (BioAmber) /
B. flavum or C. glutamicum
(Mitsubishi Chemicals)
34,000 tons per year
(Canada) / 65,000 tons
per year (Thailand)
Succinity (BASF SE and Corbion Purac) 2009 B. succiniciproducens 50,000 tons per year
(Spain)
Myriant / ThyssenKrupp Uhde & Showa Denko 2009 E. coli 77,000 tons per year
(US)
Reverdia (Royale D.S.M & Roquettes) 2010 Yeast biocatalyst 30,000 tons per year
(Italy)
Information according to Ajinomoto 2007; Beauprez et al. 2010; BioAmber 2011; BASF SE and CSM 2012; Bastidon 2012;
Jansen et al. 2012; Myriant 2013a; Myriant 2013b; Roquette 2013
The brilliant properties have meanwhile driven the formation of different industry joint ventures
(Table 3.1). These collaborations comprise prestigious global companies (Beauprez et al. 2010).
Apparently, these strategic alliances aim at innovative and commercially competitive bioprocesses
based on renewable feedstocks. For successful industrial scale production several benchmarks have to
be reached. The key criteria involve a minimal productivity of 2.5 g L-1
h-1
, minimal nutrient supply
combined with cheap substrates and high titers of 50 – 100 g L-1
(Werpy and Peterson 2004; Warnecke
and Gill 2005). In particular, tailored production strains are needed that efficiently convert the raw
material into succinate in a robust and reproducible process. Different microorganisms have been
considered over the last years as potential succinate producers. Two strategies seemed most promising.
First, bacteria from animal rumen such as B. succiniciproducens, M. succiniciproducens or
A. succinogenes (Guettler et al. 1999; Lee et al. 2002; Scholten and Dägele 2008) have a high natural
potential to synthesize succinate. On the other hand, recombinant strains of industrial well-known cell
factories like E. coli, C. glutamicum or S. cerevisae can be built on excellent knowledge and synthetic
biology methods for cellular engineering (Okino et al. 2008; Beauprez et al. 2010; Otero et al. 2013).

Theoretical Background
6
Table 3.2 Potential industrial hosts for bio-based succinate production.
Strain Production host specific characteristics
Escherichia coli Physiology Facultative anaerobic, Gram-negative, rod-shaped, mesophile
Genome Completely sequenced; 4.6 Mb (Blattner et al. 1997)
Advantages Short doubling time
Wide substrate variety and well-studied nutrition requirements
Fully established engineering tool-box
Disadvantages No natural producer (typically low anaerobic yields)
Catabolite repression and strong regulation patterns
PTS mediated substrate uptake
Corynebacterium
glutamicum
Physiology Aerobic, Gram-positive, pleomorphic, mesophile
Genome Completely sequenced; 3.3 Mb (Kalinowski et al. 2003)
Advantages GRAS-status
Broad industrial feasibility
Fully established engineering tool-box
Disadvantages No natural producer (biotransformation of succinate under oxygen
deprivation (Okino et al. 2005; Inui et al. 2007))
Saccharomyces
cerevisiae
Physiology Eukaryotic, aerobic, round to ovoid cells, reproduction via budding,
mesophile
Genome Completely sequenced; 12.2 Mb
Advantages GRAS-status
High product tolerances
Wide pH operation range
Well-established engineering tool-box
Disadvantages No natural producer
Lacking growth on pentose sugars (Hong and Nielsen 2012)
Compartmented synthesis pathway
Actinobacillus
succinogenes
Physiology Facultative anaerobic, Gram-negative, pleomorphic, mesophile,
capnophilic
Genome Completely sequenced; 2.3 Mb (McKinlay et al. 2010)
Advantages Natural producer of high succinate titers,
PEP-carboxykinase mediated carbon dioxide fixation,
Disadvantages Auxotrophies for glutamate, cysteine and methionine
Missing engineering tools
No complete TCA cycle
Mannheimia
succiniciproducens
Physiology Facultative anaerobic, Gram-negative, pleomorphic, mesophile,
capnophilic
Genome Completely sequenced; 2.3 Mb (Hong et al. 2004)
Advantages Natural producer of high succinate titers
PEP-carboxykinase mediated carbon dioxide fixation
Ferments wide variety of substrates and hydrolysates
Specifically developed engineering tools
Disadvantages Pyrimidine auxotrophy
Missing links in vitamin pathways and in methionine and cysteine pathway
Basfia
succiniciproducens
Physiology Facultative anaerobic, Gram-negative, pleomorphic, mesophile,
capnophilic
Genome Partially sequenced (Kuhnert et al. 2010)
Advantages Natural producer of high succinate titers
PEP-carboxykinase mediated carbon dioxide fixation
Ferments wide variety of substrates and hydrolysates, e.g. glycerol
No Auxotrophies
Disadvantages Poor availability of genetic tool knowledge
Theoretical Background
7
3.2 Succinate production by Basfia succiniciproducens
3.2.1 Physiology and basic properties
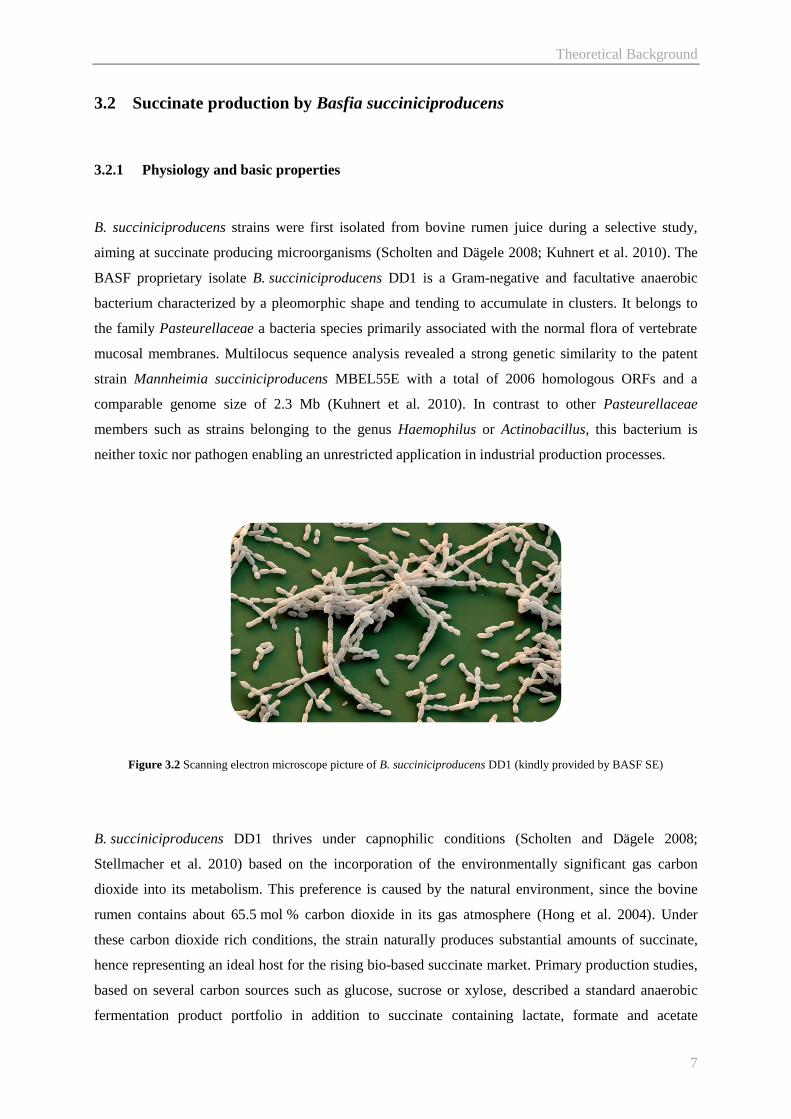
B. succiniciproducens strains were first isolated from bovine rumen juice during a selective study,
aiming at succinate producing microorganisms (Scholten and Dägele 2008; Kuhnert et al. 2010). The
BASF proprietary isolate B. succiniciproducens DD1 is a Gram-negative and facultative anaerobic
bacterium characterized by a pleomorphic shape and tending to accumulate in clusters. It belongs to
the family Pasteurellaceae a bacteria species primarily associated with the normal flora of vertebrate
mucosal membranes. Multilocus sequence analysis revealed a strong genetic similarity to the patent
strain Mannheimia succiniciproducens MBEL55E with a total of 2006 homologous ORFs and a
comparable genome size of 2.3 Mb (Kuhnert et al. 2010). In contrast to other Pasteurellaceae
members such as strains belonging to the genus Haemophilus or Actinobacillus, this bacterium is
neither toxic nor pathogen enabling an unrestricted application in industrial production processes.
Figure 3.2 Scanning electron microscope picture of B. succiniciproducens DD1 (kindly provided by BASF SE)
B. succiniciproducens DD1 thrives under capnophilic conditions (Scholten and Dägele 2008;
Stellmacher et al. 2010) based on the incorporation of the environmentally significant gas carbon
dioxide into its metabolism. This preference is caused by the natural environment, since the bovine
rumen contains about 65.5 mol % carbon dioxide in its gas atmosphere (Hong et al. 2004). Under
these carbon dioxide rich conditions, the strain naturally produces substantial amounts of succinate,
hence representing an ideal host for the rising bio-based succinate market. Primary production studies,
based on several carbon sources such as glucose, sucrose or xylose, described a standard anaerobic
fermentation product portfolio in addition to succinate containing lactate, formate and acetate

Theoretical Background
8
(Scholten and Dägele 2008) without production of gas (Kuhnert et al. 2010). Further approaches using
crude glycerol as carbon source in continuously driven cultivations described highly anticipated yields
(Scholten et al. 2009). This broad substrate utilization emphasizes the promising applicability of this
strain in industrial production processes.
3.2.2 Biochemistry of succinate synthesis
The biosynthesis of succinate is a biological widespread process as the compound is an intermediate of
the tricarboxylic acid (TCA) cycle, an almost ubiquitous pathway to provide cellular energy and
building blocks. Succinate can generally be formed by three pathways, the oxidative branch and the
reductive one, respectively and via the glyoxylate shunt. Under aerobic conditions succinate appears as
intermediate of the oxidative TCA cycle and supplies electrons for the oxidative phosphorylation or
regenerates the oxaloacetate pool (Cox et al. 2006) with a theoretical stoichiometric maximum yield of
1 mol succinate per mol glucose. Typically, it is not secreted in the medium to maintain cyclic
operation of this pathway. Alternatively, succinate derives from the glyoxylate shunt by the cleavage
of isocitrate to succinate and glyoxylate while by-passing decarboxylation steps (Raab et al. 2010).
This pathway mainly serves to support growth on carbon two substrates and is found in different
bacteria and in yeasts. In natural succinate producers the anaerobic pathway is favored while fumarate
acts as final electron acceptor. This fermentative growth leads to substantial succinate release, thus
exhibiting a tremendous potential to produce succinate.
Based on glucose, B. succiniciproducens predominantly runs the glycolytic pathway to convert the
substrate to cellular building blocks and energy. However, some carbon is metabolized through the
pentose phosphate pathway to serve for anabolic precursors while recycling excess carbon back into
glycolysis (Becker et al. 2013). At the pyruvate node, supplied carbon is distributed towards the
reductive TCA cycle by carboxylation of phosphoenolpyruvate (PEP). Obviously, it represents an
integral part of the succinate synthesis by delivering required precursors. When supplemented with
carbon dioxide the carboxylation is optimally driven by PEP carboxykinase as observed with other
natural succinate producers (Van der Werf et al. 1997; Lee et al. 2006) and directly coupled to ATP
formation. Additionally, this reaction affects the carbon flux towards pyruvate itself as secreted by-
product or as precursor for other mixed fermentation by-products. Acetate and formate production
particularly occurs synchronized as they both derive from formate C-acteyltransferase activity and
growth coupled, while lactate accumulates during stationary phase (Stellmacher et al. 2010). This
behavior can be presumably explained by growth associated gene expression and protein abundance
(Lee et al. 2006) and unveils a high metabolic flexibility of B. succiniciproducens regarding the
reallocation of carbon depending on the metabolic state of the cell. The TCA cycle is operated in a
separated, bifurcated manner.

Theoretical Background
9
Figure 3.3 Overview of B. succiniciproducens carbon core metabolism involving glycolysis, pentose phosphate pathway,
pyruvate node and TCA cycle. Glucose uptake is performed by (1) glucokinase. The enzymes coping with succinate
precursor demand via glycolysis are (2) glucose-6-phosphate isomerase, (3) phosphofructokinase, (4) fructose-bisphosphate
aldolase, (5) triosephosphate isomerase, (6) glyceraldehyde-3-phosphate dehydrogenase, (7) phosphoglycerate kinase, (8)
phosphoglycerate mutase and (9) pyruvate kinase. At the pyruvate node, mixed fermentation products are generated via (10)
lactate dehydrogenase, (11) formate C-actetyltransferase and (12) pyruvate dehydrogenase. Additionally, lactate can derive
from (27) methylglyoxal pathway. Acetyl-CoA serves as precursor for the TCA cycle by its integration through (13) citrate
synthase and for acetate and ethanol formation via (14) phosphate acetyltransferase, (15) acetate kinase and (16), (17) alcohol
dehydrogenase, respectively. The oxidative TCA branch is further conducted by (18) aconitase, (19) isocitrate
dehydrogenase, (20) 2-oxoglutarate dehydrogenase complex and (21) succinyl-CoA synthetase. Anaerobic succinate
synthesis is primarily facilitated through (22) phosphoenolpyruvate carboxykinase, with (23) phosphoenolpyruvate
carboxylase, and (24) malate dydrogenase, (25) fumarate hydratase and (26) fumarate reductase.

Theoretical Background
10
The reductive branch is exclusively used to synthesize succinate, while the oxidative part revealed
only low utilization in B. succiniciproducens strains (Becker et al. 2013). Considering the redox
balance and cofactor management of succinate synthesis, generation of succinate requires 2 molecules
of reductants. In general NADH supply exceeds NADH consumption, while the Pasteurellaceae genus
seems to struggle with sufficient NAPDH supply. Apparently, this likely suggest additional NADPH
sources in B. succiniciproducens (Becker et al. 2013) as documented for A. succinogenes that employs
a transhydrogenase or the malic enzyme, closing this gap in redox balancing (McKinlay et al. 2007).
Unfortunately, the malic enzyme withdraws carbon from the reductive TCA branch and formed
pyruvate is usually not converted back to oxaloacetate. The observed excess in ATP production is
addressed to cellular maintenance and transport processes (McKinlay et al. 2007; Becker et al. 2013).
3.2.3 Optimal production performance
The primary desired feature of an industrial host is the efficient conversion of substrate to product.
Therefore, the natural, in general non-optimal distribution of applied substrates throughout the
metabolism can be externally affected by introduction of heterologous pathways or targeted regulation
of cellular metabolic routes. Nevertheless, it is inevitable to gain information on these routes and their
corresponding fluxes. Elementary flux mode analysis was used to search probable succinate producing
phenotypes with a distinctive ratio of succinate production and biomass formation based on glucose
(Becker et al. 2013). Applying a flux balance approach the phenotype with optimal succinate yield
showed the ideal carbon distribution for succinate production, while rejecting any by-product or
biomass formation (Figure 3.4). Obviously, the complete glucose is metabolized through glycolysis
generating 2 mols PEP per mol glucose. At the pyruvate node, optimal flux distribution for succinate
production revealed a branched TCA whereas 86 % of the carbon is carboxylated and subsequently
used in the reductive TCA cycle. The rest is applied in the oxidative TCA cycle via pyruvate
dehydrogenase and citrate synthase to generate sufficient NADH for running the reductive part. This is
essential, since glycolysis produces 1 NADH per PEP, but reduction of OAA towards succinate
requires 2 NADH. A maximal theoretical succinate yield of 1.71 mol per mol glucose under carbon
dioxide atmosphere recommends the consideration of this network for innovative optimization
approaches by e.g. metabolic engineering. Furthermore, the combination with additional reducing
power such as hydrogen can yield 2 mol succinate per mol glucose (McKinlay et al. 2007).

Theoretical Background
11
Figure 3.4 Metabolic fluxes of B. succiniciproducens for optimum succinate production by elementary flux mode analysis,
based on a network model, containing all reactions for succinate production (Melzer et al. 2009; Becker et al. 2013). The
fluxes are given as relative molar fluxes to the glucose uptake.

Theoretical Background
12
3.3 Key criteria for successful industrial production of succinate
Recent years upgraded the concept of biorefinery to become a mainstay of the future industrial
landscape, considering valuable and innovative green products as substitutes for currently
petrochemically derived compounds. The concept is similar to the traditional petroleum refinery,
except its objective to convert biomass feedstocks into a myriad of applicable and industrial
competitive products (Paster et al. 2004; Sauer et al. 2008; Cherubini 2010). This approach is
forwarded to stepwise replace the global economy by a sustainable bioeconomy with bio-based
products as one backbone among others. However, several key criteria have to be fulfilled to obtain an
industrial platform for bio-based production processes, reaching competitive price margins. Succinate
was reported with a selling price between $ 6 and 9 per kg and with production costs of about $ 1.1 per
kg which have to be further reduced to $ 0.55 per kg in the future (Patel et al. 2006; Song and Lee
2006). This financial aspect has to be considered in terms of upstream and downstream sections as
well as the fermentation part itself. Regarding the complete bioprocess costs, upstream processing
covers 40 % of the overall succinate production costs, based on a raw sugar price of $ 0.40 per kg in
2013 (USDA), and desired succinate yields of about 90 %. Since downstream processes generally
accounts for 50 % of the process costs, due to insufficient high product titers, complex mixtures of cell
material and chemicals in the broth and desired final product purity (Wisbiorefine; Cheng et al. 2012),
fermentation contributes to approximately 10 %. However, these three steps are closely intertwined
(Figure 3.5), since substrate application specifies fermentation performance and subsequent recovery
processes. The fermentation part affects both upstream and downstream processing by nutrition
requirements of employed microorganisms and their respective product – by-product portfolio.
Additionally, recovery strategies influence fermentation development, e.g. yield and productivity and
the complexity of unit-operations (van Hoek et al. 2003). In this line, the effective cost allocation to
each step is directly linked to decisions made for the other two process parts and represents major
elements for improving the competitiveness of a bioprocess. Microbial hosts exhibit substrate
preferences, limited tolerances towards components resulting from substrate pretreatment or need
essential additives for cellular growth. Thus, low-cost media must be developed, preferably based on
inexpensive raw material such as glycerol or lignocellulose hydrolysate. The fermentation process
must feature high product yields and titers of above 100 g L-1
combined with efficient productivities of
at least 2.5 g L-1
h-1
, while by-product formation must be kept to a minimum (Werpy and Peterson
2004; Patel et al. 2006). Efficient succinate recovery strategies have to be installed in an integrated
bioprocess (Kurzrock and Weuster-Botz 2010; Cheng et al. 2012). Therefore, low pH fermentation
will be advantageous considering cost savings for e.g. acidifying agents that are necessary for succinic
acid recovery.

Theoretical Background
13
Figure 3.5 Schematic bioprocess model, considering the key criteria as dependencies and interactions between the
fermentation and the pre- and post-fermentative phases. Dashed lines and respective arrows indicate prerequisites between
the process parts.
3.4 Towards superior succinate production strains
3.4.1 Systems biotechnology approaches
Recently, industrial biotechnology broadened the field of study concerning optimization of bio-based
production towards a holistic approach involving several biological disciplines. The generation of
propitious cell factories is directly linked to evolving targets, unraveled by techniques like genomics
(DNA), transcriptomics (RNA), proteomics (proteins), metabolomics and fluxomics (metabolites)
(Kohlstedt et al. 2010), and phenomics (phenotype) (Bochner 2009). For optimization purposes
regarding industrial aspects, it is not necessary to examine all levels of the omics-family to reveal
beneficial modifications. Nevertheless, it can be helpful to combine various omics-techniques to draw
a more accurate picture of the phenotype and its underlying interactions among functional layers.

Theoretical Background
14
In case of succinate production optimization, only few approaches combined two or more techniques.
Most studies were built on in silico or in vitro tracking of carbon metabolism, accompanied by
metabolic engineering of relevant targets to redistribute the carbon flux towards succinate (Lee et al.
2006; McKinlay et al. 2007; McKinlay and Vieille 2008; Becker et al. 2013). The underlying networks
obviously derived from genome knowledge and annotations. This genomics tool is essential for the
understanding of the nuts and bolts of the observed production phenotypic. By analysis of sequenced
genomes, targets could be identified, that would contribute to an optimized phenotype by their
amplification, deletion or introduction.
One level above, the adjustment of cellular metabolite synthesis and distribution can be mediated by
two underlying regulatory mechanisms. On the one on hand, cells can probably switch on proteins or
rather specify their activation state to direct fluxes towards desired metabolites. In this case, fluxes
change according to varied conditions or modification implementation while gene expression patterns
remain the same. The second option includes the fine tuning of RNA transcripts that has to be
recruited for flux adjustment. Custom-made DNA microarray based gene expression analysis provides
the possibility to gain a global view on the gene expression pattern of microorganisms. Thereby,
different strains can be screened for global regulatory responses on various implemented genetic
modifications. Furthermore, transcriptomic changes can be revealed under various conditions, e.g.
high or low temperature. It is thus possible to unravel hindering metabolic bottlenecks that are mainly
caused by non-optimal expression profiles of specific genes. On the other hand, modification based
specific expression responses can be concluded from these datasets. A further approach allows for
elucidation of gene expression concerning their participation in functional groups. This gene set
enrichment analysis shows transcriptional responses according to several clustered genesets that share
common biological function (Subramanian et al. 2005).
Metabolite fluxes represent the level above transcriptomics and proteomics and thus define the cellular
metabolite state. The technique to visualize these fluxes, metabolic flux analysis (MFA), is a vital and
widespread applied method throughout the industry related biotechnological landscape. MFA,
combining an experimental part applying 13
C-carbon sources and a computational part with a genome-
scale molecular network (Wittmann 2007), serves to gain information on metabolic turnover rates. The
quantification of intracellular fluxes is realized by tracing the 13
C-carbon distribution throughout the
network. It thus allows for the design of industrial valuable production hosts by pin-pointing specific
targets like bottlenecks that cannot be clearly determined by phenotype observations. Successful
industrial application of MFA was widely documented throughout recent literature, whereas a product
spectrum was covered including relevant industrial products like amino acid, organic acids, vitamins,
ethanol and antibiotics (Iwatani et al. 2008; Feng et al. 2010; Kohlstedt et al. 2010).
Cellular phenotypes are the most comprehensive features of microorganisms, since their biochemical
and physiological properties are easily observable and the phenotype consequently results from gene
expression and environmental influences. The recently described method of phenotypic microarray

Theoretical Background
15
analysis allows for specific phenotypic characterization of microorganisms with the aid of phenotypic
microarrays (Bochner 2009). Based on the understanding of bacterial characterization through simple
growth assays this approach is justified to describe various phenotypic alterations. Every
microorganism is specially adapted towards its niche. Thus, the pattern of nutrient consumption or
toxicity tolerance, based on this niche, varies between and defines them. Another interesting aspect in
case of optimization approaches is the determination of loss of function or gain of function events.
While gain of function is mostly beneficial and thus represents a desired feature of adapted
phenotypes, loss of function can involve industrial detrimental characteristics, like the inability to
metabolize a common substrate (Blaby et al. 2012).
3.4.2 Metabolic engineering of succinate production strains
Rational analysis, based on accessible knowledge of cellular pathways and kinetics, provides the
opportunity for optimization that can be realized by molecular biological techniques. This systems
metabolic engineering enables target-oriented implementation of genetic modifications thus leading to
increased carbon fluxes and improved metabolite product yields (Stephanopoulos et al. 1998) while
reconfiguring metabolic bottlenecks. Regarding succinate production the major engineering approach
deals with increasing the succinate yield. In this line, the primary group of targets blatantly derives
from the mixed fermentation characteristics of almost all microorganisms during anaerobic growth.
For each industrial host, specific targets arise from their inherent set of by-products and their ratio to
succinate. Since the metabolic optimization involves complete channeling of provided carbon towards
succinate, targeted gene deletion is the most preferred method to realize the desired fluxes. Genes that
were preferentially considered for this strategy encoded lactate dehydrogenase, formate C-
acetyltransferase, acetate kinase or alcohol dehydrogenase (Bunch et al. 1997; Lee et al. 2006; Okino
et al. 2008; Becker et al. 2013). Completing these tasks, succinate yields could be increased in natural
succinate producing hosts. In primary aerobic industrial platform hosts, this strategy partially caused
growth defects mainly due to the effect of completely linking cellular growth to succinate production
and thus unbalancing the redox and energy capacities (Bunch et al. 1997; Stols and Donelly 1997;
Sánchez et al. 2005; Jantama et al. 2008). Encouragingly, the introduction of the NAD generating
malic enzyme in the respective host strain increased growth performance and succinate production
(Stols and Donelly 1997). Considering the succinate biosynthesis pathway as target, the key reaction
under optimal and thus anaerobic conditions is the carbon fixation step. Theoretically, three enzymes
are capable of that reaction, whereas natural producers exhibit high specific enzyme activities for and
carbon fluxes through the PEP carboxykinase (Podkovyrov and Zeikus 1993; Van der Werf et al.
1997; Kim et al. 2007; Becker et al. 2013). On the other hand, studies revealed the potential of non-
ATP coupled PEP- and pyruvate carboxylase as carboxylation step (Vemuri et al. 2002; Sánchez et al.

Theoretical Background
16
2005; Litsanov et al. 2012), the latter one especially in context with PEP dependent substrate uptake
systems, due to no losses in precursor supply (Shanmugam and Ingram 2008), while keeping in mind
that carbon dioxide is essential to catalyze these thermodynamically unfavored reactions (Samuelov et
al. 1991). Continuing with this pathway, the reductive TCA cycle directly emerges as target for
pushing the carbon flux from oxaloacetate towards succinate by engineering the synthesis steps (Wang
et al. 1998; Hong and Lee 2004; Lee 2009). This strategy is emphasized by observed accumulation of
malic acid as pathway intermediate in engineered strains (Hong and Lee 2004; Lee et al. 2006). The
additionally accumulating pyruvate represents an essential node in almost every metabolism (Sauer
and Eikmanns 2005), but it is predestined to redirect its carbon via parts of the oxidative TCA cycle
accompanied by the glyoxylate shunt (Lin et al. 2005; Raab et al. 2010; Scholten et al. 2010; Litsanov
et al. 2012; Skorokhodova et al. 2013). Another crucial target comprises the balancing of the cellular
redox capacities by e.g. implementation of heterologous genes (Hong and Lee 2001) or enzyme
specific co-factor engineering (Wang et al. 2013). In this line, fine-tuned design approaches have to be
followed by balancing the redox benefits and carbon loss, with e.g. the malic enzyme. Having in mind
that all these strategies are mainly conducted regarding glucose based succinate production, it is
inevitable to design microbial host that efficiently convert industrial desired raw materials, like
molasses, hydrolysates or waste products into succinate. First studies elaborated the possibilities of
glycerol conversion, exploiting the advantage of the higher reduced substrate for optimized redox
balance (Blankschien et al. 2010; Scholten et al. 2009). Other approaches targeted the application of
these mixed substrates in bioprocess refinements using both natural succinate producers and
engineered platform microorganisms (Kim et al. 2004; Liu et al. 2008; Jiang et al. 2010; Chan et al.
2011; Borges and Pereira Jr 2011; Liu et al. 2012). However, these complex compounds often contain
inhibitory substances to some extent that complicate optimization tasks. Overall, the sophisticated
approach of understanding intracellular fluxes in combination with strain specific genome-scale
models and molecular biology methods is highly suitable in context to industrial objectives like
product formation, volumetric production or yield. Thus, rational analysis, based on accessible
knowledge of metabolic pathways and their kinetics, provides the opportunity for optimization
strategies. Nevertheless, engineering strategies for succinate production have to be exclusively
adjusted to the respective microbial hosts, their specific networks and their physiological
characteristics as natural producer or platform host. Thus, systems metabolic engineering indeed
specifically alters basic production phenotypes that are mediated by just a few genes, but lacks the
ability to select for robust strains (Blaby et al. 2012) and complex phenotypes. Moreover, many of
these phenotypes remain largely inaccessible to this method due to difficulties in predicting the
genotype-phenotype relationship.

Theoretical Background
17
3.5 Creating robust industrial phenotypes through evolutionary engineering
Under industrial aspects it is not very likely to design bioprocesses to the employed microorganisms.
Nowadays, the development process is strongly interwoven with the capability of producing
microorganisms that tolerate industrial preferred settings. Additionally, the industry is continuously
searching for microorganisms that allow for a process, which features already existing facilities
accompanied by low development costs. An answer to these driving forces is the application of multi-
tolerant phenotypes that exhibit high tolerances for various stress triggers like temperature, product
tolerances, pH, shear stress, osmolarity, nutrient supply, or toxicity (Table 3.3), called complex
phentotypes.
Table 3.3 List of process step assigned industrially desired properties for competitive bioprocesses with their required
complex phenotype.
Process step Industrial requirements Complex phenotype
Substrate supply
Implementation of substrate pre-processing
(saccharification)
Temperature tolerance, tolerance towards
impurities
Application of industrial waste products
and renewable ressources
Substrate metabolism
Fluctuating substrate quality, impurities Toxic residue tolerance
Plant facilities
Efficient energy policy Temperature tolerance
Spatial inhomogenities High substrate tolerance, temperature tolerance,
mechanical stress tolerance, pH tolerance,
osmolarity tolerance, starvation tolerance
Decrease contamination risk Temperature tolerance, Phage tolerance
Fermentation process High product titers High substrate tolerance, product tolerance
No by-product formation Re-balancing of cellular redox metabolism
Downstream processing
Simple cell separation Cell composition
High product purity Product tolerance
Application of less purification agent pH tolerance, solvent tolerance
These complex phenotypes distinguish themselves by their advanced polygenic response to stress
triggers, since a single innovative product and its producing microorganism are not anywhere near
sufficient to meet the overall criterions for an economic feasible and competitive production process.
On that account, the last decades delivered various approaches to achieve methods for generating these
specific microorganisms.
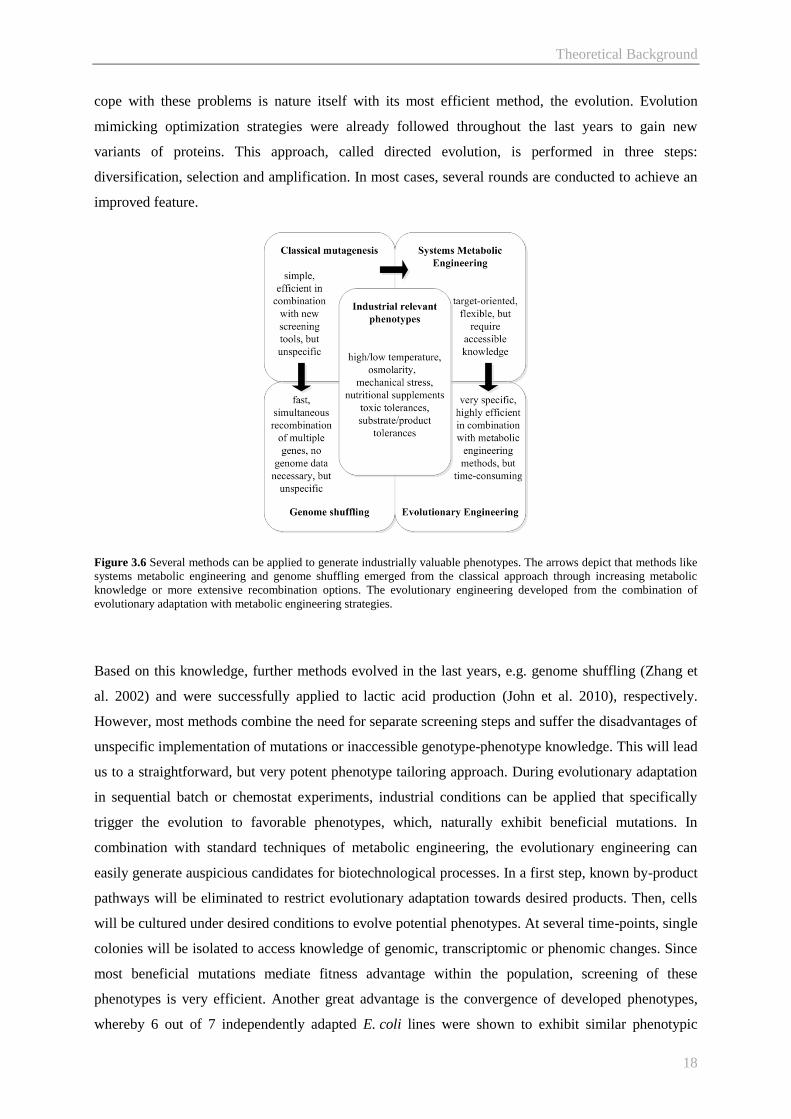
A classical method to forward these issues is mutagenesis (Figure 3.6), where the genetic material is
iteratively exposed to mutagens. Surviving clones of this procedure are then selected for the
specifically desired phenotype (Patnaik 2008). This method convinces by its simplicity but lacks the
ability to modify microorganism target-oriented. Nonetheless, it gets attention due to the rapid and
extensive development of high-throughput screening systems that enables quick and reliable
phenotype characterization (Patnaik 2008). Considering industrial requirements for cultivation
stability at high/low temperature or osmolarity or at mechanical stress, these complex or polygenic
phenotypes need multiple coordinated changes to retain special features (Patnaik 2008). An option to
Theoretical Background
18
cope with these problems is nature itself with its most efficient method, the evolution. Evolution
mimicking optimization strategies were already followed throughout the last years to gain new
variants of proteins. This approach, called directed evolution, is performed in three steps:
diversification, selection and amplification. In most cases, several rounds are conducted to achieve an
improved feature.
Figure 3.6 Several methods can be applied to generate industrially valuable phenotypes. The arrows depict that methods like
systems metabolic engineering and genome shuffling emerged from the classical approach through increasing metabolic
knowledge or more extensive recombination options. The evolutionary engineering developed from the combination of
evolutionary adaptation with metabolic engineering strategies.
Based on this knowledge, further methods evolved in the last years, e.g. genome shuffling (Zhang et
al. 2002) and were successfully applied to lactic acid production (John et al. 2010), respectively.
However, most methods combine the need for separate screening steps and suffer the disadvantages of
unspecific implementation of mutations or inaccessible genotype-phenotype knowledge. This will lead
us to a straightforward, but very potent phenotype tailoring approach. During evolutionary adaptation
in sequential batch or chemostat experiments, industrial conditions can be applied that specifically
trigger the evolution to favorable phenotypes, which, naturally exhibit beneficial mutations. In
combination with standard techniques of metabolic engineering, the evolutionary engineering can
easily generate auspicious candidates for biotechnological processes. In a first step, known by-product
pathways will be eliminated to restrict evolutionary adaptation towards desired products. Then, cells
will be cultured under desired conditions to evolve potential phenotypes. At several time-points, single
colonies will be isolated to access knowledge of genomic, transcriptomic or phenomic changes. Since
most beneficial mutations mediate fitness advantage within the population, screening of these
phenotypes is very efficient. Another great advantage is the convergence of developed phenotypes,
whereby 6 out of 7 independently adapted E. coli lines were shown to exhibit similar phenotypic

Theoretical Background
19
characteristics, while the gene expression differed from each other (Fong et al. 2005). It was also
shown that adapting genomes evolve in a near-linear fashion by accumulating mutations, while
vigorously fitness improvements occur in the beginning of adaptive processes and distinctly decreases
over time (Barrick et al. 2009). Combining these two facts, it is obvious that a parallel adaptation
approach will yield highly efficient phenotypes in short time. Considering this method to be applied in
strain optimization, four facts have to be kept in mind. First, the physiological limitations of the
microorganism have to be studied to draw a picture of the complete criterion dependent performance
space. This information will then be used to set up adaptation starting points, where growth is affected
by the stressor, but still present. Second, the engineering level of the applied microorganism must be
determined. Here, the wild-type easily comes to mind, but strains exhibiting definite genetic
modifications, like gene deletion, will serve as a better host. Their metabolism is channeled to a
specific product and often includes redox balance inconsistencies. This will narrow down the degrees
of freedom for evolution and thus raise the odds on succeeding in desired phenotype improvement.
Extensively modified production strains are unfavorable adaptation hosts. Indeed, a large number of
implemented genetic changes like point mutation or promoter exchanges direct fluxes into product
channels, but engender detrimental growth characteristics. However, the main crux lies in the
evolutionary ability to remove these cellular undesired modifications and switch back to the wild-type
allele. Thus phenotype generation is still possible but involves loss of industrial relevant production
features. The third fact includes the question for the adaptation medium. Complex media facilitate
faster growth but cause the accumulation of auxotrophies. Moreover these auxotrophies remain
undetected during adaptation while increasing microbial fitness due to less metabolic costs for the
cellular growth. As a consequence it is highly appreciated to apply minimal media, while their
composition has to be adjusted for each approach. Fourth, it is necessary to setup the adaptation
approach, which comprises the question for sequential batch or continuous cultivation, as well the
fashion of stress induction. While batch experiments are simple structured, their effort for iteratively
media preparation and inoculation exceeds continuous approaches, while they are running. Prior to the
adaptation their configuration is much more elaborate. Considering the stress application, continuous
approaches allow for constant cellular response documentation and subsequent counteracting. During
sequential batches in small volume, these results can only be determined in between iterations. All
things considered, evolutionary adaptation has to be well prepared to create conspicuous new
phenotypes.
Temperature
The biological significance of temperature is undeniable. All organisms and their vital surroundings
are directly or subtly influenced by it. The industrial interest in temperature adapted phenotypes can be
easily linked to economic matters. Concerning specific enzymes, cold adapted proteins that exhibit

Theoretical Background
20
highest activities at low temperatures are state of the art nowadays in the detergent industry and rule
the sales figures of companies. In contrast, the development of adapted whole cells for cultivation
purposes is in its early stages. Improved microbial temperature stability is highly appreciated in
fermentation processes to keep the cooling costs down. Furthermore, the extension of the growth
optimum decreases the probability of external contamination that occur due to impracticalities in
vessel sterilization, since the adapted strain exceeds in growth performance compared to standard
contamination seeds. Another economic aspect is the combination of substrate pre-treatment steps
with the following fermentation to a single step process (Turner et al. 2007). Along with it, enzyme
kinetics, basically chemical reactions can be described by the Arrhenius equation. A generalization of
this equation describes doubled reaction rate per 10 °C increased temperature. Thus, the industry aims
for better growth and production performance of temperature adapted microorganisms at elevated
temperatures. Interestingly, the Arrhenius equation was shown to be applicable for bacterial growth in
their temperature optimum (Herendeen et al. 1979). However, rational approaches to design
temperature tolerant microorganism were mainly based on random findings. In case of E. coli, the
addition of methionine to a cultivation medium enabled for growth at a lethal temperature (Ron and
Davis 1971). On closer inspection two specific amino acid sites were revealed in homoserine o-
succinyltransferase, the first enzyme in methionine synthesis that stabilized the protein and thus E. coli
growth at higher temperature. In general, the bacterial heat stress response is just partly understood
caused by its magnitude of involved regulatory pathways. Since temperature represents a pervasive
challenge for microorganisms, they developed a successful adaptation scheme to overcome this stress
called heat shock response. This mechanism is mediated by organism specific transcription factors that
are directly activated by the perturbant before damage or by the damage itself (DNA, mRNA,
proteins). Afterwards ubiquitous existing chaperons and proteases are activated that deal with
unfolded or misfolded proteins to preserve the protein homeostasis (Lim and Gross 2011). Other
predicted strategies describe the maintenance of physiological rates achieved by a quantitative
approach, where the concentration of enzymes is increased throughout adaptation. A qualitative
approach comprises more stable enzyme variants, whereas the modulation approach minimizes the
temperature effect by modifying the protein environment (Clarke 2003). Concluding this, it is
inevitable to acquire tolerant phenotypes to facilitate the strategic tailoring of temperature tolerant
microorganisms.
Product Tolerance
A common claim of biorefinery is a fermentation process yielding maximal titers, a key performance
indicator. The crux in this claim is the fact that even though some industrial microorganisms show the
potential of producing organic acids in extremely high titers they exhibit intolerances against the
produced compounds to some extent (Loubiere et al. 1997; Song et al. 2008; Urbance et al. 2004),

Theoretical Background
21
which limits the commercial application. During a mixed organic acid fermentation secreted acids
dissociate and cause a rapid decrease in pH. In case of non-regulated cultivation media the pH drops
below the corresponding pKa and the organic acids remain undissociated. These acids can then directly
diffuse across cellular membranes (Warnecke and Gill 2005). They enter the cell unimpeded and
accumulate intracellular. The neutral pH of the cytosol promotes the dissociation of these organic
acids resulting in a severe pH decrease and thus decreased integrity of purine bases and severe protein
denaturation (Warnecke and Gill 2005). At a neutral pH instead, the nearly equilibrium between
intracellular and extracellular pH prevents from toxic accumulation of organic acids in the cell.
Furthermore, at neutral pH organic acids dissociate into protons and acid residues, which can only be
taken up via secondary transport. Anyhow, the rational understanding of these complex networks is
limited by its broad spectrum. Microorganisms have developed several strategies to compensate for
the problem of acid shock that is accompanied by a decrease of cytosolic pH. The proton permeability
of membranes can be triggered through their composition (Booth 1999). A further response can be
observed on the level of transport mechanisms. As recently reported, a succinate adapted E. coli
exhibited strong changes on the level of transcriptomics for genes that contributes to several transport
mechanisms. Additionally, higher expression patterns could be observed for genes that are involved in
osmoprotectant biosynthesis (Kwon et al. 2011). Nevertheless, it was shown that not only growth
associated organic acid production, but also organic acid salts impede cellular growth, both, for natural
succinate producers and engineered microorganisms, when added to the medium prior to cultivation
(Lin et al. 2008; Li et al. 2010; Hoon et al. 2010). Besides, organic acid tolerance depends on the
respective organic acid. While succinate seems to be a mild stressor with high critical concentrations,
formate severely ceases cell proliferation (Loubiere et al. 1997; Lin et al. 2008). It is therefore crucial
to understand intracellular regulation pathways towards industrial oriented improvements in bio-
succinate production. This effort can be minimized by creating and evaluating evolutionary derived
complex phenotypes with beneficial features (Buschke et al. 2013).
pH Tolerance
Industrial bioprocesses are closely connected to economic production procedures and down-stream
treatments. Considering the succinate production, a classic recovery method comprises the application
of calcium salts and the subsequent acidification with sulfuric acid (Kurzrock and Weuster-Botz
2010), which accounts for a process relevant cost factor. Lower cultivation pH comprises lower
investment costs due to less salt processing operations and lower variable costs caused by less salt
acquisition. Thus regarding process sustainability, acidic pH increases the carbon footprint of
succinate production (Jansen et al. 2012). Furthermore, applied calcium carbonate combines lower
cultivation pH with buffer effect and carbon dioxide source. It is thus recommended to employ acidic
pH tolerant microorganisms for production processes. By default, many microorganisms exhibit an
Theoretical Background
22
optimum at neutral pH with decreasing tolerance toward acidic pH, belonging to the neutralophilics.
For organic acid producing bacteria the fermented products decrease extracellular pH that causes a
transmembrane pH gradient shift. In the end organic acids accumulate in the cytosol and directly
perturb the intracellular pH (Booth 1985). The response to that event is mediated by a passive and an
active regulated homeostasis. The first one comprises low membrane permeability to protons and a
cytoplasmic buffer capacity. The active mechanisms include controlled transport of cations across the
membrane (Booth 1999). An additional response is the synthesis of proteins that forms neutral
compounds from acidic ones or converts neutral ones to alkaline substances, in respect to the pH
stress. Taking together, pH tolerance and organic acid tolerance are somewhat intertwined and cannot
be clearly treated individually.

Material and Methods
23
4 Material and Methods
4.1 Chemicals
Yeast extract, peptone and BHI (brain heart infusion) were purchased from Becton Dickinson
(Heidelberg, Germany). Ninety-nine percent [1-13
C] glucose was obtained from Eurisotop (Saint-
Aubin Cedex, France). All other chemicals were of analytical grade and purchased from Sigma
Aldrich (Steinheim, Germany), Merck (Darmstadt, Germany), Roth (Karlsruhe, Germany) and Fluka
(Buchs, Switzerland), respectively.
4.2 Growth media
4.2.1 Media for genetic engineering
B. succiniciproducens was grown in liquid BHI medium (Table 4.1) for genetic engineering purposes,
i.e. for electroporation and during the regeneration step of transformation. Selection of plasmid
carriage was performed on BHI-MOPS agar plates (Table 4.2) by adding chloramphenicol stock
solution (30 g L-1
) to a final concentration of 5 mg L-1
prior to usage. Sucrose was added to 100 g L-1
for second recombination selection before autoclaving.
Table 4.1 Composition of BHI medium.
Component Quantity [g]
BHI 37
ad 1 L aqua dest
autoclaved (121 °C, 20 min)
Table 4.2 Composition of BHI-MOPS agar plates.
Component Quantity [g]
BHI 37
Agar 18
ad 750 mL aqua dest.
autoclaved (121 °C, 20 min)
MOPS 9.375
Bis-Tris 5.75
Mg(OH)2 0.625
ad 250 mL aqua dest., stirred overnight
NaHCO3 1.79
sterile filtered, add 250 mL MOPS-Bis-Tris solution to 750 mL BHI agar medium

Material and Methods
24
E. coli TOP10 cultivations for plasmid amplification were performed in LB broth (Luria Bertani) or on
LB agar plates (Table 4.3). For selection purposes, chloramphenicol was added to the respective
medium to a final concentration of 50 mg L-1
. Agar plates were prepared by adding 18 g L-1
agar.
Table 4.3 Compositions of LB medium.
Component Quantity [g]
Tryptone 10
Yeast extract 5
NaCl 5
ad 1 L aqua dest
autoclaved (121 °C, 20 min)
After heat shock, E. coli TOP10 cells were regenerated in SOC (super optimal broth (SOB) with
catabolite repression) medium (Table 4.4).
Table 4.4 Composition of SOC medium.
Component Quantity [g]
Tryptone 20
Yeast extract 5
NaCl 0.5
ad 970 mL aqua dest.
autoclaved (121 °C, 20 min)
MgCl2 (1M) sterile filtered 10 mL
MgSO4 (1M) sterile filtered 10 mL
Glucose (2M), autoclaved (121 °C, 20 min) 10 mL
4.2.2 Media for growth and succinate production
For all media, stock solutions were prepared separately (Table 4.5), subsequently sterile filtered and
stored at room temperature. The vitamin solutions 1 and 2 were stored as aliquots at -20 °C. Prior to
usage, the stock solutions were mixed at room temperature as needed. A complex medium A was
applied for first pre-cultures of B. succiniciproducens. The second pre-culture and following main
cultivations of B. succiniciproducens were conducted in respective media (Table 4.6 to Table 4.11).

Material and Methods
25
Table 4.5 Composition of stock solutions for B. succiniciproducens cultivation.
Component Quantity [g]
Glucose solution
Glucose 500
ad 1L aqua dest., sterile filtered
Maltose solution
Maltose 500
ad 1L aqua dest., sterile filtered
Glycerol solution
Glycerol (99.5 %) 502.5
ad 1L aqua dest., sterile filtered
Yeast extract solution
Yeast extract 100
ad 1L aqua dest., sterile filtered
Peptone solution
Peptone 100
ad 1L aqua dest., sterile filtered
Salt solution
NaCl 100
MgCl2 20
CaCl2 20
ad 1L aqua dest., sterile filtered
(NH4)2SO4 solution
(NH4)2SO4 500
ad 1L aqua dest., sterile filtered
K2HPO4 solution
K2HPO4 500
ad 1L aqua dest., sterile filtered
Amino acid solution
L-valine 25
L-glutamate 25
ad 1L aqua dest., sterile filtered
Vitamin solution 1
Thiamin HCl (B1) 3
Riboflavin (B2) 6
Nicotinamide (B3) 3
Pantothenic acid (B5) 10
Pyridoxine HCl (B6) 1
Biotin (B7) 0.5
each vitamin was individually dissolved, biotin and riboflavin were titrated with
2 M NaOH to complete dissolution, ad 1L aqua dest., sterile filtered
Vitamin solution 2
Cyanocobalamin (B12) 0.5
ad 1L aqua dest., sterile filtered
Na2CO3 solution
Na2CO3 200
ad 1L aqua dest., sterile filtered
A total volume of 10 mL of each medium was freshly prepared from stock solutions (Table 4.5) for
30 mL scale serum bottles. Serum bottles were autoclaved prior to usage containing 0.5 g MgCO3
(final concentration in medium of 50 g L-1
). Fermentations for MgCO3 free preparation of cell pellets
for RNA isolation were carried out in bioreactors using minimal medium E according to Table 4.10 in
corresponding volumes. Cultivation experiments of B. succiniciproducens variants carrying expression
vectors were conducted in described media A – F (Table 4.6 to Table 4.11), containing 5 mg L-1
chloramphenicol, respectively.

Material and Methods
26
Table 4.6 Complex growth medium A for first pre-cultures.
Stock solution Volume [mL]
Yeast extract 50
Peptone 50
Salt solution 10
(NH4)2SO4 2
K2HPO4 6
Glucose 100
Aqua dest. ad 1 L
Table 4.7 Complex glucose based growth medium B for succinate production.
Stock solution Volume [mL]
Yeast extract 100
Na2CO3 20
(NH4)2SO4 2
K2HPO4 6
Glucose 100
Aqua dest. ad 1 L
Table 4.8 Industrial growth medium C for succinate production.
Stock solution Volume [mL]
Yeast extract 100
Na2CO3 20
(NH4)2SO4 2
K2HPO4 6
Glycerol 100
Maltose 40
Aqua dest. ad 1 L
Table 4.9 Complex growth medium D for MgCO3-free cultivations.
Stock solution Volume [mL]
Yeast extract 100
Na2CO3 20
(NH4)2SO4 2
K2HPO4 24
Glucose 100
Aqua dest. ad 1 L
Table 4.10 Defined growth medium E for succinate production.
Stock solution Volume [mL]
Amino acid solution 20
Salt solution 10
Vitamin solution 1 10
Vitamin solution 2 1
(NH4)2SO4 2
K2HPO4 6
Glucose 100
Aqua dest. ad 1 L

Material and Methods
27
Table 4.11 Defined growth medium F for succinate production.
Stock solution Volume [mL]
Amino acid solution 20
Salt solution 10
Vitamin solution 1 10
Vitamin solution 2 1
(NH4)2SO4 10
K2HPO4 6
Glucose 100
Aqua dest. ad 1 L
4.3 Genetic engineering
4.3.1 Strains and plasmids
The wild-type strain B. succiniciproducens DD1, the mutant B. succiniciproducens ΔldhA ΔpflD and
the mutant B. succiniciproducens ΔldhA ΔpflA were obtained from BASF SE (Ludwigshafen,
Germany) (Table 4.12). E. coli TOP 10 was acquired from Invitrogen (Karlsruhe, Germany) and used
for plasmid amplification.
Table 4.12 Strains of B. succiniciproducens used in the present work
Strain Modification(s) Reference
B.succiniciproducens DD1 Wild-type BASF SE
B.succiniciproducens DD3 DD1 + deletion of lactate dehydrogenase ldhA and formate C-
acetyltransferase pflD BASF SE
B.succiniciproducens DD5 DD1 + deletion of lactate dehydrogenase ldhA and formate C-
acetyltransferase activator pflA BASF SE
E. coli TOP 10 F- mcrA ∆(mrr-hsdRMS-mcrBC) φ80lacZ∆M15 ∆lacX74 recA1
araD139 ∆(ara-leu)7697 galU galK rpsL (StrR) endA1 nupG Invitrogen
A Pasteurellaceae specific episomal replicating expression vector (Frey 1992) was applied for
B. succiniciproducens transformation. The vector had a size of 8.1 kb, contained an origin of
replication for E. coli and B. succiniciproducens, a multiple cloning site for site specific insert
integration and a chloramphenicol acetyltransferase gene for antibiotic resistance (CmR) as selection
marker. Genome-based transformation was realized using the pClik int sacB Cm integrative vector. It
had a size of 4.3 kb, contained an origin of replication for E. coli, a multiple cloning site, the
chloramphenicol resistance and the gene sacB encoding levansucrase of Bacillus subtilis. CmR and
sacB served as selection marker for first and second homologous recombination events during genome
integration.

Material and Methods
28
Table 4.13 Plasmids used for targeted genetic modification of B. succiniciproducens.
Plasmid Specification(s) Reference
pJFF224-XN Episomal vector with ORI for E. coli, mob, CmR as selection
marker and MCS BASF SE
pClik sacB Cm Integrative transformation vector for B. succiniciproducens with
MCS, ORI for E. coli, and CmR and sacB as selection markers BASF SE
Transformation vectors were constructed by using respective DNA fragments, which were amplified
via polymerase chain reaction employing site-specific primer pairs. End primers were artificially
modulated by insertion of appropriate restriction sites for specific integration into the vector. Purified
DNA fragments were restricted with two appropriate enzymes and ligated into the MCS of the vector.
4.3.2 Isolation of chromosomal DNA from B. succiniciproducens
Cells from a cryogenic stock were incubated overnight in BHI medium. The culture broth was
centrifuged (16,000 x g, 4 °C and 5 min) and the supernatant was discarded. Then, 400 µL lysis buffer
(DNeasy Plant Minikit; Qiagen, Hilden, Germany) and 4 µL RNase solution (100 mg mL-1
) were
added to the cell pellet. The suspension was vortexed and incubated for 15 min at room temperature.
In the next step, 130 µL neutralization buffer was added to the suspension. The mixture was kept on
ice for 5 min. Afterwards 600 µL Roti®-Phenol/Chloroform/Isoamylalcohol (Carl Roth GmbH,
Karlsruhe, Germany) were added, followed by vigorous mixing and subsequently centrifugation
(16,000 x g, 4 °C and 10 min). The upper phase was transferred to a sterile 1.5 mL reaction tube,
mixed with 600 µL Chloroform/Isoamylalcohol (24:1) and again centrifuged (16,000 x g, 4 °C and
10 min). Then, the upper phase was transferred to a sterile 1.5 mL reaction tube, followed by the
addition of 50 µL sodium acetate (3 M, pH 5.5) and 1 mL pure ethanol. The precipitated DNA was
then pelleted by centrifugation (16,000 x g, 4 °C and 10 min). After that the supernatant was
discarded. Subsequently, 1 mL of icecold 70 % ethanol was added. The washed DNA pellet was
harvested by centrifugation (16,000 x g, room temperature and 1 min). Right after removing the
supernatant the pellet was dried at room temperature for 10 min. Finally, the pellet was dissolved in
200 µL sterile aqua dest..
During strain construction and screening steps, DNA was routinely isolated by following a fast
preparation protocol. In this case, cells were disrupted using glass-beads (0.10 – 0.25 mm; Retsch,
Haan, Germany) and a mixer mill (30 sec, 30 s-1
; Mikro-Dismembrator S, Sartorius Stedim, Göttingen,
Germany). Cell debris was removed by centrifugation (16,000 x g, room temperature and 1 min) and
the supernatant, containing the DNA, was transferred into a sterile 1.5 mL reaction tube.

Material and Methods
29
DNA quantity and quality were measured using the Nanodrop®-Spectrophotometer ND-1000 (Thermo
Fisher Scientific Inc., Waltham, MA, USA). DNA samples exhibiting a 260/280 ratio of 1.8 to 2.0
were considered to be pure DNA. For genome sequencing the DNA integrity was validated with an
0.8 % agarose gel. Isolated DNA was stored at 4 °C.
4.3.3 Polymerase chain reaction
The polymerase chain reaction (PCR) was performed in a Mastercycler Eppgradient (Eppendorf,
Hamburg, Germany). A Phusion® polymerase (New England Biolabs, Frankfurt, Germany), exhibiting
a proof-reading function, was applied for genetic engineering purposes and for sequencing supported
verification of specific nucleotide exchanges. The validation of engineered strains was completed
using PCR master (Roche Applied Science, Mannheim, Germany), which employed the Taq
polymerase.
Table 4.14 PCR profiles for Phusion® polymerase and PCR master (annealing temperature and elongation time were chosen
primer specifically).
Phusion® polymerase Taq polymerase
Step Temperature [°C] Time [sec] Temperature [°C] Time [sec]
1 x Denaturation 98 120 95 120
30 x
Denaturation
Annealing
Elongation
98
52 – 59
72
10
30
30 per kb
95
52 – 59
72
30
30
60 per kb
1 x Elongation 72 5 72 7
End 10 15
Appropriate primers were designed with the Primer3 tool (http://biotools.umassmed.edu/bioapps/
primer3_www.cgi). Afterwards, relevant restriction sites were added to the designed primers. The
calculation of primer annealing temperature was performed using the NEB Tm Calculator Tool
(https://www.neb.com/tools-and-resources/interactive-tools/tm-calculator=). All primers were
purchased from Life Technologies (Carlsbad, CA, USA). Purified genomic DNA, fast prepared
genomic DNA and purified plasmid DNA were used as PCR templates according to following
schemes (Table 4.15 and Table 4.16).
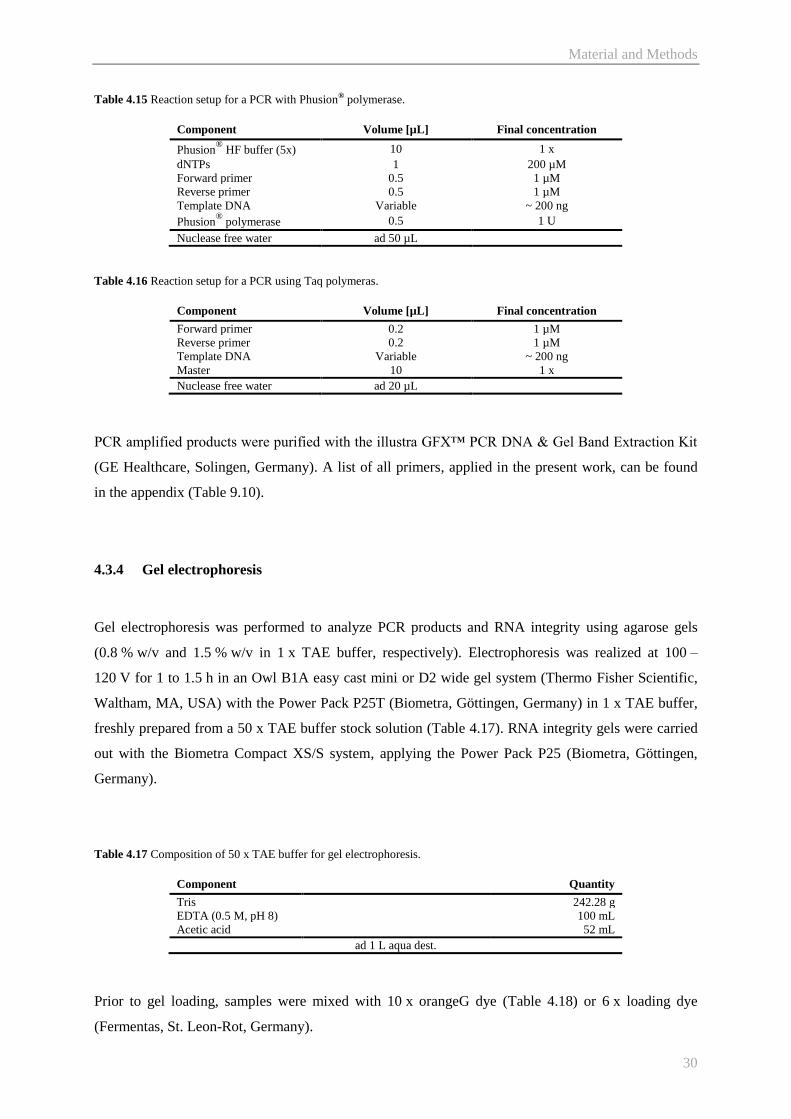
Material and Methods
30
Table 4.15 Reaction setup for a PCR with Phusion® polymerase.
Component Volume [µL] Final concentration
Phusion®
HF buffer (5x) 10 1 x
dNTPs 1 200 µM
Forward primer 0.5 1 µM
Reverse primer 0.5 1 µM
Template DNA Variable ~ 200 ng
Phusion®
polymerase 0.5 1 U
Nuclease free water ad 50 µL
Table 4.16 Reaction setup for a PCR using Taq polymeras.
Component Volume [µL] Final concentration
Forward primer 0.2 1 µM
Reverse primer 0.2 1 µM
Template DNA Variable ~ 200 ng
Master 10 1 x
Nuclease free water ad 20 µL
PCR amplified products were purified with the illustra GFX™ PCR DNA & Gel Band Extraction Kit
(GE Healthcare, Solingen, Germany). A list of all primers, applied in the present work, can be found
in the appendix (Table 9.10).
4.3.4 Gel electrophoresis
Gel electrophoresis was performed to analyze PCR products and RNA integrity using agarose gels
(0.8 % w/v and 1.5 % w/v in 1 x TAE buffer, respectively). Electrophoresis was realized at 100 –
120 V for 1 to 1.5 h in an Owl B1A easy cast mini or D2 wide gel system (Thermo Fisher Scientific,
Waltham, MA, USA) with the Power Pack P25T (Biometra, Göttingen, Germany) in 1 x TAE buffer,
freshly prepared from a 50 x TAE buffer stock solution (Table 4.17). RNA integrity gels were carried
out with the Biometra Compact XS/S system, applying the Power Pack P25 (Biometra, Göttingen,
Germany).
Table 4.17 Composition of 50 x TAE buffer for gel electrophoresis.
Component Quantity
Tris 242.28 g
EDTA (0.5 M, pH 8) 100 mL
Acetic acid 52 mL
ad 1 L aqua dest.
Prior to gel loading, samples were mixed with 10 x orangeG dye (Table 4.18) or 6 x loading dye
(Fermentas, St. Leon-Rot, Germany).

Material and Methods
31
Table 4.18 Composition of orangeG gel loading buffer.
Component Quantity
Glycerol (60 %) 50 mL
EDTA (0.5 M, pH 8) 100 mL
OrangeG 75 mg
Visualization of DNA fragments was performed by gel staining in an ethidium bromide bath
(0.5 mg L-1
ethidium bromide). Appearing DNA-ethidium bromide complexes were illustrated under
UV light with the Gel iX Imager (Intas Imaging Instruments GmbH, Göttingen, Germany). For size
estimation of DNA and RNA fragments, a 1 kb ladder and a 100 bp ladder were used, respectively
(GeneRuler™, Fermentas, St. Leon-Rot, Germany).
4.3.5 Construction of transformation vectors
B. succiniciproducens specific expression and integrative vectors were constructed by insertion of
PCR amplified fragments into the MCS of empty vectors pJFF224-XN and pClik sacB Cm,
respectively (Table 4.13). Two distinct restriction sites served as integration points, since vector and
fragment were digested with appropriate restriction enzymes (FastDigest, Fermentas, St. Leon-Rot,
Germany) (Table 4.19).
Table 4.19 Restriction enzyme digestion setup for insert and vector.
Component Volume [µL] Final concentration
Restriction enzyme A 1
Restriction enzyme B 1
FastDigest buffer (10 x) 2 1 x
DNA Variable 0.2 µg (insert);
up to 1 µg (vector)
ad 20 µL nuclease free water
Incubation for 30 min at 37 °C
Afterwards, the digested vector was treated with shrimp alkaline phosphatase (SAP) to prevent self-
ligation (Table 4.20). Then, the dephosphorylated vector was directly applied in the following ligation
reaction (Table 4.21). Both steps were conducted using the Rapid DNA Dephos & Ligation Kit
(Roche Diagnostic, Mannheim, Germany). The ligation reaction mix was directly transformed into
E. coli TOP10 cells by heat shock or stored at -20 °C.

Material and Methods
32
Table 4.20 Reaction setup for vector dephosphorylation.
Component Volume [µL] Final concentration
Vector DNA Variable up to 1 µg
rAPid Alkaline
Phosphatase Buffer (10 x) 2 1 x
SAP 1 1 unit
ad 20 µL nuclease free water
Incubation for 10 min at 37 °C and deactivation for 2 min at 75 °C
Table 4.21 Reaction setup for ligation of vector and insert.
Component Volume [µL] Final concentration
Vector DNA Variable 50 ng
Insert DNA Variable 150 ng
Dilution buffer (10 x) 2 1 x
ad 10 µL nuclease free water
Ligation buffer (2 x) 10 1 x
T4 DNA ligase 1 5 units
Mix thoroughly
Incubation for 20 min at room temperature
4.3.6 Transformation
E. coli
Competent E. coli TOP10 cells were transformed by heat shock. Aliquoted cell suspension (50 µL)
was thawed on ice and subsequently mixed with 5 µL ligation mixture. After 30 min incubation on ice,
cells were shocked for 45 sec at 45 °C in a thermo block (Thermomixer comfort, Eppendorf,
Hamburg, Germany). Afterwards, cells were cooled down immediately and kept on ice for 2 min. For
regeneration, the transformed cells were incubated for 1 h at 37 °C and 600 rpm in SOC medium.
Then, the cells were harvested (16,000 x g, room temperature and 1 min). The supernatant was
discarded, except a residual volume of about 200 µL, which was used for resuspension of the cell
pellet. Transformed E. coli Top10 cells were streaked out on LBCm
agar plates and incubated for 24 h
at 37 °C.
B. succiniciproducens
Cells from a cryogenic stock were incubated overnight in BHI medium (10 mL, 37 °C and 130 rpm).
The main culture (100 mL, 37 °C and 130 rpm), initially started with an optical density (OD600) of 0.3,
was grown until OD600 of 0.8 and cells were then harvested by centrifugation (10,000 x g, 4 °C and
5 min). After washing with sterile, ice-cold glycerol (10 %), the cells were resuspended in 6 mL
glycerol (10 %) per gram cell wet weight. The electroporation time was determined by using cell
Material and Methods
33
suspension without plasmid DNA. If the electroporation time of the control was lower than 8 ms, the
cell suspension was further diluted with glycerol (10 %). The transformation of B. succiniciproducens
was conducted with the GenePulser XCell (Bio-Rad, Hercules, CA, USA) at 2 kV, 400 Ω and 25 µF
after mixing 200 µL cell suspension with 2 and 5 µg of integrative plasmids or 200 and 500 ng of
episomal plasmids in a 2 mm electroporation cuvette. After the electroporation pulse, cells were
regenerated for 2 h or 1h for episomal plasmids in BHI medium at 37 °C and 600 rpm (Thermomixer
comfort, Eppendorf, Hamburg, Germany). Afterwards, the cell suspension was plated on BHI-
MOPSCm
agar plates and incubated for 2 – 3 days at 37 °C. Cells carrying the episomal plasmid and
cells that successfully past the first recombination by integration of the integrative vector were
selected for growth via the antibiotic resistance. The existence of desired inserts was then confirmed
by PCR. In case of integrative plasmids, a second recombination was needed. Here, positive clones of
the first recombination were incubated in 2 mL liquid BHI medium for 1 – 2 days at 37 °C and
130 rpm. 200 µL of a 1:100 dilution was then streaked out on BHI-Sac agar plates and incubated at
37 °C overnight, selecting for clones which have lost the sacB gene. Additionally, to increase the
recombination probability, 50 µL of this cell suspension was used to inoculate 2 mL liquid BHI-Sac
medium overnight at 37 °C and 130 rpm. This step was repeated 4 times to generate 5 generations of
second recombination clones. Two clones from each recombination generation, validated by sucrose
resistance, were used to validate the integration of the desired modification via PCR or sequencing.
4.3.7 Plasmid DNA purification
The GeneJET Plasmid Miniprep Kit (Thermo Fisher Scientific, Waltham, MA, USA) was used for
purification of plasmid DNA from E. coli cells. This was performed from 3 mL overnight culture of a
single E. coli colony in a total of 5 mL liquid LBCm
medium at 37 °C and 130 rpm. The isolation was
conducted according to the manufacturer’s protocol. Plasmid DNA concentration was measured
spectrophotometrically (see 4.3.2) and the plasmid was subsequently checked for the desired inserts by
digestion or PCR.

Material and Methods
34
4.4 Cultivation
4.4.1 Strain conservation
Cells from a cryogenic stock were cultivated in complex medium (LB for E. coli and medium A for
B. succiniciproducens). Exponentially growing cells were harvested, and 500 µL cell culture was
mixed with 500 µL sterile glycerol (86 %). The suspension was subsequently stored at -80 °C in 2 mL
cryo culture tubes.
4.4.2 Batch cultivation in serum bottles
First pre-cultures of B. succiniciproducens were grown in pre-sterilized serum bottles (30 mL, sealed
with gas-tight butyl rubber stopper) filled with 0.5 g MgCO3 as buffering agent and 10 mL of complex
medium A. The filled bottles were inoculated from cryo stocks, amended with CO2-rich atmosphere of
0.8 bar overpressure after 10 automatic flushing steps and then incubated on a rotary shaker (37 °C,
130 rpm; shaking diameter 50 mm; Certomat BS-1, Sartorius Stedim S.A., Göttingen, Germany).
During exponential growth, cells were harvested by centrifugation (16,000 x g, 4 °C and 5 min)
including a washing step with the afterwards applied medium (Table 4.6 to Table 4.11). The obtained
cell suspension was then used for inoculation of the second pre-culture. The conditions of the
incubation differed depending on experimental needs, as specified below. In all cases, exponentially
growing cells were harvested and washed with fresh medium as described above and applied as
inoculum for the main culture, which was carried out with three biological replicates. The initial cell
concentration was adjusted to an OD600 of 0.3. For fluxome studies, naturally labeled glucose was
replaced by 99 % [1-13
C] glucose in second pre- and main cultures, respectively.
4.4.3 Sequential batch fermentation in serum bottles for evolutionary adaptation
For adaptive evolution the serum bottle batch experiments (see 4.4.2) were extended to sequential
batch approaches. Hereby, exponentially growing cells from a first main culture in minimal glucose
medium served as starting culture for the adaptation. During the adaptation experiment, proliferating
cells were harvested and washed with fresh minimal medium and subsequently employed for
inoculating serum bottles of the next batch generation applying the same medium. The initial cell
concentration was always adjusted to OD600 of 0.3. The cultivation was conducted in a rotary shaker
(see 4.4.2) and adaptation parameters were set according to experimental needs. Cellular adaptation

Material and Methods
35
was monitored with OD600 and cells were sampled at an OD600 of about 5. This procedure was
identically repeated for all iterations, each one conducted as triplicate from the respectively best grown
culture.
4.4.4 Sequential batch fermentation in small scale bioreactors for evolutionary adaptation
Cultivation was performed in a SixFors fermenter system (Infors AG, Bottmingen, Switzerland) to
monitor and control the pH (Mettler Toledo, Gießen, Germany). Cells from a serum bottle main
culture (see 4.4.2) using minimal glucose medium were taken as starting culture for adaptation
purposes and prepared by a washing step in fresh minimal medium. Initial cell concentration was
adjusted to an OD600 of 0.3 and the starting pH was set to experimental needs by adding 0.5 M H3PO4.
During cell proliferation the pH of the broth was maintained at a desired value by automatically
controlled addition of 1 M Na2CO3. The added volume was calculated by measuring the pumping
time. Cultivation was operated at a temperature of 37 °C, a stirrer speed of 500 rpm and a constant
CO2-sparging at 0.1 NL h-1
. Each iteration was conducted as a single experiment, during which the cell
density and thus evolutionary progress was monitored by measuring OD600.
4.4.5 Bioreactor cultivation
Alternatively, B. succiniciproducens was cultivated in 1 L bioreactors (DASGIP AG, Jülich,
Germany) with a working volume of 300 mL employing a 6-blade Rushton impeller. The DASGIP
control 4 software (DASGIP AG, Jülich, Germany) was applied for online monitoring. Temperature of
37 °C was controlled by the bioblock temperature control system TC4 (DASGIP AG, Jülich,
Germany). A constant pH of 6.5 was maintained by on-line measurement with a pH electrode (Mettler
Toledo, Gießen, Germany) in combination with the system PH4PO4 and 1 M Na2CO3 applying the
miniature peristaltic pump of module MP8 (DASGIP AG, Jülich, Germany). The pumped volume was
automatically monitored during batch fermentation. Anaerobic conditions, i.e. dissolved oxygen levels
below 2 %, were adjusted by CO2-sparging with 0.1 NL h-1
. The conditions were verified by a pO2
electrode (Visiferm™ DO sensor, Hamilton, Bonaduz, Switzerland) using the DASGIP system
PH4PO4. The cultivation was operated at 37 °C, 500 rpm and a controlled pH set-point of 6.5. The
applied minimal medium E was inoculated with freshly grown cells from 100 mL serum bottles,
containing 50 mL cultivation broth with 30 g L-1
MgCO3. The cells were harvested (8500 x g, 4 °C
and 5 min), washed with prepared fresh culture minimal medium and subsequently used as inoculum.
Batch fermentations were started at an optical density of 0.3.

Material and Methods
36
4.5 Analytical procedures
4.5.1 Cell concentration
During cultivation, the cell concentration was measured as optical density by spectrometry (Libra S11,
Biochrome, Cambridge, UK) at 600 nm (OD600) in 1.6 mL semi-micro cuvettes (Sarstedt, Nümbrecht,
Germany). To remove residual MgCO3 and to obtain optical density values between 0.05 and 0.3, cells
were appropriately diluted with 1 M HCl. Exact dilution factors were determined gravimetrically on
an analytical balance (CP225D, Sartorius, Göttingen, Germany).
4.5.2 Quantification of glucose
Supernatants from culture broth were obtained by centrifugation (16,000 x g, 4 °C and 5 min). The
analytical quantification of glucose concentration was carried out enzymatically using the STAT 2300
Plus™ (YSI Life Sciences, Yellow Springs, OH, USA) after diluting samples with water as described
above.
4.5.3 Quantification of organic acids
Culture supernatants were prepared as described above. Organic acids and ethanol were quantified
using HPLC (LaChromElite, VWR Hitachi, West Chester, PE, USA) employing an Aminex HPX-87H
column (300 x 7.8 mm; BioRad, Hercules, CA, USA) as stationary phase and 12 mM H2SO4 as mobile
phase at 0.5 mL min-1
and 45 °C. The compounds were detected using refractive index (RI).
4.5.4 Quantification of intracellular amino acids
Intracellular amino acids were quantified from cell extracts (see 4.5.8) with α-aminobutyric acid as
internal standard. The analysis was performed by HPLC (Agilent Series 1200; Agilent Technology,
Waldbronn, Germany) as previously described (Krömer et al. 2005). Analytes were derivatized prior
to injection, using o-phthaldialdehyde (OPA) and subsequently separated on a RP column (Gemini 5μ
C18 110A, 150 x 4.6 mm; Phenomenex, Aschaffenburg, Germany) equipped with a precolumn
(Gemini C18, MAX-RP, 4 x 3 mm; Phenomenex, Aschaffenburg, Germany) as stationary phase.

Material and Methods
37
Table 4.22 Profile of mobile phase gradient applying eluent A (40 mM NaH2PO4, pH 7.8) and eluent B (45 % acetonitrile,
45 % methanol, 10 % MilliQ) for separation and quantification of intracellular amino acids.
Time [min] Eluent A [%] Eluent B [%]
0.0 100.0 0.0
40.5 59.5 40.5
41.0 39.0 61.0
43.0 39.0 61.0
57.5 0.0 100.0
59.5 0.0 100.0
60.5 25.0 75.0
61.5 50.0 50.0
62.5 75.0 25.0
63.5 100.0 0.0
65.5 100.0 0.0
Separation of amino acids was obtained by a gradient (Table 4.22) of applied mobile phase A (40 mM
NaH2PO4, pH 7.8) and B (45 % acetonitrile, 45 % methanol, 10 % MilliQ) at 1 mL min-1
and 40 °C.
OPA-derivated amino acids were detected using a fluorescence detector (340 nm excitation, 540 nm
emission; Agilent, Waldbronn, Germany).
4.5.5 Analysis of mass isotopomers by GC/MS
The mass isotopomer fractions of proteinogenic amino acids from biomass and of succinate from
culture broth supernatant were determined by GC-MS (Wittmann et al. 2002). About 1 mg biomass,
harvested from exponentially growing cells, was washed with 1 M HCl until MgCO3 was completely
removed. The cells were then hydrolyzed in 100 µL 6 M HCl for 24 h at 105 °C. Insoluble matter was
cleared by filtration (Ultrafree-MC filter devices, 0.22 μm durapore membrane; Millipore, Billerica,
MA, USA). Afterwards, the filtrate was dried under ambient nitrogen stream, resuspended in 50 µL
dimethylformamid (0.1 % pyridine) and derivatized with 50 µL N-methyl-N-tert-butyl-dimethylsilyl-
trifluoracetamid (MBDSTFA; Macherey-Nagel, Düren, Germany) for 30 min at 80 °C. Possible salt
precipitates were eliminated by centrifugation (1,177 x g, room temperature and 1 min). The labeling
pattern of succinate was measured from dried culture supernatants (Becker et al. 2013), which were
processed analog to the biomass procedure. The measurement of mass isotopomers was conducted
with a GC/MS system, consisting of a HP 6890 gas chromatograph (Hewlett Packard, Paolo Alto,
California, USA) employed with an HP-5MS GC column (5%-Phenyl-methylpolysiloxane; 30 m x
0.25 mm x 0.25 µm; Agilent, Waldbronn, Germany) and a quadrupole MS 5973 (Agilent, Waldbronn,
Germany) for detection. Helium was applied as carrier gas with a flow rate of 1.7 mL min-1
. The inlet
temperature was set to 250 °C, interface and quadrupole temperature were set to 280 °C. Electron
ionization was performed at 70 eV. The injection volume was 1 µL and each sample was measured in
duplicate. A potential isobaric interference of the analytes and matrix components was checked by first
measurements in scan mode. Labeling patterns of amino acids were then determined by selective ion

Material and Methods
38
monitoring (SIM) of preferred ion clusters after GC-separation using a temperature gradient
(Table 4.23).
Table 4.23 Temperature profile of GC oven for measurements of labeling patterns of amino acids and succinic acid.
Time [min] Temperature [°C]
0.0 120
2.0 120
12.0 200
24.5 325
27.0 325
Table 4.24 Mass fragments of analytes as MBDSTFA derivates used for flux calculation.
Analyte M0 (m/z) Fragment Carbon atoms
Alanine 260 M-57 C1 – C3
232 M-85 C2 – C3
Glycine 246 M-57 C1 – C2
218 M-85 C2
Aspartate 418 M-57 C1 – C4
390 M-85 C2 – C4
Threonine 404 M-57 C1 – C4
376 M-85 C2 – C4
Serine 390 M-57 C1 – C3
362 M-85 C2 – C3
Phenylalanine 336 M-57 C1 – C9
Tyrosine 466 M-57 C1 – C9
Succinate 289 M-57 C1 – C4
Amino acids and succinate were identified via retention time and fragmentation pattern from a
standard of amino acids and succinate, respectively. The fragments [M-57] and [M-85] specific for
MBDSTFA derivatization were taken for flux determination (Table 4.24).
4.5.6 Genome sequencing of B. succiniciproducens strains
Next generation sequencing was performed by the company BaseClear B.V. (Leiden, Netherlands). In
a first step, 50 bp single reads were generated using the Illumina HiSEQ2500 platform and compiled
to FASTQ sequence reads applying Illumina Casava pipeline (version 1.8.2), accompanied by two
quality assessments (Illumina Chastity filtering and FASTQC quality control 0.10.0). Subsequent de
novo assembly was performed with CLC Genomics Workbench (version 5.0; Aarhus, Denmark).
Afterwards, the DD1 contigs (reference) were annotated using Genostar’s IOGMA based on the
MicroB database (Montbonnet, France) integrating several online databases. All other genomes were
aligned to the DD1 genome and subsequently, polymorphisms were analyzed using CLC Genomics

Material and Methods
39
Workbench (version 5.1; Aarhus, Denmark). The calling of false positive was reduced by minimizing
the variant frequency to 75 % and setting the coverage to five.
4.5.7 Gene expression analysis
Preparation of total RNA
During bioreactor cultivation, cells were harvested and 14 mL cell suspension was mixed with 2 mL
RNA Later® (Ambion
® Life Technologies, Darmstadt, Germany) and subsequently aliquoted to 2 mL
reaction tubes. After centrifugation (16,000 x g, room temperature and 20 sec) the supernatant was
carefully discarded. The cell pellet was immediately frozen in liquid nitrogen and stored at -80 °C
until further processing. The column based RNA preparation was performed with the RNeasy® Plus
Mini Kit (Qiagen, Hilden, Germany). The individual steps of the purification were performed
according to the manufacturer’s protocol. Prior to RNA extraction, cell pellets were lyophilized
overnight (Alpha 1-4 LD plus, Christ, Osterode, Germany). The dried cell pellets were then transferred
into 1 mL cryo-tubes (Nalgene Nunc, Rochester, NY, USA) each containing a grinding ball (diameter:
10 mm; Sartorius Stedim, Göttingen, Germany), and cooled in liquid nitrogen. The biomass was then
homogenized using a laboratory ball mill (Mikro-Dismembrator S, Sartorius Stedim, Göttingen,
Germany) at 3000 min-1
for 10 sec. The disrupted cells were resuspended in 600 µL lysis buffer (RLT
Plus, containing 1 % v/v ß-mercaptoethanol), gently mixed by inversion and transferred into a new
1.5 mL reaction tube, followed by 2 min incubation at 56 °C. The complete lysis solution was then
transferred to a QiaShredderTM
column (Qiagen, Hilden, Germany) and centrifuged (10,000 x g, room
temperature and 30 sec). The flow-through was directly transferred to a gDNA eliminator column and
centrifuged (10,000 x g, room temperature and 30 sec), followed by the addition of 600 µL ethanol
(70 %). After mixing carefully, the solution was transferred in two steps to an RNeasy mini column
and centrifuged (10,000 x g, room temperature and 15 sec). The flow through was discarded and the
column was washed once with RW1 buffer. A volume of 80 µL of a freshly prepared DNase solution
(10 µL DNase I stock solution plus 70 µL RDD buffer; Qiagen, Hilden, Germany) was added to the
column, which was placed into a new 1.5 mL reaction tube and subsequently incubated (600 sec-1
,
28 °C and 30 min). Afterwards, the column was washed with 350 µL RW1 buffer, placed into a new
2 mL reaction tube, followed by three additional washing steps applying 500 µL buffer RPE
(10,000 x g, room temperature and 2 min). RNA was eluted into a sterile 1.5 mL reaction tube by
centrifugation (10,000 x g, room temperature and 2 min) within three steps using each 20 µL RNA
free water. Purified RNA was stored at -80 °C. RNA quantification was performed using the
Nanodrop®-Spectrophotometer ND-1000 (Thermo Fisher Scientific Inc., Waltham, MA, USA),
followed by an 1.5 % agarose gel based quality control. Specific RNA quality was controlled using the

Material and Methods
40
RNA 6000 Nano LabChip Kit with the 2100 Bioanalyzer (Agilent, Santa Clare, CA, USA). Quality
criteria were set to a 23S/16S ratio higher than 1.5 and a RNA integrity number (RIN) above 8.
DNA microarray analysis
Comparative gene expression analysis was realized by application of a customized DNA microarray.
For this purpose, all annotated genes derived from B. succiniciproducens genome sequencing were
compiled and used for the array design in the online software Agilent eArray
(https://earray.chem.agilent.com/). The employed format was an 8 x 15 k slide containing 8 arrays
with a maximum of 15,000 probes. The oligonucleotide probe design was carried out applying
following parameters: (i) preferred probe length of 60 bp, (ii) 3 probes per target gene, (iii) double
coverage of all target genes, (iv) antisense probe orientation, and (v) melting temperature of 80 °C.
The customized DNA microarray featured 14152 probes, whereas 536 Agilent probes served as
control and 13616 probes represented three replicates of each target gene in twofold coverage.
Fluorescence labeling was completed via direct chemical labeling of 1 µg purified RNA using the
ULS Fluorescent Labeling Kit (Kreatech Diagnostics, Amsterdam, Netherlands) according to its
protocol. Quality control of labeling degree was obtained with the Nanodrop®-Spectrophotometer ND-
1000 (Thermo Fisher Scientific Inc., Waltham, MA, USA) after removing residual labeling agent with
KREApure columns (Kreatech Diagnostics, Amsterdam, Netherlands). 300 ng of the Cy3 or Cy5
labeled RNA were fragmented in blocking agent and fragmentation buffer (Agilent, Santa Clare, CA,
USA) for 30 minutes at 60 °C. The competitive hybridization was obtained by mixing equal amounts
of differently labeled RNA, priorly diluted in 25 µL hybridization buffer, respectively. Then, 40 µL of
a total of 50 µL mixture were used to load a gasket well on the gasket slide. After completing this step
for all samples, the gasket slide was assembled with the microarray and hybridized (10 rpm, 65 °C and
17 h). After incubation, the microarray was disassembled and washed for 1 min in gene expression
buffer 1 (Agilent, Santa Clare, CA, USA), followed by 1 min incubation in pre-warmed gene
expression buffer 2. Microarray analysis was performed with the Agilent C Scanner (Agilent, Santa
Clare, CA, USA) at 532 nm and 635 nm. Scanning and extraction was conducted using the Agilent
Scan Control and Feature Extraction software (Agilent, Santa Clare, CA, USA). Extracted raw data
was further processed using R programming language and bioconductor (Yang and Paquet 2005). For
gene specific data interpretation, genes from three biological replicates exhibiting a p value < 0.05
combined with a |log2FC| > 0.8, describing a 1.7 fold change, were considered to be differentially
expressed concerning operon regulation. Single gene expression relevance was set to a fold change of
2.0. A global perspective of gene expression was gained using the gene set enrichment analysis
(GSEA) tool (Subramanian et al. 2005) comprising all COG assigned genes according to
M. succiniciproducens annotation (Hong et al. 2004). For this purpose 2291 designated gene
sequences were taken from the DNA chip design, whereof 1900 genes could be assigned to proposed
Material and Methods
41
gene clusters. For each GSEA analysis, 1000 permutations were conducted with the gene set as
permutation type, while the genes were ranked according to the metric log2 values. Significantly
changed gene sets were determined by p-values below 0.01 and a false discovery rate below 5 %.
4.5.8 Metabolome analysis
Sampling by fast filtration
Intracellular amino acids were sampled by fast filtration, adapted from a validated protocol for other
microorganisms (Bolten et al. 2007). Hereby, 2 mL exponentially growing cells from minimal glucose
medium cultures were harvested by vacuum filtration (cellulose nitrate filter, 0.2 μm pore size,
diameter 25 mm; Sartorius, Göttingen, Germany). Sampling included an additional washing step with
5 % NaCl solution. The whole procedure was finished in less than 30 sec. Sampling was conducted at
two cell concentrations, corresponding to OD600 of 3 and 5, respectively. Cultivations were performed
with two biological replicates.
Metabolite extraction
The filter with attached cells was used for metabolite extraction. For this purpose, it was incubated for
with 2 mL α-aminobutyric acid (200 µM) as internal standard for quantification in a sealable plastic
cup (15 min in boiling water). Subsequently, the extraction mix was cooled down on ice. The
suspension was transferred into a sterile 2 mL reaction tube and centrifuged (13,000 x g, 4 °C and
5 min). Finally, the obtained extract was directly used for intracellular amino acid quantification or
stored at -20 °C until further processing.
4.5.9 Enzyme activity assays
Preparation of crude cell extract
Cells were harvested by centrifugation (10,000 x g, 4 °C and 5 min). To avoid residual MgCO3, cells
pelleting above the insoluble MgCO3 from the medium, were removed with a spatula and washed with
ice-cold 250 mM citric acid. A second washing step was then conducted, whereby the washing
solution was chosen according to the need of the subsequent assay. Afterwards, cells were
resuspended in the respective buffer. Cell disruption was carried out after adding two spatula tips of
glass beads (0.10 – 0.25 mm; Retsch, Haan, Germany) to 500 µL of cell suspension in 2 mL reaction
tubes with a laboratory ball mill (30 sec-1
for 30 sec; Mikro-Dismembrator S, Sartorius Stedim,

Material and Methods
42
Göttingen, Germany). The cell debris was separated by centrifugation. The obtained supernatant was
then used for enzyme assays and quantification of protein concentration.
Determination of protein concentration
Protein concentration of crude cell extracts was determined with the PierceTM
BCA Protein Assay Kit
(Thermo Fisher Scientific, Waltham, MA, USA). For calibration purposes, a bovine serum albumin
stock solution was diluted according to the protocol. Cell extracts were diluted 1:10. Samples and
standards were subsequently mixed with prepared working reagent. After incubation (37 °C and
30 min) the absorption was measured by spectrometry at 562 nm. The respective protein concentration
was calculated with the slope of a standard curve, obtained by plotting the measurement of each
standard versus its concentration.
Pyruvate kinase activity assay
The washing buffer consisted of 100 mM TRIS HCl (pH 7.0). Pyruvate kinase activity assays were
performed at 37 °C in a total volume of 200 µL in 96-well plates employing the micro titer plate
reader SUNRISE (Tecan, Crailsheim, Germany). The reaction mix contained 15 mM MgCl2, 1 mM
ADP, 0.25 mM NADH, phosphoenolpyruvate (PEP), 5.5 U mL-1
lactate dehydrogenase and 2.5 µL
cell extract. For enzyme kinetic studies, PEP was added to a final concentration of 1, 2.5, 5, 10, 25, 50
and 75 mM, respectively. Negative controls were carried out without PEP and without cell extract,
respectively. The decline of NADH extinction was monitored at 340 nm (MagellanTM
data analysis
software; Tecan, Crailsheim, Germany). All experiments were carried out with three biological
replicates. The extinction coefficient for NADH at 340 nm is 6,220 M-1
cm-1
. One unit of enzyme
activity correlates to the amount of enzyme catalyzing the conversion of one micro mole of substrate
per minute.
4.5.10 Metabolic flux analysis
Metabolic flux experiments were carried out with [1-13
C] glucose as tracer substance and with two
biological replicates. For minimizing effects of unlabeled biomass, the second pre-culture was already
conducted on [1-13
C] glucose. The metabolic network for B. succiniciproducens was taken from
Becker et al. 2013. It contained all essential reactions for succinate formation based on glucose.
Reversible reactions were defined as netto fluxes. Pyruvate and PEP, as well as oxaloacetate (OAA)
and malate (Mal), respectively, were lumped into joint metabolite pools each, because the fluxes

Material and Methods
43
between the single pools could not be resolved by the applied tracer substance [1-13
C] glucose
(Wittmann and Heinzle 2001a). Anabolic precursor demand was calculated from cellular composition
of B. succiniciproducens biomass (Becker et al. 2013). The labeling data of the proteinogenic amino
acids and of succinate from culture supernatant (Table 4.24), respectively, were combined with
stoichiometric data (biomass yield, succinate yield, by-product yields and glucose uptake) from at
least three biological replicates for calculation of metabolic fluxes. The simulation of metabolic fluxes
was performed with an OpenFlux implementation (Quek et al. 2009) in MATLAB 7.6 (Mathworks
Inc., Natick, MA, USA). OpenFlux directly corrected the raw mass spectrometry data for natural
isotope abundance and fitted unknown flux parameters from the labeling data by isotopomer and
metabolite balancing. The iterative fitting process finally generates a set of fluxes with minimized
deviation between simulated and measured isotopomers, which was considered as best calculated
intracellular flux distribution (Wittmann et al. 2002; Wittmann 2007). Statistical evaluation of the
fluxes was conducted by a Monte-Carlo approach. Flux estimation from 50 independent calculations
was used to determine 90 % confidence intervals for the flux parameters.
4.5.11 Phenotypic microarray analysis
Phenotypic characterization of B. succiniciproducens was conducted by the Omnilog® PM system
(Biolog, Hayward, CA, USA), using the carbon source plates PM1 and PM2 provided by the
manufacturer. Cells were obtained by overnight incubation in liquid BHI medium. Then, 100 µL of the
suspension was plated on BHI-MOPS agar plates and incubated for 24 h at 37 °C. Further processing
was conducted according to the manufacturer’s protocol using the Redox Dye Mix D (Biolog,
Hayward, CA, USA). 100 µL cell suspension was pipetted into each well. The prepared plates were
wrapped in gas-tight bags (Biolog, Hayward, CA, USA), equipped with CO2Gen paper sachets
(Oxoid, Thermo Fisher Scientific, Waltham, MA, USA) to create a carbon dioxide rich atmosphere
and subsequently sealed with tape. Data acquisition was carried out for 48 h at 37 °C. Each type of
plate was incubated as duplicate and the metabolic activity was analyzed by the area under curve
(AUC) applying the opm package implemented in R (Vaas et al. 2012).

Results and Discussion
44
5 Results and Discussion
The present work aimed at the development of superior strains of B. succiniciproducens for bio-
succinate production. Beyond previous rational, metabolic engineering strategies for reduced by-
product formation and enhanced product yield (Becker et al. 2013), this bacterium should be improved
towards better process robustness, a key to its successful implementation into industrial production. As
molecular mechanisms, that could provide enhanced tolerance to specific process configurations, are
unknown, an evolutionary strategy was chosen to design superior phenotypes of interest.
5.1 Production performance and basic physiological properties of
B. succiniciproducens
First experiments focused on the characterization of basic physiology of B. succiniciproducens. Its
tolerance to extreme temperature, product concentration and pH-values should provide an insight into
its natural robustness and possible strategic points for evolutionary adaptation.
Figure 5.1 Growth (A) and production (B) performance of (●) B. succiniciproducens DD1 and its engineered derivative (▲)
B. succiniciproducens DD3 in minimal glucose medium. Data and standard deviations derive from three biological replicates.
The comparison of B. succiniciproducens DD1 and DD3, grown in minimal media, clearly illuminates
the advantage of the rational strain development (Figure 5.1). The specific succinate yield of DD3 was
increased by about 50 %, as compared to the wild-type (Table 5.1). Unfortunately, this improvement
went along with detrimental growth effects. Deletion of lactate and formate pathways unbalanced the
metabolic redox state, which is obviously linked to biomass formation, as observed from the decreased
specific biomass yield and specific growth rate.

Results and Discussion
45
Table 5.1 Physiology of B. succiniciproducens DD1 and DD3. The data comprise specific growth rate (µ), biomass yield
(YX/S), succinate yield (YSuc/S), formate yield (YFor/S), acetate yield (YAce/S), lactate yield (YLac/S), ethanol yield (YEtOH/S),
pyruvate yield (YPyr/S) and maximal succinate productivity (PSuc). Data represent values from three biological replicates
during exponential growth in complex and in minimal glucose medium with corresponding standard deviations.
Complex medium Minimal medium
DD1 DD3 DD1 DD3
µ [h-1] 0.64 ± 0 0.19 ± 0.01 0.29 ± 0.01 0.16 ± 0.01
YX/S [g mol-1] 62.4 ± 3.1 43.7 ± 3.3 35.6 ± 0.2 29.8 ± 2.5
YSuc/S [mol mol-1] 0.77 ± 0.02 1.18 ± 0.03 0.76 ± 0.03 1.13 ± 0.04
YFor/S [mol mol-1] 0.97 ± 0.02 < 0.01 0.58 ± 0.02 < 0.01
YAce/S [mol mol-1] 0.83 ± 0.05 0.34 ± 0.01 0.57 ± 0.01 0.21 ± 0.06
YLac/S [mol mol-1] < 0.01 < 0.01 0.03 ± 0 < 0.01
YEtOH/S [mol mol-1] 0.15 ± 0.01 < 0.01 0.03 ± 0 < 0.01
YPyr/S [mol mol-1] < 0.01 22.6 ± 0.02 < 0.01 0.16 ± 0.03
PSuc [g L-1 h-1] 1.31 ± 0.05 1.12 ± 0.07 1.42 ± 0.04 0.76 ± 0.01
The yields were determined by linear fitting of the concentration of biomass and product with that of the substrate.
Regarding the evolutionary adaptation approach, DD3, exhibiting a high specific yield for succinate
seemed to be the most promising candidate. In addition, deletion of by-product pathways narrowed the
degrees of freedom of the selection pressure down, i.e. cells can no longer adapt by redirection of flux
into non-beneficial redox balancing.
Impact of high temperature
The cultivation temperature is a relevant process parameter. It strongly affects overall production costs
by the linkage to microbial kinetics, i.e. productivity and by the efforts for cooling needs. In addition,
temperatures beyond the growth optimum of contaminants can minimize the contamination risk.
Figure 5.2 Influence of temperature on growth of the wild-type B. succiniciproducens DD1 in (●) complex medium A and
(○) minimal medium F. The data represent mean values of three biological replicates with standard deviations. The growth is
given as exponential growth rate at each temperature (µ).

Results and Discussion
46
To this extent, the influence of temperature on B. succiniciproducens DD1 was evaluated in growth
experiments in serum bottles and within a temperature range of 30 °C to 45 °C (Figure 5.2). Hereby,
complex and minimal medium were applied. Temperatures below 37 °C decreased DD1 proliferation.
At 30 °C, the specific growth rate was only 50 % of that at 37 °C. However, the strain was able to
grow exponentially in complex and minimal medium, respectively, while producing succinate as main
fermentation product. The maximal performance, regarding growth rate, succinate yield and
productivity was observed between 37 and 39 °C reflecting the temperature of bovine rumen, the
natural habitat of the bacterium. Under these conditions, DD1 produced almost 30 g L-1
succinate in
24 h, while additionally forming lower amounts of acetate, formate and lactate. A cultivation
temperature of 42 °C fully inhibited growth in minimal medium. Here, only an initial increase in cell
concentration could be observed. Complex medium still enabled growth at 42 °C, however, at a
drastically reduced growth rate. This implies specific metabolic pathways that probably relate to
biosynthesis, which fail at 42 °C, but can be compensated by complex medium ingredients. This
would also fit to the initial phase of growth in minimal medium. Here, intracellular pools of affected
metabolites, derived from pre-cultures, could provide a reservoir, which then rapidly depletes. At
45 °C, DD1 showed no growth in both media. The obtained results agreed with the growth behavior of
other mesophilic bacteria, obviously linked to the natural habitat of B. succiniciproducens and its
phylogenetic relatives (Scholten and Dägele 2008; Lee et al. 2002). The increased temperature
tolerance by complex nutrients appeared promising with regard to the planned evolutionary
adaptation, as the bacterium showed basic robustness with selective sensitive pathways.
As shown, B. succiniciproducens DD1 revealed severe growth problems when cultivated in minimal
medium at elevated temperatures (Figure 5.2). Considering this effect, the support of growth
performance was first rationally analyzed by adding defined compounds (Table 5.2). The chosen
amino acids have been previously identified as stimulatory or even essential for M. succiniciproducens
MBEL55E (Song et al. 2008). Methionine seemed promising, since the first enzyme in methionine
synthesis, homeserine O-transsuccinylase, is heat-sensitive in E. coli (Ron and Davis 1971;
Mordukhova et al. 2008). In addition, compatible solutes were selected, due to the mediation of
temperature tolerance in bacteria (Arakawa and Timasheff 1985; Lippert and Galinski 1992; Caldas et
al. 1999; Bourot et al. 2000).
None of the amino acid could restore growth at 42 °C (Table 5.2). Among the compatible solutes, only
glycine betaine enabled growth of DD1 at 42 °C, whereas the other supplements had no effect. This is
coherent with observations that glycine betaine prevents temperature-induced protein aggregation
(Caldas et al. 1999) and induces increased thermal stability (Arakawa and Timasheff 1985; Lippert
and Galinski 1992).

Results and Discussion
47
Table 5.2 Impact of specific medium ingredients on growth of B. succiniciproducens DD1 at 42°C in defined glucose-based
medium.
Compound Concentration [mM] Growth
Alanine 5 -
Asparagine 5 -
Aspartic acid 5 -
Cystein 5 -
Methionine 5 -
Proline 5 -
Glycine betaine 1 +
Ectoine 1 -
Hydroxyectoine 1 -
This finding suggested that temperature sensitivity of B. succiniciproducens DD1 was mainly caused
by denatured proteins. Recapitulating, the addition of glycine betaine that is already applied in animal
feedstuff and agro industry (Mäkelä 2004), appeared as one straightforward possibility to improve
process performance of B. succiniciproducens. But, as this would add extra costs to the process,
evolutionary adaptation was performed next to eventually create a new temperature phenotype.
Impact of high succinate levels
The product titer represents a key performance indicator of industrial competitiveness of bioprocesses
and is highlighted in various reports as major prerequisite, i.e. desired values of about 100 g L-1
(Werpy and Peterson 2004; Patel et al. 2006; Bastidon 2012). In this line, product tolerance displays a
target for improvements. Indeed, succinate producers show sensitivity to high levels of succinate
(Table 5.3) and the inhibition can be described by a linear relationship (Equation 1) (Lin et al. 2008).
Table 5.3 Succinate tolerance of succinate producing bacteria.
Strain Medium Succinate [g L-1] Reference
Actinobacillus succinogenes Complex (Glc, YE, Vit) 104.6 a (Lin et al. 2008)
Actinobacillus succinogenes 130Z Complex (Glc, Cas, SP) 50 b (Li et al. 2010)
Escherichia coli AFP111 Complex (Glc, YE, T) 80 b (Li et al. 2010)
Mannheimia succiniciproducens
MBEL55E LPK7 Complex (Glc, YE) 5.1 a (Hoon et al. 2010)
Basfia succiniciproducens DD3 Minimal (Glc, Vit) 19.1 a this work
Medium components: Glc: glucose, YE: yeast extract, Cas: pancreatic digested casein, SP: soy peptone, T: tryptone, Vit:
vitamins. a depicts calculated critical succinate concentration according to Lin et al. 2008 b shows experimental data for tolerated final concentration of succinate for the growth according to Li et al. 2010
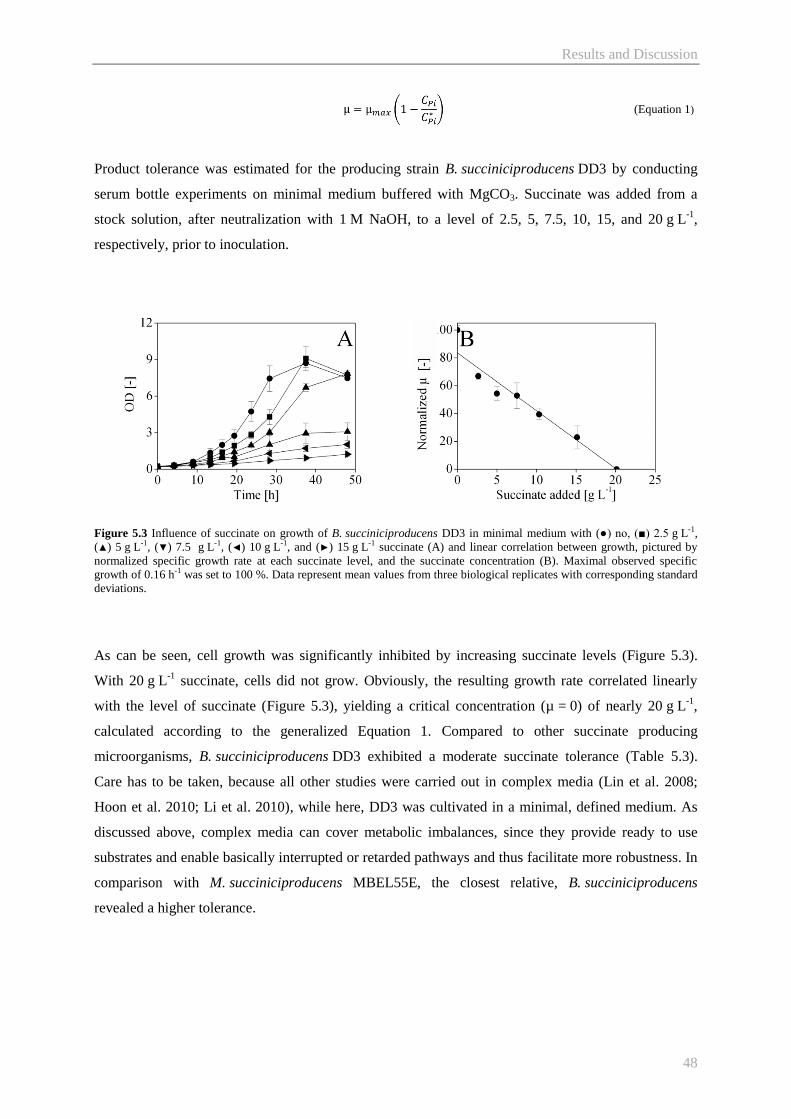
Results and Discussion
48
Product tolerance was estimated for the producing strain B. succiniciproducens DD3 by conducting
serum bottle experiments on minimal medium buffered with MgCO3. Succinate was added from a
stock solution, after neutralization with 1 M NaOH, to a level of 2.5, 5, 7.5, 10, 15, and 20 g L-1
,
respectively, prior to inoculation.
Figure 5.3 Influence of succinate on growth of B. succiniciproducens DD3 in minimal medium with (●) no, (■) 2.5 g L-1,
(▲) 5 g L-1, (▼) 7.5 g L-1, (◄) 10 g L-1, and (►) 15 g L-1 succinate (A) and linear correlation between growth, pictured by
normalized specific growth rate at each succinate level, and the succinate concentration (B). Maximal observed specific
growth of 0.16 h-1 was set to 100 %. Data represent mean values from three biological replicates with corresponding standard
deviations.
As can be seen, cell growth was significantly inhibited by increasing succinate levels (Figure 5.3).
With 20 g L-1
succinate, cells did not grow. Obviously, the resulting growth rate correlated linearly
with the level of succinate (Figure 5.3), yielding a critical concentration (µ = 0) of nearly 20 g L-1
,
calculated according to the generalized Equation 1. Compared to other succinate producing
microorganisms, B. succiniciproducens DD3 exhibited a moderate succinate tolerance (Table 5.3).
Care has to be taken, because all other studies were carried out in complex media (Lin et al. 2008;
Hoon et al. 2010; Li et al. 2010), while here, DD3 was cultivated in a minimal, defined medium. As
discussed above, complex media can cover metabolic imbalances, since they provide ready to use
substrates and enable basically interrupted or retarded pathways and thus facilitate more robustness. In
comparison with M. succiniciproducens MBEL55E, the closest relative, B. succiniciproducens
revealed a higher tolerance.
(Equation 1)

Results and Discussion
49
Impact of low pH-value
The industrial relevance of the pH-value results from specific downstream processing needs for
organic acids. These are typically recovered from fermentation broth using calcium salts for
precipitation (Kurzrock and Weuster-Botz 2010). After precipitation, the calcium salt of succinic acid
has to be acidified for further preparations. This step requires large amounts of sulfuric acid, which
can be reduced by a lower final fermentation pH. In special cases, calcium carbonate can be applied,
which advantageously combines pH buffer function and carbon dioxide supply. This is beneficial for
fermentative succinate production, but causes a slightly acidic pH of 5.8 in the medium under carbon
dioxide saturated conditions.
Figure 5.4 Growth of B. succinicproducens at (●) pH 6.0, (■) pH 5.5 and (▲) pH 5.3 in defined medium F during a pH-
controlled cultivation.
To unravel the influence of an acidic pH on the growth behavior of B. succiniciproducens, the
producing strain DD3 was grown at different pH-values in pH-controlled bioreactors applying
minimal medium (Figure 5.4). While pH 6.0 allowed reasonable growth, pH 5.5 caused a pronounced
lag-phase of about 15 h and slower growth. At a pH of 5.3, growth was almost fully inhibited. Further
decrease to pH 5.0 completely eliminated growth of the cells. In addition to growth, the succinate
production was severely inhibited by low pH. Whereas about 33 g L-1
succinate were achieved at pH
6.0, only 9 g L-1
were produced at pH 5.5. No succinate production occurred at the lowest pH-value of
5.3.

Results and Discussion
50
5.2 Evolutionary adaptation of B. succiniciproducens DD3 towards high
temperature
5.2.1 Evolutionary adaptation towards a new temperature phenotype
The addition of single media supplements indicated the complexity of temperature sensitivity, since no
single substance could overcome the growth inability at 42 °C. In this line, growth recovery at
elevated temperatures was tackled by evolutionary adaptation. This approach generates novel
phenotypes, which emerge under specific imposed conditions by natural selection of the fittest. As
starting point, the double knockout mutant B. succiniciproducens DD3, lacking the ldhA and pflD
genes to eliminate formation of lactate and formate appeared most promising. Despite its slower
growth performance, DD3 has a 50 % increased succinate yield as compared to the wild-type (Becker
et al. 2013). In this regard, DD3 possessed a high potential for valuable phenotype improvement. The
lack of by-product forming pathways to lactate and formate reduced the adaptation probability of
redirecting carbon flux into undesired redox balancing pathways. The following evolutionary
adaptation was conducted in minimal medium to avoid accumulation of side-mutations in bio-
synthetic pathways that would not have been recognized in complex medium. In order to realize the
evolutionary adaptation, B. succiniciproducens DD3 was cultivated applying a repeated batch method.
The formed cell concentration served as criterion to evaluate the adapted population. The cultivation
time of each of the batches was extended until a cell concentration was reached, equivalent to OD600 of
5. The adaptation was started at 40 °C. Initial cell growth was remarkably retarded, which was
validated by low specific growth rates (Figure 5.5).
Figure 5.5 B. succiniciproducens DD3 adaptation towards 42 °C. The color legend visualizes the temperature during each
batch of the evolutionary adaptation from 40 °C to 42 °C. The bar-chart represents the normalized specific growth rate,
referring to the standard cultivation of DD3 in minimal medium (µ = 1) at 37 °C.

Results and Discussion
51
After 10 iterations however, the growth rate increased substantially. At this point, five clones were
isolated from the heterogenic culture and briefly screened for their performance. As they showed
identical growth properties, one of the clones, determined as DD3-T1, was chosen for further
adaptation. A second adaptation round was started with the new B. succiniciproducens isolate DD3-
T1, by now gradually increasing the temperature to 42 °C. The sequential batch strategy was
continued for 50 additional iterations. While increasing the temperature, a significant improvement
was observed for cell growth (Figure 5.5). At 42 °C, the heterogenic culture was able to grow with a
nearly constant performance over several batches. Here again, clones were isolated and one of them
was designated DD3-T2. The wild-type strain could not grow under these conditions (Figure 5.2). The
overall adaptation was not extended beyond 50 iterations since most beneficial mutations accompanied
by significant phenotypic impacts occur early during adaptation, while the fitness trajectory strongly
decelerates over time (Barrick et al. 2009). Taken together, two clones with improved temperature
tolerance, i.e. DD3-T1 (40 °C) and DD3-T2 (42 °C) were created by the adaptive approach.
5.2.2 Physiological characterization of evolutionary derived phenotypes
It was now relevant to study the growth and production performance of the novel phenotypes.
Comparative cultivation studies were conducted with both isolates B. succiniciproducens DD3-T1 and
DD3-T2, and the parent strain DD3 as control (Figure 5.6). All strains were cultivated in serum bottles
in minimal glucose medium. First, potential evolutionary trade-offs were investigated by testing all
strains at 37 °C. The isolate DD3-T2 showed a significantly increased growth rate, whereas no
difference was observed between DD3 and DD3-T1 (Table 5.4). At the end of the exponential growth
phase all strains reached a similar cell concentration. The improved growth of DD3-T2 at 37 °C could
result from the prolonged adaptation to the minimal medium, as a consequence of its continuous use
during the adaptation process. For E. coli, similar effects have been described during adaptive
approaches (Blaby et al. 2012; Jantama et al. 2008). Most important, the optimized performance did
not occur at the expense of the succinate yield. The high yield of the DD3 strain could be fully
maintained in both isolates (Figure 5.6). Slight changes were found regarding the formation of acetate
and pyruvate, both originating from the phosphoenolpyruvate/pyruvate (PEP/Pyr) node. This branch
point represents a metabolic switch in various microorganisms (Sauer and Eikmanns 2005). The fast
growth and the high product yield of DD3-T2 resulted in an attractive succinate productivity of
1.09 g L-1
h-1
, whereas DD3 and DD3-T1 exhibited lower productivities of about 0.76 g L-1
h-1
each
(Table 5.4). Obviously, the adapted strains accumulated beneficial mutations. The defined medium
hereby prevented the accumulation of detrimental auxotrophies as previously observed in E. coli LB-
medium adaptations (Blaby et al. 2012).

Results and Discussion
52
Figure 5.6 Physiological characterization of the adapted B. succiniciproducens strains (■) DD3-T1 and (▲) DD3-T2
compared to the parent strain (●) DD3 at 37 °C in minimal medium F in serum bottles. The data shown comprise specific
growth rate (A), the yield for succinate (B), the yield for pyruvate (C), and the yield for acetate (D) during exponential
growth phase of three biological replicates, respectively.
A more detailed insight into the metabolic changes, e.g. loss of function or gain of function was next
screened applying phenotype microarrays.
Figure 5.7 Phenotypic fingerprint of B. succiniciproducens DD3 as well as DD3-T1 and DD3-T2. The heat map pictures
metabolic activity, whereas blue indicates no metabolic activity and green indicates high metabolic activity. The values
represent the area under the measured curve of increasing redox dye coloration. Experiments were conducted with two
biological replicates.
DD3
DD3-T1
DD3-T2
Carbon substrates Metabolic intermediates Amino acids
DD3-T1
DD3-T2
D-G
luco
se
D-L
acto
se
D-A
rab
inose
D-A
rab
ito
l
D-C
ell
ob
iose
D-F
ructo
se
D-G
ala
ctose
D-M
annose
D-R
ibose
D-X
ylo
se
Gly
cero
l
L-A
rab
inose
L-A
rab
ito
l
Mal
tose
Mal
totr
iose
Sorb
ic a
cid
Sucr
ose
Ace
tic
acid
α-K
eto
-Glu
tari
c ac
id
Cit
ric
acid
D-F
ructo
se-6
-Phosp
hat
e
D-G
luco
se-1
-Phosp
hat
e
D-G
luco
se-6
-Phosp
hat
e
Dih
ydro
xy
-Ace
tone
Form
ic a
cid
Fu
mar
ic a
icd
L-L
acti
c ac
id
L-M
ali
c ac
id
Pyru
vic
acid
Succ
inic
aci
d
Gly
cin
e
L-A
lanin
e
L-A
rgin
ine
L-A
spar
ag
in
L-A
spar
tic
Acid
L-G
luta
mic
Acid
L-G
luta
min
e
L-H
isti
din
e
L-I
sole
ucin
L-L
eucin
e
L-L
ysi
ne
L-M
ethio
nin
L-P
henyla
la
L-P
roli
ne
L-S
erin
e
L-T
hre
onin
e
L-V
ali
ne
High metabolic activity No metabolic activity

Results and Discussion
53
For this purpose, the adapted B. succiniciproducens strains were evaluated for metabolic defects or
benefits by screening for their substrate potential (Figure 5.7). The obtained phenotypic patterns
showed no significant differences and revealed that the evolutionary adaptation of
B. succiniciproducens towards increased temperature was not linked to the use of specific substrates or
their energetic metabolism. This implies a more subjacent adapting pattern, on the basis of regulatory
pathways. However, it was important to prove that no loss of function was observed for industrially
relevant substrates, such as glucose, maltose or sucrose.
In a next set of experiments, the fitness gain in growth and production performance of DD3-T1 and
DD3-T2 was compared to the parental DD3 at higher temperature. As evolved, DD3 was cultivated at
40 and 42 °C, respectively. DD3 grew at 40 °C, although at a reduced specific growth rate of 0.10 h-1
.
The adapted variant DD3-T1 grew almost twice as fast (µ = 0.17 h-1
; Figure 5.8).
Figure 5.8 Growth of (●) B. succiniciproducens DD3 at 40 °C (A) compared to (■) DD3-T1 and at 42 °C (B) compared to
(▲) DD3-T2. All cultivations were conducted as three biological replicates.
Table 5.4 Growth and production characteristics of B. succiniciproducens DD3 and the temperature adapted strains DD3-T1
and DD3-T2 during exponential phase of batch cultivations at different temperatures in glucose minimal medium. The data
given are specific growth rate (µmax), biomass yield (YX/S), succinate yield (YSuc/S), formate yield (YFor/S), acetate yield
(YAce/S), lactate yield (YLac/S), ethanol yield (YEtOH/S), pyruvate yield (YPyr/S) and maximal succinate productivity (PSuc). The
values represent mean values of three biological replicates with corresponding standard deviations.
DD3 DD3-T1 DD3-T2
37 °C 40 °C 42 °C 37 °C 40 °C 37 °C 42 °C
µmax [h-1] 0.16 ± 0.01 0.10 ± 0.02 - 0. 17 ± 0 0.15 ± 0 0.23 ± 0 0.23 ± 0
YX/S [g mol-1] 29.8 ± 2.5 28.5 ± 3.1 19.2 ± 2.2 29.2 ± 0.8 28.0 ± 0.4 29.2 ± 1.0 28.9 ± 0.5
YSuc/S [mol mol-1] 1.13 ± 0.04 1.11 ± 0.02 1.08 ± 0.12 1.14 ± 0.03 1.09 ± 0.06 1.12 ± 0.04 1.10 ± 0.05
YFor/S [mol mol-1] < 0.01 < 0.01 < 0.01 < 0.01 < 0.01 < 0.01 < 0.01
YAce/S [mol mol-1] 0.21 ± 0.06 0.28 ± 0.05 0.29 ± 0.02 0.11 ± 0.01 0.17 ± 0.01 0.28 ± 0.05 0.39 ± 0.03
YLac/S [mol mol-1] < 0.01 < 0.01 < 0.01 < 0.01 < 0.01 < 0.01 < 0.01
YEtOH/S [mol mol-1] < 0.01 < 0.01 < 0.01 < 0.01 < 0.01 0.02 ± 0.01 < 0.01
YPyr/S [mol mol-1] 0.16 ± 0.03 0.07 ± 0.00 0.11 ± 0.01 0.22 ± 0.01 0.13 ± 0.01 0.15 ± 0.03 0.09 ± 0.02
PSuc [g L-1 h-1] 0.76 ± 0.01 0.33 ± 0.12 0.16 ± 0.02 0.76 ± 0.01 0.55 ± 0 1.09 ± 0.03 1.02 ± 0.04
Yields were determined by linear fitting of the concentration of biomass and product with that of the substrate.

Results and Discussion
54
At 42 °C, DD3 did not grow, whereas DD3-T2 still propagated. Overall, succinate production
significantly declined with increasing cultivation temperature (Table 5.4). Interestingly, DD3-T2
performed identical at 42 and 37 °C and even showed superior production performance to its parent
strain. As a result of the evolutionary adaptation, the maximal temperature for succinate production
could be increased to 42 °C in minimal medium, using DD3-T2. Since no loss of function was
detected for this strain, it seemed a promising candidate for further evaluation toward its industrial
performance.
5.2.3 Metabolic pathway fluxes of B. succiniciproducens DD3-T2
The evolutionary adaptation yielded the isolation of a new, well performing production mutant, which
exceeds the performance of the parent strain regarding growth and succinate productivity. Towards a
better understanding of the molecular mechanisms that mediated the obviously improved performance,
the isolate was next analyzed by using 13
C fluxomics and transcriptomics. Thereby, fluxomic analysis
was recruited by using isotopic substrates to unravel the in vivo carbon flux distribution throughout the
core metabolism of B. succiniciproducens (Becker et al. 2013).
Figure 5.9 Growth balance during labeling experiments with B. succiniciproducens DD3-T2 was verified by metabolic (A)
and isotopic (B) steady state. Metabolic steady state was determined from linear correlation between (●) biomass and (▲)
succinate formation, respectively, and glucose consumption. Isotopic steady state was assessed by constant labeling patterns
of proteinogenic amino acids and succinate. Hereby, exemplary shown amino acids and succinate stem from different parts of
the metabolic network. M0 (non-labeled), M1 (single labeled) and M2 (double labeled) represent the relative fraction of
corresponding isotopomers of (○) alanine, (□) glycine, (Δ) serine, ( ) phenylalanine, (◊) aspartate, and (x) succinate.
B. succiniciproducens DD3-T2 producing significant amounts of succinate at 42 °C, strongly differed
from its performance from DD3 and also from its direct predecessor DD3-T1 (Table 5.4). Labeling
data of proteinogenic amino acids from the cultivations with [1-13
C] glucose, together with
stoichiometric data of biomass and product formation (Table 5.4) and of anabolic demands (Table 9.1)
were used to compute the fluxes. The excellent fit of experimental and simulated labeling data
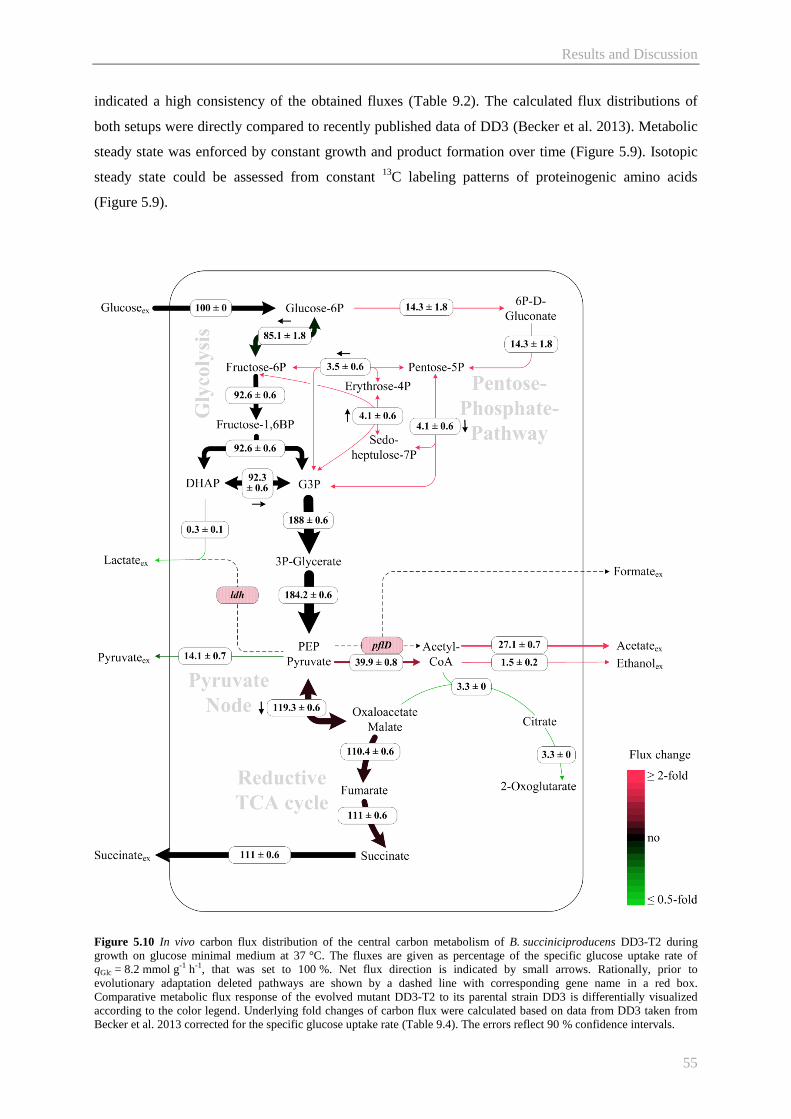
Results and Discussion
55
indicated a high consistency of the obtained fluxes (Table 9.2). The calculated flux distributions of
both setups were directly compared to recently published data of DD3 (Becker et al. 2013). Metabolic
steady state was enforced by constant growth and product formation over time (Figure 5.9). Isotopic
steady state could be assessed from constant 13
C labeling patterns of proteinogenic amino acids
(Figure 5.9).
Figure 5.10 In vivo carbon flux distribution of the central carbon metabolism of B. succiniciproducens DD3-T2 during
growth on glucose minimal medium at 37 °C. The fluxes are given as percentage of the specific glucose uptake rate of
qGlc = 8.2 mmol g-1 h-1, that was set to 100 %. Net flux direction is indicated by small arrows. Rationally, prior to
evolutionary adaptation deleted pathways are shown by a dashed line with corresponding gene name in a red box.
Comparative metabolic flux response of the evolved mutant DD3-T2 to its parental strain DD3 is differentially visualized
according to the color legend. Underlying fold changes of carbon flux were calculated based on data from DD3 taken from
Becker et al. 2013 corrected for the specific glucose uptake rate (Table 9.4). The errors reflect 90 % confidence intervals.

Results and Discussion
56
As the temperature tolerant mutant DD3-T2 revealed an increased flux into the pentose phosphate
pathway (PPP) (Figure 5.10), this might coincide with enhanced growth, because the PPP generates
NADPH, required for various biosynthetic routes (Becker et al. 2013). For Pasteurellaceae growth, its
supply even seemed to be the limiting factor (McKinlay, Shachar-Hill, et al. 2007). An increased PPP
flux could thus support better growth, as observed with the mutant. One could propose strategies to
increase NADPH supply by rational genetic engineering as previously done for the soil bacterium
C. glutamicum regarding industrial lysine production (Becker et al. 2007). The flux through the upper
glycolysis was decreased by 10 %, but the flux through the lower glycolysis remained largely
unaffected, as the PPP replenished carbon into their routes at the fructose 6-phosphate (F6P) and
glyceraldehyde 3-phosphate (GAP) node, respectively. At the PEP/Pyr node, the flux to acetate
formation increased. In more detail, the flux via pyruvate dehydrogenase (PDH) was increased by
48 % to support the more than twofold increase in acetate flux by simultaneously reducing the flux
towards pyruvate derived by-products (Table 9.4). In DD3, PDH is essential for acetyl-CoA formation
due to the lack of the pflD gene, which predominantly accounts for acetyl-CoA synthesis in the wild-
type (Becker et al. 2013). Synthesis of acetate comprises the enzymes Pta and AckA and leads to the
formation of ATP. In the close relative M. succiniciproducens MBELL55E LPK7, this pathway
mainly contributes to acetate production. Deletion of these genes negatively affected cell growth,
possibly due to ATP shortage (Lee et al. 2006). Thus, the observed flux shift towards acetate could
provide more energy from carbon (Figure 9.2), beneficial for biomass formation, while maintaining
succinate yield. Concerning the TCA cycle, the reductive and the oxidative branch, respectively,
showed no significant change in carbon flux.
It was now of interest to study the fluxes of the novel mutant DD3-T2 at 42 °C, as compared to DD3 at
37 °C. Again, the mutant revealed an increased PPP flux (Figure 5.11). A major shift in carbon flux
was observed around the highly flexible PEP/Pyr node. Flux was redirected to the formation of
acetate, at the expense of pyruvate and other pyruvate derived products (Table 9.4). This could also be
due to an enhanced need for ATP under stress conditions. The high temperature is particularly linked
to a higher energy requirement to maintain cellular processes, such as protein homeostasis (synthesis
and degradation), chaperone expression and cell-cycle control (DNA repair and cell constituent
biosynthesis) (Clarke 2003). Taken together, obvious changes in carbon fluxes of DD3-T2 indicate a
gain in function considering industrial implementation of this tolerant mutant. Furthermore, first
suggestions could be made regarding possible targets for metabolic engineering. As shown, a higher
glucose 6-phosphate (G6P) flux into the oxidative PPP for NADPH generation might contribute to
faster and thus more efficient growth. In addition, intracellular provision of energy (ATP) could
increase stress tolerance and thus improve strain robustness.

Results and Discussion
57
Figure 5.11 B. succiniciproducens DD3-T2 in vivo carbon flux distribution of the central carbon metabolism during growth
in glucose minimal medium at 42 °C. Specific glucose uptake rate qGlc = 9.1 mmol g-1 h-1 is set to 100 % and all fluxes are
given as percentage thereof. Strain specific deleted pathways are shown as dashed line with corresponding gene names in red
boxes, respectively. The flux changes are visualized as differential map, according to the color legend. Underlying fold
changes of carbon flux were calculated based on data from DD3 taken from Becker et al. 2013, corrected for the specific
glucose uptake rate (Table 9.4). The errors reflect 90 % confidence intervals.
Regarding redox balancing, NAD(P)H supply was improved with B. succiniciproducens DD3-T2, as
compared to the ancestor (Figure 9.1). However, a higher cultivation temperature revealed redox
patterns similar to these observed for DD3 under standard conditions. This indicates a metabolic
stabilization as consequence of evolutionary adaptation.

Results and Discussion
58
5.2.4 Gene expression profile of the temperature tolerant mutant B. succiniciproducens
DD3-T2
For gene expression profiling, a custom-made DNA microarray was designed and gene expression
analysis was established for B. succiniciproducens, comprising 2291 annotated genes from the
B. succiniciproducens genome sequence with a total of five probes per gene. For data analysis, the
obtained expression profiles were ranked according to the metric log2 fold change and individually
assigned to specific gene sets, so called clusters of orthologous groups (COG) (Tatusov et al. 2000).
This gene set enrichment analysis (GSEA) (Subramanian et al. 2005) is frequently used to identify
gene clusters that are ostensibly involved in the formation of phenotypes. The assignment of annotated
genes to gene clusters was taken from literature (Hong et al. 2004) and subsequently implemented into
the GSEA software tool. Experiments were conducted in pH-controlled bioreactors, preventing
perturbing effects of MgCO3. Biomass samples were taken at a cell concentration equivalent to OD600
of 2 – 3. The obtained expression data were analyzed by GSEA (Subramanian et al. 2005) to provide
first information on favored or selectively preferred gene sets that contribute to the adaptation process.
Analysis of the DD3-T2 transcriptome revealed three enriched gene clusters with significant statistics
(Table 5.5), which positively correlate with the evolved phenotype. Surprisingly, the genes covered
metabolic core functions to a larger extent. They imply that temperature adaptation is closely linked to
intracellular exploitation of carbon and thus adapting the efficiency towards the required features.
Table 5.5 Gene sets affected towards the evolutionary adaptation of B. succiniciproducens DD3-T2 compared to the gene
expression patterns of the parent strain DD3. Data comprise the normalized enrichment score (NES), the nominal p-value
(NOM p-val) and the false discovery rate (FDR) (Subramanian et al. 2005). Data derive from triplicate bioreactor cultivations
in minimal glucose medium.
Gene sets NES NOM p-val FDR
Enriched in DD3-T2 vs. DD3
Carbohydrate metabolism and transport
Signal transduction
Energy production and conversion
1.98 < 0.001 0.001
1.81 0.005 0.004
1.54 0.004 0.041
In B. succiniciproducens DD3-T2, 63 genes were significantly up- or down-regulated, as compared to
the parental strain DD3, whereby 36 genes were at least twofold induced. Within the group of affected
genes, operons were identified that exhibited concerted transcriptional regulation (Table 9.5). They
were related to carbon core and energy metabolism and pointed out the essential role of these
functional groups in the improved phenotype. The strongest expression change was observed for a
hexose phosphate phosphorelay system (MS2284-87) consisting of a conserved histidine kinase-like
regulatory system and a hexose phosphate permease (Weston and Kadner 1988). One might speculate
that the modified expression level of this regulatory and transport operon may contribute to an
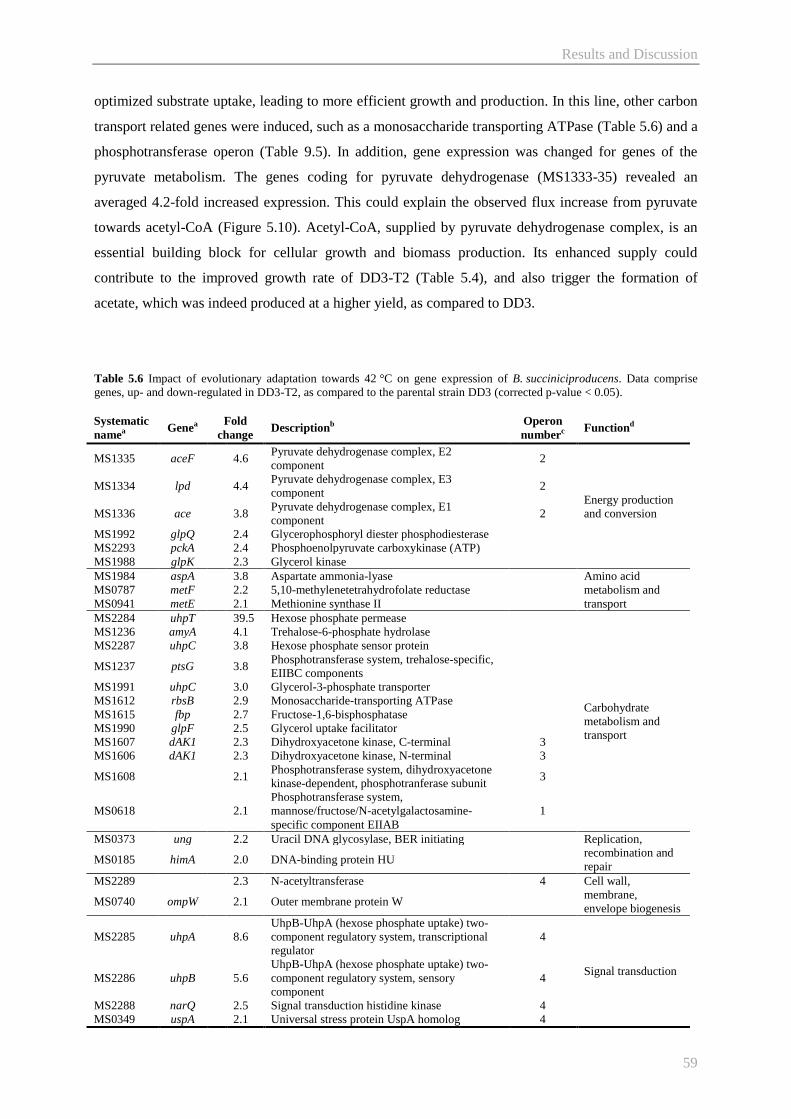
Results and Discussion
59
optimized substrate uptake, leading to more efficient growth and production. In this line, other carbon
transport related genes were induced, such as a monosaccharide transporting ATPase (Table 5.6) and a
phosphotransferase operon (Table 9.5). In addition, gene expression was changed for genes of the
pyruvate metabolism. The genes coding for pyruvate dehydrogenase (MS1333-35) revealed an
averaged 4.2-fold increased expression. This could explain the observed flux increase from pyruvate
towards acetyl-CoA (Figure 5.10). Acetyl-CoA, supplied by pyruvate dehydrogenase complex, is an
essential building block for cellular growth and biomass production. Its enhanced supply could
contribute to the improved growth rate of DD3-T2 (Table 5.4), and also trigger the formation of
acetate, which was indeed produced at a higher yield, as compared to DD3.
Table 5.6 Impact of evolutionary adaptation towards 42 °C on gene expression of B. succiniciproducens. Data comprise
genes, up- and down-regulated in DD3-T2, as compared to the parental strain DD3 (corrected p-value < 0.05).
Systematic
namea Genea
Fold
change Descriptionb
Operon
numberc Functiond
MS1335 aceF 4.6 Pyruvate dehydrogenase complex, E2
component 2
Energy production
and conversion
MS1334 lpd 4.4 Pyruvate dehydrogenase complex, E3
component 2
MS1336 ace 3.8 Pyruvate dehydrogenase complex, E1
component 2
MS1992 glpQ 2.4 Glycerophosphoryl diester phosphodiesterase
MS2293 pckA 2.4 Phosphoenolpyruvate carboxykinase (ATP)
MS1988 glpK 2.3 Glycerol kinase
MS1984 aspA 3.8 Aspartate ammonia-lyase Amino acid
metabolism and
transport
MS0787 metF 2.2 5,10-methylenetetrahydrofolate reductase
MS0941 metE 2.1 Methionine synthase II
MS2284 uhpT 39.5 Hexose phosphate permease
Carbohydrate
metabolism and
transport
MS1236 amyA 4.1 Trehalose-6-phosphate hydrolase
MS2287 uhpC 3.8 Hexose phosphate sensor protein
MS1237 ptsG 3.8 Phosphotransferase system, trehalose-specific,
EIIBC components
MS1991 uhpC 3.0 Glycerol-3-phosphate transporter
MS1612 rbsB 2.9 Monosaccharide-transporting ATPase
MS1615 fbp 2.7 Fructose-1,6-bisphosphatase
MS1990 glpF 2.5 Glycerol uptake facilitator
MS1607 dAK1 2.3 Dihydroxyacetone kinase, C-terminal 3
MS1606 dAK1 2.3 Dihydroxyacetone kinase, N-terminal 3
MS1608 2.1 Phosphotransferase system, dihydroxyacetone
kinase-dependent, phosphotranferase subunit 3
MS0618 2.1
Phosphotransferase system,
mannose/fructose/N-acetylgalactosamine-
specific component EIIAB
1
MS0373 ung 2.2 Uracil DNA glycosylase, BER initiating Replication,
recombination and
repair MS0185 himA 2.0 DNA-binding protein HU
MS2289 2.3 N-acetyltransferase 4 Cell wall,
membrane,
envelope biogenesis MS0740 ompW 2.1 Outer membrane protein W
MS2285 uhpA 8.6
UhpB-UhpA (hexose phosphate uptake) two-
component regulatory system, transcriptional
regulator
4
Signal transduction MS2286 uhpB 5.6
UhpB-UhpA (hexose phosphate uptake) two-
component regulatory system, sensory
component
4
MS2288 narQ 2.5 Signal transduction histidine kinase 4
MS0349 uspA 2.1 Universal stress protein UspA homolog 4

Results and Discussion
60
MS1823 - 2.0 Glycerol-3-phosphate acyltransferase Energy production
and conversion
MS0551 proX - 3.2 ABC-type proline/glycine betaine transport
systems, periplasmic components 5
Amino acid
metabolism and
transport
MS0549 proV - 2.9 ABC-type proline/glycine betaine transport
system, ATPase component 5
MS0550 proW - 2.7 ABC-type proline/glycine betaine transport
system, permease component 5
MS0227 betT - 2.6 Glycine betaine transporter
MS0353 alsT - 2.4 Na+/alanine or glycine symporter
MS1797 avtA - 2.3 Aminotransferase AlaT
MS1790 aroQ - 2.0 3-dehydroquinate dehydratase II
MS1510 fruB - 5.6 Phosphotransferase system, Phosphocarrier
protein HPr
Carbohydrate
metabolism and
transport MS1509 ptsA - 2.8
Phosphotransferase system, PEP-protein kinase,
EI component
MS2073 glgP - 2.2 Glycogen phosphorylase 9
MS1795 menF - 3.4 Menaquinone specific isochorismate synthase 6
Coenzyme
metabolism
MS1794 mend - 3.2 2-succinyl-5-enolpyruvyl-6-hydroxy-3-
cyclohexene-1-carboxylate synthase 6
MS1793 mhpC - 2.6 2-succinyl-6-hydroxy-2,4-cyclohexadiene-1-
carboxylate synthase 6
MS1826 lipA - 2.5 Lipoic acid synthetase
MS1791 dgoA - 2.4 O-succinylbenzoate synthase 6
MS1792 menB - 2.3 Dihydroxynaphthoic acid synthase 6
MS1821 rluD - 2.0 Pseudouridylate synthases, 23S RNA-specific 8 Translation
MS1820 nrfG - 2.7 Outer membrane assembly lipoprotein Cell wall,
membrane,
envelope biogenesis MS1808 artI - 2.0 Membrane-bound lytic murein transglycosylase
MS1801 nhaA - 2.7 Na+/H+ antiporter
Inorganic ion
transport and
metabolism
MS1818 nrfB - 2.6 Formate-dependent nitrite reductase, penta-
heme cytochrome c 7
MS1816 nrfD - 2.6 Formate-dependent nitrite reductase, membrane
component 7
MS1819 nrfA - 2.5 Formate-dependent nitrite reductase,
periplasmic cytochrome c552 subunit 7
MS1817 nrfC - 2.4 Formate-dependent nitrite reductase, 4Fe-4S
subunit 7
MS1341 modB - 2.3 ABC-type molybdate transport system,
permease component
a Gene entries and names are given in accordance with KEGG annotations for M. succiniciproducens MBELE55. b Information are adopted from Hong et al. 2004 and/or NCBI database using BLASTP swissprot (sequence coverage of
50 % and amino acid sequence homologies above 30 %) in combination with annotations from KEGG. c Operons and their corresponding genes were assigned according to the Database of prOkaryotic OpeRons (Dam et al.
2007; Mao et al. 2009) and the Prokaryotic Operon DataBase (Taboada et al. 2012) for M. succiniciproducens MBELE55
predictions (see Table 9.5). d Functional grouping was taken from literature (Hong et al. 2004).
The gene for the major anaplerotic carboxylation in B. succiniciproducens, PEP carboxykinase
(PEPCK), was induced 2.4-fold. This probably re-directed the carbon flux towards the reductive TCA
cycle and succinate (Figure 5.10). PEPCK was proven as a valuable engineering target towards tailor-
made succinate producing E. coli (Millard et al. 1996; Kim et al. 2004; Zhang et al. 2010) and
represents the most important enzyme in anaerobic succinate production. The amplified expression of
PEPCK might be correlated to the efficient formation of succinate throughout the whole evolutionary
adaptation process and in the final isolate DD3-T2. Beyond carbon core metabolism, several stress-
related genes were induced at the level of RNA expression, comprising e.g. a DNA glycosylase (Table

Results and Discussion
61
5.6), mainly responsible for the base excision repair (Krokan et al. 1997) and the DNA stabilizing
protein HU alpha (Kamashev and Rouviere-Yaniv 2000).
Interestingly, menaquinone biosynthesis genes were among the 27 repressed genes, despite
menaquinone’s presumed function in anaerobic fumarate reductase reaction towards succinate.
Regarding the slightly increased carbon flux through the reductive TCA cycle (Figure 5.10), this
down-regulation, however, seemed not limiting for the improved succinate formation with DD3-T2.
5.2.5 Genome sequencing reveals distinct mutations evolved during temperature adaptation in
B. succiniciproducens DD3-T2
As shown, the evolutionary derived temperature tolerant mutant DD3-T2 exhibited altered metabolic
fluxes. Furthermore, the adaptation process obviously affected gene expression. It was now relevant to
identify the underlying mutations. For this purpose, both adapted strains, DD3-T1 and DD3-T2 were
sequenced and compared to wild-type B. succiniciproducens DD1. Polymorphism significance was
covered by a sequence coverage > 50 and a variant frequency set to 75 %.
Table 5.7 Single nucleotide polymorphisms (SNP) and deletion – insertion – polymorphisms (DIP) are listed with their
respective position specific nucleotide (Nt ex) and amino acid (AA ex) exchange in the temperature adapted strains
B. succiniciproducens DD3-T1 and DD3-T2. The wild-type genome was annotated, according to the published
M. succiniciproducens MBEL55E genome (Hong et al. 2004) and served as reference for detection of mutations in the
adapted phenotypes.
Strain Systematic
name Nt ex AA ex Pm Gene Function
DD3-T1 MS0136 1435C>T Pro479Ser SNP nhaP Monovalent cation:H+ antiporter
MS2084 919G>T Gly307Cys SNP lysA Meso 2,6-diaminopimelate decarboxylase
MS2286 586C>A Gln196Cys SNP baeS/uhpB Glucose-6-phosphate specific two-
component signal transduction system MS2286 599C>T Pro200Leu SNP baeS/uhpB
DD3-T2 MS0136 1435C>T Pro479Ser SNP nhaP Monovalent cation:H+ antiporter
MS0213 692C>A Thr231Lys SNP rpoC β’ prime subunit of RNA polymerase
MS0911 46A>C Thr16Pro SNP rfe UDP-GlcNAc:undecaprenyl-phosphate
GlcNAc-1-phosphate transferase
MS2084 919G>T Gly307Cys SNP lysA Meso 2,6-diaminopimelate decarboxylase
MS2286 586C>A Gln196Cys SNP baeS/uhpB Glucose-6-phosphate specific two-
component signal transduction system MS2286 599C>T Pro200Leu SNP baeS/uhpB
MS1237 -70C>A - SNP PptsG Promoter of trehalose (maltose)-specific
transporter subunit IIBC of PTS
MS1336 -207insA - DIP PaceE Promoter of pyruvate dehydrogenase
subunit E1
Pm: type of occurring polymorphism
The genome sequence of the temperature adapted strains B. succiniciproducens DD3-T1 and DD3-T2
revealed four and eight mutations, respectively (Table 5.7). The mutated genes, identified in DD3-T1,
were attributed to energy and carbon metabolism and amino acid metabolism and transport. All these
modifications were still present in DD3-T2 and, thus, were obviously kept during the further

Results and Discussion
62
adaptation process (Figure 5.12). This maintenance indicates their apparent metabolic value. The
mutations, additionally present in DD3-T2, belonged to the transcription machinery, carbon
metabolism and cell wall composition. Most relevant, the number of mutations mediating the superior
phenotype was rather low. This promised metabolic engineering targets for rational improvement of
increased temperature tolerance in B. succiniciproducens.
Figure 5.12 Overview on mutations evolved during temperature adaptation to 40 °C (DD3-T1) and 42 °C (DD3-T2) in
B. succiniciproducens DD3. Systematic name and COG identifier (in brackets) are taken from M. succiniciproducens
MBEL55E annotation (Hong et al. 2004). For further information on the single modifications, see Table 5.7.
Taken together, B. succiniciproducens DD3 was successfully adapted to a higher temperature level.
The finally adapted strain DD3-T2 was proven at high temperature, initially inhibiting growth
performance of the ancestor DD3 and the wild-type strain. Careful growth experiments and system
biology approaches revealed a complex picture of tolerance underlying mechanisms. The increased
tolerance might result from re-orientation of carbon fluxes, regulated at the level of transcriptomics
and genomics. Regarding a rational engineering approach towards improvement of
B. succiniciproducens, it appeared most relevant to analyze the impact of mutations, acquired during
the adaptation process. In particular, mutations that contribute to straight-forward metabolic reactions
seemed promising with regard to an industrial performance.

Results and Discussion
63
5.3 Increasing succinate tolerance in B. succiniciproducens
5.3.1 Sequential batch adaptation of B. succiniciproducens DD3 towards high succinate stress
It has been proposed that an efficient production process for succinate has to achieve a product titer
above 100 g L-1
(Patel et al. 2006). Clearly, such performance relies on the robustness and tolerance of
the producing microorganism to elevated levels of the product. Unfortunately, individual genetic
targets that mediate such a tolerance are primarily not known. In particular organic acid tolerance,
such as succinate, cannot be tailored by rational strain design, since the respective phenotype requires
polygenic modifications to exhibit this higher stress tolerances (Patnaik 2008). In order to improve
tolerance to succinate, B. succiniciproducens DD3, lacking ldhA and pflD to eliminate formation of
the by-products lactate and formate, was chosen for the evolutionary process by exposing it to high
succinate concentration in a minimal medium based sequential batch approach. At the starting point of
the evolutionary adaptation, the external succinate concentration was set to 5 g L-1
, and was gradually
increased further on. The batch interval was adjusted to cell growth, i.e. cells were harvested from a
batch culture only when they had reached a cell density corresponding to an OD600 of 5 to ensure an
appropriate adapted cell population prior to inoculating the next batch at an even higher succinate
level. In case of a slow cell proliferation, the cultivation was simply extended to allow for the
formation of sufficient biomass for the next following batch. During the first two adaptive rounds DD3
struggled with the external amount of 5 g L-1
succinate (Figure 5.13). It took about 24 h to reach
notable cell growth. The third batch, still at 5 g L-1
succinate, showed a distinct improvement of
growth. Suddenly, the cells revealed similar growth performance as observed for DD3 under standard
conditions, i.e. without added succinate. The specific growth rate almost reached 0.1 h-1
. The specific
succinate productivity advanced to nearly 1 g L-1
h-1
(Figure 5.13). Based on this sudden improvement,
single clones were isolated from the population of this round three. One of the clones, selected for
further analysis, was designated DD3-Suc1. Subsequently, the succinate concentration in the medium
was stepwise increased throughout the following iterations. Each round of the further adaptation was
accompanied by a significant improvement of growth, compared to the parental strain (Figure 5.13). In
response to each further increase in externally added succinate, the cells were able to compensate for
the extracellular stress. Two more superior strains were isolated. The designated strain DD3-Suc2 was
isolated after 15 iterations, due to the remarkably increased specific growth rate and succinate
productivity (Figure 5.13). It was interesting to note that the adapted cells performed well at almost
20 g L-1
of initially added succinate. This level was previously found to fully inhibit the parental strain
(Figure 5.3).

Results and Discussion
64
Figure 5.13 Evolutionary adaptation of B. succiniciproducens DD3 to high levels of succinate, visualized according to the
color legend. The bar chart shows the normalized specific growth rate, referring to standard cultivations of un-adapted DD3
at respective succinate levels in minimal glucose medium (µ = 1). The top level indicates the specific succinate productivity
during each batch. The data were estimated from the time specific succinate production of each round, after correcting for the
initially added succinate (see color legend).
At the 25th iteration, succinate was supplemented at 25 g L
-1. Obviously, this imposed pronounced
stress, clearly visible by a sudden decrease of growth and productivity, affected the performance
(Figure 5.13). However, during the subsequent rounds the cells could recover and exhibited efficient
growth and improved succinate productivity. From cultures that tolerate 25 g L-1
succinate, the clone
DD3-Suc3 was isolated for further studies. At the higher succinate levels, succinate productivity never
reached the values, observed for the parent strain DD3 without imposed succinate stress, but still
remained at reasonable levels.
5.3.2 Physiological characterization of B. succiniciproducens DD3-Suc1, DD3-Suc2 and DD3-
Suc3 adapted towards higher succinate levels
In order to gain information on the newly isolated succinate tolerant phenotypes, comparative
cultivations were carried out with the parent strain B. succiniciproducens DD3 and with the mutants
DD3-Suc1, DD3-Suc2 and DD3-Suc3. The focus was first set on evaluation of fermentation
performance. Cultivation experiments were conducted in serum bottles at 37 °C. All adapted strains
showed faster growth, as compared to DD3, and enhanced succinate production (Figure 5.14).
Succinate productivity could be increased by about 30 % with DD3-Suc1 and DD3-Suc2, considering
DD3 standard performance (Table 5.4).

Results and Discussion
65
Figure 5.14 Growth physiology of the three succinate tolerant strains B. succiniciproducens (▲) DD3-Suc1, (■) DD3-Suc2
and (♦) DD3-Suc3 compared to their parental strain (●) DD3 (A) and maximal specific succinate productivity during 48 h
cultivation period (B). The data points represent mean values from three biological replicates with their corresponding
standard deviations. All cultivations were performed in minimal glucose medium E at 37 °C.
In addition to these observed improvements, the mutants revealed a pronounced change in their by-
product spectrum (Table 5.8). All succinate tolerant mutants showed enhanced formation of pyruvate
(Table 5.8). This organic acid is more tolerable according to inhibition studies with A. succinogenes,
another succinate producing bacterium (Lin et al. 2008). The increased formation of pyruvate
obviously went to the expense of succinate and acetate (Table 5.8).
Table 5.8 Growth and production characteristics of succinate adapted strains B. succiniciproducens DD3-Suc1, DD3-Suc2
and DD3-Suc3, compared to their parent strain DD3 at 37 °C in minimal glucose medium E. The data given are specific
growth rate (µmax), biomass yield (YX/S), succinate yield (YSuc/S), formate yield (YFor/S), acetate yield (YAce/S), lactate yield
(YLac/S), ethanol yield (YEtOH/S), pyruvate yield (YPyr/S) and maximal succinate productivity (PSuc). Data represent mean
values of three biological replicates with their corresponding standard deviations.
DD3 DD3-Suc1 DD3-Suc2 DD3-Suc3
µmax [h-1] 0.16 ± 0.01 0. 22 ± 0.01 0.22 ± 0.01 0.22 ± 0.01
YX/S [g mol-1] 29.8 ± 2.5 30.5 ± 1.0 30.1 ± 2.4 30.7 ± 4.0
YSuc/S [mol mol-1] 1.13 ± 0.04 1.09 ± 0.05 0.96 ± 0.04 0.90 ± 0.03
YFor/S [mol mol-1] < 0.01 < 0.01 < 0.01 < 0.01
YAce/S [mol mol-1] 0.21 ± 0.06 0.14 ± 0.01 0.15 ± 0.03 0.28 ± 0.03
YLac/S [mol mol-1] < 0.01 < 0.01 < 0.01 < 0.01
YEtOH/S [mol mol-1] < 0.01 < 0.01 < 0.01 < 0.01
YPyr/S [mol mol-1] 0.16 ± 0.03 0.33 ± 0.01 0.27 ± 0.01 0.23 ± 0.02
PSuc [g L-1 h-1] 0.76 ± 0.01 1.00 ± 0.04 1. 00 ± 0.04 0.83 ± 0.04
The yields were determined by linear fitting of the concentration of biomass and
product with that of the substrate.
A next round of experiments now evaluated the joined tolerance to increased succinate levels. For this
purpose, B. succiniciproducens DD3, DD3-Suc1, DD3-Suc2 and DD3-Suc3 were cultivated under
external addition of succinate to the growth medium, i.e. succinate was added prior to inoculation at
concentrations of 5, 7.5, 10, 15 and 25 g L-1
(Figure 5.15).

Results and Discussion
66
Figure 5.15 Succinate tolerance studies of B. succiniciproducens (■) DD3-Suc1, (▲) DD3-Suc2 and (♦) DD3-Suc3
compared to the parental strain (●) DD3 for specific growth (A) and final succinate titer, corrected for initially added
succinate (B). Growth (µ) and succinate production of DD3 at standard conditions, i.e. 37 °C and no imposed succinate
stress, were set to 100 %. Cultivations were conducted in minimal glucose medium with the addition of five succinate
concentrations. Data represent three biological replicates with corresponding standard deviations.
Taken together, the isolated clones from the evolutionary adaptation revealed a remarkably increased
tolerance towards external succinate (Figure 5.15). The parent strain DD3 was strongly inhibited in
growth and responded to higher succinate levels with a drastic decrease in succinate formation. In
contrast, all mutants were much more robust. The final isolate, DD3-Suc3 was almost unaffected in
growth and succinate production at levels of 10 and 15 g L-1
added succinate, respectively. This was
an exceptional performance when compared to that of DD3, the starting point of the evolutionary
adaptation. The potential to adapt to higher succinate levels can be regarded as an important feature of
B. succiniciproducens towards industrial succinate production.
5.3.3 Metabolic pathway fluxes in the succinate-tolerant B. succiniciproducens strains DD3-
Suc2 and DD3-Suc3
The cellular tolerance to organic acids is complex and its regulation is barely understood (Warnecke
and Gill 2005). Throughout the evolution, extremophile bacteria adapted to harsh environmental
conditions, including organic acids and coupled pH stress, by developing various techniques (Booth
1985). The promising B. succiniciproducens mutants were now analyzed by systems biology
approaches to shed some light upon the underlying molecular mechanisms in succinate tolerance and
adaptation. To this end, metabolic flux analysis (fluxomics), metabolomics and transcriptomics,
respectively, was conducted for the obtained isolates. Additionally, the mutants were sequenced to
unravel correlations between phenotype and genotype.

Results and Discussion
67
Metabolic pathway fluxes for B. succiniciproducens DD3-Suc2 and DD3-Suc3 were determined by
tracer cultivations, using [1-13
C] glucose as carbon source. On the basis of the obtained stoichiometric
data (Table 5.8), 13
C labeling patterns of proteinogenic amino acids and succinate (Table 9.2) and
anabolic demands (Table 9.1), the intracellular flux distribution was estimated using the Open Flux
Tool (Quek et al. 2009). Metabolic and isotopic steady-state, an important prerequisite for the flux
approach, was obtained for both adapted strains (Figure 5.16). An excellent fit of the labeling data was
achieved during flux estimation (Table 9.2) underlining the consistency of the obtained fluxes. The
statistical evaluation of the flux partitioning showed a high precision, so that flux differences to the
parent strains could be attributed to strain-specific differences.
Figure 5.16 Metabolic (A) and isotopic (B) steady state during labeling experiments with B. succiniciproducens DD3-Suc2.
The metabolic steady state was verified from linear correlation between (●) biomass and (▲) succinate formation,
respectively, and glucose consumption. Constant labeling patterns of proteinogenic amino acids confirmed isotopic steady
state. Hereby, exemplary shown amino acids and succinate stem from different parts of the metabolic network. M0 (non-
labeled), M1 (single labeled) and M2 (double labeled) represent the relative fraction of corresponding isotopomers of (○)
alanine, (□) glycine, (Δ) serine, ( ) phenylalanine, (◊) aspartate, and (x) succinate.
Both succinate-adapted mutants showed an increased flux into the oxidative PPP, as compared to their
ancestor DD3 (Figure 5.17 and Figure 5.18). This might relate the superior growth performance of the
evolved phenotypes that could benefit from enhanced supply of NADPH via the PPP. The enhanced
flux into the PPP was also observed in the temperature-tolerant strain DD3-T2, which also showed
improved growth (see 5.2.2). NADPH presumably supports the biomass formation and is a limiting
factor for Pasteurellaceae growth (McKinlay et al. 2007). Interestingly, the two independent
adaptation approaches, towards high temperature and elevated succinate levels, respectively, induced
both the same increased flux into the PPP.

Results and Discussion
68
Figure 5.17 In vivo carbon flux distribution of B. succiniciproducens DD3-Suc2 during growth in minimal glucose medium.
Fluxes are shown as percentage of the specific glucose uptake rate qGlc = 7.8 mmol g-1 h-1 that was set to 100 %. Small arrows
indicate net flux direction. Dashed lines show rationally deleted pathways prior to evolutionary engineering with their
respective genes (red boxes). Flux fold change (Table 9.4) was estimated from specific glucose uptake rate corrected data
from DD3 (Becker et al. 2013) and DD3-Suc2 and differentially visualized according to the color legend. The errors reflect
90 % confidence intervals.
Taken together, this flux re-distribution at the G6P-node could reflect an indirect response to provide
extra redox power to cover an enhanced need as observed for other bacteria (Wittmann and Heinzle
2001b; Wittmann and Heinzle 2002). One might suggest, on basis of this molecular switch, rational
engineering of the PPP flux in order to improve growth performance of B. succiniciproducens.
However, enhanced growth would have to be carefully balanced with product formation, due to their
direct link to each other (Becker et al. 2013).

Results and Discussion
69
Figure 5.18 In vivo carbon flux distribution of B. succiniciproducens DD3-Suc3 during growth in minimal glucose medium.
Specific glucose uptake rate qGlc = 7.6 mmol g-1 h-1 is set to 100 % and all further fluxes are given as percentage. Net flux
direction is indicated by small arrows. Rationally deleted pathways, i.e. ldhA and pflD, are shown by dashed lines.
Comparison of specific glucose uptake rate corrected carbon fluxes of DD3 (Becker et al. 2013) and DD3-Suc3 is
differentially visualized according to the color legend. The errors reflect 90 % confidence intervals.
The fluxes at the PEP/Pyr node showed a more complex picture. DD3-Suc2 redirected carbon flux
from PDH and reductive TCA cycle towards pyruvate secretion (Figure 5.17), possibly favoring
pyruvate’s less toxic impact as compared to other organic acids (Lin et al. 2008). In contrast, DD3-
Suc3 showed decreased pyruvate flux, but rather channeled the carbon into acetate production (Figure
5.18). This was supported by enhanced flux through the PDH. Here, the oxidative TCA cycle flux
remained nearly unchanged, so that the formed acetyl-CoA was fully used for acetate synthesis. The

Results and Discussion
70
acetate production pathway generates ATP, which obviously supports the higher requirements under
stress, as it was also observed during temperature adaptation (Figure 5.10). Taken together,
B. succiniciproducens seems to exploit different mechanism to achieve a higher robustness. The shifts
to less toxic by-products (i.e. pyruvate) and to energy-providing metabolic routes (i.e. acetate) seemed
to be involved in this adaptation, so that the rearrangement of the by-product spectrum probably bears
a substantial metabolic flexibility of B. succiniciproducens. The flux towards succinate production was
decreased by 9 % in DD3-Suc2 and by 13 % in DD3-Suc3, respectively. Despite the necessity of this
pathway for redox balancing, its reduction seemed to be linked to the adaptation process to higher
external succinate concentrations. The flux through PEPCK, the driving force for anaerobic succinate
formation in other microorganisms (Lee et al. 2006; McKinlay et al. 2010), is coherently reduced with
increased tolerance against succinate (Figure 5.19). The reduced succinate formation as response to the
stress becomes also obvious from the decreased succinate yields in the mutants (Table 5.8).
Apparently, reduced succinate production itself supported the adaptation.
Figure 5.19 Correlation of succinate tolerance and relative carbon flux through phosphoenolpyruvate carboxykinase in
B. succiniciproducens DD3, DD3-Suc2 and DD3-Suc3. The flux from PEP/Pyr towards the reductive part of the TCA was
attributed to the reaction of the PEP carboxykinase, known as major anaplerotic enzyme in succinate producing
microorganisms (Lee et al. 2006; McKinlay et al. 2010). The tolerance was determined from linear fit between specific
growth rates at different succinate levels. The values given relate to the critical concentration (µ = 0).
The decreased flux through the reductive TCA cycle branch finally resulted in lower regeneration of
NAD+, as this route accounts for 80 to 90 % of total NADH consumption in B. succiniciproducens
(Becker et al. 2013). Obviously, this led to increased redox imbalances, as observed by supply and
consumption of NADH in both mutants, as compared to DD3 (Figure 9.1).

Results and Discussion
71
5.3.4 Intracellular amino acid pools in succinate-tolerant B. succiniciproducens DD3-Suc3
Clearly, elevated succinate concentrations causes osmotic stress, so that the phenotypic response may
involve the activation of mechanisms for osmotic protection, observed for other succinate producing
microorganisms (Andersson et al. 2009; Fang et al. 2011). As example, proline has been identified as
compatible solute in other bacteria (Brill et al. 2011). To this end, the intracellular pools of free amino
acids were compared between the most tolerant strain B. succiniciproducens DD3-Suc3 and the wild-
type strain DD1 (Figure 5.20).
Figure 5.20 Intracellular amino acid (A) and glutamine (B) pools of B. succiniciproducens DD1 and DD3-Suc3. Data
represent mean values with corresponding standard deviations from two biological replicates, each with two technical
replicates, obtained during exponential growth phase on minimal glucose medium by applying an appropriate fast filtration.
As major difference, the succinate adapted strain DD3-Suc3 revealed an extreme up-regulation of
intracellular glutamine (Figure 5.20). Indeed, glutamine has been found as compatible solute during
moderate osmoadaptation (Frings et al. 1993; Goude et al. 2004). It was interesting to note that this
compatible solute like amino acid was present without externally imposed stress. That might reflect a
constitutive protection activated during the adaptation. Proline instead was observed in similar
amounts in DD3-Suc3 as compared to DD1. Cysteine was increased 5-fold. It is reported to facilitate
tolerance against oxidative stress (Turnbull and Surette 2010). This can be accredited to its function as
precursor molecule for glutathione, an antioxidant. Glutathione-supplemented M. succiniciproducens
MBEL55E fermentations revealed increased growth and productivity (Hoon et al. 2010). Cysteine is
also known to be an essential compound for M. succiniciproducens MBEL55E growth (Song et al.
2008). The reduced intracellular asparagine pool might be explained by the reduced flux through the
reductive TCA cycle in the succinate-tolerant mutant DD3-Suc3. Leucine was increased about
twofold. This seemed not to be linked to enhanced tolerance, but due to the lack of ldhA and pflD in
the mutant. In consequence of these deletions, B. succiniciproducens DD3 accumulates pyruvate-
based metabolites, such as leucine and leucine specific precursors (Becker et al. 2013).
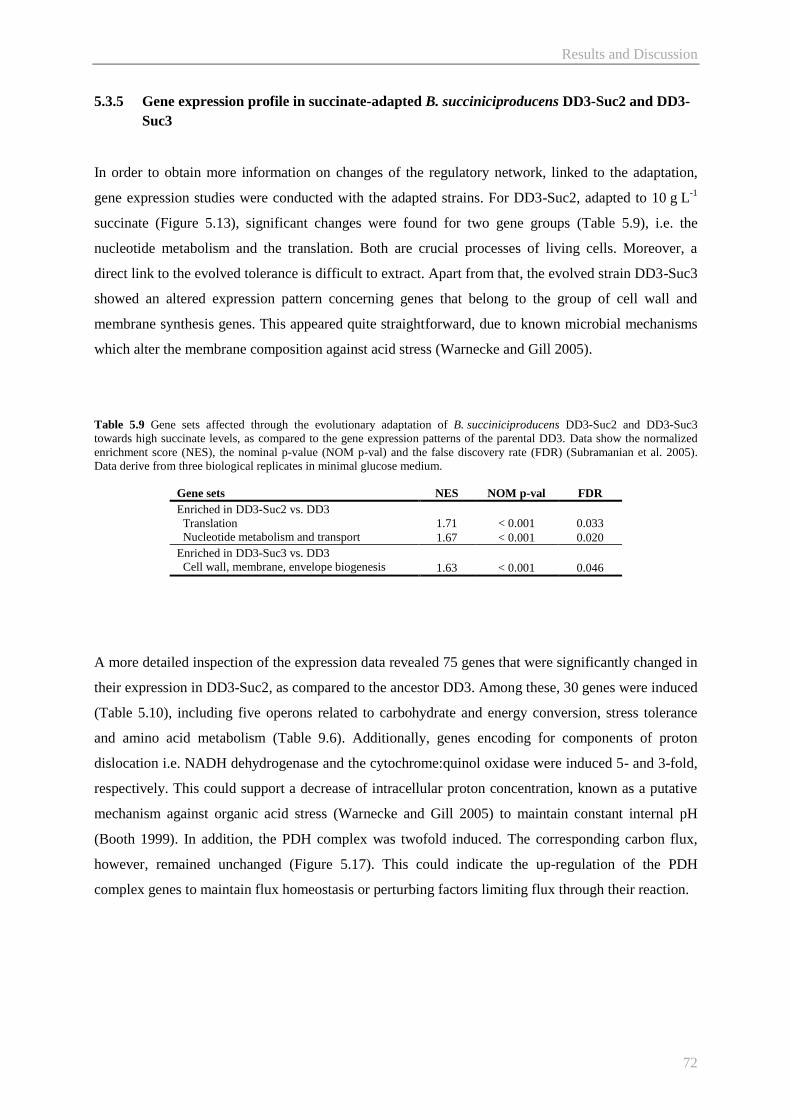
Results and Discussion
72
5.3.5 Gene expression profile in succinate-adapted B. succiniciproducens DD3-Suc2 and DD3-
Suc3
In order to obtain more information on changes of the regulatory network, linked to the adaptation,
gene expression studies were conducted with the adapted strains. For DD3-Suc2, adapted to 10 g L-1
succinate (Figure 5.13), significant changes were found for two gene groups (Table 5.9), i.e. the
nucleotide metabolism and the translation. Both are crucial processes of living cells. Moreover, a
direct link to the evolved tolerance is difficult to extract. Apart from that, the evolved strain DD3-Suc3
showed an altered expression pattern concerning genes that belong to the group of cell wall and
membrane synthesis genes. This appeared quite straightforward, due to known microbial mechanisms
which alter the membrane composition against acid stress (Warnecke and Gill 2005).
Table 5.9 Gene sets affected through the evolutionary adaptation of B. succiniciproducens DD3-Suc2 and DD3-Suc3
towards high succinate levels, as compared to the gene expression patterns of the parental DD3. Data show the normalized
enrichment score (NES), the nominal p-value (NOM p-val) and the false discovery rate (FDR) (Subramanian et al. 2005).
Data derive from three biological replicates in minimal glucose medium.
Gene sets NES NOM p-val FDR
Enriched in DD3-Suc2 vs. DD3
Translation
Nucleotide metabolism and transport
1.71 < 0.001 0.033
1.67 < 0.001 0.020
Enriched in DD3-Suc3 vs. DD3
Cell wall, membrane, envelope biogenesis
1.63 < 0.001 0.046
A more detailed inspection of the expression data revealed 75 genes that were significantly changed in
their expression in DD3-Suc2, as compared to the ancestor DD3. Among these, 30 genes were induced
(Table 5.10), including five operons related to carbohydrate and energy conversion, stress tolerance
and amino acid metabolism (Table 9.6). Additionally, genes encoding for components of proton
dislocation i.e. NADH dehydrogenase and the cytochrome:quinol oxidase were induced 5- and 3-fold,
respectively. This could support a decrease of intracellular proton concentration, known as a putative
mechanism against organic acid stress (Warnecke and Gill 2005) to maintain constant internal pH
(Booth 1999). In addition, the PDH complex was twofold induced. The corresponding carbon flux,
however, remained unchanged (Figure 5.17). This could indicate the up-regulation of the PDH
complex genes to maintain flux homeostasis or perturbing factors limiting flux through their reaction.

Results and Discussion
73
Table 5.10 Gene expression changes after evolutionary adaptation of B. succiniciproducens towards 10 g L-1 succinate. Data
comprise genes up- and down-regulated in DD3-Suc2, as compared to the parental strain DD3 (corrected p-value < 0.05).
Systematic
namea Genea
Fold
change Descriptionb
Operon
numberc Functiond
MS0181 ndh 5.1 NADH dehydrogenase
Energy production
and conversion
MS0716 appB 3.3 Cytochrome oxidase subunit 2
MS0715 cydA 3.1 Cytochrome oxidase subunit 1
MS1335 aceF
2.3 Pyruvate dehydrogenase complex, E2
component 4
MS1336 aceE
2.3 Pyruvate dehydrogenase complex, E1
component 4
MS1334 lpd
2.2 Pyruvate dehydrogenase complex, E3
component 4
MS1251 cysN 5.3 Sulfate adenylyltransferase subunit 1 2
Amino acid
metabolism and
transport
MS0941 metE 4.6 Methionine synthase II
MS0787 metF 4.6 5,10-methylenetetrahydrofolate reductase
MS1252 cysH 4.6 Sulfate adenylyltransferase subunit 2 2
MS1250 cysJ 4.5 Sulfite reductase alpha subunit (flavoprotein) 2
MS1249 cysI 4.0 Sulfite reductase beta subunit (hemoprotein) 2
MS1253 cysH 3.6 Phosphoadenosine phosphosulfate reductase
MS1277 artI
3.1 ABC-type amino acid transport (substrate-
binding protein) 3
MS1684 artI
2.7 ABC-type amino acid transport (potential
glutamine binding protein)
MS1261 cysA 2.6 Sulfate transport system, ATP-binding protein
MS1276 artM 2.3 ABC-type cystine transport system, permease 3
MS1275 glnQ
2.3 ABC-type cystine transport system, ATP-
binding protein 3
MS0045 ilvC 2.2 Ketol acid reductoisomerase
MS0372 2.5 Autonomous glycyl radical enzyme Nucleotide
metabolism and
transport
MS0575 uraA 2.0 Purine permease
MS0992 nrdA 2.0 Ribonucleotide reductase, alpha subunit
MS1254 cysG 2.3 Uroporphyrinogen-III methyltransferase
Coenzyme
metabolism
MS1683 gshA
2.1 Bifunctional glutamate-cysteine
ligase/glutathione synthetase
MS1015 cirA 2.1 Vitamin B12 transporter
MS1856 2.0 6-pyruvoyl-tetrahydropterin synthase 5
MS1857 nrdG
2.2 7-carboxy-7-deazaguanine synthase; queuosine
biosynthesis (radical SAM superfamily) 5
Molecular
chaperons and
related functions MS0458 groS 2.0 Co-chaperonin GroES 1
MS0389 sodA 3.8 Superoxide dismutase (Mn) Inorganic ion
transport and
metabolism MS1205 cirA
2.4 Iron complex outermembrane recepter protein
MS0040 oadG - 3.5 Oxaloacetate decarboxylase, gamma subunit 6
Energy production
and conversion
MS1653 frdB - 3.4 Fumarate reductase, Fe-S protein subunit 12
MS1654 frdC - 3.3 Fumarate reductase subunit C 12
MS0038 oadB - 3.3 Oxaloacetate decarboxylase, beta subunit 6
MS1655 frdD - 3.3 Fumarate reductase subunit D 12
MS1652 sdhA - 3.2 Fumarate reductase, flavoprotein subunit 12
MS2293 pckA - 3.0 Phosphoenolpyruvate carboxykinase (ATP)
MS0039 oadA - 2.9 Oxaloacetate decarboxylase, alpha subunit 6
MS1105 leuA - 2.7 Tartrate dehydrogenase/decarboxylase
MS0760 fumC - 2.1 Fumarate hydratase
MS0732 - 2.1 Formate dehydrogenase subunit alpha
MS0550 proW - 3.6 ABC-type proline/glycine betaine transport
system, permease component 7
Amino acid
metabolism and
transport
MS0551 proX - 3.5
ABC-type proline/glycine betaine transport
systems, periplasmic components, substrate
binding protein
7
MS0549 proV - 3.4 ABC-type proline/glycine betaine transport
system, ATPase component 7
MS0731 gltD - 2.9 Putative NADPH-dependent glutamate
synthase beta chain and related oxidoreductases 9
MS0815 pepD - 2.5 Aminotripeptidase
MS0288/89 - 2.1 Putative transporter protein (Asp-Al_Ex
superfamily)

Results and Discussion
74
MS0633 nrdD - 2.0 Anaerobic ribonucleoside-triphosphate
reductase
Nucleotide
metabolism and
transport
MS2216 dcuB - 3.6 Anaerobic C4-dicarboxylate transporter (DcuA
DcuB superfamily)
Carbohydrate
metabolism and
transport
MS1612 rbsB - 2.9 ABC-type sugar transport system, periplasmic
component
MS2066 lamb - 2.5 Maltose-inducible porin 14
MS2377 - 2.5
Phosphotransferase system,
mannose/fructose/N-acetylgalactosamine-
specific, component IID
15
MS2378 - 2.4
Phosphotransferase system,
mannose/fructose/N-acetylgalactosamine-
specific, component IIC
15
MS2379 - 2.3
Phosphotransferase system,
mannose/fructose/N-acetylgalactosamine-
specific, component EIIAB
15
MS1121 glgC - 2.3 Glucose-1-phosphate adenylyltransferase 10
MS1877 dcuB - 2.3 Anaerobic C4-dicarboxylate transporter (DcuA
DcuB superfamily)
MS2355 mipB - 2.3 Transaldolase
MS0616 - 2.1
Phosphotransferase system,
mannose/fructose/N-acetylgalactosamine-
specific, component IID
8
MS0618 - 2.1
Phosphotransferase system,
mannose/fructose/N-acetylgalactosamine-
specific, component IIB
8
MS0617 - 2.1
Phosphotransferase system,
mannose/fructose/N-acetylgalactosamine-
specific, component IIC
8
MS2068 malE - 2.0 ABC-type maltose transport system, maltose-
binding periplasmic protein
MS0639 rbsB - 2.0 ABC-type sugar transport system, periplasmic
component
MS1124 malQ - 2.0 4-alpha-glucanotransferase 10
MS1006 bioD - 3.4 Dethiobiotin synthetase Coenzyme
metabolism MS0842 cof - 3.2 Pyridoxyl phosphate phosphatase
MS0352 - 2.9 Ribosome-associated protein Y Translation
MS1504 ompR - 2.0 Aerobic respiration control protein ArcA
homolog Transcription
MS1159 - 2.6 Ferrous iron transport protein A (FeoA
superfamily)
Inorganic ion
transport and
metabolism
MS1583 tbpA - 2.6 ABC-type Fe3+ transport system, periplasmic
component
MS1817 hybA - 2.2 Formate-dependent nitrite reductase, 4Fe-4S
subunit 13
MS1158 feoB - 2.2 Fe2+ transport system protein B 11
MS1818 nrfB - 2.1 Formate-dependent nitrite reductase, penta-
heme cytochrome c 13
MS1816 nrfD - 2.1 Formate-dependent nitrite reductase, membrane
component 13
MS1819 nrfA - 2.0 Formate-dependent nitrite reductase,
periplasmic cytochrome c552 subunit 13
MS0349 uspA - 6.1 Universal stress protein UspA homolog Signal transduction a Gene entries and names are given in accordance with KEGG annotations for M. succiniciproducens MBELE55. b Information are adopted from Hong et al. 2004 and/or NCBI database using BLASTP swissprot (sequence coverage of
50 % and amino acid sequence homologies above 30 %) in combination with annotations from KEGG. c Operons and their corresponding genes were assigned according to the Database of prOkaryotic OpeRons (Dam et al.
2007; Mao et al. 2009) and the Prokaryotic Operon DataBase (Taboada et al. 2012) for M. succiniciproducens MBELE55
predictions (see Table 9.5). d Functional grouping was taken from literature (Hong et al. 2004).

Results and Discussion
75
Regarding general stress response, several genes showed changes in their expression level.
Ribonucleotide reductase (RNR), conserved among most microorganisms and essential for DNA
synthesis, was over-expressed in combination with an acid-induced glycyl radical enzyme, which
supports RNR function under anaerobic conditions (Buckel and Golding 2006). Moreover, genes
encoding enzymes of the qeueosine pathway were found to be up-regulated (Table 5.10). Qeueosine
increases the accuracy of translation processes (Urbonavicius et al. 2001). In addition, superoxide
dismutase and a Gro chaperone were induced, as also observed for acid-stressed L. lactic (Sanders et
al. 1995). The glutamate/cysteine ligase, involved in glutathione biosynthesis, was increased 2.1-fold,
as compared to DD3. Expression of superoxide dismutase and synthesis of glutathione are part of the
general stress response (Mager et al. 2000). The strongest transcriptional activation was found for
genes contributing to the biosynthesis of cysteine. In addition, a cysteine related ABC amino acid
transport system was induced. This could activate glutathione biosynthesis based on the fact that
cysteine represents a building block for glutathione. Thus, it may support stress tolerance regarding
optimized glutathione accessibility. Glutathione indeed improved succinate production with
M. succiniciproducens MBELL55E (Hoon et al. 2010), certainly based on the fact that cysteine is
known to be an essential compound during M. succiniciproducens MBEL55E and A. succinogenes
cultivation, due to incomplete biosynthetic pathways (Song et al. 2008; McKinlay et al. 2010).
Among the 45 repressed genes in DD3-Suc2, as compared to DD3, were ten operons (Table 9.7),
mainly related to transport and carbohydrate conversion. Two candidates (MS1877, MS2216),
encoding for anaerobic C4-dicarboxylic acid transporters, were significantly reduced in expression.
These genes, belonging to the DcuA DcuB superfamily, potentially prevent efflux of produced
succinate to adjust to the extracellular stress and thus limit its production. The resulting intracellular
accumulation of succinate may be the reason for the observed induction of genes related to proton-
pumping to minimize internal pH perturbations. In contrast to E. coli, where the dcu genes share an
operon with aspartase and fumarase, respectively (Six et al. 1994), and are thus physiologically
controlled, such a genomic structure could not be found in B. succiniciproducens, proving non-
proximal transcription of the transporters. A putative permease of the Asp-Al_Ex superfamily showed
repression on the transcription level. Recently, a novel succinate transporter was predicted for
C. glutamicum, exhibiting the same domains as the transporter here and it was characterized to be part
of the succinate excretion system (Huhn et al. 2011). Regarding carbohydrate metabolism, PEPCK,
the major anaplerotic enzyme towards succinate, was 3-fold repressed in the succinate tolerant mutant
DD3-Suc2. The reaction from fumarate towards succinate was obviously repressed on the level of the
complete fumarate reductase complex (Table 9.6). Altogether, the whole reductive TCA cycle branch
and potential succinate efflux mechanisms were repressed in a concerted manner (Figure 5.21).

Results and Discussion
76
Figure 5.21 In vivo flux and gene expression response of B. succiniciproducens DD3-Suc2 linked to biosynthetic pathway of
succinate as compared to the parental strain DD3. Flux ratios (Table 9.4) are shown in squared brackets. Transcriptional
changes (Table 5.10) are shown in curly brackets. Systematic and gene names are allocated to their reactions and indicate up-
(green) and down-regulation (red).
Obviously, cells actively down-regulate formation and export of succinate to counteract external
succinate stress (Figure 5.21). Moreover, genes encoding for sugar transporters and components of
glycogen metabolism were decreased in expression. In addition, the gene encoding for the response
regulator ArcA was repressed in DD3-Suc2. The regulator ArcA is specifically responsible for
regulating the intracellular redox system (Malpica et al. 2006). It controls the glucose specific PTS
system in E.coli (Jeong et al. 2004) and is also responsible for several genes and operons involved in
anaerobic metabolism, e.g. the cydAB genes coding for a cytochrome:quinol oxidase (Gunsalus and
Park 1994). Additionally, this regulator plays an important role in the related succinate producer
M. succiniciproducens, where it seems to control various genes, e.g. PDH and fumarate reductase
(Yun et al. 2012). Interestingly, genes related to glycine betaine/proline transport were repressed in
DD3-Suc2, despite their well-known function as osmoprotectants (Arakawa and Timasheff 1985;
Bourot et al. 2000).

Results and Discussion
77
Table 5.11 Impact of succinate adaptation towards 25 g-1 L-1 on B. succiniciproducens gene expression profile. Data
comprise genes up- and down-regulated in DD3-Suc3, as compared to the parental strain DD3 (corrected p-value < 0.05).
Systematic
namea Genea
Fold
change Descriptionb
Operon
numberc Functiond
MS1188 3.2 Phosphoglycerate dehydrogenase Energy production
and conversion MS0883 2.7 NADH-dependent butanol dehydrogenase A
MS0760 fumC 2.0 Fumarate hydratase
MS1674 ftsL 2.4 Cell division protein FtsL 4 Cell division and
chromosome
partitioning
MS1676 2.4 Cell division protein MraZ
MS1673 ftsI
2.3 Cell division protein FtsI (peptidoglycan
synthesis) 4
MS1703 thrA
4.6 Bifunctional aspartokinase I/homoserine
dehydrogenase I 5
Amino acid
metabolism and
transport
MS1984 aspA 4.4 Aspartate ammonia-lyase MS1702 thrB 2.9 Homoserine kinase 5
MS1701 thrC 2.9 Threonine synthetase 5
MS1177 dapD
2.8 2,3,4,5-tetrahydropyridine-2,6-carboxylate N-
succinyltransferase
MS0924 metX 2.8 Homoserine O-acetyltransferase
MS0045 ilvC 2.3 Ketol acid reductoisomerase
MS0992 nrdA
3.0 Ribonucleotide reductase, alpha subunit
Nucleotide
metabolism and
transport
MS1197 pykA 2.6 Pyruvate kinase
Carbohydrate
metabolism and
transport
MS0967 glmM 2.4 Phosphoglucosamine mutase 1
MS1965 glpF 2.3 Aquporin Z (MIP family)
MS1615 fbp 2.1 Fructose 1,6-bisphosphatase
MS1111 chb 2.0 N-acetyl beta hexosaminidase (GH family)
MS0669 metK 5.0 S-adenosylmethionine synthetase Coenzyme
metabolism MS0503 hemB 2.2 Delta-aminolevulinic acid dehydratase
MS1446 3.1 Ribosome maturation protein RimP 3
Translation
MS1444 infB 3.1 Translation initiation factor IF-2 3
MS1442 rbfA 2.7 Ribosome binding factor A 2
MS2312 cca 2.5 tRNA nucleotidyltransferase 7
MS1441 truB 2.4 tRNA pseudouridine synthase B 2
MS1175 truA 2.0 tRNA pseudouridine synthase A
MS1445 nusA
3.7 Transcription termination/antitermination
protein
Transcription MS2131 araC 3.2 HTH-type transcriptional activator
MS1675 mraW
2.6 Ribosomal RNA small subunit
methyltransferase H 4
MS1331
2.1 DNA mismatch repair protein
Replication,
recombination and
repair
MS1565 mltE 3.4 Soluble lytic murein transglycosylase
Cell wall,
membrane,
envelope biogenesis
MS0387 3.2 Phosphoethanolamine transferase
MS1697 2.8 Opacity family porin protein
MS1189 kdsA 2.6 2-dehydro-3-deoxyphosphooctonate aldolase
MS0242 dgkA 2.3 Diacylglycerol kinase
MS1670 mraY
2.2 Phospho-N-acetylmuramoyl-pentapeptide-
transferase 4
MS0267 nlpE 2.1 Outer membrane protein assembly factor
MS1672 murE
2.1 UDP-N-acetylmuramoylalanyl-D-glutamate--
2,6-diaminopimelate ligase 4
MS1671 murF
2.1 UDP-N-acetylmuramoyl-tripeptide--D-alanyl-
D-alanine ligase 4
MS1922 lpxD
2.1 UDP-3-O-[3-hydroxymyristoyl] glucosamine
N-acyltransferase 5
MS1161 2.0 Opacity family porin protein
MS1829 dacC 2.0 D-alanyl-D-alanine carboxypeptidase
MS0993 degQ 2.9 Periplasmic serine proteases Molecular
chaperons and
related functions
MS1923 hlpA
2.5 Outer membrane protein, periplasmic
chaperone 5
MS1134 htpX 2.4 Protease HtpX

Results and Discussion
78
MS1141 sseA 2.7 Sulfurtransferase
Inorganic ion
transport and
metabolism
MS1417 pheA
2.2 Glutathione-regulated potassium-efflux system,
quinone oxidoreductase
MS1959 arsC 2.1 Arsenate reductase
MS1205 cirA 2.0 Iron complex outermembrane recepter protein
MS1131 tolC 2.0 Cation efflux system
MS2229 rseA 2.1 Sigma-E factor negative regulatory protein Signal transduction
MS1823 - 2.7 Glycerol-3-phosphate acyltransferase
Energy production
and conversion
MS1654 frdC - 2.7 Fumarate reductase subunit C 10
MS1028 - 2.6 Formate dehydrogenase, cytochrome b556
subunit
MS1655 frdD - 2.5 Fumarate reductase subunit D 10
MS1653 frdB - 2.4 Fumarate reductase, Fe-S protein subunit 10
MS1105 leuB - 2.2 Tartrate dehydrogenase/decarboxylase
MS1029 hybA - 2.2 Formate dehydrogenase iron-sulfur subunit
MS0551 proX - 12.7 ABC-type proline/glycine betaine transport
system, substrate binding protein 8
Amino acid
metabolism and
transport
MS0550 proW - 10.3
ABC-type proline/glycine betaine transport
systems, periplasmic components, permease
component
8
MS0549 proV - 8.8 ABC-type proline/glycine betaine transport
system, ATPase component 8
MS0353 alsT - 4.3 Na+/alanine or glycine symporter
MS1687 artM - 3.1 ABC-type amino acid transport system,
permease 11
MS0832 sstT - 2.8 Na+/serine-threonine symporter
MS1686 artM - 2.6 ABC-type amino acid transport system,
permease 11
MS0815 pepD - 2.4 Aminotripeptidase
MS1321 nhaC - 2.3 Arginine/ornithine antiporter
MS1790 aroQ - 2.3 3-dehydroquinate dehydratase II
MS1685 glnQ - 2.2 ABC-type amino acid transport system, ATPase
component 11
MS0030 gltS - 2.2 Na+/glutamate symporter
MS1770 cysK - 2.1 Cysteine synthase
MS1318 ilvH - 2.1 Acetolactate synthase, small subunit
MS1253 cysH - 2.0 Phosphoadenosine phosphosulfate reductase
MS2066 - 6.8 Maltose-inducible porin 17
Carbohydrate
metabolism and
transport
MS2068 malE - 4.0 ABC-type maltose transport systems, Maltose-
binding periplasmic protein 18
MS2069 malF - 3.6 ABC-type maltose transport systems, permease 18
MS2070 malG - 3.5 ABC-type maltose transport systems, permease 18
MS2074 malQ - 3.2 4-alpha-glucanotransferase 19
MS2073 glgP - 3.0 Glycogen phosphorylase 19
MS2071 malS - 2.9 Periplasmic alpha-amylase precursor
MS2067 malK - 2.8 ABC-type maltose transport systems, ATP-
binding protein 17
MS2065 - 2.1 Maltose regulon periplasmic protein
MS1795 menF - 3.7 Menaquinone specific isochorismate synthase 13
Coenzyme
metabolism
MS1254 cysG - 3.3 Uroporphyrinogen-III methyltransferase
MS1794 menD - 3.1 2-succinyl-5-enolpyruvyl-6-hydroxy-3-
cyclohexene-1-carboxylate synthase 13
MS1824 folB - 2.3 Dihydroneopterin aldolase 16
MS1793 mhpC - 2.3 2-succinyl-6-hydroxy-2,4-cyclohexadiene-1-
carboxylate synthase 13
MS1821 rluD - 2.4 Pseudouridylate synthases, 23S RNA-specific 15 Translation
MS1476 rpsA - 2.2 small subunit ribosomal protein S1
MS2116 lysR - 2.7 HTH-type transcriptional activator Transcription
MS0227 betT - 7.9 Choline-glycine betaine transporter
Cell wall,
membrane,
envelope biogenesis
MS1333 spr - 3.4 Cell wall-associated hydrolases (invasion-
associated proteins)
MS1808 artI - 3.0 Membrane-bound lytic murein transgycosylase
MS1220 ompA - 2.6 Outer membrane protein P5
MS1820 nrfG - 2.1 Outer membrane protein assembly factor
MS0911 rfe - 2.0 UDP-GlcNAc:undecaprenyl-phosphate
GlcNAc-1-phosphate transferase 9
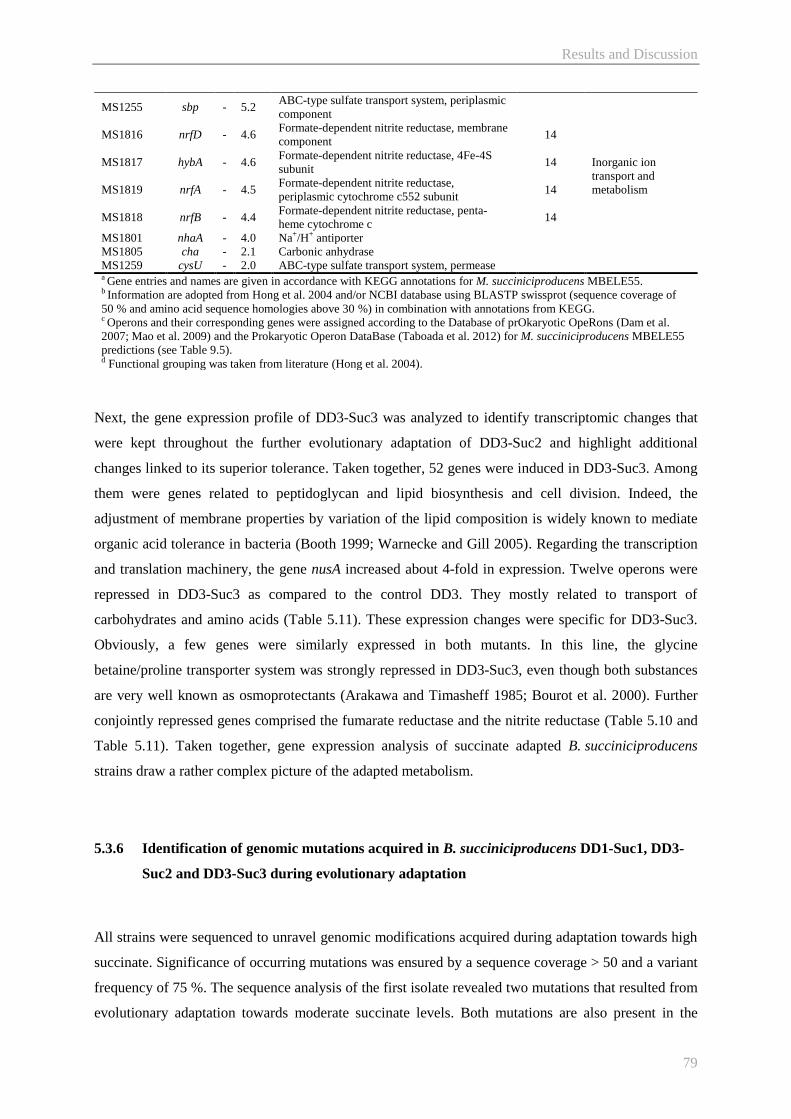
Results and Discussion
79
MS1255 sbp - 5.2 ABC-type sulfate transport system, periplasmic
component
Inorganic ion
transport and
metabolism
MS1816 nrfD - 4.6 Formate-dependent nitrite reductase, membrane
component 14
MS1817 hybA - 4.6 Formate-dependent nitrite reductase, 4Fe-4S
subunit 14
MS1819 nrfA - 4.5 Formate-dependent nitrite reductase,
periplasmic cytochrome c552 subunit 14
MS1818 nrfB - 4.4 Formate-dependent nitrite reductase, penta-
heme cytochrome c 14
MS1801 nhaA - 4.0 Na+/H+ antiporter
MS1805 cha - 2.1 Carbonic anhydrase
MS1259 cysU - 2.0 ABC-type sulfate transport system, permease a Gene entries and names are given in accordance with KEGG annotations for M. succiniciproducens MBELE55. b Information are adopted from Hong et al. 2004 and/or NCBI database using BLASTP swissprot (sequence coverage of
50 % and amino acid sequence homologies above 30 %) in combination with annotations from KEGG. c Operons and their corresponding genes were assigned according to the Database of prOkaryotic OpeRons (Dam et al.
2007; Mao et al. 2009) and the Prokaryotic Operon DataBase (Taboada et al. 2012) for M. succiniciproducens MBELE55
predictions (see Table 9.5). d Functional grouping was taken from literature (Hong et al. 2004).
Next, the gene expression profile of DD3-Suc3 was analyzed to identify transcriptomic changes that
were kept throughout the further evolutionary adaptation of DD3-Suc2 and highlight additional
changes linked to its superior tolerance. Taken together, 52 genes were induced in DD3-Suc3. Among
them were genes related to peptidoglycan and lipid biosynthesis and cell division. Indeed, the
adjustment of membrane properties by variation of the lipid composition is widely known to mediate
organic acid tolerance in bacteria (Booth 1999; Warnecke and Gill 2005). Regarding the transcription
and translation machinery, the gene nusA increased about 4-fold in expression. Twelve operons were
repressed in DD3-Suc3 as compared to the control DD3. They mostly related to transport of
carbohydrates and amino acids (Table 5.11). These expression changes were specific for DD3-Suc3.
Obviously, a few genes were similarly expressed in both mutants. In this line, the glycine
betaine/proline transporter system was strongly repressed in DD3-Suc3, even though both substances
are very well known as osmoprotectants (Arakawa and Timasheff 1985; Bourot et al. 2000). Further
conjointly repressed genes comprised the fumarate reductase and the nitrite reductase (Table 5.10 and
Table 5.11). Taken together, gene expression analysis of succinate adapted B. succiniciproducens
strains draw a rather complex picture of the adapted metabolism.
5.3.6 Identification of genomic mutations acquired in B. succiniciproducens DD1-Suc1, DD3-
Suc2 and DD3-Suc3 during evolutionary adaptation
All strains were sequenced to unravel genomic modifications acquired during adaptation towards high
succinate. Significance of occurring mutations was ensured by a sequence coverage > 50 and a variant
frequency of 75 %. The sequence analysis of the first isolate revealed two mutations that resulted from
evolutionary adaptation towards moderate succinate levels. Both mutations are also present in the

Results and Discussion
80
subsequent isolate DD3-Suc2. Interestingly the most tolerant strain DD3-Suc3 did not contain all
mutations present in its ancestors. This fact implies that it had evolved independently from the others
and at some point during evolution became fitter and outcompeted the other mutants from the
population. One can conclude that the mutation in the pta gene (MS0998) was the first one
accumulating in advance of the mutation in the pykA gene (MS1197).
Table 5.12 Single nucleotide polymorphisms (SNP) and deletion – insertion – polymorphisms (DIP) are listed with their
respective position specific nucleotide (Nt ex) and amino acid (AA ex) exchange in the succinate adapted strains
B. succiniciproducens DD3-Suc1, DD3-Suc2 and DD3-Suc3. The wild-type genome was annotated according to the
published M. succiniciproducens MBEL55E genome (Hong et al. 2004) and served as reference for detection of mutations in
the adapted phenotypes.
Strain An Nt ex AA ex Pm Gene Function
DD3-Suc1 MS0998 1996G>A Val666Ile SNP pta Phosphate acetyltransferase
MS1197 1391G>A Cys417Tyr SNP pykA Pyruvate kinase
DD3-Suc2 MS0998 1996G>A Val666Ile SNP pta Phosphate acetyltransferase
MS1197 1391G>A Cys417Tyr SNP pykA Pyruvate kinase
MS1875 62A>G Glu21Gly SNP acpP Acyl-carrier protein
DD3-Suc3 MS0904 1134A>T - SNP N.A. N.A.
MS0998 1996G>A Val666Ile SNP pta Phosphate acetyltransferase
MS1445 432delA Lys144fs DIP nusA Transcription
termination/antitermination factor
MS1494 846A>T - SNP rfaG Lipopolysaccharide glucosyltransferase
Pm: type of occurring polymorphism, N.A.: not assigned.
The deriving evolutionary tree that can be de deduced from the obtained sequencing data, visualized
the evolutionary process. The mutation affected genes contribute to energy production and conversion,
carbohydrate metabolism and transport, lipid metabolism, transcription, and cell wall, membrane, and
envelope biogenesis, respectively (Figure 5.22).
Figure 5.22 Genealogy tree for succinate adaptation of B. succiniciproducens DD3 towards 5, 10, and 25 g L-1 added
succinate, yielding DD3-Suc1, DD3-Suc2 and DD3-Suc, respectively. Systematic name and COG identifier (in brackets) are
taken from M. succiniciproducens MBEL55E annotation (Hong et al. 2004). For further information on the single
modifications see Table 5.12.

Results and Discussion
81
Taken together, B. succiniciproducens could be successfully adapted to increased succinate levels. The
adapted strains could be proven at high succinate levels, not feasible for the initially applied DD3. The
characterization of the molecular mechanisms behind the acquired tolerance, by careful growth
experiments and system biology approaches, revealed a complex picture. The increased tolerance
obviously resulted from concerted reduction of succinate formation, together with beneficial changes
in cellular constitutes such as osmoprotectants, and more robustness. With regard to rational
improvement of B. succiniciproducens, it appeared most relevant to dissect the types of tolerance
mechanisms, acquired during the adaptation process. Particularly, mutations that resulted in reduced
product formation seemed detrimental regarding industrial performance. Other genetic targets
however, promised the possibility to rationally achieve superior tolerant phenotypes.

Results and Discussion
82
5.4 Evolutionary adaptation of B. succiniciproducens towards lower pH-values
5.4.1 Adaptation of B. succiniciproducens towards pH 5.3
A desired low pH that would economize biotechnological succinate production represents a harsh
condition for non-acidophilic microorganisms. From the industrial perspective, a low pH reduces the
demand for costly acidification during downstream processing and for buffer agents, otherwise needed
to maintain the pH at neutral. Overall, production costs for succinate decrease with decreasing
cultivation pH (Jansen et al. 2012). B. succiniciproducens has its fermentative optimum within a pH
range of 7.5 to 6.0 (Figure 5.4) (Scholten et al. 2011). As shown, B. succiniciproducens DD3 exhibited
a reasonable fermentation performance at pH 6 (Figure 5.4) and produced about 40 g L-1
succinate
within 55 hours, while completely consuming the supplied glucose. A further decrease of the pH to
about 5.5, however, tremendously reduced the performance of DD3. Succinate was only produced up
to a titer of 11 g L-1
. An initial cultivation of the double mutant DD3 at pH 5.3 did not yield any
growth and succinate production so that pH 5.5 could be regarded as critical pH for growth and
production performance of B. succiniciproducens. According to these findings, pH adaptation started
at an initial pH-value of 5.5. In order to maintain and control the pH-value at desired levels, the
adaptation was conducted in small scale bioreactors equipped with automatic control of the pH and
operated as sequential batches.
Figure 5.23 Bioreactor based sequential batch adaptation of B. succiniciproducens DD3 under non-physiological pH values.
The vertical line indicates the switch from the primary critical pH 5.5 to pH 5.3. Once cells have reached sufficient cell
concentration, a fraction was harvested and inoculated into the next batch.
The first adaptation rounds showed slow but consistent growth. After about five days and during the
third iterative batch, cell density increased faster, indicating an adaptation of the population to the
acidic environment. The cells were allowed to further adapt to pH 5.5 before the cultivation pH was
decreased to 5.3. Interestingly, the cell growth was not significantly hampered, despite certain lag-

Results and Discussion
83
phases at the beginning of each batch. Through further adaptation, the lag-phases shortened and cells
grew quickly at pH 5.3. Finally, the heterogenic population was used to isolate the pH-tolerant
phenotype DD3-pH1.
5.4.2 Physiology of the pH-tolerant strain B. succiniciproducens DD3-pH1
Closer inspection of the growth performance of the isolated strain DD3-pH1 was carried out to
describe its superior performance. Bioreactor cultivations were conducted at various pH-values at
37 °C in minimal glucose medium and growth as well as production performance were monitored in
comparison to the parent strain DD3 (Table 5.13).
Table 5.13 Fermentation performance of pH-tolerant phenotype B. succiniciproducens DD3-pH1 at different pH-values in
bioreactor cultivation, as compared to its ancestor DD3. Growth rate (µ) is given for the exponential growth phase. Succinate
yield (YSuc/S) and maximal succinate productivity (PSuc) are calculated for the complete 48 h period of cultivation. Product
titers for succinate (ΔcSuccinate), formate (ΔcFormate), acetate (ΔcAcetate), lactate (ΔcLactate), ethanol (ΔcEthanol) and pyruvate
ΔcPyruvate) represent final concentrations after 48 h.
DD3 DD3-pH1
pH 6 pH 5.5 pH 5.3 pH 6 pH 5.5 pH 5.2 pH 5.0
µ [h-1] 0.18 0.10 0.02 0.22 0.17 0.09 < 0.01
YSuc/S [mol mol-1] 0.93 0.86 - 0.99 1.01 0.95 < 0.1
ΔcSuccinate [g L-1] 39.1 10.6 1.0 40.8 21.5 11.5 < 0.1
ΔcFormate [g L-1] < 0.1 < 0.1 < 0.1 < 0.1 < 0.1 < 0.1 < 0.1
ΔcAcetate [g L-1] 2.6 2.1 0.4 1.1 3.8 1.5 < 0.1
ΔcPyruvate [g L-1] 0.3 < 0.1 < 0.1 1.2 0.5 < 0.1 < 0.1
ΔcEthanol [g L-1] < 0.1 < 0.1 < 0.1 0.1 < 0.1 < 0.1 < 0.1
ΔcLactate [g L-1] < 0.1 0.2 < 0.1 0.1 0.1 0.1 < 0.1
PSuc [g L-1 h-1] 0.8 0.2 < 0.1 1.3 0.5 0.3 < 0.1
At pH 6.0, the evolved strain DD3-pH1 exceeded the performance of DD3 in maximal productivity by
about 60 % and in growth rate by about 20 % (Table 5.13). A pH-value of 5.5 reduced growth and
succinate production. However, the evolved mutant performed by far better than DD3. This fact
indicated the successful adaptation of B. succiniciproducens to lower pH-values. At pH 5.2, which
partially abolished DD3 proliferation, the adapted phenotype was still able to grow exponentially and
produced 11 g L-1
succinate. Further decrease to a pH of 5.0, however, was not tolerated by DD3-pH1.
The graphical presentation of the resulting growth rates at different pH values clearly reveals the
superiority of the evolved strain (Figure 5.24). For all pH-values tested, DD3-pH1 data points were
located closer to the area of fast growth and low pH, preferred as industrial settings.

Results and Discussion
84
Figure 5.24 The specific growth rate is shown for (■) B. succiniciproducens DD3 and (●) DD3-pH1 at different pH-values.
Data derive from pH-controlled bioreactor cultivations in minimal glucose medium. The color gradient represents industrially
desired (green) and unfavored (orange) characteristics.
5.4.3 Adaptation derived genetic modifications in DD3-pH1
As verified by genome sequencing, B. succiniciproducens DD3-pH1 accumulated only two mutations.
The affected genes belonged to the functional groups of carbohydrate metabolism and cell wall,
membrane, envelope biogenesis. A closer view revealed that the first mutation was located in the
pyruvate kinase gene, which had also evolved in the succinate adapted strains. In addition, a gene
belonging to the cell wall synthesis apparatus harbored a frame-shift mutation, putatively leading to an
incomplete protein.
Table 5.14 Single nucleotide polymorphisms (SNP) and deletion – insertion – polymorphisms (DIP) with their respective
position specific nucleotide (Nt ex) and amino acid (AA ex) exchange in the pH adapted strains B. succiniciproducens DD3-
pH1.
Strain An Nt ex AA ex Pm Gene Function
DD3-pH1 MS1197 640G>T Gly167Cys SNP pykA Pyruvate kinase
MS1492 80_81insC Tyr27fs DIP wcaJ EpsL like protein
Pm: type of occurring polymorphism.
Overall, the successful pH adaptation of B. succiniciproducens yielded the promising new phenotype
DD3-pH1. Its superior performance at low pH-values, as compared to its ancestor DD3 (Figure 5.24)
showed high potential with regard to industrial applicability. In addition, the small number of
evolutionary acquired mutations is a good starting point for rationally engineering towards this
phenotype.

Results and Discussion
85
5.5 Metabolic engineering of B. succiniciproducens exploiting targets identified
from evolutionary adaptation
As shown, B. succiniciproducens mutants established a narrow set of genetic mutations, which
obviously contributed to their improved phenotypes. It now was highly interesting to test candidate
genes individually in order to see to which extent they allow a rational improvement of the producing
strains. According to obtained sequence data and the knowledge of the physiology and biochemistry of
B. succiniciproducens, different second-generation mutants were created on basis of producing strains.
Vector construction and subsequent transformation of E. coli and B. succiniciproducens as well as
control of integration were applied according to 4.3.
5.5.1 Modification of the pyruvate node at the level of pyruvate kinase
The pyruvate kinase gene pykA was mutated independently during the evolutionary adaptation to high
succinate levels and to low pH, respectively. This indicated a central role of the metabolic reaction of
the encoded enzyme, i.e. the interconversion of PEP to pyruvate. Indeed, a re-direction of carbon
fluxes was observed at the pyruvate node in the adapted strains (Figure 5.10, Figure 5.17 and Figure
5.18). The node is relevant for distributing cellular carbon flux between different pathways, i.e. TCA
cycle, anaplerosis, gluconeogenesis, anabolism and overflow metabolism and to flexibly adapt the
supply of energy and building block to cellular needs (Sauer and Eikmanns 2005). Particularly under
anaerobic conditions, the pyruvate node is important for redox-balancing. Different approaches have
been attempted to engineer the node by rational strain development (Becker et al. 2013). However,
considering the complexity of the interlinked metabolic networks around the node, knockout-studies in
E. coli showed important effects on glycolysis, PPP and by-product formation (Siddiquee et al. 2004).
The genomic sequencing of the adapted strains revealed a nucleotide exchange in the pykA gene of
DD3-Suc2, replacing cysteine at position 417 by tyrosine. The pH-adapted DD3-pH1 revealed a pykA
mutation leading to substitution of Gly167
to Cys. In order to obtain second generation mutants, the
first step of the engineering strategy, deletion of the gene, was attempted, but did not result in positive
clones. Then, direct homologue recombination of mutated and native gene was pursued as second
strategy, but permanently revealed the parental genotype.
As genetic engineering strategies could not be completed successfully, the study of the effect of the
acquired mutations on enzyme kinetics seemed interesting. Regarding the enzyme structure, both
modifications were located in proximity to the allosteric and the active site, respectively, when
mapped against G. stearothermophilus (PDB ID: 2E28 (Suzuki et al. 2008)). This potentially indicated
that both, enzyme control and activity were affected. To further study this, experiments were

Results and Discussion
86
conducted to investigate the kinetic properties of pyruvate kinase for the wild-type and the mutated
variants. The comparative assays were carried out with cell extract from DD3, DD3-Suc2 and DD3-
pH1 and with varied concentrations of PEP as substrate.
A substrate inhibition model described the data well (Equation 2), where [S] is the substrate
concentration, KI represents the dissociation constant for the binding of the inhibitor to the free
enzyme, KM represents the Michaelis constant and υ and υmax are reaction rate and maximal reaction
rate, respectively. Such a behavior seemed consistent with the metabolism of B. succiniciproducens,
since the primary pathway for PEP runs via the PEPCK. Thus PEP-dependent inhibition of pyruvate
kinase seems to be involved in the control of succinate production.
Figure 5.25 Enzyme kinetics of pyruvate kinase. The data points for (●) B. succiniciproducens DD3, (■) DD3-Suc2 and (▲)
DD3-pH1 represent mean values of three replicates and their corresponding standard deviation. In all cases, higher levels of
PEP inhibited the enzyme.
Regarding the obtained characteristics, all three enzyme variants strongly differed from each other in
their kinetics (Figure 5.25 and Table 5.16). The wild-type enzyme revealed a theoretical maximum
reaction rate of about 3000 mU mg-1
, combined with a high substrate affinity. The variant from DD3-
Suc2, putatively affected at the allosteric site, exhibited a decrease of the maximal activity by about
60 %. In addition, the KM-value increased about 8-fold, resulting in significantly less substrate affinity.
The pyruvate kinase of DD3-pH1 exhibited a similar KM-value, as compared to the wild-type enzyme,
but its maximal enzyme activity was decreased by 70 %, with a substantially higher KI-value. Taken
together, the mutated enzymes appeared strongly reduced in their in vivo activity, which suggested a
potential re-direction of flux towards the reductive TCA cycle. Generally, the attenuation and deletion
of pyruvate kinase in bacteria resulted in a re-direction of flux at the pyruvate node by stimulating
(Equation 2)

Results and Discussion
87
anaplerotic reactions at the interconversion of PEP and OAA (Emmerling et al. 2002; Becker et al.
2008; Meza et al. 2012). In all cases, the substantially decreased enzyme activity of the mutated
variants is assumed to match with the desired changes, so that a positive effect on succinate production
can be expected.
Table 5.15 Enzyme kinetics of pyruvate kinase of B. succiniciproducens DD3, DD3-Suc2 and DD3-pH1. The values
represent modeled data, assuming substrate inhibition kinetics. The underlying assays were conducted as three biological
replicates.
Strain vmax [mU mg-1] KM [mM] KI [mM]
DD3 3041 2.4 46.8
DD3-Suc2 1158 22.7 62.1
DD3-pH1 931 1 147.5
5.5.2 Transcription machinery engineering of B. succiniciproducens through overexpression of
a mutated rpoC
Genomic analysis of adapted B. succiniciproducens DD3-T2 revealed a modification in the beta'-
subunit of the DNA-directed RNA polymerase, which may contribute to RNA synthesis and DNA
interaction (Nedea et al. 1999). Hereby, a nucleotide exchange resulted in the change of Thr231
to Lys.
This modification locus might affect the global transcription machinery, which has a high potential in
strain improvement (Alper and Stephanopoulos 2007). Structural analysis of the identified mutation
within the bacterial multisubunit RNA polymerase revealed no obvious contribution to conserved
domains (Lane and Darst 2010).
Table 5.16 Growth and production characteristics of B. succiniciproducens DD3 pJFF224-XN and DD3 pSUC-1 showing
the impact of overexpressing the mutated polymerase subunit encoded by rpoCT231K at 37 °C. The data comprise specific
growth rate (µ), biomass yield (YX/S), succinate yield (YSuc/S), formate yield (YFor/S), acetate yield (YAce/S), lactate yield
(YLac/S), ethanol yield (YEtOH/S), pyruvate yield (YPyr/S) and maximal succinate productivity (PSuc). Data represent values from
three biological replicates with their corresponding standard deviations in minimal glucose medium, supplemented with
5 mg L-1 chlorampehnicol as selection marker.
DD3 pJFF224-XN DD3 pSUC-1
µ [h-1] 0.06 ± 0.01 0. 11 ± 0.01
YX/S [g mol-1] 17.9 ± 1.5 26.3 ± 1.4
YSuc/S [mol mol-1] 1.19 ± 0.03 1.18 ± 0.07
YFor/S [mol mol-1] < 0.01 < 0.01
YAce/S [mol mol-1] 0.34 ± 0.03 0.15 ± 0.01
YLac/S [mol mol-1] < 0.01 < 0.01
YEtOH/S [mol mol-1] < 0.01 < 0.01
YPyr/S [mol mol-1] 0.06 ± 0.01 0.18 ± 0.02
PSuc [g L-1 h-1] 0.33 ± 0.02 0.56 ± 0.04
Yields were determined during exponential phase by linear fitting of the
concentration of biomass and product with that of the substrate.

Results and Discussion
88
In order to investigate the effect of this mutated polymerase, the gene was co-expressed in DD3 via a
plasmid, yielding DD3 pSUC-1. The constructed plasmid contained the mutated gene under control of
the native promoter. The point mutation was validated by sequencing and plasmid carriage was
guaranteed by addition of 5 mg L-1
chloramphenicol to the medium.
Taken together, the engineered mutant revealed a remarkably improved production performance. In
particular, the overexpression yielded a better growth performance with a twofold increased maximal
growth rate and an increased succinate production, as compared to the control DD3 pJFF224-XN,
carrying the empty vector (Table 5.16). The specific yield for succinate remained at the high level of
the parent strain. It was now interesting to test the effect of overexpressing the mutated polymerase
subunit for its contribution to temperature tolerance, considering its acquisition during the
evolutionary adaptation towards higher temperature. The cultivation of DD3 pSUC-1 at 42 °C
revealed improved growth and succinate production, as compared to DD3 pJFF224-XN. It even
exceeded the performance of the basic strain DD3 by 30 %, regarding cell concentration and succinate
titer, respectively (Figure 5.26). However, cell growth stopped at a maximal concentration equivalent
to OD600 of about 3, indicating further temperature sensitive parts of the metabolism.
Figure 5.26 Growth physiology of the rationally engineered (▲) B. succiniciproducens DD3 pSUC-1 compared to the
control strains (●) DD3 and (■) DD3 pJFF224-XN at 42 °C in minimal glucose medium, supplemented with 5 mg L-1
chloramphenicol, for retaining the plasmid. Data comprise growth (A) and succinate titer (B) from three biological replicates
with corresponding standard deviations.
Obviously, the rpoC mutation affected the cellular propagation in a beneficial manner. Its plasmid
based introduction into B. succiniciproducens DD3 improved growth and production performance at
both temperatures, i.e. 37 and 42 °C, respectively, as compared to DD3 pJFF224-XN. First, these
observations proved the temperature tolerant phenotype to be very complex, due to the multitude of
genes that might be affected by an altered transcription machinery (Alper and Stephanopoulos 2007).
Nevertheless, the identified rpoC modification could improve the competitiveness of succinate
production with B. succiniciproducens.

Results and Discussion
89
5.5.3 Engineering of cell envelope metabolism through a mutation in a sugar transferase
During high temperature adaptation, B. succiniciproducens DD3 acquired a mutation in the rfe gene,
encoding for the UDP-GlcNAc:undecaprenyl-phosphate GlcNAc-1-phosphate transferase. Rfe is an
integral membrane protein with 11 predicted transmembrane helices. Known functions of this gene are
associated to outer membrane glycolipid compounds in Gram-negative cells (Lehrer et al. 2007).
Sequence analysis located the amino acid exchange Thr16
to Pro in the first transmembrane helix,
belonging to the presumed functional N-terminal region (Amer and Valvano 2000). However,
transmembrane helix prediction (http://www.cbs.dtu.dk/services/TMHMM/) revealed no changes in
the structure. In a next step, both, the complete disruption of the rfe gene and the site-specific
integration of the point mutation, were tested for phenotypic effects within B. succiniciproducens by
constructing the strains DD3 Δrfe and DD3 rfeT16P
, respectively.
Table 5.17 Physiology of rationally engineered strains B. succiniciproducens DD3 Δrfe and DD3 rfeT16P compared to DD3.
Data comprise specific growth rate (µ), biomass yield (YX/S), succinate yield (YSuc/S), formate yield (YFor/S), acetate yield
(YAce/S), lactate yield (YLac/S), ethanol yield (YEtOH/S), pyruvate yield (YPyr/S) and maximal succinate productivity (PSuc). Data
represent values from three biological replicates in minimal glucose medium with corresponding standard deviations.
DD3 DD3 Δrfe DD3 rfeT16P
µ [h-1] 0.16 ± 0.01 0.06 ± 0.01 0. 20 ± 0.01
YX/S [g mol-1] 29.8 ± 2.5 12 ± 1.1 33.8 ± 2.5
YSuc/S [mol mol-1] 1.13 ± 0.04 1.1 ± 0.04 1.05 ± 0.07
YFor/S [mol mol-1] < 0.01 < 0.01 < 0.01
YAce/S [mol mol-1] 0.21 ± 0.06 0.23 ± 0.06 0.44 ± 0.03
YLac/S [mol mol-1] < 0.01 < 0.01 < 0.01
YEtOH/S [mol mol-1] < 0.01 < 0.01 < 0.01
YPyr/S [mol mol-1] 0.16 ± 0.03 < 0.01 0.03 ± 0
PSuc [g L-1 h-1] 0.76 ± 0.01 0.31 ± 0.07 0.62 ± 0.02
Yields were determined by linear fitting of the concentration of biomass and product with that of
the substrate.
First, deletion of the rfe gene in B. succiniciproducens DD3 clearly impaired growth and specific
biomass formation (Table 5.17), besides it caused a flocculent biomass appearance. Additionally, only
15 g L-1
succinate were produced, as compared to 36 g L-1
with DD3 after 48 h. Introduction of the
evolved gene variant now improved the specific growth rate by 20 %, as compared to the basic strain.
However, succinate productivity slightly decreased (Table 5.17). In a next step, DD3 rfeT16P
was tested
for its temperature tolerance at 42 °C (Figure 5.27). Interestingly, the strain steadily grew throughout a
48 h period to a final cell concentration corresponding to an OD600 of 4. Hereby, succinate was
produced with a titer of about 9 g L-1
. Thus, the second generation mutant exceeded the performance
of DD3 in both, growth and succinate production, respectively. This indicates the contribution of rfe in
temperature adaptation by possibly affecting cell envelope composition as previously discussed for
other bacteria (Yuk and Marshall 2003; Koga 2012).

Results and Discussion
90
Figure 5.27 Physiologic characterization of second generation mutant (▲) B. succiniciproducens DD3 rfeT16P compared to
its ancestor (●) DD3 at 42 °C in minimal glucose medium. Data comprise growth (A) and succinate titer (B) of a 48 h
cultivation period. Data derive from three biological replicates with corresponding standard deviations.
Overall, the introduction of the evolutionary acquired point mutation in rfe was proved highly
advantageous for B. succiniciproducens performance. At both temperatures, 37 and 42 °C,
respectively, DD3 rfeT16P
showed improved growth performance. At high temperature, succinate titer
increased by about 65 % as compared to DD3, suggesting further consideration for industrial
application.
5.5.4 Improving cellular sedimentation by engineering cell envelope metabolism
Low pH adaptation revealed a mutation in B. succiniciproducens DD3-pH1 in the gene wcaJ by
nucleotide insertion in Tyr27
. This led to a frame shift mutation, introducing a stop codon at this very
position, thus generating a truncated wcaJ-variant. Homology analysis revealed a conserved domain in
wcaJ, dedicated to a bacterial sugar transferase function, that is supposed to be a part of the B. subtilis-
like exopolysaccharide synthesis machinery (van Kranenburg et al. 1997; Nagorska et al. 2010).
During cultivation of DD3-pH1, significantly faster cell sedimentation was observed with this strain,
indicating changes in cellular composition. To verify the functional relationship between this
improved and industrially attractive sedimentation performance and the frame shift mutation,
DD3 wcaJT27fs
was constructed, carrying the genome based modification.
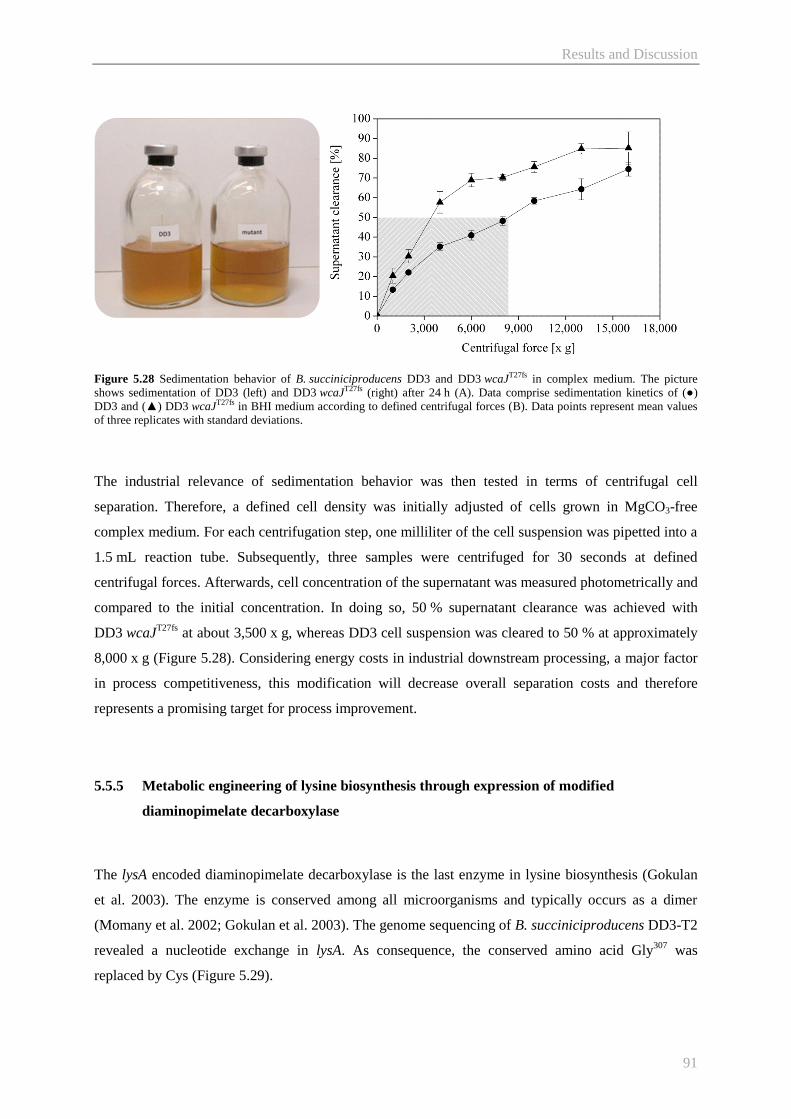
Results and Discussion
91
Figure 5.28 Sedimentation behavior of B. succiniciproducens DD3 and DD3 wcaJT27fs in complex medium. The picture
shows sedimentation of DD3 (left) and DD3 wcaJT27fs (right) after 24 h (A). Data comprise sedimentation kinetics of (●)
DD3 and (▲) DD3 wcaJT27fs in BHI medium according to defined centrifugal forces (B). Data points represent mean values
of three replicates with standard deviations.
The industrial relevance of sedimentation behavior was then tested in terms of centrifugal cell
separation. Therefore, a defined cell density was initially adjusted of cells grown in MgCO3-free
complex medium. For each centrifugation step, one milliliter of the cell suspension was pipetted into a
1.5 mL reaction tube. Subsequently, three samples were centrifuged for 30 seconds at defined
centrifugal forces. Afterwards, cell concentration of the supernatant was measured photometrically and
compared to the initial concentration. In doing so, 50 % supernatant clearance was achieved with
DD3 wcaJT27fs
at about 3,500 x g, whereas DD3 cell suspension was cleared to 50 % at approximately
8,000 x g (Figure 5.28). Considering energy costs in industrial downstream processing, a major factor
in process competitiveness, this modification will decrease overall separation costs and therefore
represents a promising target for process improvement.
5.5.5 Metabolic engineering of lysine biosynthesis through expression of modified
diaminopimelate decarboxylase
The lysA encoded diaminopimelate decarboxylase is the last enzyme in lysine biosynthesis (Gokulan
et al. 2003). The enzyme is conserved among all microorganisms and typically occurs as a dimer
(Momany et al. 2002; Gokulan et al. 2003). The genome sequencing of B. succiniciproducens DD3-T2
revealed a nucleotide exchange in lysA. As consequence, the conserved amino acid Gly307
was
replaced by Cys (Figure 5.29).

Results and Discussion
92
B. subtilis
C. glutamicum
E. coli
Y. pseudotuberculosis
H. influenza
A. succinogenes
M. succiniciproducens
B. succiniciproducens
DD3-T2
Consensus
Figure 5.29 The alignment is shown for LysA proteins from different bacteria with the respective consensus sequence. The
position of the evolutionary acquired amino acid exchange in B. succiniciproducens DD3-T2 is shown in blue, in respect to
the aligned sequences.
Initially, the potential impact of lysine biosynthesis on temperature tolerance was analyzed by
studying the growth effect of the wild-type by adding lysine to minimal medium. Compared to DD1,
grown without external lysine, DD1 supplemented with 3 mM lysine grew to a cell concentration
corresponding to OD600 of 6 and produced significantly more succinate, as compared to the control
(Figure 5.30). Obviously, the lysine pathway is heat-sensitive and thus linked to growth of
B. succiniciproducens at elevated temperatures.
Figure 5.30 Growth and production performance of B. succiniciproducens DD1 in minimal glucose medium at 42 °C. Given
data comprise the growth of (●) DD1 and (▲) DD1, supplemented with 3 mM lysine (A) and their respective succinate titer
after 24 h cultivation period (B). Asterisk indicates lysine supplemented wild-type. Data derive from three biological
replicates with corresponding standard deviations.
Regarding the consequence of the mutation on the enzyme, position specific analysis with the E. coli
homologue revealed an introversive orientation of the modification locus, suggesting an enzyme
stabilizing function while excluding dimer specific stabilization (PDB ID: 1KNW (Levdikov et al.
2003)) (Figure 5.31). This is supported by the beneficial growth effect of glycine betaine at high
temperature (Table 5.2). In this line, the natural diaminopimelate decarboxylase seemed temperature
instable.

Results and Discussion
93
Figure 5.31 Overview of E. coli diaminopimelate decarboxylase (PDB ID: 1KNW (Levdikov et al. 2003)). Arrow indicates
inward orientation of nucleotide exchange affected amino acid position (yellow) after homology study of
B. succiniciproducens lysA sequence relative to E. coli sequence (left). This is supported by the calculated surface (Conolly
method; probe radius 1.399) that reveals no outward orientation of the exchanged amino acid (right). Yellow domains are
associated to other sulfur containing amino acids.
Introduction of the obtained modification into the priorly engineered production strain
B. succiniciproducens DD5 yielded the second generation mutant DD5 lysAG307C
, which was verified
by sequencing of the site-specific PCR product. Cultivation of DD5 lysAG307C
, in minimal glucose
medium at 42 °C, showed stable growth and production performance. The succinate titer increased by
nearly 400 % to about 27 g L-1
with a significantly improved maximal succinate productivity of
0.8 g L-1
h-1
, as compared to DD3 (Table 5.18). However, glucose was not completely consumed, in
contrast to the temperature tolerant mutant DD3-T2. This indicated further temperature sensitive
metabolic burdens. At 37 °C, the engineered strain DD5 lysAG307C
performed better than DD3
regarding growth and succinate productivity, which increased by about 60 % and 30 %, respectively.
Table 5.18 Growth and production characteristics of B. succiniciproducens DD5 lysAG307C compared to DD3. Data comprise
specific growth rate (µ), biomass yield (YX/S), succinate yield (YSuc/S), formate yield (YFor/S), acetate yield (YAce/S), lactate
yield (YLac/S), ethanol yield (YEtOH/S), pyruvate yield (YPyr/S) and maximal succinate productivity (PSuc). Data represent values
from three biological replicates in minimal glucose medium with their corresponding standard deviations.
DD3 DD5 lysAG307C
37 °C 42 °C 37 °C 42 °C
µ [h-1] 0.16 ± 0.01 - 0.26 ± 0 0. 25 ± 0
YX/S [g mol-1] 29.8 ± 2.5 19.2 ± 2.2 34.1 ± 1.9 30.3 ± 1.9
YSuc/S [mol mol-1] 1.13 ± 0.04 1.08 ± 0.12 1.08 ± 0.01 1.10 ± 0.04
YFor/S [mol mol-1] < 0.01 < 0.01 < 0.01 < 0.01
YAce/S [mol mol-1] 0.21 ± 0.06 0.29 ± 0.02 0.33 ± 0.02 0.41 ± 0.04
YLac/S [mol mol-1] < 0.01 < 0.01 < 0.01 < 0.01
YEtOH/S [mol mol-1] < 0.01 < 0.01 < 0.01 < 0.01
YPyr/S [mol mol-1] 0.16 ± 0.03 0.11 ± 0.01 0.08 ± 0.01 0.03 ± 0.01
PSuc [g L-1 h-1] 0.76 ± 0.01 0.16 ± 0.02 0.97 ± 0.01 0.8 ± 0.05
Yields were determined during exponential phase by linear fitting of the concentration of biomass and product with that
of the substrate.

Results and Discussion
94
Taken together, introduction of a modified diaminopimelate decarboxylase, carrying an evolutionary
acquired point mutation, showed significantly advanced performance of B. succiniciproducens at
standard and at high temperature, obviously improving industrial potential.
5.5.6 Metabolic engineering of by-product spectrum through expression of a modified
phosphate acetyltransferase
During high succinate adaptation, B. succiniciproducens acquired a mutation in the pta gene, encoding
for the phosphate acetyltransferase. Significance of this gene is related to the acetate biosynthetic
pathway, which is directly coupled to energy production via ATP formation in M. succiniciproducens
MBEL55E (Lee et al. 2006). Disruption of this pathway by deletion of the ackA gene led to decreased
growth performance (Lee et al. 2006) and indicated cellular need for this reaction. To verify the
phenotypic effect of the acquired mutation, strain DD1 Δldh ptaV666I
was constructed. Introduction of
the point mutation was validated by sequencing of the site-specific PCR product.
Table 5.19 Physiology of B. succiniciproducens DD1 and DD1 Δldh ptaV666I. The data comprise specific growth rate (µ),
biomass yield (YX/S), succinate yield (YSuc/S), formate yield (YFor/S), acetate yield (YAce/S), lactate yield (YLac/S), ethanol yield
(YEtOH/S), pyruvate yield (YPyr/S) and maximal succinate productivity (PSuc). Data represent values from three biological
replicates with standard deviation in minimal glucose medium.
DD1 DD1 Δldh ptaV666I
µ [h-1] 0.29 ± 0.01 0.43 ± 0.01
YX/S [g mol-1] 35.6 ± 0.2 34.5 ± 1.5
YSuc/S [mol mol-1] 0.76 ± 0.03 0.72 ± 0.07
YFor/S [mol mol-1] 0.58 ± 0.02 0.15 ± 0.02
YAce/S [mol mol-1] 0.57 ± 0.01 0.31 ± 0.02
YLac/S [mol mol-1] 0.03 ± 0 < 0.01
YEtOH/S [mol mol-1] 0.03 ± 0 < 0.01
YPyr/S [mol mol-1] < 0.01 0.04 ± 0.01
PSuc [g L-1 h-1] 1.42 ± 0.04 0.78 ± 0.06
Yields were determined during exponential phase by linear fitting of the
concentration of biomass and product with that of the substrate.
Obviously, cell growth was positively affected in DD1 Δldh ptaV666I
, as compared to the wild-type
DD1. Interestingly, despite similar yields for biomass and succinate, the by-product spectrum changed
in DD1 Δldh ptaV666I
. Formate and acetate were formed with about 75 and 50 % decreased yields,
respectively, while pyruvate accumulated extracellular. This observation is supported by similar
results for acetate and pyruvate yield in high succinate evolved strains DD3-Suc1, DD3-Suc2 and
DD3-Suc3 (Table 5.8). This indicates a change in carbon distribution in B. succiniciproducens
metabolism, since pyruvate was not observed as by-product in the wild-type and other wild-type
succinate producing microorganisms (Lee et al. 2002; McKinlay et al. 2005; Becker et al. 2013).
Moreover, this emphasizes the inevitability of future engineering rounds regarding further by-

Results and Discussion
95
products, especially pyruvate-based substances, as observed with the rationally engineered double
mutant DD3 (Becker et al. 2013) and due to the high flexibility of the pyruvate node, observed with all
adapted strains. Taken together, the mutation in the pta gene seemed to affect the carbon distribution
regarding by-product formation in B. succiniciproducens, which is a highly relevant fact concerning
industrial succinate production. Even though pyruvate filled in for formate and acetate, its higher
tolerability, compared to formate and acetate (Lin et al. 2008), gives a promise for future performance
and titer improvements.

Results and Discussion
96
5.6 Succinate production of evolved strains in industrial glycerol medium
In order to assess the production performance on raw materials, such as glycerol, the adapted strains
B. succiniciproducens DD3-T2 and DD3-Suc2 were cultivated in a maltose/glycerol based complex
medium and compared to their ancestor DD3.
Table 5.20 Production characteristics of B. succiniciproducens DD3 and the evolved phenotypes DD3-T2 and DD3-Suc2 in
complex glycerol medium. Data comprise specific cell growth (µ), consumption of glycerol and maltose, formation of
succinate, acetate, pyruvate, lactate and formate, maximal succinate productivity (PSuc) and specific succinate yield (YSuc/S).
Data represent mean values of three biological replicates with corresponding standard deviations.
DD3 DD3-T2 DD3-Suc2
µmax 0.22 ± 0.01 0. 29 ± 0.01 0.32 ± 0.01
ΔcGlycerol [g L-1] 15.0 ± 0.6 47.1 ± 0.8 27.0 ± 0.6
ΔcMaltose [g L-1] 16.0 ± 0 20 ± 0 17.2 ± 0.1
ΔcSuccinatel [g L-1] 27.2 ± 1.1 74.3 ± 3.0 44.1 ± 2.1
ΔcAcetate [g L-1] 1.7 ± 0.2 1.6 ± 1.4 1.8 ± 0.2
ΔcPyruvate [g L-1] 0.4 ± 0.1 0.2 ± 0 0.6 ± 0.1
ΔcLactate [g L-1] < 0.1 1.0 ± 0.2 0.1 ± 0
ΔcFormate [g L-1] < 0.1 < 0.1 < 0.1
PSuc [g L-1 h-1] 1.07 ± 0.13 2.94 ± 0.26 1.82 ± 0.09
YSuc/S [Cmol Cmol-1] 0.92 ± 0.06 1.13 ± 0.04 0.99 ± 0.05
Cmol yield was determined during exponential phase by linear fitting of the C molar
concentration of product with that of the substrates.
The two adapted strains showed improved growth rates (Table 5.20). During 24 h, DD3-T2 nearly
completely consumed the provided glycerol, accompanied by complete maltose consumption and
produced about 75 g L-1
succinate, three times more than DD3.
B. succiniciproducens DD3-T2
M. succiniciproducens
A. succiniciproducens
A. succinogenes
E. coli
Figure 5.32 Maximal succinate productivity of B. succiniciproducens DD3-T2 (Table 5.20) as compared to other succinate
producers. Reviewed data (Beauprez et al. 2010) comprise M. succiniciproducens (Lee et al. 2002), A. succiniciproducens
(Glassner and Datta 1992), A. succinogenes (Guettler 1998) and E. coli (Andersson et al. 2007). Cultivations were conducted
as anaerobic or dual-phase batches with complex medium.

Results and Discussion
97
The succinate productivity was increased about 2.5-fold, as compared to the ancestor strain DD3
(Table 5.20). Compared to other industrial succinate producers, the performance of DD3-T2 exceeds
that of conventional batch fermentations (Figure 5.32). Furthermore, the observed productivity
matches the industrial prerequisite of about 2.5 g L-1
h-1
(Werpy and Peterson 2004). Thus,
evolutionary adaptation and the derived mutant B. succiniciproducens DD3-T2 enabled superior bio-
succinate production and displayed a mile-stone towards industrial production of this high-value
chemical.

Conclusion and Outlook
98
6 Conclusion and Outlook
The present work dealt with the systematic evolutionary adaptation of succinate producing
B. succiniciproducens towards an improved industrial process for this top-value chemical. Initially, the
approach comprised the establishment of a sequential batch culture, developed for serum bottles and
small scale bioreactors, to specifically adapt the microorganism to industrial parameters, i.e. high
temperature, high succinate levels and low pH. The analysis of successfully evolved phenotypes
recruited comparative cultivation experiments and in-depth omics profiling to shed light on metabolic
responses, underpinning the evolutionary adaptation. Hereby, only few acquired mutations seemed to
be involved in the significant expansion of B. succiniciproducens tolerance, i.e. the derived mutants
DD3-T2, DD3-Suc3 and DD3-pH1 could grow at 42 °C, 25 g L-1
succinate and a pH-value of 5.2,
respectively, far beyond the values tolerated by the wild-type. Targets could be identified, suitable for
eventual optimization strategies regarding tolerance and performance improvements. Finally, studying
the effect of introducing identified targets into producing strains revealed faster growth, higher
productivity, increased tolerance and simplified biomass separation. Hence, this work contributes to
the realization of a bio-economical succinate process, enabling future opportunities towards
competitive and sustainable succinate production.
In context with such industry scale succinate production, process requirements emerge, previously
reviewed in different reports (Werpy and Peterson 2004; Patel et al. 2006; Bastidon 2012). Hereby, the
industry has to contemplate on technological progress to accomplish several key challenges, i.e. (i) to
achieve high productivities, ideally exceeding the benchmark of 2.5 g L-1
h-1
, (ii) to reduce unfavored
by-products, (iii) to increase titers above 100 g L-1
, (iv) to develop low-cost media in combination with
robust and unpretentious production strains, (v) to optimize directly affiliated recovery processes, and
(vi) to overall reduce production costs to 0.55 $ kg-1
(Patel et al. 2006). In addition, broadening and
improving the substrate conversion to the desired product displays one of the most attractive and
crucial fields of work. There is a continuing quest for new, renewable and sustainable feedstocks,
regarding procurement costs, applicability and efficiency. Non-food substrates, such as hemicellulose
or glycerol are widely abundant in industry, mainly as waste products, and were recently studied in
combination with succinate producing microorganisms for performance validation (Lee et al. 2003;
Kim et al. 2004; Blankschien et al. 2010; Borges and Pereira Jr 2011; Liu et al. 2012). Taking this into
account, future metabolic engineering approaches may also comprise further questions that emerged
from systems biology studies in this work, i.e. validation of increased flux towards the pentose
phosphate pathway as well as through the pyruvate dehydrogenase complex, functional verification of
succinate secretion pathways or energy/redox balancing. Additional approaches may comprise an
increase in succinate production efficiency by applying strategies, recently reported for lysine and
diaminopentane production with C. glutamicum (Becker et al. 2011; Kind and Wittmann 2011). A
carefully reflected combination of functional targets discovered in this work could be a promising task

Conclusion and Outlook
99
for future work. Therefore, establishing a straight-forward genetic tool box, facilitating fast, simple
and valid genetic engineering, would substantially improve rational engineering approaches with
B. succiniciproducens.
The excellent production properties of B. succiniciproducens, the recent establishment of systems
biological methods for in depth metabolic analysis and the successful demonstration of directed
evolutionary adaptation, coupled with targeted strain improvements, make this organism an
outstanding candidate for a future succinate bioprocess. Regarding the large variety of succinate
application in the downstream market, rational engineering of B. succiniciproducens towards other
promising non-natural reaction products that are chemically described, such as 1,4-butanediol or
succinate esters (Cukalovic and Stevens 2008), seems rather promising. It might also be relevant to
consider succinate precursors as valuable products, such as malate, fumarate, and pyruvate and in this
line, directly derived amino acids. Taken together, B. succiniciproducens could thrive as a high-value
cell factory. The understanding of its metabolic behavior, enabled by systems biology, combined with
rational strategies of metabolic engineering will extend the production spectrum. This integrated
approach may lead to a further mainstay in the new bioeconomy.

Abbreviations and Symbols
100
7 Abbreviations and Symbols
Abbreviations
aceEF genes, encoding pyruvate dehydrogenase in B. succiniciproducens
ATP adenosine triphosphate
AUC area under curve
BHI brain heart infusion
bp base pair(s)
BSA bovine serum albumin
C4 metabolite containing four carbon atoms
Cm chloramphenicol
CmR chloramphenicol resistence
COG clusters of orthologous groups
Cys cysteine
DD1 B. succiniciproducens wild-type
DD3 B. succiniciproducens Δldh ΔpflD
DD3-pH1 low pH evolved phenotype, isolated after 22 iterations
DD3-Suc1 high succinate evolved phenotype, isolated after 3 iterations
DD3-Suc2 high succinate evolved phenotype, isolated after 15 iterations
DD3-Suc3 high succinate evolved phenotype, isolated after 50 iterations
DD3-T1 high temperature evolved phenotype, isolated after 10 iterations
DD3-T2 high temperature evolved phenotype, isolated after 60 iterations
DD5 B. succiniciproducens Δldh ΔpflA
DIP deletion – insertion – polymorphism
DNA deoxyribonucleic acid
F6P fructose 6-phosphate
FC fold change
FDR false discovery rate
fumC gene, encoding fumarase in B. succiniciproducens
G6P glucose 6-phosphate
GAP glyceraldehyde 3-phosphate
GC gas chromatography
GC-MS gas chromatography-mass spectrometry
Glc glucose
Gly glycine
GSEA gene set enrichment analysis
HPLC high-performance liquid chromatography
Ile isoleucine
int integrative
KEGG Kyoto Encyclopedia of Genes and Genomes
Kb kilo base pairs
LB Luria Bertani
ldhA gene, encoding lactate dehydrogenase in B. succiniciproducens
Lys lysine
lysA gene, encoding diaminopimelate decarboxylase in B. succiniciproducens
MBDSTFA N-methyl-N-tert-butyldimethylsilyl-trifluoroacetamide

Abbreviations and Symbols
101
MCS multiple cloning site
MFA metabolic flux analysis
MOPS 3-(N-morpholino)propanesulfonic acid
NAD(P) nicotinamide adenine dinucleotide (phosphate), oxidized
NAD(P)H nicotinamide adenine dinucleotide (phosphate), reduced
NES normalized enrichment score
NOM p-val normalized p-value
OAA oxaloacetate
OD600 optical density (λ = 600 nm)
OPA ortho-phthaldialdehyde
ORI origin of replication
PaceE promoter of pyruvate dehydrogenase subunit E1 in B. succiniciproducens
PptsG promoter of trehalose (maltose)-specific transporter subunit IIBC of PTS in
B. succiniciproducens
PA polyamine
PBS polybutylene succinate
PCR polymerase chain reaction
PDB ID protein database identifier
PDH pyruvate dehydrogenase
PES polyethylene succinate
PEP phosphoenolpyruvate
PEP/Pyr lumped pool of phosphoenolpyruvate and pyruvate
PEPCK PEP-carboxykinase
pflA gene, encoding formate C-acetyltransferase activator in B. succiniciproducens
pflD gene, encoding formate C-acetyltransferase in B. succiniciproducens
PPP pentose phosphate pathway
Pro proline
pta gene, encoding phosphate aetyltransferase in B. succiniciproducens
pykA gene, encoding pyruvate kinase in B. succiniciproducens
Pyr pyruvate
RIN RNA integrity number
RNA ribonucleic acid
rfe gene, encoding UDP-GlcNAc:undecaprenyl-phosphate GlcNAc-1-phosphate
transferase in B. succiniciproducens
rpm rounds per minute
rpoC gene, encoding beta'-subunit of the DNA-directed RNA polymerase in
B. succiniciproducens
sacB gene, encoding levansucrase in B. subtilis
SAP shrimp alkaline phosphatase
SIM selective ion monitoring
SNP single nucleotide polymorphism
SOB super optimal broth
SOC super optimal broth with catabolite repression
TAE buffer consisting of Tris, EDTA and acetic acid
TCA tricarboxylic acid
Thr threonine
TRIS tris(hydroxymethyl)aminomethane)
Tyr tyrosine
Val valine

Abbreviations and Symbols
102
wcaJ gene, encoding predicted colanic acid biosynthsis UDP-glucose lipid carrier
transferase in B. succiniciproducens
wt wild type
Symbols
µ specific growth rate [h-1
]
qGlc specific glucose uptake rate [mmol g-1
h-1
]
t time [h] or [d]
T temperature [°C]
U unit [μmol min-1
]
PSuc maximal succinate productivity [g L-1
h-1
] YAce/S specific acetate yield [mol mol
-1]
YEtOH/S specific ethanol yield [mol mol-1
]
YFor/S specific formate yield [mol mol-1
]
YLac/S specific lactate yield [mol mol-1
]
YPyr/S specific pyruvate yield [mol mol-1
]
YSuc/S specific succinate yield [mol mol-1
]
YX/S specific biomass yield [g mol-1
]

References
103
8 References
Agricola, G. 1955. "De Natura Fossilium" ( Textbook of Mineralogy ). Translated. The Geological
Society of America.
Ajinomoto. 2007. “Environmental Research and Technology Development”. Ajinomoto.
Alper, H., and G. Stephanopoulos. 2007. “Global Transcription Machinery Engineering: a New
Approach for Improving Cellular Phenotype.” Metabolic Engineering 9 (3): 258–67.
Amber Artisans. 2013. “Baltic Amber – Alternative Medicine.”
Amer, A.O., and M.A. Valvano. 2000. “The N-Terminal Region of the Escherichia Coli WecA (Rfe)
Protein, Containing Three Predicted Transmembrane Helices, Is Required for Function but Not
for Membrane Insertion.” Journal of Bacteriology 182 (2): 498–503.
Andersson, C., J. Helmerius, D. Hodge, K.A. Berglund, and U. Rova. 2009. “Inhibition of Succinic
Acid Production in Metabolically Engineered Escherichia coli by Neutralizing Agent, Organic
Acids, and Osmolarity.” Biotechnology Progress 25 (1): 116–23.
Andersson, C., D. Hodge, K.A. Berglund, and U. Rova. 2007. “Effect of Different Carbon Sources on
the Production of Succinic Acid Using Metabolically Engineered Escherichia coli.”
Biotechnology Progress 23 (2): 381–88.
Arakawa, T., and S.N. Timasheff. 1985. “The Stabilization of Proteins by Osmolytes.” Biophysical
Journal 47 (3): 411–14.
Barrick, J.E., D.S. Yu, S.H. Yoon, H. Jeong, T.K. Oh, D. Schneider, R.E. Lenski, and J.F. Kim. 2009.
“Genome Evolution and Adaptation in a Long-Term Experiment with Escherichia coli.” Nature
461 (7268): 1243–47.
BASF SE, and CSM. 2012. “BASF and CSM Establish 50-50 Joint Venture for Biobased Succinic
Acid.” BASF SE.
Bastidon, A.I. 2012. “Biosuccinic Acid.”
Beauprez, J.J., M. De Mey, and W.K. Soetaert. 2010. “Microbial Succinic Acid Production: Natural
Versus Metabolic Engineered Producers.” Process Biochemistry 45 (7): 1103–14.
Bechthold, I., K. Bretz, S. Kabasci, R. Kopitzky, and A. Springer. 2008. “Succinic Acid: A New
Platform Chemical for Biobased Polymers from Renewable Resources.” Chemical Engineering
& Technology 31 (5): 647–54.
Becker, J., S. Kind, and C. Wittmann. 2012. “Systems Metabolic Engineering of Corynebacterium
glutamicum for Biobased Production of Chemicals, Materials and Fuels.” In Systems Metabolic
Engineering, edited by Christoph Wittmann and Sang Yup Lee, 152–92. Springer.
Becker, J., C. Klopprogge, A. Herold, O. Zelder, C.J. Bolten, and C. Wittmann. 2007. “Metabolic Flux
Engineering of L-Lysine Production in Corynebacterium glutamicum - Overexpression and
Modification of G6P Dehydrogenase.” Journal of Biotechnology 132 (2): 99–109.
Becker, J., C. Klopprogge, and C. Wittmann. 2008. “Metabolic Responses to Pyruvate Kinase
Deletion in Lysine Producing Corynebacterium glutamicum.” Microbial Cell Factories 7 (8): 1–
15.
Becker, J., J. Reinefeld, R. Stellmacher, R. Schäfer, A. Lange, H. Meyer, M. Lalk, et al. 2013.
“Systems-Wide Analysis and Engineering of Metabolic Pathway Fluxes in Bio-Succinate
Producing Basfia succiniciproducens.” Biotechnology and Bioengineering 110 (11): 3013–23.
Becker, J., O. Zelder, S. Häfner, H. Schröder, and C. Wittmann. 2011. “From Zero to Hero--Design-
Based Systems Metabolic Engineering of Corynebacterium glutamicum for L-Lysine
Production.” Metabolic Engineering 13 (2): 159–68.
BioAmber. 2011. “BioAmber Partners with Mitsubishi Chemical in Succinic Acid.” BioAmber.
Blaby, I.K., B.J. Lyons, E. Wroclawska-Hughes, G.C.F. Phillips, T.P. Pyle, S.G. Chamberlin, S.A.
Benner, T.J. Lyons, V. de Crécy-Lagard, and E. de Crécy. 2012. “Experimental Evolution of a
Facultative Thermophile from a Mesophilic Ancestor.” Applied and Environmental Microbiology
78 (1): 144–55.
Blankschien, M.D., J.M. Clomburg, and R. Gonzalez. 2010. “Metabolic Engineering of Escherichia
coli for the Production of Succinate from Glycerol.” Metabolic Engineering 12 (5): 409–19.
References
104
Bochner, B.R. 2009. “Global Phenotypic Characterization of Bacteria.” FEMS Microbiology Reviews
33 (1): 191–205.
Bolten, C.J., P. Kiefer, F. Letisse, J.-C. Portais, and C. Wittmann. 2007. “Sampling for Metabolome
Analysis of Microorganisms.” Analytical Chemistry 79 (10): 3843–49.
Booth, I.R. 1985. “Regulation of Cytoplasmic pH in Bacteria.” Microbiological Reviews 49 (4): 359–
78.
Booth, I.R. 1999. “The Regulation of Intracellular pH in Bacteria.” In Novartis Foundation
Symposium 221 - Bacterial Responses to pH, edited by Derek J. Chadwick and Gail Cardew, 19–
37. Wiley Online Library.
Borges, E.R., and N. Pereira Jr. 2011. “Succinic Acid Production from Sugarcane Bagasse
Hemicellulose Hydrolysate by Actinobacillus succinogenes.” Journal of Industrial Microbiology
& Biotechnology 38 (8): 1001–11.
Bourot, S., O. Sire, A. Trautwetter, T. Touzé, L.F. Wu, C. Blanco, and T. Bernard. 2000. “Glycine
Betaine-Assisted Protein Folding in a lysA Mutant of Escherichia coli.” The Journal of
Biological Chemistry 275 (2): 1050–56.
Brill, J., T. Hoffmann, M. Bleisteiner, and E. Bremer. 2011. “Osmotically Controlled Synthesis of the
Compatible Solute Proline Is Critical for Cellular Defense of Bacillus subtilis Against High
Osmolarity.” Journal of Bacteriology 193 (19): 5335–46.
Buckel, W., and B.T. Golding. 2006. “Radical Enzymes in Anaerobes.” Annual Review of
Microbiology 60: 27–49.
Bunch, P.K., F. Mat-Jan, N. Lee, and D.P. Clark. 1997. “The ldhA Gene Encoding the Fermentatove
Lactate Dehydrogenase of Escherichia coli.” Microbiology 143: 187–95.
Buschke, N., R. Schäfer, J. Becker, and C. Wittmann. 2013. “Metabolic Engineering of Industrial
Platform Microorganisms for Biorefinery Applications - Optimization of Substrate Spectrum and
Process Robustness by Rational and Evolutive Strategies.” Bioresource Technology 135: 544–54.
Caldas, T., N. Demont-Caulet, A. Ghazi, and G. Richarme. 1999. “Thermoprotection by Glycine
Betaine and Choline.” Microbiology 145: 2543–48.
Chan, S., S. Kanchanatawee, and K. Jantama. 2011. “Production of Succinic Acid from Sucrose and
Sugarcane Molasses by Metabolically Engineered Escherichia coli.” Bioresource Technology
103 (1): 329-36.
Cheng, K.-K., X.-B. Zhao, J. Zeng, R.-C. Wu, Y.-Z. Xu, D.-H. Liu, and J.-A. Zhang. 2012.
“Downstream Processing of Biotechnological Produced Succinic Acid.” Applied Microbiology
and Biotechnology 95 (4): 841–50.
Cherubini, F. 2010. “The Biorefinery Concept: Using Biomass Instead of Oil for Producing Energy
and Chemicals.” Energy Conversion and Management 51 (7): 1412–21.
Clarke, A. 2003. “Costs and Consequences of Evolutionary Temperature Adaptation.” Trends in
Ecology & Evolution 18 (11): 573–81.
Cox, S.J., S. Shalel Levanon, A. Sanchez, H. Lin, B. Peercy, G.N. Bennett, and K.-Y. San. 2006.
“Development of a Metabolic Network Design and Optimization Framework Incorporating
Implementation Constraints: a Succinate Production Case Study.” Metabolic Engineering 8 (1):
46–57.
Cukalovic, A., and C. V Stevens. 2008. “Feasibility of Production Methods for Succinic Acid
Derivatives: a Marriage of Renewable Resources and Chemical Technology.” Biofuels,
Bioproducts & Boprefining 2: 505–29.
Dam, P., V. Olman, K. Harris, Z. Su, and Y. Xu. 2007. “Operon Prediction Using Both Genome-
Specific and General Genomic Information.” Nucleic Acids Research 35 (1): 288–98.
Emmerling, M., M. Dauner, A. Ponti, J. Fiaux, M. Hochuli, T. Szyperski, K. Wüthrich, E.J. Bailey,
and U. Sauer. 2002. “Metabolic Flux Responses to Pyruvate Kinase Knockout in
Escherichia coli.” Journal of Bacteriology 184 (1): 152–64.
Fang, X., J. Li, X. Zheng, Y. Xi, K. Chen, P. Wei, P.-K. Ouyang, and M. Jiang. 2011. “Influence of
Osmotic Stress on Fermentative Production of Succinic Acid by Actinobacillus succinogenes.”
Applied Biochemistry and Biotechnology 165 (1): 138–47.
Feng, X., L. Page, J. Rubens, L. Chircus, P. Colletti, H.B. Pakrasi, and Y.J. Tang. 2010. “Bridging the
Gap Between Fluxomics and Industrial Biotechnology.” Journal of Biomedicine &
Biotechnology: 1-13.

References
105
Fong, S.S., A.R. Joyce, and B.Ø. Palsson. 2005. “Parallel Adaptive Evolution Cultures of Escherichia
coli Lead to Convergent Growth Phenotypes with Different Gene Expression States.” Genome
Research 15 (858): 1365–72.
Frederick R. Blattner, G. Plunkett III, C.A. Bloch, N.T. Perna, V. Burland, M. Riley, J. Collade-Vides,
et al. 1997. “The Complete Genome Sequence of Escherichia coli K-12.” Science 277 (5331):
1453–62.
Frey, J. 1992. “Construction of a Broad Host Range Shuttle Vector for Gene Cloning and Expression
in Actinobacillus pleuropneumoniae and Other Pasteurellaceae.” Research in Microbiology 143:
263–69.
Frings, E., H.J. Kunte, and E.A. Galinski. 1993. “Compatible Solutes in Representatives of the Genera
Brevibacterium and Corynebacterium : Occurrence of Tetrahydropyrimidines and Glutamine.”
FEMS Microbiology Letters 109: 25–32.
Fujimaki, T. 1998. “Processability and Properties of Aliphatic Polyesters , ‘ BIONOLLE ’,
Synthesized by Polycondensation Reaction.” Biodegradable Polymers and Macromolecules 59
(1-3): 209–14.
Glassner, D.A., and R. Datta. 1992. “Process for the Production and Purfication of Succinic Acid.”
US 5143834.
Gokulan, K., B. Rupp, M.S. Pavelka, W.R. Jacobs, and J.C. Sacchettini. 2003. “Crystal Structure of
Mycobacterium tuberculosis Diaminopimelate Decarboxylase, an Essential Enzyme in Bacterial
Lysine Biosynthesis.” The Journal of Biological Chemistry 278 (20): 18588–96.
Goude, R., S. Renaud, S. Bonnassie, T. Bernard, and C. Blanco. 2004. “Glutamine , Glutamate , and
α-Glucosylglycerate Are the Major Osmotic Solutes Accumulated by Erwinia chrysanthemi
Strain 3937.” Applied and Environmental Microbiology 70 (11): 6535–41.
Guettler, M. V. 1998. “Process for Making Succinic Acid, Microorganisms for Use in the Process and
Methods of Obtaining the Microorganism.” US 5504004.
Guettler, M. V, D. Rumler, and M.K. Jain. 1999. “Actinobacillus succinogens Sp. Nov., a Novel
Succinc-Acid-Producing Strain from the Bovine Rumen.” International Journal of Systematic
Bacteriology 49: 207–16.
Gunsalus, R.P., and S.-J. Park. 1994. “Aerobic-Anaerobic Gene Regulation in Escherichia coli:
Control by the ArcAB and Fnr Regulons.” Research in Microbiology1 145 (5-6): 437–50.
Hayes, D.J., S. Fitzpatrick, M.H.B. Hayes, and J.R.H. Ross. 2006. “The Biofine Process – Production
of Levulinic Acid, Furfural, and Formic Acid from Lignocellulosic Feedstocks.” In Biorefineries
– Industrial Processes and Products, edited by Birgit Kamm, Patrick R. Gruber, and Michael
Kamm, 1:139–64. Wiley-VCH.
Herendeen, S.L., R.A. VanBogelen, and F.C. Neidhardt. 1979. “Levels of Major Proteins of
Escherichia coli During Growth at Different Temperatures.” Journal of Bacteriology 139 (1):
185–94.
Hong, K.-K., and J. Nielsen. 2012. “Metabolic Engineering of Saccharomyces cerevisiae: a Key Cell
Factory Platform for Future Biorefineries.” Cellular and Molecular Life Sciences 69 (16): 2671–
90.
Hong, S.H., J.S. Kim, S.Y. Lee, Y.H. In, S.S. Choi, J.-K. Rih, C.H. Kim, H. Jeong, C.G. Hur, and J.J.
Kim. 2004. “The Genome Sequence of the Capnophilic Rumen Bacterium Mannheimia
succiniciproducens.” Nature Biotechnology 22 (10): 1275–81.
Hong, S.H., and S.Y. Lee. 2001. “Metabolic Flux Analysis for Succinic Acid Production by
Recombinant Escherichia coli with Amplified Malic Enzyme Activity.” Biotechnology and
Bioengineering 74 (2): 89–95.
Hong, S.H., and S.Y. Lee. 2004. “Enhanced Production of Succinic Acid by Metabolically Engineered
Escherichia coli with Amplified Activities of Malic Enzyme and Fumarase.” Biotechnology and
Bioprocess Engineering 9: 252–55.
Hoon, Y., I.J. Oh, C. Jung, S.Y. Lee, and J. Lee. 2010. “The Effect of Protectants and pH Changes on
the Cellular Growth and Succinic Acid Yield of Mannheimia succiniciproducens LPK7.”
Journal of Microbiology and Biotechnology 20 (12): 1677–80.
Huhn, S., E. Jolkver, R. Krämer, and K. Marin. 2011. “Identification of the Membrane Protein SucE
and Its Role in Succinate Transport in Corynebacterium glutamicum.” Applied Microbiology and
Biotechnology 89 (2): 327–35.

References
106
Inui, M., M. Suda, S. Okino, H. Nonaka, L.G. Puskás, A.A. Vertès, and H. Yukawa. 2007.
“Transcriptional Profiling of Corynebacterium glutamicum Metabolism During Organic Acid
Production Under Oxygen Deprivation Conditions.” Microbiology 153 (8): 2491–2504.
Iwatani, S., Y. Yamada, and Y. Usuda. 2008. “Metabolic Flux Analysis in Biotechnology Processes.”
Biotechnology Letters 30: 791–99.
Jansen, M., R. Verwaal, L. Segueilha, M. Van De Graaf, and T. Geurts. 2012. “Low pH Fermentation
to Succinic Acid , the Basis for Efficient Recovery.” In Biorefinery Conference Copenhagen.
Jantama, K., M.J. Haupt, S. a Svoronos, X. Zhang, J.C. Moore, K.T. Shanmugam, and L.O. Ingram.
2008. “Combining Metabolic Engineering and Metabolic Evolution to Develop Nonrecombinant
Strains of Escherichia coli C That Produce Succinate and Malate.” Biotechnology and
Bioengineering 99 (5): 1140–53.
Jeong, J.-Y., Y.-J. Kim, N. Cho, D. Shin, T.-W. Nam, S. Ryu, and Y.-J. Seok. 2004. “Expression of
ptsG Encoding the Major Glucose Transporter Is Regulated by ArcA in Escherichia coli.” The
Journal of Biological Chemistry 279 (37): 38513–18.
Jiang, M., K. Chen, Z. Liu, P. Wei, H. Ying, and H. Chang. 2010. “Succinic Acid Production by
Actinobacillus succinogenes Using Spent Brewer’s Yeast Hydrolysate as a Nitrogen Source.”
Applied Biochemistry and Biotechnology 160: 244–54.
John, R.P., G.S. Anisha, A. Pandey, and K. Madhavan Nampoothri. 2010. “Genome Shuffling: A New
Trend in Improved Bacterial Production of Lactic Acid.” Industrial Biotechnology (June): 164–
69.
Kalinowski, J., B. Bathe, D. Bartels, N. Bischoff, M. Bott, A. Burkovski, N. Dusch, et al. 2003. “The
Complete Corynebacterium glutamicum ATCC 13032 Genome Sequence and Its Impact on the
Production of l-Aspartate-Derived Amino Acids and Vitamins.” Journal of Biotechnology 104
(1-3): 5–25.
Kamashev, D., and J. Rouviere-Yaniv. 2000. “The Histone-Like Protein HU Binds Specifically to
DNA Recombination and Repair Intermediates.” The EMBO Journal 19 (23): 6527–35.
Kim, D.Y., S.C. Yim, P.C. Lee, W.G. Lee, S.Y. Lee, and H.N. Chang. 2004. “Batch and Continuous
Fermentation of Succinic Acid from Wood Hydrolysate by Mannheimia succiniciproducens
MBEL55E.” Enzyme and Microbial Technology 35 (6-7): 648–53.
Kim, P., M. Laivenieks, C. Vieille, and J.G. Zeikus. 2004. “Effect of Overexpression of Actinobacillus
succinogenes Phosphoenolpyruvate Carboxykinase on Succinate Production in Escherichia coli.”
Applied and Environmental Microbiology 70 (2): 1238–41.
Kim, T.Y., H.U. Kim, J.M. Park, H. Song, and J.S. Kim. 2007. “Genome-Scale Analysis of
Mannheimia succiniciproducens Metabolism.” Biotechnology and Bioengineering 97 (4): 657–
71.
Kim, T.Y., H.U. Kim, H. Song, and S.Y. Lee. 2009. “In Silico Analysis of the Effects of H2 and CO2
on the Metabolism of a Capnophilic Bacterium Mannheimia succiniciproducens.” Journal of
Biotechnology 144 (3): 184–89.
Kind, S., and C. Wittmann. 2011. “Bio-Based Production of the Platform Chemical 1,5-
Diaminopentane.” Applied Microbiology and Biotechnology 91 (5): 1287–96.
Koga, Y. 2012. “Thermal Adaptation of the Archaeal and Bacterial Lipid Membranes.” Archaea:1-6.
Kohlstedt, M., J. Becker, and C. Wittmann. 2010. “Metabolic Fluxes and Beyond - Systems Biology
Understanding and Engineering of Microbial Metabolism.” Applied Microbiology and
Biotechnology 88: 1065–75.
Krokan, H.E., R. Standal, and G. Slupphaug. 1997. “DNA Glycosylases in the Base Excision Repair
of DNA.” Biochemical Journal 325: 1–16.
Krömer, J.O., M. Fritz, E. Heinzle, and C. Wittmann. 2005. “In Vivo Quantification of Intracellular
Amino Acids and Intermediates of the Methionine Pathway in Corynebacterium glutamicum.”
Analytical Biochemistry 340 (1): 171–73.
Kuhnert, P., E. Scholten, S. Haefner, D. Mayor, and J. Frey. 2010. “Basfia succiniciproducens Gen.
Nov., Sp. Nov., a New Member of the Family Pasteurellaceae Isolated from Bovine Rumen.”
International Journal of Systematic and Evolutionary Microbiology 60: 44–50.
Kurzrock, T., and D. Weuster-Botz. 2010. “Recovery of Succinic Acid from Fermentation Broth.”
Biotechnology Letters 32 (3): 331–39.

References
107
Kwon, Y.-D., S. Kim, S.Y. Lee, and P. Kim. 2011. “Long-Term Continuous Adaptation of
Escherichia coli to High Succinate Stress and Transcriptome Analysis of the Tolerant Strain.”
Journal of Bioscience and Bioengineering 111 (1): 26–30.
Lane, W.J., and S. A. Darst. 2010. “Molecular Evolution of Multisubunit RNA Polymerases:
Structural Analysis.” Journal of Molecular Biology 395 (4): 686–704.
Lee, J.W., S.Y. Lee, H. Song, and J.-S. Yoo. 2006. “The Proteome of Mannheimia
succiniciproducens, a Capnophilic Rumen Bacterium.” Proteomics 6 (12): 3550–66.
Lee, P.C., S.Y. Lee, S.H. Hong, and H.N. Chang. 2002. “Isolation and Characterization of a New
Succinic Acid-Producing Bacterium, Mannheimia succiniciproducens MBEL55E from Bovine
Rumen.” Applied Microbiology and Biotechnology 58: 663–68.
Lee, P.C., S.Y. Lee, S.H. Hong, and H.N. Chang. 2003. “Batch and Continuous Cultures of
Mannheimia succiniciproducens MBEL55E for the Production of Succinic Acid from Whey and
Corn Steep Liquor.” Bioprocess and Biosystems Engineering 26: 63–67.
Lee, S.J., H. Song, and S.Y. Lee. 2006. “Genome-Based Metabolic Engineering of Mannheimia
succiniciproducens for Succinic Acid Production.” Applied and Environmental Microbiology 72
(3): 1939–48.
Lee, S.Y. 2009. “Gene Encoding Fumaric Hydratase C and Use Thereof.” US 7588934.
Lee, S.Y., S.H. Park, S.H. Hong, Y. Lee, and S.H. Lee. 2005. “Fermentative Production of Building
Blocks for Chemical Synthesis of Polyesters.” In Bioplymers - Polyesters, edited by Alexander
Steinbüchel, 265–74. Wiley-VCH.
Lehrer, J., K. A. Vigeant, L.D. Tatar, and M. A. Valvano. 2007. “Functional Characterization and
Membrane Topology of Escherichia coli WecA, a Sugar-Phosphate Transferase Initiating the
Biosynthesis of Enterobacterial Common Antigen and O-Antigen Lipopolysaccharide.” Journal
of Bacteriology 189 (7): 2618–28.
Levdikov, V., L. Blagova, N. Bose, and C. Momany. 2003. “Crystal Structure of Diaminopimelate
Decarboxylase.” PDB ID 1KNW.
Li, Q., D. Wang, Y. Wu, M. Yang, W. Li, J. Xing, and Z. Su. 2010. “Kinetic Evaluation of Products
Inhibition to Succinic Acid Producers Escherichia coli NZN111, AFP111, BL21, and
Actinobacillus succinogenes 130Z T.” Journal of Microbiology 48 (3): 290–96.
Lim, B., and C.A. Gross. 2011. “Cellular Response to Heat Shock and Cold Shock.” In Bacterial
Stress Responses, edited by Gisela Storz and Regina Hengge, 2nd ed., 93–114. ASM Press.
Lin, H., G.N. Bennett, and K.-Y. San. 2005. “Metabolic Engineering of Aerobic Succinate Production
Systems in Escherichia coli to Improve Process Productivity and Achieve the Maximum
Theoretical Succinate Yield.” Metabolic Engineering 7 (2): 116–27.
Lin, S.K.C., C. Du, A. Koutinas, R. Wang, and C. Webb. 2008. “Substrate and Product Inhibition
Kinetics in Succinic Acid Production by Actinobacillus succinogenes.” Biochemical Engineering
Journal 41: 128–35.
Lippert, K., and E. Galinski. 1992. “Enzyme Stabilization by Ectoine-Type Compatible Solutes:
Protection Against Heating, Freezing and Drying.” Applied Microbiology and Biotechnology 37
(1): 61–65.
Litsanov, B., A. Kabus, M. Brocker, and M. Bott. 2012. “Efficient Aerobic Succinate Production from
Glucose in Minimal Medium with Corynebacterium glutamicum.” Microbial Biotechnology 5
(1): 116–28.
Liu, R., L. Liang, K. Chen, J. Ma, M. Jiang, P. Wei, and P. Ouyang. 2012. “Fermentation of Xylose to
Succinate by Enhancement of ATP Supply in Metabolically Engineered Escherichia coli.”
Applied Microbiology and Biotechnology.
Liu, Y.-P., P. Zheng, Z.-H. Sun, Y. Ni, J.-J. Dong, and L.-L. Zhu. 2008. “Economical Succinic Acid
Production from Cane Molasses by Actinobacillus succinogenes.” Bioresource Technology 99
(6): 1736–42.
Loubiere, P., M. Cocaign-Bousquet, J. Matos, G. Goma, and N.D. Lindley. 1997. “Influence of End-
Products Inhibition and Nutrient Limitations on the Growth of Lactococcus lactis Subsp. Lactis.”
Journal of Applied Microbiology 82 (1): 95–100.
Mager, W.H., a H. de Boer, M.H. Siderius, and H.P. Voss. 2000. “Cellular Responses to Oxidative
and Osmotic Stress.” Cell Stress & Chaperones 5 (2): 73–75.
Mäkelä, P. 2004. “Agro-Industrial Uses of Glycinebetaine.” Sugar Tech 6 (4): 207–12.

References
108
Malpica, R., G.R.P. Sandoval, C. Rodríguez, B. Franco, and D. Georgellis. 2006. “Signaling by the
Arc Two-Component System Provides a Link Between the Redox State of the Quinone Pool and
Gene Expression.” Antioxidants & Redox Signaling 8 (5-6): 781–95.
Mao, F., P. Dam, J. Chou, V. Olman, and Y. Xu. 2009. “DOOR: a Database for Prokaryotic Operons.”
Nucleic Acids Research 37 (Database issue): D459–63.
MarketsandMarkets. 2012. “Succinic Acid Market by Applications & Geography - Global Trends &
Forecasts (2011-2016).”
Markman, L. 2009. “Teething: Facts and Fiction.” Pediatrics In Review / American Academy of
Pediatrics 30 (8): e59–64.
McKinlay, J.B., M. Laivenieks, B.D. Schindler, A. McKinlay, S. Siddaramappa, J.F. Challacombe,
S.R. Lowry, et al. 2010. “A Genomic Perspective on the Potential of Actinobacillus succinogenes
for Industrial Succinate Production.” BMC Genomics 11: 680–95.
McKinlay, J.B., Y. Shachar-Hill, J.G. Zeikus, and C. Vieille. 2007. “Determining Actinobacillus
succinogenes Metabolic Pathways and Fluxes by NMR and GC-MS Analyses of 13
C-Labeled
Metabolic Product Isotopomers.” Metabolic Engineering 9: 177–92.
McKinlay, J.B., and C. Vieille. 2008. “13
C-Metabolic Flux Analysis of Actinobacillus succinogenes
Fermentative Metabolism at Different NaHCO3 and H2 Concentrations.” Metabolic Engineering
10 (1): 55–68.
McKinlay, J.B., C. Vieille, and J.G. Zeikus. 2007. “Prospects for a Bio-Based Succinate Industry.”
Applied Microbiology and Biotechnology 76: 727–40.
McKinlay, J.B., J.G. Zeikus, and C. Vieille. 2005. “Insights into Actinobacillus succinogenes
Fermentative Metabolism in a Chemically Defined Growth Medium.” Applied and
Environmental Microbiology 71 (11): 6651–56.
Melzer, G., M.E. Esfandabadi, E. Franco-Lara, and C. Wittmann. 2009. “Flux Design: In Silico
Design of Cell Factories Based on Correlation of Pathway Fluxes to Desired Properties.” BMC
Systems Biology 3: 120.
Meza, E., J. Becker, F. Bolivar, G. Gosset, and C. Wittmann. 2012. “Consequences of
Phosphoenolpyruvate:sugar Phosphotranferase System and Pyruvate Kinase Isozymes
Inactivation in Central Carbon Metabolism Flux Distribution in Escherichia coli.” Microbial Cell
Factories 11 (127): 1–13.
Millard, C.S., Y.-P. Chao, J.C. Liao, and M.I. Donnelly. 1996. “Enhanced Production of Succinic Acid
by Overexpression of Phosphoenolpyruvate Carboxylase in Escherichia coli.” Applied and
Environmental Microbiology 62 (5): 1808–10.
Momany, C., V. Levdikov, L. Blagova, and K. Crews. 2002. “Crystallization of Diaminopimelate
Decarboxylase from Escherichia coli, a Stereospecific D -Amino-Acid Decarboxylase.” Acta
Crystallographica Section D Biological Crystallography 58: 549–52.
Mordukhova, E. A., H.-S. Lee, and J.-G. Pan. 2008. “Improved Thermostability and Acetic Acid
Tolerance of Escherichia coli via Directed Evolution of Homoserine o-Succinyltransferase.”
Applied and Environmental Microbiology 74 (24): 7660–68.
Müller, H. 2005. “Tetrahydrofuran.” In Ullmann’s Encyclopedia of Industrial Chemistry, 5:1–6.
Wiley-VCH.
Myriant. 2013a. “Myriant Produces Bio-Succinic Acid at Commercial Scale, ThyssenKrupp Uhde
Readies to Provide Process and Performance Guaranty”. Myriant.
Myriant. 2013b. “Showa Denko K.K. Selects Myriant as Its Supplier of High-Purity BioSuccinic Acid
for the Production of Renewable-Based Poly(butylene Succinate) (PBS)”. Myriant.
Nagorska, K., A. Ostrowski, K. Hinc, I.B. Holland, and M. Obuchowski. 2010. “Importance of Eps
Genes from Bacillus subtilis in Biofilm Formation and Swarming.” Journal of Applied Genetics
51 (3): 369–81.
Nedea, E.C., D. Markov, T. Naryshkina, and K. Severinov. 1999. “Localization of Escherichia coli
rpoC Mutations That Affect RNA Polymerase Assembly and Activity at High Temperature.”
Journal of Bacteriology 181 (8): 2663–65.
Neidhardt, F.C., J.L. Ingraham, and M. Schaechter, ed. 1990. “Physiology of the Bacterial Cell - A
Molecular Approach. ” Vol. 20. Sinauer Associates.
Oishi, A., M. Zhang, K. Nakayama, T. Masuda, and Y. Taguchi. 2006. “Synthesis of Poly(butylene
Succinate) and Poly(ethylene Succinate) Including Diglycollate Moiety.” Polymer Journal 38
(7): 710–15.

References
109
Okino, S., M. Inui, and H. Yukawa. 2005. “Production of Organic Acids by Corynebacterium
glutamicum Under Oxygen Deprivation.” Applied Microbiology and Biotechnology 68 (4): 475–
80.
Okino, S., R. Noburyu, M. Suda, T. Jojima, M. Inui, and H. Yukawa. 2008. “An Efficient Succinic
Acid Production Process in a Metabolically Engineered Corynebacterium glutamicum Strain.”
Applied Microbiology and Biotechnology 81 (3): 459–64.
Otero, J.M., D. Cimini, K.R. Patil, S.G. Poulsen, L. Olsson, and J. Nielsen. 2013. “Industrial Systems
Biology of Saccharomyces cerevisiae Enables Novel Succinic Acid Cell Factory.” PloS One 8
(1): e54144.
Paster, M., J.L. Pellegrino, and T.M. Carole. 2004. “Industrial Bioproducts : Today and Tomorrow.”
Energetics.
Patel, M., M. Crank, V. Dornburg, B. Hermann, L. Roes, B. Hüsing, L. Overbeek, F. Terragni, and E.
Recchia. 2006. “Medium and Long-Term Opportunities and Risks of the Biotechnological
Production of Bulk Chemicals from Renewable Resources - The Potential of White
Biotechnology.” funded by European Commission.
Patnaik, R. 2008. “Engineering Complex Phenotypes in Industrial Strains.” Biotechnology Progress
24 (1): 38–47.
Podkovyrov, S.M., and J.G. Zeikus. 1993. “Purification and Characterization of Phosphoenolpyruvate
Carboxykinase, a Catabolic CO2-Fixing Enzyme, from Anaerobiospirillum succiniciproducens.”
Journal of General Microbiology 139: 223–28.
Quek, L.-E., C. Wittmann, L.K. Nielsen, and J.O. Krömer. 2009. “OpenFLUX: Efficient Modelling
Software for 13
C-Based Metabolic Flux Analysis.” Microbial Cell Factories 8: 25.
Raab, A.M., G. Gebhardt, N. Bolotina, D. Weuster-Botz, and C. Lang. 2010. “Metabolic Engineering
of Saccharomyces cerevisiae for the Biotechnological Production of Succinic Acid.” Metabolic
Engineering 12 (6): 518–25.
Ron, E.Z., and B.D. Davis. 1971. “Growth Rate of Escherichia coli at Elevated Temperatures:
Limitation by Methionine.” Journal of Bacteriology 107 (2): 391–96.
Roquette. 2013. “DSM and Roquette to Start Bio-Based Succinic Acid Joint Venture”. Roquette.
Samuelov, N.S., R. Lamed, S. Lowe, and J.G. Zeikus. 1991. “Influence of CO2-HCO3 - Levels and pH
on Growth, Succinate Production, and Enzyme Activities of Anaerobiospirillum
succiniciproducens.” Applied and Environmental Microbiology 57 (10): 3013–19.
Sánchez, A.M., G.N. Bennett, and K.-Y. San. 2005. “Efficient Succinic Acid Production from Glucose
through Overexpression of Pyruvate Carboxylase in an Escherichia coli Alcohol Dehydrogenase
and Lactate Dehydrogenase Mutant.” Biotechnology Progress 21 (2): 358–65.
Sanders, J.W., K.J. Leenhouts, A.J. Haandrikman, G. Venema, J.A.N.W. Sanders, K.J. Leenhouts, A.J.
Haandrikman, G. Venema, and J.A.N. Kok. 1995. “Stress Response in Lactococcus lactis:
Cloning, Expression Analysis and Mutation of the Lactococcal Superoxide Dismutase Gene.”
Jounral of Bacteriology 177 (18): 5254–60.
Sauer, M., D. Porro, D. Mattanovich, and P. Branduardi. 2008. “Microbial Production of Organic
Acids: Expanding the Markets.” Trends in Biotechnology 26 (2): 100–108.
Sauer, U., and B.J. Eikmanns. 2005. “The PEP-Pyruvate-Oxaloacetate Node as the Switch Point for
Carbon Flux Distribution in Bacteria.” FEMS Microbiology Reviews 29 (4): 765–94.
Scholten, E., and D. Dägele. 2008. “Succinic Acid Production by a Newly Isolated Bacterium.”
Biotechnology Letters 30: 2143–46.
Scholten, E., D. Dägele, S. Haefner, and H. Schröder. 2011. “Carboxylic Acid Producing Member of
the Pasteurellaceae.” US 20110008851 A1.
Scholten, E., S. Haefner, and H. Schröder. 2010. “Bacterial Cells Having a Glyoxylte Shunt for the
Manufacture of Succinic Acid.” US20100159543 A1.
Scholten, E., T. Renz, and J. Thomas. 2009. “Continuous Cultivation Approach for Fermentative
Succinic Acid Production from Crude Glycerol by Basfia succiniciproducens DD1.”
Biotechnology Letters 31: 1947–51.
Shanmugam, K.T., and L.O. Ingram. 2008. “Engineering Biocatalysts for Production of Commodity
Chemicals.” Journal of Molecular Mcrobiology and Biotechnology 15: 8–15.
Siddiquee, K.A.Z., M.J. Arauzo-Bravo, and K. Shimizu. 2004. “Metabolic Flux Analysis of pykF
Gene Knockout Escherichia coli Based on 13
C-Labeling Experiments Together with

References
110
Measurements of Enzyme Activities and Intracellular Metabolite Concentrations.” Applied
Microbiology and Biotechnology 63: 407–17.
Six, S., S.C. Andrews, G. Unden, and J.R. Guest. 1994. “Escherichia coli Possesses Two Homologous
Anaerobic C4-Dicarboxylate Membrane Transporters (DcuA and DcuB) Distinct from the
Aerobic Dicarboxylate Transport System (Dct).” Journal of Bacteriology 176 (21): 6470–78.
Skorokhodova, A.Y., A.Y. Gulevich, A.A. Morzhakova, R.S. Shakulov, and V.G. Debabov. 2013.
“Comparison of Different Approaches to Activate the Glyoxylate Bypass in Escherichia coli K-
12 for Succinate Biosynthesis During Dual-Phase Fermentation in Minimal Glucose Media.”
Biotechnology Letters 35 (4): 577–83.
Song, H., S.H. Jang, J.M. Park, and S.Y. Lee. 2008. “Modeling of Batch Fermentation Kinetics for
Succinic Acid Production by Mannheimia succiniciproducens.” Biochemical Engineering
Journal 40 (1): 107–15.
Song, H., T.Y. Kim, B.-K. Choi, S.J. Choi, L.K. Nielsen, H.N. Chang, and S.Y. Lee. 2008.
“Development of Chemically Defined Medium for Mannheimia succiniciproducens Based on Its
Genome Sequence.” Applied Microbiology and Biotechnology 79 (2): 263–72.
Song, H., and S.Y. Lee. 2006. “Production of Succinic Acid by Bacterial Fermentation.” Enzyme and
Microbial Technology 39: 352–61.
Stellmacher, R., J. Hangebrauk, E. Scholten, G. von Abendroth, and C. Wittmann. 2010.
“Fermentative Herstellung von Bernsteinsäure Mit Basfia succiniciproducens DD1 in
Serumflaschen.” Chemie Ingenieur Technik 82 (8): 1223–29.
Stephanopoulos, G.N., A.A. Aristidou, and J. Nielsen. 1998. “Metabolic Engineering: Principles and
Methodologies”. Academic Press.
Stols, L., and M. Donelly. 1997. “Production of Succinic Acid through Overexpression of NAD(+)-
Dependent Malic Enzyme in an Escherichia coli Mutant.” Applied and Environmental
Microbiology 63 (7): 2695–2701.
Subramanian, A., P. Tamayo, V.K. Mootha, S. Mukherjee, and B.L. Ebert. 2005. “Gene Set
Enrichment Analysis: A Knowledge-Based Approach for Interpreting Genome-Wide Expression
Profiles.” Proceedings of the National Academy of Sciences of the United States of America 102
(43): 15545–50.
Suzuki, K., S. Ito, A. Shimizu-Ibuka, and H. Sakai. 2008. “Crystal Structure of Pyruvate Kinase from
Geobacillus stearothermophilus.” Journal of Biochemistry 144 (3): 305–12.
Taboada, B., R. Ciria, C.E. Martinez-Guerrero, and E. Merino. 2012. “ProOpDB: Prokaryotic Operon
DataBase.” Nucleic Acids Research 40 (Database issue): D627–31.
Tatusov, R.L., M.Y. Galperin, D. a Natale, and E. V Koonin. 2000. “The COG Database: a Tool for
Genome-Scale Analysis of Protein Functions and Evolution.” Nucleic Acids Research 28 (1):
33–36.
Transparency Market Research. 2013. “Succinic Acid Market - Global Industry Analysis, Size, Share,
Growth, Trends and Forecast, 2012 - 2018.”
Turnbull, A.L., and M.G. Surette. 2010. “Cysteine Biosynthesis, Oxidative Stress and Antibiotic
Resistance in Salmonella typhimurium.” Research in Microbiology 161 (8): 643–50.
Turner, P., G. Mamo, and E.N. Karlsson. 2007. “Potential and Utilization of Thermophiles and
Thermostable Enzymes in Biorefining.” Microbial Cell Factories 6:9.
Tweel, W. van den. 2010. “Sustainable Succinic Acid.” DSM.
Urbance, S.E., A.L. Pometto, A. a Dispirito, and Y. Denli. 2004. “Evaluation of Succinic Acid
Continuous and Repeat-Batch Biofilm Fermentation by Actinobacillus succinogenes Using
Plastic Composite Support Bioreactors.” Applied Microbiology and Biotechnology 65 (6): 664–
70.
Urbonavicius, J., Q. Qian, J.M.B. Durand, T.G. Hagervall, and G.R. Björk. 2001. “Improvement of
Reading Frame Maintenance Is a Common Function for Several tRNA Modifcations.” The
EMBO Journal 20 (17): 4863–73.
USDA. 2013. “Table 3b—World Raw Sugar Price, ICE Contract 11 Nearby Futures Price, Monthly
Quarterly, and by Calendar and Fiscal Year.” ICE Futures US.
USDA. 2009. “U.S. Biobased Products Market - Potential and Projections Through 2025.” Edited by
Meredith A. Williamson. Energy Policy. Nova Science Pub.

References
111
Vaas, L.A.I., J. Sikorski, V. Michael, M. Göker, and H.-P. Klenk. 2012. “Visualization and Curve-
Parameter Estimation Strategies for Efficient Exploration of Phenotype Microarray Kinetics.”
PLoS ONE 7 (4): 1–18.
Van der Werf, M.J., M. V Guettler, M.K. Jain, and J.G. Zeikus. 1997. “Environmental and
Physiological Factors Affecting the Succinate Product Ratio During Carbohydrate Fermentation
by Actinobacillus Sp. 130Z.” Archives of Microbiology 167: 332–42.
Van Hoek, P., A. Aristidou, J.J. Hahn, and A. Patist. 2003. “Fermentation Goes Large Scale.” CEP
Magazine (January): 37–42.
Van Kranenburg, R., J.D. Marugg, I.I. van Swam, N.J. Willem, and W.M. de Vos. 1997. “Molecular
Characterization of the Plasmid-Encoded Eps Gene Cluster Essential for Exopolysaccharide
Biosynthesis in Lactococcus lactis.” Molecular Microbiology 24 (2): 387–97.
Vemuri, G.N., M.A. Eiteman, and E. Altman. 2002. “Effects of Growth Mode and Pyruvate
Carboxylase on Succinic Acid Production by Metabolically Engineered Strains of Escherichia
coli.” Applied and Environmental Microbiology 68 (4): 1715–27.
Wang, X., C.S. Gong, and G.T. Tsao. 1998. “Bioconversion of Fumaric Acid to Succinic Acid by
Recombinant E. coli.” Applied Biochemistry and Biotechnology 70-72 (5): 919–28.
Wang, Y., K.-Y. San, and G.N. Bennett. 2013. “Cofactor Engineering for Advancing Chemical
Biotechnology.” Current Opinion in Biotechnology: 6–11.
Warnecke, T., and R.T. Gill. 2005. “Organic Acid Toxicity, Tolerance, and Production in Escherichia
coli Biorefining Applications.” Microbial Cell Factories 4: 25.
Werpy, T., and G. Peterson. 2004. “Top Value Added Chemicals from Biomass Volume I: Results of
Screening for Potential Candidates from Sugars and Synthesis Gas.” DOE.
Weston, L. A., and R.J. Kadner. 1988. “Role of Uhp Genes in Expression of the Escherichia coli
Sugar-Phosphate Transport System.” Journal of Bacteriology 170 (8): 3375–83.
Wisbiorefine. “Fermentation of 6-Carbon Sugars and Starches.”
Wittmann, C. 2007. “Fluxome Analysis Using GC-MS.” Microbial Cell Factories 6 (6): 1–17.
Wittmann, C., M. Hans, and E. Heinzle. 2002. “In Vivo Analysis of Intracellular Amino Acid
Labelings by GC/MS.” Analytical Biochemistry 307: 379–82.
Wittmann, C., and E. Heinzle. 2001a. “Modeling and Experimental Design for Metabolic Flux
Analysis of Lysine-Producing Corynebacteria by Mass Spectrometry.” Metabolic Engineering 3
(2): 173–91.
Wittmann, C., and E. Heinzle. 2001b. “Application of MALDI-TOF MS to Lysine-Producing
Corynebacterium glutamicum: A Novel Approach for Metabolic Flux Analysis.” European
Journal of Biochemistry 268 (8): 2441–55.
Wittmann, C., and E. Heinzle. 2002. “Genealogy Profiling through Strain Improvement by Using
Metabolic Network Analysis: Metabolic Flux Genealogy of Several Generations of Lysine-
Producing Corynebacteria.” Applied and Environmental Microbiology 68 (12): 5843–59.
Yang, Y., and A. Paquet. 2005. “Preprocessing Two-Color Spotted Arrays.” In Bioinformatics and
Computational Biology Solutions Using R and Bioconductor, edited by R Gentleman, V Carey,
W Huber, R Irizarry, and S Dudoit, 49–69. Springer.
Yuk, H.-G., and D.L. Marshall. 2003. “Heat Adaptation Alters Escherichia coli O157:H7 Membrane
Lipid Composition and Verotoxin Production.” Applied and Environmental Microbiology 69 (9):
5115–19.
Yun, S., J.M. Shin, O.-C. Kim, Y.R. Jung, D.-B. Oh, S.Y. Lee, and O. Kwon. 2012. “Probing the
ArcA Regulon in the Rumen Bacterium Mannheimia succiniciproducens by Genome-Wide
Expression Profiling.” Journal of Microbiology 50 (4): 665–72.
Zhang, X., K.T. Shanmugam, and L.O. Ingram. 2010. “Fermentation of Glycerol to Succinate by
Metabolically Engineered Strains of Escherichia coli.” Applied and Environmental Microbiology
76 (8): 2397–2401.
Zhang, Y., Z. Huang, C. Du, Y. Li, and Z. Cao. 2009. “Introduction of an NADH Regeneration
System into Klebsiella oxytoca Leads to an Enhanced Oxidative and Reductive Metabolism of
Glycerol.” Metabolic Engineering 11 (2): 101–6.
Zhang, Y.-X., K. Perry, V.A. Vinci, K. Powell, W.P.C. Stemmer, and S.B. del Cardayré. 2002.
“Genome Shuffling Leads to Rapid Phenotypic Improvement in Bacteria.” Nature 415 (6872):
644–46.

Appendix
112
9 Appendix
9.1 Data related to 13
C metabolic flux analysis
The precursor demand for biomass synthesis was taken from the literature (Becker et al. 2013). The
excellent fit between simulated and experimentally obtained mass isotopomer fractions is shown for
the evolutionary derived mutant B. succiniciproducens DD3-T2, DD3-Suc2 and DD3-Suc3. In
addition, carbon fluxes towards biomass formation and redox balance are shown for all adapted strain,
as compared to the parent strain DD3 (data taken from (Becker et al. 2013)). The fold change for
carbon flux re-distribution is listed, as compared to DD3 (data taken from (Becker et al. 2013)).

Appendix
113
Table 9.1 Precursor demand for biomass synthesis in B. succiniciproducens. Biomass composition was based on previous
studies (Neidhardt et al. 1990; Kim et al. 2007).
NA
DP
H
1
4
1
1
5
1
1
1
1
5
2
4
8
2
3
1
3
2
2
2
99
91
10
33
25
3
36
12
44
7
19
3
49
17
8
15
75
6
NA
DH
-1 -1 -1
-3 -1 -1 -2
-1
-167
2
-116
9
-181
-24
-49
-309
5
AT
P
7 3
4 1 6
2 2
7
1
1 2
5
1
56
51
61
26
93
2
18
58
47
0
24
8
15
4
11
9
15
55
8
CO
2
1 -1
-2
-1 -1 -1
-1
-1
-169
8
27
1
45
-138
2
AK
G
1 1
1 1
10
99
11
86
OA
A
1
1 1 1
1 1
12
97
35
5
45
17
25
AcC
oA
1
38
8
21
16
32
9
55
28
88
Py
r
1 1
2
1 2
26
64
83
27
47
PE
P
2 1
2
44
4
24
28
49
6
PG
A
1 1 1
70
2
27
1
45
12
9
24
49
12
20
GA
P
12
9
12
9
E4
P
1 1
1
22
3
22
3
R5
P
1 1
11
3
62
6
91
24
85
4
F6
P
0
16
55
72
G6
P
0
51
15
4
20
5
Dem
an
d
60
0
18
8
27
0
27
0
22
27
0
27
0
47
1
11
1
26
1
38
8
22
9
69
16
5
37
1
20
9
27
8
2
56
39
9
Pre
curs
or
Ala
Arg
Asp
Asn
Cy
s
Glu
Gln
Gly
His
Ile
Leu
Ly
s
Met
Ph
e
Pro
Ser
Th
r
Trp
Ty
r
Val
Su
m p
rote
in
RN
A
DN
A
Lip
ids
LP
S
Pep
tido
gly
c
an
Gly
cog
en
C1
-unit
s
Po
lyam
ines
To
tta
l

Appendix
114
Table 9.2 Relative mass isotopomer fractions of amino acids from hydrolyzed cell protein and of secreted succinate from
B. succiniciproducens cultivation with 99 % [1-13C] glucose. Data denote experimental GC-MS data (exp) and values
predicted by the solution of the mathematical model corresponding to optimized fluxes (calc). M+0 represents the amount of
non-labeled mass isotopomers fractions, M+1 the amount of single labeled mass isotopomers fractions and corresponding
terms refer to higher labeling.
Analyte
fragment
Mass isotopomer Mass isotopomer distribution
DD3-T2 DD3-T2 42 °C DD3-Suc2 DD3-Suc3
exp calc exp calc exp calc exp Calc
Alanine M+0 0.434 0.431 0.415 0.414 0.418 0.414 0.413 0.408
M-57 M+1 0.419 0.419 0.434 0.432 0.434 0.436 0.438 0.441
M+2 0.112 0.114 0.114 0.116 0.111 0.113 0.112 0.114
Alanine M+0 0.453 0.454 0.434 0.436 0.436 0.434 0.432 0.428
M-85 M+1 0.435 0.436 0.451 0.451 0.452 0.453 0.456 0.458
M+2 0.112 0.110 0.114 0.112 0.112 0.113 0.113 0.114
Glycine M+0 0.741 0.737 0.733 0.731 0.755 0.755 0.738 0.738
M-57 M+1 0.185 0.189 0.192 0.194 0.173 0.174 0.188 0.188
M+2 0.074 0.074 0.075 0.074 0.071 0.071 0.074 0.073
Glycine M+0 0.811 0.813 0.803 0.805 0.820 0.821 0.804 0.804
M-85 M+1 0.189 0.187 0.197 0.195 0.180 0.179 0.196 0.196
Aspartate M+0 0.363 0.362 0.350 0.350 0.351 0.349 0.344 0.343
M-57 M+1 0.402 0.402 0.412 0.411 0.415 0.414 0.420 0.418
M+2 0.160 0.160 0.161 0.162 0.158 0.160 0.160 0.162
Aspartate M+0 0.372 0.373 0.359 0.360 0.357 0.358 0.351 0.353
M-85 M+1 0.410 0.410 0.421 0.420 0.423 0.422 0.427 0.425
M+2 0.159 0.158 0.160 0.159 0.159 0.159 0.160 0.160
Threonine M+0 0.363 0.363 0.349 0.350 0.349 0.349 0.343 0.344
M-57 M+1 0.404 0.403 0.414 0.412 0.417 0.415 0.421 0.419
M+2 0.159 0.160 0.161 0.162 0.159 0.160 0.161 0.161
Threonine M+0 0.374 0.374 0.360 0.361 0.357 0.359 0.352 0.354
M-85 M+1 0.410 0.410 0.421 0.421 0.424 0.422 0.428 0.426
M+2 0.157 0.157 0.159 0.158 0.159 0.159 0.160 0.160
Serine M+0 0.379 0.375 0.363 0.360 0.361 0.360 0.354 0.355
M-57 M+1 0.407 0.405 0.418 0.416 0.423 0.422 0.426 0.425
M+2 0.156 0.160 0.159 0.162 0.156 0.158 0.159 0.159
Serine M+0 0.406 0.404 0.390 0.389 0.386 0.387 0.380 0.382
M-85 M+1 0.433 0.436 0.445 0.448 0.451 0.449 0.454 0.453
M+2 0.162 0.160 0.165 0.163 0.163 0.164 0.166 0.165
Phenylalanine M+0 0.190 0.188 0.165 0.165 0.175 0.173 0.155 0.154
M-57 M+1 0.373 0.375 0.362 0.363 0.374 0.376 0.359 0.360
M+2 0.283 0.279 0.299 0.296 0.293 0.294 0.307 0.307
Tyrosine M+0 0.167 0.162 0.145 0.142 0.152 0.149 0.135 0.133
M-57 M+1 0.342 0.342 0.329 0.330 0.339 0.341 0.324 0.326
M+2 0.287 0.285 0.299 0.298 0.296 0.297 0.306 0.307
Succinate M+0 0.430 0.420 0.416 0.405 0.406 0.404 0.399 0.398
M-57 M+1 0.410 0.415 0.423 0.428 0.431 0.432 0.435 0.436
M+2 0.116 0.119 0.116 0.120 0.117 0.118 0.118 0.119

Appendix
115
Table 9.3 Biomass specific in vivo carbon fluxes of B. succiniciproducens DD3-T2 at 37 and 42 °C, respectively, and DD3-
Suc2 and DD3-Suc3 at 37 °C during growth on minimal glucose medium. Data also comprise specific biomass yield (YX/S),
calculated by linear fitting of the concentration of biomass and product with that of the substrate.
Reaction DD3-T2 DD3-T2 (42 °C) DD3-Suc2 DD3-Suc3
YX/S [g mol-1] 29.2 ± 1.0 28.9 ± 0.5 30.1 ± 2.4 29.1 ± 1.5
GLC6P = GLC6P_B 0.6 ± 0 0.6 ± 0 0.6 ± 0 0.6 ± 0
F6P = F6P_B 0.2 ± 0 0.2 ± 0 0.2 ± 0 0.2 ± 0
P5P = P5P_B 2.5 ± 0 2.5 ± 0 2.6 ± 0.1 2.7 ± 0.1
E4P = E4P_B 0.7 ± 0 0.7 ± 0 0.7 ± 0 0.7 ± 0
GAP = GAP_B 0.4 ± 0 0.4 ± 0 0.4 ± 0 0.4 ± 0
3PG = 3PG_B 3.9 ± 0 3.8 ± 0 3.9 ± 0 4.0 ± 0.1
PYR_PEP = PYR_PEP_B 9.3 ± 0.1 9.3 ± 0.1 9.6 ± 0.1 9.9 ± 0.1
ACCOA = ACCOA_B 8.9 ± 0.1 8.8 ± 0.1 9.3 ± 0.2 10.4 ± 0.2
OAA_MAL = OAA_MAL_B 5.6 ± 0 5.6 ± 0 5.8 ± 0 5.9 ± 0.1
AKG = AKG_B 3.3 ± 0 3.2 ± 0 3.4 ± 0 3.5 ± 0.1
Table 9.4 Response of in vivo flux distribution of the evolutionary adapted stains B. succiniciproducens DD3-T2, at 37 and
42 °C, respectively, and DD3-Suc2 and DD3-Suc3 at 37 °C as compared to their ancestor DD3 (Becker et al. 2013) on
minimal glucose medium. Flux fold change is calculated from specific glucose uptake rate corrected in vivo carbon fluxes.
Reaction DD3-T2 DD3-T2 (42 °C) DD3-Suc2 DD3-Suc3
Specific glucose uptake rate [mmol g-1 h-1] 8.2 ± 0.5 9.1 ± 0.6 7.8 ± 0.8 7.6 ± 0.8
GLC_EX + ATP = GLC 1 1.1 1 0.9
GLC + ATP = GLC6P 1 1.1 1 0.9
GLC6P = F6P 0.9 1.1 0.9 0.9
F6P + ATP = F16BP 1 1.1 0.9 0.9
F16BP = DHAP + GAP 1 1.1 0.9 0.9
DHAP = GAP 1 1.1 0.9 0.9
GAP = 3PG + ATP + NADH 1 1.1 0.9 0.9
3PG = PYR_PEP 1 1.1 0.9 0.9
GLC6P = P5P + CO2 + NADPH + NADPH 2.3 1.4 2.1 1.6
P5P + P5P = S7P + GAP 2.8 1.4 2.5 1.8
GAP + S7P = E4P + F6P 2.8 1.4 2.5 1.8
P5P + E4P = GAP + F6P 3.9 1.6 3.4 2.3
PYR_PEP + CO2 = OAA_MAL + ATP 1.1 1.1 0.9 0.8
PYR_PEP = ACCOA + CO2 + NADH 1.5 2 0.9 1.5
DHAP = MethGlyox = LAC 0.3 0.4 0 0.7
OAA_MAL = 0.5 FUM + 0.5 FUM 1.1 1.1 0.9 0.8
FUM + NADH = SUC 1.1 1.1 0.9 0.8
ACCOA + OAA_MAL = CIT 0.6 0.7 0.6 0.6
CIT = AKG + CO2 + NADPH 0.6 0.7 0.6 0.6
Acetateex 2.1 3.2 1 2.0
Ethanolex 1.8 0.8 0 2.3
Pyruvateex 0.7 0.5 1.4 1.1
Pyruvate derived by-productsex 0.1 0.1 0.9 0.4
Lactateex 0.3 0.4 0 0.7
Succinateex 1 1.1 0.9 0.8

Appendix
116
Figure 9.1 Redox balance of investigated B. succiniciproducens phenotypes DD3-T2, DD3-Suc2 and DD3-Suc3, as
compared to their parent strains DD3 (Becker et al. 2013). NADH (dark grey) and NADPH (light grey) supply were
calculated from metabolic flux distribution. Corresponding demands were estimated from production characteristics
including biomass formation and specific yields for secreted products (Table 5.4 and Table 5.8). NADH supplying reactions
were assumed for glyceraldehyde-3-phosphate dehydrogenase, pyruvate dehydrogenase, 2-oxo-glutarate dehydrogenase.
Considered reactions for NADPH supply were glucose-6-phosphate dehydrogenase, 6-phosphogluconate dehydrogenase, and
isocitrate dehydrogenase. NADH consuming reactions were assumed for alcohol dehydrogenase, malate dehydrogenase, and
fumarate reductase. Under the assumption of an existing NADH dehydrogenase, transferring electrons from NADH to
menaquinone, menaquinone consumption was regarded as NADH consumption (Kim et al. 2009). The NADPH demand for
anabolism was obtained from cellular composition (Table 9.1). Data represent mean values with 90 % confidence intervals.
Figure 9.2 Energy balance for B. succiniciproducens phenotypes DD3-T2, DD3-Suc2 and DD3-Suc3, as compared to their
parent strains DD3 (Becker et al. 2013). ATP demand (dark grey) and supply (light grey) were calculated from biomass
formation, metabolic flux distribution and production characteristics. ATP supply was assumed for phosphoglycerate kinase,
phosphoenolpyruvate carboxykinase, acetate kinase, and succinyl-CoA synthetase. The ATP demand was calculated from
hexokinase and phosphofructokinase. The anabolic demand was obtained from cellular composition (Table 9.1). Data
represent mean values with 90 % confidence intervals.

Appendix
117
9.2 Gene expression analysis of evolved B. succiniciproducens phenotypes
The obtained gene expression profiles of B. succiniciproducens DD3-T2, DD3-Suc2 and DD3-Suc3
were used for database-aided operon search. Operons and their corresponding genes were listed
according to the Database of prOkaryotic OpeRons (Dam et al. 2007; Mao et al. 2009) and the
Prokaryotic Operon DataBase (Taboada et al. 2012) for M. succiniciproducens MBELE55 predictions.
Table 9.5 Operon linked gene expression of B. succiniciproducens DD3-T2. Data comprise operons, up- and down-regulated
in response to temperature adaptation, as compared to the ancestor DD3.
Number Systematic
namea Gene namea Mean FCb Specificationc Functiond
1 MS616-18 2.0 Phosphotransferase system G
2 MS1334-36 lpd, aceF, aceE 4.2 Pyruvate dehydrogenase complex C
3 MS1606-08 dAK1, dAK2 2.2 Dihydroxyacetone kinase G
4 MS2284-89 uhpT, uhpA,
uhpB, uhpC, baeS 10.4
Hexose phosphate phosphorelay
system G, T, M
5 MS0549-51 proV, proW, proX - 3.0 Glycine betain/proline transport E
6 MS1791-95
dgoA, menB,
mhpC, mend,
menF
- 2.8 Menaquinone biosynthesis H, R
7 MS1816-19 nrfD, nrfC, nrfB,
nrfA - 2.5 Formate dependent nitrite reductase P, C
8 MS1821-22 rluD - 2.0 Pseudouridine synthase and conserved
protein J, S
9 MS2073-74 glgP, malQ - 2.0 Glycogen metabolism G a Gene entries and names are given by KEGG annotations for M. succiniciproducens MBELE55. b Mean fold change represents the mean value of gene expression of all operon involved genes. c The operon specifications were assigned using the databases of KEGG and BLAST. d Functional grouping was taken from literature (Hong et al. 2004).
Table 9.6 Impact of succinate adaptation on B. succiniciproducens gene expression. Data comprise operons, up- and down-
regulated in DD3-Suc2, as compared to the ancestor DD3.
Number Systematic
namea Gene namea Mean FCb Specificationc Functiond
1 MS0458-59 groE, groEL 2.0 Molecular chaperones O
2 MS1249-52 cysI, cysJ, cysN,
cysH 4.6 Cysteine biosynthesis E
3 MS1275-77 glnQ, artM, artI 2.6 Cysteine related ABC transporter
system E
4 MS1334-35 lpd, aceF, ace 2.3 Pyruvate dehydrogenase complex C
5 MS1855-57 nrdG 2.1 Queosine biosynthesis R, H, O
6 MS0038-40 oadB, oadA,
oadG - 3.2 Oxaloacetate decarboxylase C
7 MS0549-51 proV, proW - 3.5 Glycine betain/proline transport E
8 MS0616-18 - 2.1 Phosphotransferase system G
9 MS0731-32 gltD - 2.5 Putative glutamate synthase and
formate dehydrogenase subunit alpha E, R
10 MS1120-24 glgA, glgC, glgX,
glgB, malQ - 2.0 Glycogen metabolism G
11 MS1156-58 feoB, feoB - 2.2 Ferrous iron transport P
12 MS1652-55 sdhA, frdB, frdC,
frdD - 3.3 Fumarate reductase C

Appendix
118
13 MS1816-19 nrfD, nrfC, nrfB,
nrfA - 2.2 Formate dependent nitrite reductase P, C
14 MS2066-67 lamB, malK - 2.2 Maltose, maltodextrins uptake G
15 MS2377-79 - 2.4 Phosphotransferase system G a Gene entries and names are given by KEGG annotations for M. succiniciproducens MBELE55. b Mean fold change represents the mean value of gene expression of all operon involved genes. c The operon specifications were assigned using the databases of KEGG and BLAST. d Functional grouping was taken from literature (Hong et al. 2004).
Table 9.7 Operon linked gene expression of B. succiniciproducens DD3-Suc3. Data comprise operons, up- and down-
regulated in response to temperature adaptation, as compared to the ancestor DD3.
Number Systematic
namea Gene namea Mean FCb Specificationc Functiond
1 MS0966-67 2.2 Dihydropteroate synthase and
phosphoglucosamine mutase H, G
2 MS1441-42 2.5 Pseudouridine synthase and ribosome
binding factor A J
3 MS1444-46 3.3
Translation initiation factor IF2,
transcription elongation factor and
ribosome maturation protein
J, K
4 MS16(66)-75 2.0 Peptidoglycan biosynthesis M, D
5 MS1(699)-
703 3.1 Threonine synthesis E, S
6 MS1922-23 2.3 Lipid biosynthesis M
7 MS2311-12 2.2
Uncharacterized protein containing
SH3 domain and tRNA nucleotidyl-
transferase
T, J
8 MS0549-51 - 10.6 Glycine betain/proline transport E
9 MS0911-12 - 2.0 Lipopolysaccharide biosynthesis M
10 MS1652-55 - 2.4 Fumarate reductase C
11 MS16(83)-87 - 2.4 ABC-type amino acid transport E
12 MS1786-87 - 2.0 Na+/solute symporter (pantothenate,
proline) and uncharacterized protein H, S
13 MS17(91)-95 - 2.6 Menaquinone biosynthesis H, R
14 MS1816-(19) - 4.6 Formate dependent nitrite reductase P, C
15 MS1821-22 - 2.5 Pseudouridine synthase and
uncharacterized protein J, S
16 MS1824-25 - 2.2 Dihydroneopterin synthase and
uncharacterized transporter protein H, R
17 MS2066-67 - 4.8 Maltose, maltodextrins uptake G
18 MS20(68)-70 - 3.7 Maltose, maltodextrins transport G
19 MS2073-74 - 3.1 Glycogen metabolism G a Gene entries and names are given by KEGG annotations for M. succiniciproducens MBELE55. b Mean fold change represents the mean value of gene expression of all operon involved genes. c The operon specifications were assigned using the databases of KEGG and BLAST. d Functional grouping was taken from literature (Hong et al. 2004).

Appendix
119
9.3 Rational strain construction
The plasmid used for metabolic engineering of B. succiniciproducens is given in Table 9.8. Rationally
engineered strains are given in Table 9.9. Strains, referred to BASF SE, were constructed by BASF SE
in the laboratories of Dr. Joanna-Martyna Krawczyk. The applied site-specific primers for plasmid
construction and nucleotide validation are given in Table 9.10.
Table 9.8 Plasmids used for genetic modifications of B. succiniciproducens.
Plasmid Modification(s) Reference
pSUC-1
pJFF224-XN + rpoC (MS0213) gene with nucleotide exchange
692C>A resulting in the amino acid exchange T231K under the
native promoter
This work
Table 9.9 Basfia succiniciproducens strains genetically engineered for phenotype studies regarding succinate production
improvement.
Strain Modification(s) Reference
DD3 pJFF224-XN DD3 + empty expression vector pJFF224-XN This work
DD3 pSUC-1 DD3 + expression of plasmid pSUC-1 This work
DD3 Δrfe DD3 + deletion of the rfe (MS0911) gene BASF SE
DD3 rfeT18P DD3 + nucleotide exchange 46A>C resulting in the amino acid
exchange T18P in the rfe (MS0911) gene BASF SE
DD3 wcaJY27fs DD3 + nucleotide insertion 80_81insC resulting in the frame shift
mutation Y27fs in the wcaJ (MS1494) gene BASF SE
DD5 lysAG307C DD5 + nucleotide exchange 919G>T resulting in the amino acid
exchange G307C in the lysA (MS2084) gene BASF SE
DD1Δldh ptaV666I
DD1 + deletion of the ldh gene encoding for lactate dehydrogenase
+ nucleotide exchange 1996G>A resulting in the amino acid
exchange V666I in the pta (MS0998) gene
BASF SE
Table 9.10 Sequences of site-specific primers used for construction of transformation vector (Table 9.8) and validation of
strain specific nucleotide exchanges (Table 9.9).
Name Sequence (5’ 3’) Plasmid Control
RSt01 AGGTCATTCAAAAGGTCATC pJFF224-XN
RSt02 AAGTGTCATAGCACCAACTG pJFF224-XN
RSt03 GACTAGTTGATAAAATGCACGCTCGTT pJFF224-XN
RSt04 CACTCGAGTTATTCCGCATCATCCGCCA pJFF224-XN
RSt05 TTATTATTGGATATGCCGTT rpoC for
RSt06 GCCAAAGATTTTAACGGACG rpoC rev
RSt07 TATCGTCGGTGTCCCAAATA rfe for
RSt08 TCCAGTAAACCGATGACCAA rfe rev
RSt09 AATTGGTCGGTCGTAGGAGA wcaJ for
RSt10 TTCAACATACCAGGCATCCA wcaJ rev
RSt11 GCCACCGATCGATTATTCT lysA for
RSt11 GAAGACATGCTTGCTCCGTA lysA rev
RSt11 TAATCGACGGTCCGTTACAA pta for
RSt12 GCTTTCCGAGTAGTGCCTTT pta rev


![Succinate Dehydrogenase-a Comparative Review · Membrane-bound succinate dehydrogenase [SDH; E.C.1.3.99.1 succinate:(acceptor) oxido-reductase] is present in all aerobic cells. Ever](https://img.pdfslide.net/doc/110x75/5e54371d86904d694572eef0/succinate-dehydrogenase-a-comparative-review-membrane-bound-succinate-dehydrogenase.jpg)