Embed Size (px)
Citation preview
179
G e o l o g i c a A c t a , V o l . 1 4 , N º 2 , J u n e 2 0 1 6 , 1 7 9 - 1 9 3D O I : 1 0 . 1 3 4 4 / G e o l o g i c a A c t a 2 0 1 6 . 1 4 . 2 . 6
Improving the coastal record of tsunamis in the ESI-07 scale: Tsunami Environmental Effects Scale (TEE-16 scale)
J. LARIO1 T. BARDAJÍ2 P.G. SILVA3 C. ZAZO4 J.L. GOY5
1Facultad de Ciencias, UNED28040-Madrid, Spain. Lario E-mail: [email protected] , phone: +34 913987879
2U.D. Geología. Universidad de Alcalá28871-Alcalá de Henares, Madrid, Spain
3Dpto. Geología, Universidad de Salamanca, EPTS de Ávila05003-Ávila, Spain
4Dpto. Geología, Museo Nacional CC. Naturales, CSIC28006-Madrid, Spain
5Dpto. Geología, Facultad de Ciencias, Universidad de Salamanca 37008-Salamanca, Spain
This paper discusses possibilities to improve the Environmental Seismic Intensity Scale (ESI-07 scale), a scale based on the effects of earthquakes in the environment. This scale comprises twelve intensity degrees and considers primary and secondary effects, one of them the occurrence of tsunamis. Terminology and physical tsunami parameters corresponding to different intensity levels are often misleading and confusing. The present work proposes: i) a revised and updated catalogue of environmental and geological effects of tsunamis, gathering all the available information on Tsunami Environmental Effects (TEEs) produced by recent earthquake-tsunamis; ii) a specific intensity scale (TEE-16) for the effects of tsunamis in the natural environment at coastal areas. The proposed scale could be used in future tsunami events and, in historic and paleo-tsunami studies. The new TEE-16 scale incorporates the size specific parameters already considered in the ESI-07 scale, such as wave height, run-up and inland extension of inundation, and a comprehensive and more accurate terminology that covers all the different intensity levels identifiable in the geological record (intensities VI-XII). The TEE-16 scale integrates the description and quantification of the potential sedimentary and erosional features (beach scours, transported boulders and classical tsunamites) derived from different tsunami events at diverse coastal environments (e.g. beaches, estuaries, rocky cliffs,). This new approach represents an innovative advance in relation to the tsunami descriptions provided by the ESI-07 scale, and allows the full application of the proposed scale in paleoseismological studies. The analysis of the revised and updated tsunami environmental damage suggests that local intensities recorded in coastal areas do not correlate well with the TEE-16 intensity (normally higher), but shows a good correlation with the earthquake magnitude (Mw). Tsunamis generated by earthquakes can then be considered efficient processes in the direct transference of the “energy” released by offshore seismogenic sources to the nearest coastal areas, even over distances of hundreds of kilometres (>200km). This scale, as the previous ones, is independent of the earthquake type (i.e. style of faulting) and only focuses on the environmental effects triggered by tsunamis of seismic origin.
A B S T R A C T
Tsunamis. Tsunami intensity scale. Coastal damage. Environmental seismic intensity.KEYWORDS
J . L a r i o e t a l .
G e o l o g i c a A c t a , 1 4 ( 2 ) , 1 7 9 - 1 9 3 ( 2 0 1 6 )D O I : 1 0 . 1 3 4 4 / G e o l o g i c a A c t a 2 0 1 6 . 1 4 . 2 . 6
Tsunami Environmental Effects (TEE-16) Scale
180
INTRODUCTION: ENVIRONMENTAL EFFECTS ON SEISMIC INTENSITY SCALES
Seismic intensity scales are based on the effects of earthquakes on humans, man-made structures and natural environment. The traditional macroseismic scales, such as the Mercalli-Cancani-Sieberg scale (MCS-30, Sieberg, 1930), the Modified Mercalli scale (MM-31, Wood and Newman, 1931) and the Medvedev, Sponheuer and Karnik scale (MSK-64, Medvedev et al., 1964), are typically divided into twelve degrees (I—XII). The assessment of low intensity levels (I—V) are mainly based on effects on humans, the effects on man-made constructions are decisive for intermediate intensity levels (VI—IX), and the severe effects on buildings and the natural environment are critical for strong earthquakes (X—XII). All these intensity scales consider the Earthquake Environmental Effects (EEEs) as diagnostic elements for intensity evaluation. This is especially relevant from the intensity degrees ≥IX, where intensity evaluation based on building damage nearly saturates (Michetti et al., 2007). However, some modern practices of macroseismic investigation in Europe tend to focus only on the effects on the anthropic environment, overlooking the environmental damage because of the often assumed difficulty in being accurately assessed, as is the case of the new European Macroseismic Scale EMS-98 (Grünthal, 1998).
The traditional scales consider that observable EEEs occur at intensities ≥VI, noticeable at intensity VIII, and destructive or devastating at intensities ≥IX, with descriptions somewhat qualitative and not properly classified. The growth of Palaeoseismology as an independent discipline led to the development of the Environmental Seismic Intensity Scale ESI-07 (Michetti et al., 2007), ratified by INQUA during its XVII Congress in Cairns (Australia) in 2007. The ESI-07 scale is based on the identification, classification and quantification of the variety of EEEs considered in the traditional intensity scales (Silva et al., 2015a). This scale can be used alone or jointly with the damage-based macroseismic scales (i.e. MCS, MM-31, MSK-64, EMS-98), and is particularly effective for seismic events with epicentral intensity higher than X, when damage-based scales get saturated and environmental effects are still diagnostic.
The importance of EEEs as a tool to assess the earthquake intensity (stressed in the guidelines of the ESI-07) is the following:
i) The EEE size is the most reliable tool in the intensity assessment of strong earthquakes. For major earthquakes (intensity ≥X) the effects on human modified environment suffer from saturation (man-made structures are almost completely destroyed). Consequently, at high intensity
levels, building damage itself is not a good indicator of the intensity and EEEs features become diagnostic for intensity assessments.
ii) Intensity based on EEEs is the best tool to compare recent, historical and paleoseismic events, thus making possible to extend back in time the conventional seismic catalogues based on instrumental and historical seismic records.
iii) The use of EEEs offers the possibility to compare different worldwide earthquake intensity assessments, since the earthquake occurrence is independent of particular socio-economic conditions, different building practices and even the presence of humans or man-made structures. For example, the ESI-07 scale has been recently applied to assess seismic intensities on the Moon (Kumar et al., 2016).
The ESI-07 scale provides a classification and quantification of EEEs into twelve intensity degrees, offering quantitative numerical data for the size of primary fault effects (surface faulting and co-seismic uplift/subsidence) and secondary effects, depending on whether they are caused directly by earthquake energy reaching the surface or they are induced by ground-shaking (Silva et al., 2015a). The category “Anomalous waves and Tsunamis” is among the secondary EEEs in the ESI-07 scale. This category gathers seiches in closed basins, outpouring of water-basins, changes in lakes and river courses, and tsunamis. In this last case, the intensity degree of the tsunami is better determined by its effects on shores (run-up, erosion, morphological changes of coastline) than the size of the tsunami wave itself. As stated in the guidelines of the ESI-07 scale, this is basically based on the tsunami scale of Papadopoulos and Imamura (2001) and descriptions of tsunami effects worldwide (i.e. Lander et al., 2003). However, the effects of tsunamis on coastal settings are broadly described and not specifically considered in the ESI-07 scale, especially the geological effects. This work aims to take a first step in updating the coastal record of tsunamis in this scale by gathering all available information on the effects of earthquakes in this environment, and to apply the scale to large tsunami events that occurred between 2004 (Indian Ocean) and 2011 (Japan), and two well-known historic and paleo-tsunami events around Iberian Peninsula. In order to complement the ESI-07 scale, we propose a new and independent tsunami intensity scale (TEE-16) based on quantifying the tsunami environmental effects in coastal areas. The geological and geomorphological elements considered in this scale provide indications about the sedimentary and erosive record of tsunamis for its future application on paleoseismic research.
G e o l o g i c a A c t a , 1 4 ( 2 ) , 1 7 9 - 1 9 3 ( 2 0 1 6 )D O I : 1 0 . 1 3 4 4 / G e o l o g i c a A c t a 2 0 1 6 . 1 4 . 2 . 6
J . L a r i o e t a l . Tsunami Environmental Effects (TEE-16) Scale
181
MEASURING THE SIZE AND EFFECTS OF TSUNAMIS: TSUNAMI SCALES
The first tsunami intensity scale was introduced by Sieberg (1932). It consisted in a six-grade intensity scale which, in analogy to earthquake intensity scales, was based on the description of the macroscopic effects of the tsunami, like damage in infrastructures. A few decades later, Ambraseys (1962) published a modified version of Sieberg’s scale consisting also in a six-grade intensity scale.
Japanese authors Imamura (1942, 1949); Iida (1956, 1970); Iida et al. (1967) developed the concept of tsunami magnitude, m, defined as:
m = log2 Hmax
where Hmax is the maximum tsunami wave height (in metres) observed in the coast or measured in the tide gages. The so-called Imamura-Iida Magnitude Scale is also a six-grade scale, ranging from -1 to 4.
Soloviev (1970) defined tsunami intensity (Is), based on the Imamura-Iida magnitude scale, as:
Is= log2 √2Hav
where Hav is the average wave height along the nearest coast. This scale is known as Soloviev-Imamura Tsunami Intensity Scale and it is used in the global tsunami catalogues compiled by the National Geophysical Data Center (NGDC) of the National Oceanic and Atmospheric Administration (NOAA) and the Novosibirsk Tsunami Laboratory, as the main parameter for the size of the tsunami. Soloviev (1970) considered his scale as an intensity scale because it characterizes dynamically the processes at some observational points, whereas a magnitude scale characterizes dynamically the processes in the source of the phenomenon. Nevertheless, since it uses an average wave height to assign a unique value for the size of the tsunami along the entire affected coast, this should represent a magnitude value. Moreover, Papadopoulos and Imamura (2001) indicated that as the formula includes physical parameters, it is a magnitude scale.
Abe (1979, 1981, 1985, 1989) defined tsunami magnitude (Mt) as:
Mt = log H + alog ∆ + D
where H is the maximum single amplitude of tsunami waves (in metres) measured by tide gauges, ∆ is the distance (in kilometres) from the earthquake epicentre to the tide station along the shortest oceanic path (in
kilometres), and a and D are constant parameters. The constant a, representing the amplitude-distance ratio, was found to be approximately linear with a slope of almost unity, i.e. a = 1.0; and the constant D is 5.80 for single-amplitude (crest or trough) data and 5.55 for double-amplitude (crest-to-trough) data.
Murty and Loomis (1980) proposed a second tsunami magnitude, ML, as:
ML=2(log E−19)
where E is the tsunami potential energy calculated as a function of the magnitude of the causative earthquake, log E (J) = 2Mw - 2.7 (Abe, 1989).
A decade later, Shuto (1993) proposed another tsunami intensity:
i = log2 H
H is the local tsunami height (in metres). Shuto proposed to characterize H according to its potential impact on the coast and defined a 6-point classification of tsunami effects (from 0 to 5). Therefore, according to Papadopoulos and Imamura (2001), the Shuto intensity scale can be considered as a mixture of tsunami magnitude and intensity.
Papadopoulos and Imamura (2001) proposed a new tsunami intensity scale based on the following basic principles: i) independence from any physical parameter such as wave height; ii) sensitivity, that is, incorporation of an adequate number of grades in order to describe even small differences in tsunami impacts; and iii) a detailed description of each intensity grade by taking into account all potential tsunami impacts in the environment. These authors propose a 12-degree tsunami intensity scale, analogous to classical damage-based earthquake intensity scales, being the first attempt to incorporate descriptions of Tsunami Environmental Effects (TEE), suggesting a correlation between the wave height (H) and tsunami intensity (i) of Shuto (1993) with their intensity domains (I) (Table 1). This set of criteria has been updated and re-classified in the ESI-07 scale, constituting the basis for the descriptions of TEEs that we are reviewing in this study.
Recently, Lekkas et al. (2013) proposed an Integrated Tsunami Intensity Scale (ITIS-12), a 12-grade scale that takes into account: i) the quantification of the phenomena, ii) the direct impact on humans, iii) the impact on mobile objects, iv) the impact on coastal infrastructures, v) the impact on structures, and vi) the impact on the environment. This scale is designed to be compatible with
J . L a r i o e t a l .
G e o l o g i c a A c t a , 1 4 ( 2 ) , 1 7 9 - 1 9 3 ( 2 0 1 6 )D O I : 1 0 . 1 3 4 4 / G e o l o g i c a A c t a 2 0 1 6 . 1 4 . 2 . 6
Tsunami Environmental Effects (TEE-16) Scale
182
the widely used EMS-98 and ESI-07 scales and proposes a reliable horizontal correspondence throughout the groups of criteria. In the meantime, other proposals (Lavigne et al., 2009) continued to use a 6-point intensity scale structure. The Macrotsunamic Intensity Scale of Lavigne et al. (2009) is based only on the effects on buildings, aimed at having correspondence with the EMS-98 scale, and therefore it is no relevant for the analysis of coastal TEEs developed here.
In summary, most of the aforementioned tsunami intensity and magnitude scales deals only with the energy or size of the tsunami wave, but not properly with the intensity degrees considered in the existing macroseismic scales. Only the tsunami intensity scales based on the original proposal of Papadopoulos and Imamura (2001), such as the ESI-07 scale (Michetti et al., 2007) and the ITIS-12 scale (Lekkas et al., 2013), classify the tsunami features, impact and types of record into the 12 classical intensity grades of the traditional macroseismic scales. Therefore, only these tsumani intensity scales are suitable to fix criteria for the geological record of tsunami events. The cataloguing and classification of such criteria into different intensity levels are of prime interest from the paleoseismological point of view, and therefore for seismic hazard assessment, surpassing the focus on the establishment of the tsunami hazard for a zone (e.g. Abe, 1989; Shuto, 1993) or the measurement of the tsunami-induced damage (e.g. Lavigne et al., 2009).
IMPROVING THE RECORD OF TSUNAMIS IN THE ESI-07 SCALE SECONDARY EFFECTS
Tsunami effects are poorly described or overlooked in the traditional macroseismic scales mentioned in the introductory sections (MCS, MM-31, MSK-64, EMS-98).
Only the ESI-07 scale provides guidelines to compare tsunami effects with the twelve intensity degrees of traditional macroseismic scales. In this scale, natural effects of tsunamis, including small ones, are observable, although marginal, from intensity IV to VI, become significant for intensities VII—VIII and diagnostic for intensities ≥IX. The ESI-07 scale represent the quantification of different parameters (e.g., fault displacement, amount of uplift, length, width, height, volumes, and areal extent) for different categories of EEEs suitable to develop earthquake geological-surveys and paleoseismic research (e.g. Papathanassiou and Kopsachilis, 2013; Silva et al., 2013). Basically, the ESI-07 scale update, classifies and quantifies the EEEs descriptions included in the classical macroseismic scales (Silva et al., 2015a) and in the case of tsunamis, largely based in the proposals of Papadopoulos and Imamura (2001).
Environmental effects in tsunami intensity scales and ESI-07 scale
As stated above, the Papadopoulos-Imamura Intensity Scale (Papadopoulos and Imamura, 2001) is the first that included the record of TEEs for different intensity levels, and also: i) effects on humans; ii) effects on objects, including ships/boats of variable size; and iii) induced building damage. Although these authors reject the use of any tsunami physical parameter (e.g. wave height or run-up dimension), they relate intensity levels with the parameter H of Shuto (1993; Table 1). However, the potential tsunami impacts in nature are weakly described by Papadopoulus and Imamura (2001), and only scarce descriptions of sedimentary deposits, such as the occurrence of sand layers, boulders or the extent of inland flooding, are incorporated.
The above criteria have been updated and re-classified in the ESI-07 scale, that includes the TEEs in the broad category of Anomalous waves and Tsunamis. This category mixes the secondary ground effects triggered by inland ground shaking in water bodies (lakes, rivers and lagoons) with other properly generated by the tsunami impact on coastal zones. Additionally, the ESI-07 scale uses the wave height as criteria for the discrimination of intensity levels in the lower bound of the scale (IV—VIII) and run-up heights for intensity levels ≥X (Table 2). However, the ESI-07 scale mixes up these terms and does not include any reference to the criteria used to define the tsunami height or run-up. Descriptions of TEEs for the different intensity levels in the ESI-07 scale (Table 2) can be useful for the investigation of recent and/or well-documented historical tsunamis, but not for palaeoearthquake-tsunami events, since the descriptions do not incorporate specific data on their geological record (Table 2).
I (intensity) H (m) i
I_V <1.0 0
VI 2.0 1
VII_VIII 4.0 2
IX_X 8.0 3
XI 16.0 4
XII 32.0 5
TABLE 1. Correlation between wave height (H) and tsunami intensity (I) as defined by Shuto (1993) with the intensity domains (I) of Papadopoulos and Imamura (2001)
G e o l o g i c a A c t a , 1 4 ( 2 ) , 1 7 9 - 1 9 3 ( 2 0 1 6 )D O I : 1 0 . 1 3 4 4 / G e o l o g i c a A c t a 2 0 1 6 . 1 4 . 2 . 6
J . L a r i o e t a l . Tsunami Environmental Effects (TEE-16) Scale
183
ESI-07 Intensity Original description of Tsunami environmental effects in the Scale Geological record
I. Not felt
II. Scarcely felt
III. Weak
IV. Largely observed
V. Strong
No effect in environment.
Anomalous waves up to several tens of cm high are perceived by all people on boats and on the coast.
NO
NE
TO L
IMIT
ED
(SH
OR
T-LI
VED
) REC
OR
D
VI. Slightly damaging Anomalous waves up to many tens of cm high floods very limited areas near shore.
VII. Damaging Anomalous waves even higher than a meter flood limited near-shore areas and damage or wash away objects of variable size.
VIII. Heavily damaging Anomalous waves up to 1-2 metres high flood near-shore areas and may damage or wash away objects of variable size. Erosion and dumping of waste is observed along the beaches, where some bushes and even small weak-rooted trees can be eradicated and drifted away.
IX. Destructive Depending on shape of sea bottom and coastline, dangerous tsunamis may reach the shores with run-ups of up to several metres flooding wide areas. Widespread erosion and dumping of waste is observed along the beaches, where bushes and trees can be eradicated and drifted away.
POTE
NTI
ALLY
WE
LL P
RE
SER
VED
GEO
LOG
ICAL
REC
OR
D
X. Very destructive Depending on shape of sea bottom and coastline, tsunamis may reach the shores with run-ups exceeding 5 m flooding flat areas for thousands of meters inland. Small boulders can be dragged for many meters. Widespread deep erosion is observed along the shores, with noteworthy changes of the coastline profile. Trees near-shore are eradicated and drifted away.
XI. Devastating Depending on shape of sea bottom and coastline, large tsunamis may reach the shores with run-ups reaching 15 metres and more devastating flat areas for kilometres inland. Even metre-sized boulders can be dragged for long distances. Widespread deep erosion is observed along the shores, with noteworthy changes of the coastal morphology. Trees near shore are eradicated and drifted away.
XII. Completely devastating
Depending on shape of sea bottom and coastline, giant tsunamis may reach the shores with run-ups of several tens of meters devastating flat areas for many kilometres inland. Big boulders can be dragged for long distances. Widespread deep erosion is observed along the shores, with outstanding changes of the coastal morphology. Many trees are eradicated and drifted away. All boats are tore from their moorings and swept away or carried onshore even for long distances. All people outdoor are swept away.
TABLE 2. Description of tsunami environmental effects presently included in the ESI-07 macroseismic effects (Michetti et al., 2007) extracted for the broader Earthquake Environmental Effect (EEE) category of Anomalous waves and Tsunamis

J . L a r i o e t a l .
G e o l o g i c a A c t a , 1 4 ( 2 ) , 1 7 9 - 1 9 3 ( 2 0 1 6 )D O I : 1 0 . 1 3 4 4 / G e o l o g i c a A c t a 2 0 1 6 . 1 4 . 2 . 6
Tsunami Environmental Effects (TEE-16) Scale
184
The ITIS-12 scale (Lekkas et al., 2013) uses the impact in the environment based on ESI-07 scale descriptions and quantification of the phenomena. The scarce data used to develop this scale (field data only from the 2004 Indonesia tsunami and 2011 Tohoku-Oki one) restrict the accuracy in the use of the scale for different intensity degrees. ITIS-12 scale also displays some misunderstanding points: i) mixture of ESI-07 scale parameters linked to primary effects, such as coastal co-seismic uplift/subsidence, which can be related with the magnitude of the earthquake, but does no strictly correlates with the size of the tsunamis; ii) the tsunami wave height and run-up for each proposal are not related with any intensity or magnitude scales not even those proposed by ESI-07 scale; iii) mix up of different parameters, such as inundation depth, inundation extension or run-up extension; iv) the environmental effect includes pollution from oil and chemicals, which clearly is dependent on the industrial use/development of the affected zone. The ITIS-12 scale uses the same intensity levels as ESI-07, but considers observable TEEs from intensity V, described as “strong” but associated to tsunami height lower than 0.5m. The upper bound of this scale is intensity XII, described as “completely devastating”, with tsunami heights higher than 10m. Therefore, this scale limits the tsunami heights for intensity levels VI to XI between 1 and 10m, which saturates the scale for tsunami heights lower than those observed in recent events. Consequently the ITIS-12 scale does not represent a clear improvement of the ESI-07, and the updating of this scale needs to incorporate descriptions on the geological record of different-sized tsunami events.
Case studies for intensity-tsunami effects relationships
Since the 1992 tsunami in Flores (Indonesia) more than thirty post-tsunami surveys have been carried out by the International Tsunami Survey Teams from Intergovernmental Oceanographic Commission UNESCO-IOC (Dominey-Howes et al., 2012). These surveys, that have been extensively published, include information about the effect of the tsunamis in nature and are valuable tools to establish relationships among the recorded effects, and among some tsunami physical parameters, such as wave height, run-up and extension of inundation. In this paper we use the record of some of the most noteworthy tsunamis occurred during the present century in order to evaluate their ESI-07 intensities, and to obtain empirical relationships to update TEE descriptions and parameterization in this scale (Fig. 1).
The summarized data of the reviewed events mainly refers to lowland coastal areas, such as coastal plains,
coral-reef islands, and marshes and estuarine zones, as well as relatively wide river-mouths in coastal mountain zones and cliffs. All the present century cases analysed are related to tsunami events triggered by strong subduction-earthquakes located at different distances from the damaged areas. In order to assess the intensity level recorded in the most damaged areas, we estimate jointly the ESI-07 intensity level and the instrumental intensity developed by the Shake Maps (United States Geological Survey (USGS), 2015). The instrumental intensity is a tool to estimate MM-31 intensities based on instrumental and calculated ground-motions in the affected zones (Allen et al., 2008) and therefore independent from the recorded damage (Table 3).
2004 Indian Ocean tsunami (Paris et al., 2007; Ontowirio et al., 2013). Tsunami triggered by an earthquake with magnitude Mw9.1. The tsunami height reached 30m. The average run-up was 25—35m, and 51m its maximum. Maximum inundation extended up to 5km inland. Sand layers with an average thickness of 44—82cm were deposited. About 80% of the boulders were transported more than 100m inland. Some boulders >10t in weight were transported up to 500—700m inland, and boulders >85t in weight appeared in the first 10m of the inundated zone, commonly on beaches. Erosive features spread anywhere, recording extensive beach and dune erosion. Many lagoon-sand barriers were destructed. These erosive features extended up to 500m inland the shoreline and more than 2km along riverbeds. As a result the coastline retreated 80m on average, but ranging between 40—200m depending on the original morphology of the littoral zone. Maximum intensity in the coastal zone of Banda-Aceh, c. 154km NNW of the earthquake epicentre, was VIII—IX MM. The application of the ESI-07 scale indicates that environmental damage reached intensity XII. We propose to classify the maximum environmental effect of this tsunami as Intensity XII (Completely devastating).
2006 Java tsunami (Fritz et al., 2007; Moore et al., 2011). Tsunami triggered by an earthquake with magnitude Mw7.7. The maximum tsunami height was measured at 8.6m. There was a uniform maximum run-up at 5—7m, but local run-ups originated by large-scale mass movements reached 26m. Deposition of discontinuous sand sheets up to 20cm thick occurred. Extensive beach erosion originated 1m high scarp. The inundation extended up to a maximum of 700m inland. Maximum intensity in the southern coastal zone of Java, c. 200km south of the earthquake epicentre, was of VI MM. The application of the ESI-07 scale indicates that environmental damage reached intensity X. We propose to classify the maximum environmental effect of this tsunami between intensity VIII (heavily damaging) and intensity IX (destructive).

G e o l o g i c a A c t a , 1 4 ( 2 ) , 1 7 9 - 1 9 3 ( 2 0 1 6 )D O I : 1 0 . 1 3 4 4 / G e o l o g i c a A c t a 2 0 1 6 . 1 4 . 2 . 6
J . L a r i o e t a l . Tsunami Environmental Effects (TEE-16) Scale
185
1 Km
1860 calBP
1690 calBP
Bay ofCádiz
San Pedro river
Guad
alet
e riv
er
RomanWay
AMSAge
BronzeAge site
1690 calBP
Tsunami
Waves
A B
C D
E
seaweed
6.00
m
tsunami deposit
soil
FIGURE 1. Features used to assess the environmental effects of tsunamis. A) Sand layer deposited during the 2010 Chile tsunami. B) Wave height in Illico (Arauco) estimated by seaweed on trees (2010 Chile tsunami). C) On the morning of 26 December 2004, Police Boat 813 Buretpadungkit was at anchor about 1.8km off the coast of Khao Lak (Thailand); when the tsunami struck, the boat was swept almost 2km inland, where it still sits today. D) Conilete fishermen village (Cadiz, SW Spain) devastated during the 1755 Lisbon tsunami. E) Washover fans generated in Guadalete marshland (SW Spain) during the 218 BC- Roman Times tsunami (Luque et al., 2002). CalBP: Calibrated Before present. AMS: Accelerator mass spectrometry.
J . L a r i o e t a l .
G e o l o g i c a A c t a , 1 4 ( 2 ) , 1 7 9 - 1 9 3 ( 2 0 1 6 )D O I : 1 0 . 1 3 4 4 / G e o l o g i c a A c t a 2 0 1 6 . 1 4 . 2 . 6
Tsunami Environmental Effects (TEE-16) Scale
186
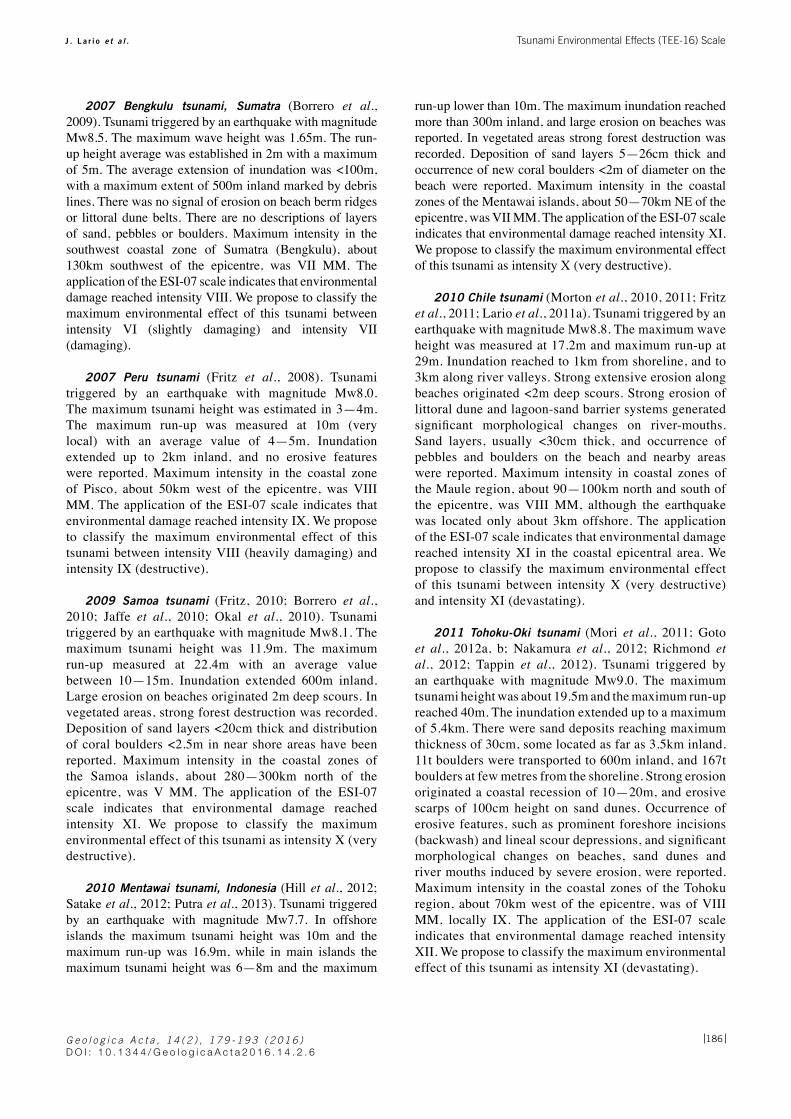
2007 Bengkulu tsunami, Sumatra (Borrero et al., 2009). Tsunami triggered by an earthquake with magnitude Mw8.5. The maximum wave height was 1.65m. The run-up height average was established in 2m with a maximum of 5m. The average extension of inundation was <100m, with a maximum extent of 500m inland marked by debris lines. There was no signal of erosion on beach berm ridges or littoral dune belts. There are no descriptions of layers of sand, pebbles or boulders. Maximum intensity in the southwest coastal zone of Sumatra (Bengkulu), about 130km southwest of the epicentre, was VII MM. The application of the ESI-07 scale indicates that environmental damage reached intensity VIII. We propose to classify the maximum environmental effect of this tsunami between intensity VI (slightly damaging) and intensity VII (damaging).
2007 Peru tsunami (Fritz et al., 2008). Tsunami triggered by an earthquake with magnitude Mw8.0. The maximum tsunami height was estimated in 3—4m. The maximum run-up was measured at 10m (very local) with an average value of 4—5m. Inundation extended up to 2km inland, and no erosive features were reported. Maximum intensity in the coastal zone of Pisco, about 50km west of the epicentre, was VIII MM. The application of the ESI-07 scale indicates that environmental damage reached intensity IX. We propose to classify the maximum environmental effect of this tsunami between intensity VIII (heavily damaging) and intensity IX (destructive).
2009 Samoa tsunami (Fritz, 2010; Borrero et al., 2010; Jaffe et al., 2010; Okal et al., 2010). Tsunami triggered by an earthquake with magnitude Mw8.1. The maximum tsunami height was 11.9m. The maximum run-up measured at 22.4m with an average value between 10—15m. Inundation extended 600m inland. Large erosion on beaches originated 2m deep scours. In vegetated areas, strong forest destruction was recorded. Deposition of sand layers <20cm thick and distribution of coral boulders <2.5m in near shore areas have been reported. Maximum intensity in the coastal zones of the Samoa islands, about 280—300km north of the epicentre, was V MM. The application of the ESI-07 scale indicates that environmental damage reached intensity XI. We propose to classify the maximum environmental effect of this tsunami as intensity X (very destructive).
2010 Mentawai tsunami, Indonesia (Hill et al., 2012; Satake et al., 2012; Putra et al., 2013). Tsunami triggered by an earthquake with magnitude Mw7.7. In offshore islands the maximum tsunami height was 10m and the maximum run-up was 16.9m, while in main islands the maximum tsunami height was 6—8m and the maximum
run-up lower than 10m. The maximum inundation reached more than 300m inland, and large erosion on beaches was reported. In vegetated areas strong forest destruction was recorded. Deposition of sand layers 5—26cm thick and occurrence of new coral boulders <2m of diameter on the beach were reported. Maximum intensity in the coastal zones of the Mentawai islands, about 50—70km NE of the epicentre, was VII MM. The application of the ESI-07 scale indicates that environmental damage reached intensity XI. We propose to classify the maximum environmental effect of this tsunami as intensity X (very destructive).
2010 Chile tsunami (Morton et al., 2010, 2011; Fritz et al., 2011; Lario et al., 2011a). Tsunami triggered by an earthquake with magnitude Mw8.8. The maximum wave height was measured at 17.2m and maximum run-up at 29m. Inundation reached to 1km from shoreline, and to 3km along river valleys. Strong extensive erosion along beaches originated <2m deep scours. Strong erosion of littoral dune and lagoon-sand barrier systems generated significant morphological changes on river-mouths. Sand layers, usually <30cm thick, and occurrence of pebbles and boulders on the beach and nearby areas were reported. Maximum intensity in coastal zones of the Maule region, about 90—100km north and south of the epicentre, was VIII MM, although the earthquake was located only about 3km offshore. The application of the ESI-07 scale indicates that environmental damage reached intensity XI in the coastal epicentral area. We propose to classify the maximum environmental effect of this tsunami between intensity X (very destructive) and intensity XI (devastating).
2011 Tohoku-Oki tsunami (Mori et al., 2011; Goto et al., 2012a, b; Nakamura et al., 2012; Richmond et al., 2012; Tappin et al., 2012). Tsunami triggered by an earthquake with magnitude Mw9.0. The maximum tsunami height was about 19.5m and the maximum run-up reached 40m. The inundation extended up to a maximum of 5.4km. There were sand deposits reaching maximum thickness of 30cm, some located as far as 3.5km inland. 11t boulders were transported to 600m inland, and 167t boulders at few metres from the shoreline. Strong erosion originated a coastal recession of 10—20m, and erosive scarps of 100cm height on sand dunes. Occurrence of erosive features, such as prominent foreshore incisions (backwash) and lineal scour depressions, and significant morphological changes on beaches, sand dunes and river mouths induced by severe erosion, were reported. Maximum intensity in the coastal zones of the Tohoku region, about 70km west of the epicentre, was of VIII MM, locally IX. The application of the ESI-07 scale indicates that environmental damage reached intensity XII. We propose to classify the maximum environmental effect of this tsunami as intensity XI (devastating).

G e o l o g i c a A c t a , 1 4 ( 2 ) , 1 7 9 - 1 9 3 ( 2 0 1 6 )D O I : 1 0 . 1 3 4 4 / G e o l o g i c a A c t a 2 0 1 6 . 1 4 . 2 . 6
J . L a r i o e t a l . Tsunami Environmental Effects (TEE-16) Scale
187
In order to evaluate the proposed scale in the palaeotsunami record, two palaeo-events have been analysed:
1755 AD Lisbon tsunami: (Campos, 1992; Martínez Solares, 2001; Luque, 2002; Lario et al., 2010). Tsunami triggered by an estimated earthquake with magnitude Mw8.7—9.0. There is an extensive historical documentary record of the effects of this tsunami in more than 30 sites along the south-western Iberia shores, and its geological effects on the Gulf of Cadiz have been reported. Historical maps and documents support the tsunamigenic interpretation of the sedimentary deposits. The available data show a maximum inundation of about 5.5km inland and a wave height of 10—12m with a maximum of 30m reported in Sagres (Portugal), the nearest locality to the suspect offshore seismogenic source. However, the reported 30m probably correspond to the tsunami run-up, not to the true wave height. Geological features include large washover fans with centimetre to metre multiple (three or four) sand layers, breaching spit barriers, and sandy layers with erosional base containing marine shell fragments and armoured mounted clasts. The application of the ESI-07 scale indicates that environmental damage reached intensity XII. We propose to classify the maximum environmental effect of this tsunami as intensity XI (devastating).
218 BC- Roman Times tsunami-Gulf of Cadiz (SW Iberia): (multiple data summarized in Luque et al., 2002;
Lario et al., 2010, 2011b; Silva et al., 2015b). Tsunami triggered by an estimated earthquake with magnitude Mw8.0 (Gràcia et al., 2010). The geological record show large erosion along the entire Gulf of Cadiz, breaching the spit barriers in the main estuaries (i.e. Tinto-Odiel, Guadalquivir and Guadalete marshlands), occurrence of washover fans, sequences of sandy layers 5 to 20cm thick with erosional lower boundary, presence of shell fragments and mud clasts, and mixture of planktonic and benthic fauna. Palaeogeographic reconstruction of the ancient open estuarine area suggests a maximum extension of inundation of almost 1km in lowland areas linked to a wave height of about 5m. A severe reorganization of the back barrier drainage patterns of estuaries has been described. Most of the authors considered this Roman event similar to the aforementioned AD 1755 Lisbon tsunami in their consequences and origin, and therefore both linked to a seismic source located almost 350—400km offshore of the reported environmental damage. The application of the ESI-07 scale indicates that environmental damage reached intensity X. We propose to classify the maximum environmental effect of this tsunami as intensity X (very destructive).
PROPOSAL OF A TSUNAMI ENVIRONMENTAL EFFECTS SCALE (TEE SCALE) TO UPDATE THE ESI-07 SCALE
As aforementioned, the different intensity scales that consider tsunami effects use and mix different
Tsunami Event, year Mw Δ(km) MM-31 Intensity ESI-07 Intensity TEE-16 Intensity
Indian Ocean, 2004 9.1 155 VIII -IX* XII XII
Java, 2006 7.7 200 VI X VIII-IX*
Bengkulu, 2007 8.5 130 VII VIII VII
Peru, 2007 8.0 50 VIII IX VIII-IX*
Samoa, 2009 8.1 300 V XI X
Mentawai, 2010 7.7 70 VII XI X
Chile, 2010 8.8 100 VIII XI X-XI*
Tohoku-oki, 2011 9.0 70 VIII-IX* XII XI
Lisbon, 1755 8.7 90** - XII XI
Gulf of Cadiz, 218 BC 8.0 ≥350** - X X
TABLE 3. Summary data on intensities based on tsunami environmental effects, Moment-Magnitude (Mw), minimum epicentral distance (Δ) of the affected areas, Modified Mercalli Intensity (MM-31) extracted from the United States Geological Survey (USGS) Shake Maps-Archive (USGS, 2015), and. *Maximum intensities locally recorded in the affected littoral zones. **Proposed minimum distances (not confirmed)
J . L a r i o e t a l .
G e o l o g i c a A c t a , 1 4 ( 2 ) , 1 7 9 - 1 9 3 ( 2 0 1 6 )D O I : 1 0 . 1 3 4 4 / G e o l o g i c a A c t a 2 0 1 6 . 1 4 . 2 . 6
Tsunami Environmental Effects (TEE-16) Scale
188
physical parameters to quantify the tsunami size, without specific reference to the existing intensity or magnitude tsunami scales. However, it is essential to use always the same parameters in order to develop internal coherence in the proposed scale. We propose to use the terminology defined by the Tsunami Glossary published by the Intergovernmental Oceanographic Commission (2013), also applied to the Tsunami Survey Filed Guide published by same institution (Dominey-Howes et al., 2012). The terms that define the size of tsunami on coast are: i) run-up, maximum ground elevation wetted by the tsunami on a sloping shoreline; in the simplest case, the run-up value is recorded at the ii) maximum inundation distance, or horizontal distance flooded by the wave; iii) flow depth is the depth of the tsunami flood over the local terrain height, while the iv) tsunami height is the total elevation of the water free surface above a reference datum.
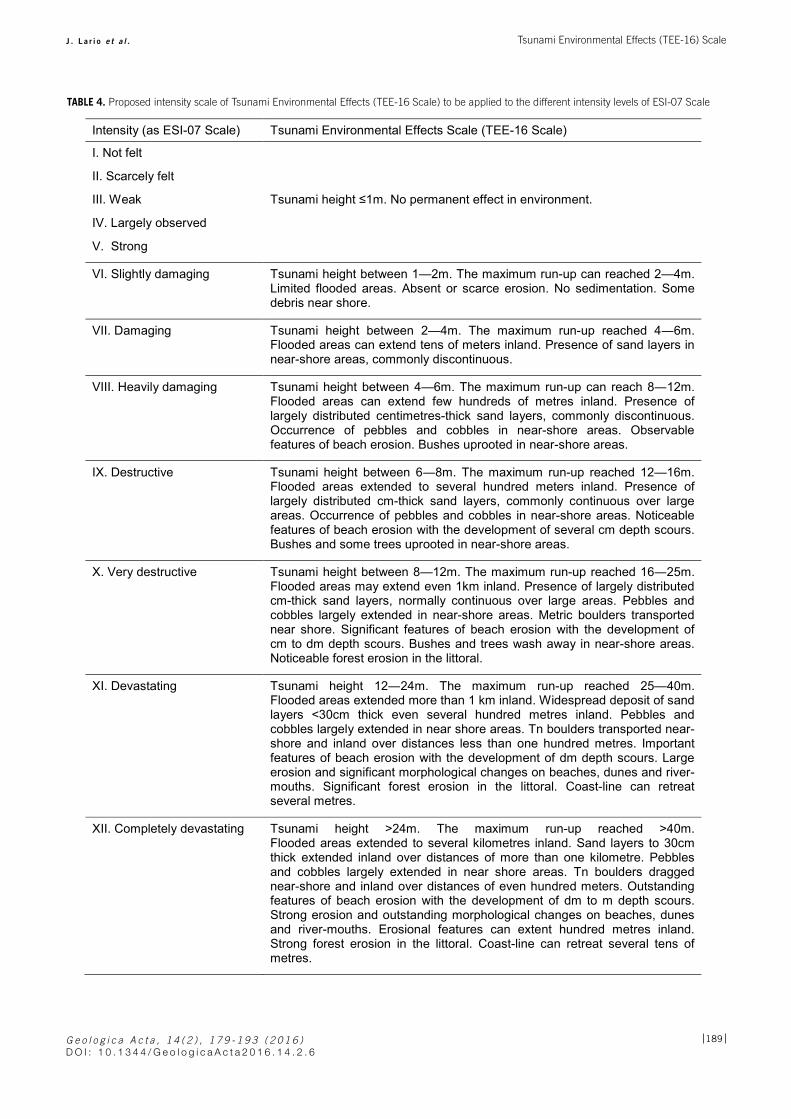
To define the new scale related with the environmental effects of earthquake-tsunami events at different intensity levels we propose to use a range of maximum tsunami height and tsunami run-up for each level of intensity. The size of the tsunami wave depend on the offshore bathymetry, coastal morphology and other local characteristics once the waves reach the coast, but these parameters are directly related with the onshore tsunami environmental effects. To define the tsunami height for each intensity level we propose the use of the correlation suggested by Papadopoulus and Imamura (2001) between their defined intensity domains and the H (maximum tsunami height in metres) and intensity values of Shuto (1993; Table 1). Likewise, others parameters such as maximum inundation distance, occurrence of sediment layers, type and thickness of sediments, dimension of erosional features and transport of debris, pebbles and boulders of different size, are used to characterize each intensity level as described in Table 4.
The proposed scale follows the guidelines of the ESI-07 scale, but with the advantage of i) an internal coherence using always the same terminology and parameters refereed to the Shuto Scale (Shuto, 1993); ii) the use of environmental effects checked in post-tsunami surveys of recent tsunami events published in the international literature; iii) the cross-check between United States Geological Survey (USGS) instrumental intensity records and the ESI-07 scale at known distances from the affected coasts; iv) the inclusion of specific erosive features and v) the inclusion of the occurrence of discontinuous-continuous sediment layers and their thickness. These two last points (iv and v) have the advantage to be applied to the geological record of past tsunami events, and consequently to paleoseismological research.
As summarized in Table 3, either the application of the ESI-07 scale (Table 2) or the proposed scale (Table 4) to the reviewed tsunami events shows poor correlation with the macroseismic intensity levels (MM) shaking the affected areas. Differences of two to three degrees are evident, but the proposed TEE intensities are closer than those of the ESI-07 scale, especially for tsunami events generated by earthquakes located less than 150km offshore of the damaged zones. For most of the cases the proposed intensities are lower than those resulting from the application of the ESI-07 scale (Table 3), but always higher than the MM intensities, except for the case of Bengkulu (Sumatra, 2007) in which the MM equals the proposed intensity. Outstanding cases are those of the Java (2006), Samoa (2009) and Mentawai (2010), with MM intensity between V and VII, but affected by proposed tsunami intensities ≥VIII (Table 3). In these cases the nature of the affected zones, relatively small islands or presence of coral-reefs, magnified the tsunami intensities. In any case, the recorded tsunami intensity is not related to the local intensity (i.e. ground acceleration) recorded in the affected zones, but to the size of the causing earthquake event (Table 3; Fig. 2). In this sense tsunamis seem to be efficient processes in transfer the “energy” released offshore to coastal areas even over distances of hundreds of kilometres. In other words, tsunamis transfer the theoretical damage (maximum intensity) of the epicentral offshore area to the nearest littoral zones. The resulting effects are as if the epicentral macroseismic area would shift to the nearer coasts, increasing the recorded damage in humans, buildings and environment. Since tsunamis are long wavelength waves caused by the displacement of huge volumes of seawater-bodies resulting for the coseismic displacement of the sea-floor, they would be considered as the direct transfer of surface faulting and/or tectonic uplift/subsidence effects occurred offshore to the coasts.
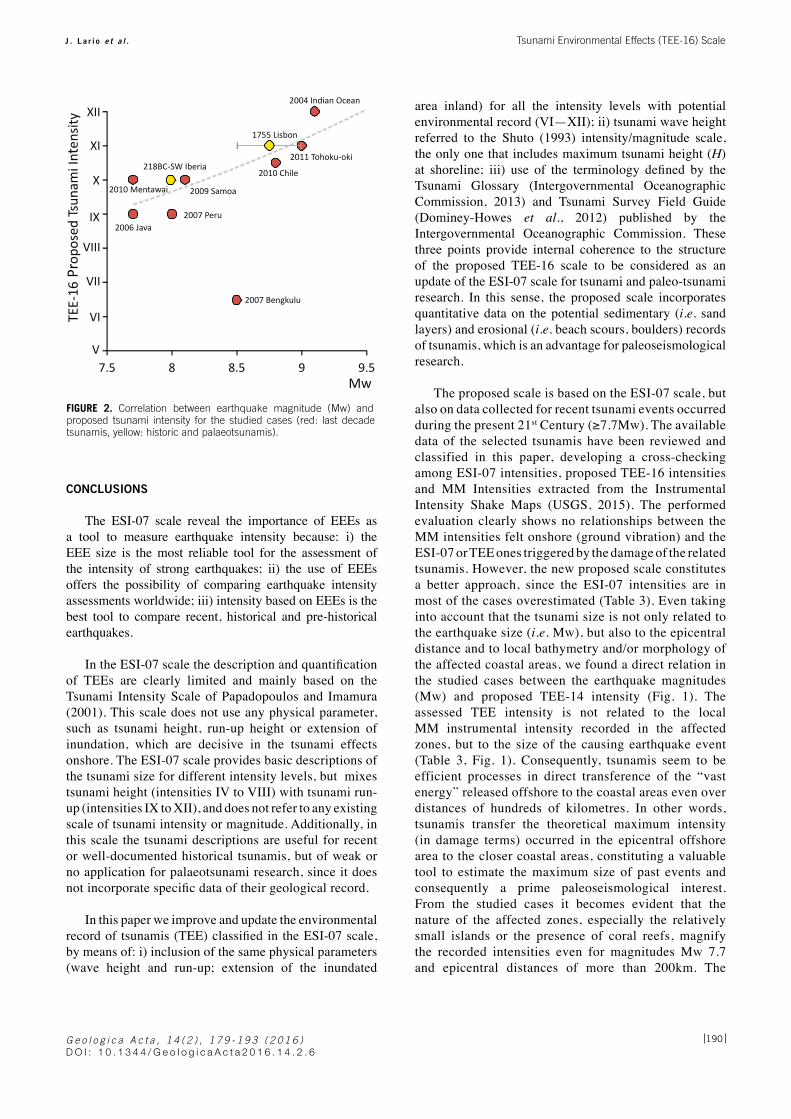
The correlation of tsunami size with the earthquake magnitude is still under debate. But in one of the most extensive studies, Gusiakov (2011) analysed 581 events that occurred all over the world oceans from 1900 to 2010 concluding that the intensity of seismically-induced tsunamis is mainly, but not completely, controlled by earthquake magnitude, displaying a broad growth-trend for increasing magnitudes. Evenmore, the tsunami size is not only related to the earthquake size, but also with the epicentral distance, local bathymetry and morphology of the coasts. In the studied cases we also found a direct relationship between Mw of earthquake and proposed TEE intensity of the tsunami (Fig. 1). The case of the 2007 Bengkulu tsunami is an exception, probably related to the scarcity of available field data (Borrero et al., 2009).
G e o l o g i c a A c t a , 1 4 ( 2 ) , 1 7 9 - 1 9 3 ( 2 0 1 6 )D O I : 1 0 . 1 3 4 4 / G e o l o g i c a A c t a 2 0 1 6 . 1 4 . 2 . 6
J . L a r i o e t a l . Tsunami Environmental Effects (TEE-16) Scale
189
Intensity (as ESI-07 Scale) Tsunami Environmental Effects Scale (TEE-16 Scale)
I. Not felt
II. Scarcely felt
III. Weak
IV. Largely observed
V. Strong
Tsunami height ≤1m. No permanent effect in environment.
VI. Slightly damaging Tsunami height between 1—2m. The maximum run-up can reached 2—4m.Limited flooded areas. Absent or scarce erosion. No sedimentation. Some debris near shore.
VII. Damaging Tsunami height between 2—4m. The maximum run-up reached 4―6m.Flooded areas can extend tens of meters inland. Presence of sand layers in near-shore areas, commonly discontinuous.
VIII. Heavily damaging Tsunami height between 4—6m. The maximum run-up can reach 8―12m.Flooded areas can extend few hundreds of metres inland. Presence of largely distributed centimetres-thick sand layers, commonly discontinuous. Occurrence of pebbles and cobbles in near-shore areas. Observable features of beach erosion. Bushes uprooted in near-shore areas.
IX. Destructive Tsunami height between 6―8m. The maximum run-up reached 12—16m.Flooded areas extended to several hundred meters inland. Presence of largely distributed cm-thick sand layers, commonly continuous over large areas. Occurrence of pebbles and cobbles in near-shore areas. Noticeable features of beach erosion with the development of several cm depth scours. Bushes and some trees uprooted in near-shore areas.
X. Very destructive Tsunami height between 8—12m. The maximum run-up reached 16―25m. Flooded areas may extend even 1km inland. Presence of largely distributed cm-thick sand layers, normally continuous over large areas. Pebbles and cobbles largely extended in near-shore areas. Metric boulders transported near shore. Significant features of beach erosion with the development of cm to dm depth scours. Bushes and trees wash away in near-shore areas. Noticeable forest erosion in the littoral.
XI. Devastating Tsunami height 12―24m. The maximum run-up reached 25—40m.Flooded areas extended more than 1 km inland. Widespread deposit of sand layers <30cm thick even several hundred metres inland. Pebbles and cobbles largely extended in near shore areas. Tn boulders transported near-shore and inland over distances less than one hundred metres. Important features of beach erosion with the development of dm depth scours. Large erosion and significant morphological changes on beaches, dunes and river-mouths. Significant forest erosion in the littoral. Coast-line can retreat several metres.
XII. Completely devastating Tsunami height >24m. The maximum run-up reached >40m.Flooded areas extended to several kilometres inland. Sand layers to 30cm thick extended inland over distances of more than one kilometre. Pebbles and cobbles largely extended in near shore areas. Tn boulders dragged near-shore and inland over distances of even hundred meters. Outstanding features of beach erosion with the development of dm to m depth scours. Strong erosion and outstanding morphological changes on beaches, dunes and river-mouths. Erosional features can extent hundred metres inland. Strong forest erosion in the littoral. Coast-line can retreat several tens of metres.
TABLE 4. Proposed intensity scale of Tsunami Environmental Effects (TEE-16 Scale) to be applied to the different intensity levels of ESI-07 Scale
J . L a r i o e t a l .
G e o l o g i c a A c t a , 1 4 ( 2 ) , 1 7 9 - 1 9 3 ( 2 0 1 6 )D O I : 1 0 . 1 3 4 4 / G e o l o g i c a A c t a 2 0 1 6 . 1 4 . 2 . 6
Tsunami Environmental Effects (TEE-16) Scale
190
CONCLUSIONS
The ESI-07 scale reveal the importance of EEEs as a tool to measure earthquake intensity because: i) the EEE size is the most reliable tool for the assessment of the intensity of strong earthquakes; ii) the use of EEEs offers the possibility of comparing earthquake intensity assessments worldwide; iii) intensity based on EEEs is the best tool to compare recent, historical and pre-historical earthquakes.
In the ESI-07 scale the description and quantification of TEEs are clearly limited and mainly based on the Tsunami Intensity Scale of Papadopoulos and Imamura (2001). This scale does not use any physical parameter, such as tsunami height, run-up height or extension of inundation, which are decisive in the tsunami effects onshore. The ESI-07 scale provides basic descriptions of the tsunami size for different intensity levels, but mixes tsunami height (intensities IV to VIII) with tsunami run-up (intensities IX to XII), and does not refer to any existing scale of tsunami intensity or magnitude. Additionally, in this scale the tsunami descriptions are useful for recent or well-documented historical tsunamis, but of weak or no application for palaeotsunami research, since it does not incorporate specific data of their geological record.
In this paper we improve and update the environmental record of tsunamis (TEE) classified in the ESI-07 scale, by means of: i) inclusion of the same physical parameters (wave height and run-up; extension of the inundated
area inland) for all the intensity levels with potential environmental record (VI—XII); ii) tsunami wave height referred to the Shuto (1993) intensity/magnitude scale, the only one that includes maximum tsunami height (H) at shoreline; iii) use of the terminology defined by the Tsunami Glossary (Intergovernmental Oceanographic Commission, 2013) and Tsunami Survey Field Guide (Dominey-Howes et al., 2012) published by the Intergovernmental Oceanographic Commission. These three points provide internal coherence to the structure of the proposed TEE-16 scale to be considered as an update of the ESI-07 scale for tsunami and paleo-tsunami research. In this sense, the proposed scale incorporates quantitative data on the potential sedimentary (i.e. sand layers) and erosional (i.e. beach scours, boulders) records of tsunamis, which is an advantage for paleoseismological research.
The proposed scale is based on the ESI-07 scale, but also on data collected for recent tsunami events occurred during the present 21st Century (≥7.7Mw). The available data of the selected tsunamis have been reviewed and classified in this paper, developing a cross-checking among ESI-07 intensities, proposed TEE-16 intensities and MM Intensities extracted from the Instrumental Intensity Shake Maps (USGS, 2015). The performed evaluation clearly shows no relationships between the MM intensities felt onshore (ground vibration) and the ESI-07 or TEE ones triggered by the damage of the related tsunamis. However, the new proposed scale constitutes a better approach, since the ESI-07 intensities are in most of the cases overestimated (Table 3). Even taking into account that the tsunami size is not only related to the earthquake size (i.e. Mw), but also to the epicentral distance and to local bathymetry and/or morphology of the affected coastal areas, we found a direct relation in the studied cases between the earthquake magnitudes (Mw) and proposed TEE-14 intensity (Fig. 1). The assessed TEE intensity is not related to the local MM instrumental intensity recorded in the affected zones, but to the size of the causing earthquake event (Table 3, Fig. 1). Consequently, tsunamis seem to be efficient processes in direct transference of the “vast energy” released offshore to the coastal areas even over distances of hundreds of kilometres. In other words, tsunamis transfer the theoretical maximum intensity (in damage terms) occurred in the epicentral offshore area to the closer coastal areas, constituting a valuable tool to estimate the maximum size of past events and consequently a prime paleoseismological interest. From the studied cases it becomes evident that the nature of the affected zones, especially the relatively small islands or the presence of coral reefs, magnify the recorded intensities even for magnitudes Mw 7.7 and epicentral distances of more than 200km. The
7.5 8 8.5 9 9.5Mw
V
VI
VII
VIII
IX
X
XI
XII
TEE-
16 P
ropo
sed
Tsun
ami I
nten
sity
2010 Mentawai
218BC-SW Iberia2010 Chile
2011 Tohoku-oki
2004 Indian Ocean
1755 Lisbon
2009 Samoa
2006 Java2007 Peru
2007 Bengkulu
FIGURE 2. Correlation between earthquake magnitude (Mw) and proposed tsunami intensity for the studied cases (red: last decade tsunamis, yellow: historic and palaeotsunamis).
G e o l o g i c a A c t a , 1 4 ( 2 ) , 1 7 9 - 1 9 3 ( 2 0 1 6 )D O I : 1 0 . 1 3 4 4 / G e o l o g i c a A c t a 2 0 1 6 . 1 4 . 2 . 6
J . L a r i o e t a l . Tsunami Environmental Effects (TEE-16) Scale
191
TEE scale, as the previous ones, is independent of the earthquake type (i.e. style of faulting) and only focuses on the environmental effects of a tsunami generated by an earthquake. However, all the earthquake-tsunamis reviewed in this paper are subduction-zone events, except the two historical ones in SW Iberia (Gulf of Cadiz), which are no clearly related to a full-subduction scenario, but to theoretical initial subduction or lithospheric delamination processes in the passive margin of the western Atlantic as proposed by several authors (Gutscher et al., 2002, 2006)
Finally to indicate that the preliminary review and update of the ESI-07 scale performed in this paper, results in the proposal of an intensity scale on TEE-16. We propose to use this “different label” in order to not generate confusion between previous studies based in the ESI-07 scale and those potential future ones based on the present proposal. Whatever the case, the present proposal is a preliminary approach to tsunami research, which needs to be updated and checked in well-documented historical, recent and future tsunamis, to get a confident use in paleoseismological research of earthquake-tsunami events.
ACKNOWLEDGMENTS
Research funding was provided by the Ministerio de Economía y Competitividad of Spain to projects CGL2012-33430, CGL2012-37581-CO2-01, CGL2013-42847-R and ACI-2009-1037. It is a contribution of the Spanish Working Group of IGCP Project 639, INQUA Coastal and Marine Processes Commission and the 1299 INQUA Project “EEE Parameterization”. The authors are grateful to P.J. Costa and A.M. Michetti for their useful comments improving the original manuscript.
REFERENCES
Abe, K., 1979. Size of great earthquakes of 1837-1974 inferred from tsunami data. Journal of Geophysical Research: Solid Earth, 81, 1561-1568.
Abe, K., 1981. Physical size of tsunamigenic earthquakes of the northwestern Pacific. Physics of the Earth and Planetary Interiors, 27,194-205.
Abe, K., 1985. Quantification of major earthquake tsunamis of the Japan Sea. Physics of the Earth and Planetary Interiors, 38, 214-223.
Abe, K., 1989. Quantification of tsunamigenic earthquakes by the Mt scale. Tectonophysics, 166, 27-34.
Allen, T.I., Wald, D.J., Hotovec, A.J., Lin, K., Earle, P.S., Marano, K.D., 2008. An Atlas of Shake Maps for selected global earthquakes. U.S. Geological Survey Open-File Report 2008-1236, 34pp.
Ambraseys, N.N., 1962. Data for the investigation of the seismic sea-waves in the eastern Mediterranean. Bulletin Seismological Society of America, 52, 895-913.
Borrero, J.C., Weiss, R., Okal, E., Hidayat, R., Suranto, Arcas, D., Titov, V.V., 2009. The Tsunami of September 12, 2007, Bengkulu Province, Sumatra, Indonesia: Post-tsunami field survey and numerical modeling. Geophysical Journal International, 178, 180-194.
Borrero, J.C., Fritz, H.M., Synolakis, C.E., Weiss, R., Okal, E.A., 2010. The Samoa tsunami of 29 September 2009: Field survey in Samoa and preliminary modeling. Geophysical Research Abstracts, EGU2010-6999.
Campos, M.L., 1992. El riesgo de Tsunamis en España. Análisis y valoración geográfica. Instituto Geográfico Nacional Monografías, 9, 204pp.
Dominey-Howes, D., Dengler, L., Dunbar, P., Kong, L., Fritz, H., Imamura, F., McAdoo, B., Satake, K., Yalciner, A., Yamamoto, M., Yulianto, E., Koshimura, S., Borrero, J., 2012. International Tsunami Survey Team (ITST) Post-Tsunami Survey Field Guide. Paris, 2nd Edition, UNESCO-IOC, 89pp.
Fritz, H.M., 2010. Samoa Earthquake and Tsunami of September 29, 2009. Earthquake Engineering Research Institute (EERI), Newsletter, Special Earthquake Report, 1-8.
Fritz, H.M., Kongko, W., Moore, A., Mcadoo, B., Goff, J., Harbitz, C., Uslu, B., Kalligeris, N., Suteja, D., Kalsum, K., Titov, V., Gusman, A., Latief, H., Santoso, E., Sujoko, S., Djulkarnaen, D., Sunendar, H., Synolakis, C.E., 2007. Extreme run-up from the 17 July 2006 Java tsunami. Geophysical Research Letters, 34, L12602.
Fritz, H. M., Kalligeris, N., Borrero, J.C., Broncano, P., Ortega, E., 2008. 15 August 2007 Peru tsunami run-up observations and modelling. Geophysical Research Letters, 35, L10604.
Fritz, H.M., Petroff, C., Catalán, P., Cienfuegos, R., Winckler, P., Kalligeris, N., Weiss, R., Barrientos, S., Meneses, G., Valderas, C., Ebeling, C., Papadopoulus, A., Contreras, M., Almar, R., Domínguez, J.C., Synolakis, C., 2011. Field survey of the 27 February 2010 Chile tsunami. Pure and Applied Geophysics, 168, 1989-2010.
Gràcia, E., Vizcaino, A., Escutia, C., Asioli, A., Rodés, A., Pallás, R., Garcia-Orellana, J., Lebreiro, S., Goldfinger, C., 2010. Holocene earthquake record offshore Portugal (SW Iberia): Testing turbidite palaeoseismology in a slow-convergence margin. Quaternary Science Reviews, 29, 1156-1172.
Goto, K., Sugawara, D., Ikema, S., Miyagi, T., 2012a. Sedimentary processes associated with sand and boulder deposits formed by the 2011 Tohoku-oki tsunami at Sabusawa Island, Japan. Sedimentary Geology, 282, 188-198.
Goto, K., Fujima, K., Sugawara, D., Fujino, S., Imai, K., Tsudaka, R., Abe, T., Haraguchi, T., 2012b. Field measurements and numerical modeling for the run-up heights and inundation distances of the 2011 Tohoku-oki tsunami at Sendai Plain, Japan. Earth, Planets and Space, 64, 1247-1257.
Grünthal, G., 1998. European Macroseismic Scale 1998: EMS98. Luxembourg, Musée National d’Histoire Naturrelle, 99pp.

J . L a r i o e t a l .
G e o l o g i c a A c t a , 1 4 ( 2 ) , 1 7 9 - 1 9 3 ( 2 0 1 6 )D O I : 1 0 . 1 3 4 4 / G e o l o g i c a A c t a 2 0 1 6 . 1 4 . 2 . 6
Tsunami Environmental Effects (TEE-16) Scale
192
Gusiakov, V., 2011. Relationship of tsunami intensity to source earthquake magnitude as retrieved from historical data. Pure and Applied Geophysics, 168, 2033-2041.
Gutscher, M.A., Malod, J., Rehault, J.P., Contrucci, I., Klingelhoefer, F., Mendes-Victor, L., Spakman, W., 2002. Evidence for active subduction beneath Gibraltar. Geology, 30, 1071-1074.
Gutscher, M.A., Baptista, M.A., Miranda, J.M., 2006. The Gibraltar Arc seismogenic zone (part 2): Constraints on a shallow east dipping fault plane source for the 1755 Lisbon earthquake provided by tsunami modeling and seismic intensity. Tectonophysics, 426, 153-166.
Hill, E., Borrero, J., Huang, Z., Qiu, Q., Banerjee, P., Natawidjaja, D., Elosegui, P., Fritz, H., Pranantyo, I., Li, L., Macpherson, K., Skanavis, V., Synolakis, C., Sieh, K., 2012. The 2010 Mw7.8 Mentawai earthquake: Very shallow source of a rare tsunami earthquake determined from tsunami field survey and near-field GPS. Journal of Geophysical Research, 117, B06402.
Iida, K., 1956. Earthquakes accompanied by tsunamis occurring under the sea off the islands of Japan. The Journal of Earth and Planetary Sciences, Nagoya University, 4, 1-43.
Iida, K., 1970. The generation of tsunamis and the focal mechanism of earthquakes. In: Adams, W.M. (ed.). Tsunamis in the Pacific Ocean. Honolulu (Hawaii), East-West Center Press, 3-18.
Iida, K., Cox, D., Pararas-Carayannis, G., 1967. Preliminary catalogue of tsunamis occurring in the Pacific Ocean. Honolulu, University of Hawaii, Hawaii Institute of Geophysics, Data Report, 5, Contribution HIG-67-10, 261pp.
Imamura, A., 1942. History of Japanese tsunamis (in Japanese). Kayo-No-Kagaku (Oceanography), 2, 74-80.
Imamura, A., 1949. List of tsunamis in Japan (in Japanese). Journal of Seismological Society of Japan, 2, 23-28.
Intergovernmental Oceanographic Commission (2013). Tsunami Glossary. Paris, UNESCO, Intergovernmental Oceanographic Commission (IOC) Technical Series, 85.
Jaffe, B.E., Gelfenbaum, G., Buckley, M.L., Watt, S., Apotsos, A., Stevens, A.W., Richmond, B.M., 2010. The limit of inundation of the September 29, 2009, tsunami on Tutuila, American Samoa. U.S. Geological Survey Open-File Report 2010-1018, 27pp.
Kumar, S.P., Sruthi, U., Krishna, N., Lakshmi, K.J.P., Menon, R., Amitabh, B., Krishna, B.G., Kring, D.A., Head, W.J., Goswami, J.N., Kiran Kumar, A.S., 2016. Recent shallow moonquake and impact-triggered boulder falls on the Moon: New insights from the Schrödinger basin. Journal Geophysical Research (planets), 121(2), 147-179. DOI: 10.1002/2015JE004850
Lander, J.F., Whiteside, L.S., Lockridge, P.A., 2003. Two decades of global tsunamis 1982-2002. Science of Tsunami Hazards, 21, 3-88.
Lario, J., Luque, L., Zazo, C., Goy, J.L., Spencer, C., Cabero, A., Bardají, T., Borja, F., Dabrio, C.J., Civis, J., González-Delgado, J.A., Borja, C., Alonso-Azcárate, J., 2010. Tsunami vs. Storm surge deposits: a review of the sedimentological and
geomorphological records of extreme wave events (EWE) during the Holocene in the Gulf of Cádiz, Spain. Zeitschrift für Geomorphologie, 54 (3, Supplement), 301-316.
Lario, J., Zazo, C., Goy, J.L., 2011a. Sedimentary and tectonic features of the 2010 Chile earthquake and tsunami. In: IGCP 588-Quaternary coastal change and records of extreme marine inundation on coastal environments. Bangkok, Thailand, Earth Observatory of Singapore, 8-9.
Lario, J., Zazo, C., Goy, J.L., Silva, P.G., Bardají, T., Cabero, A., Dabrio, C.J., 2011b. Holocene paleotsunami catalogue of SW Iberia. Quaternary International, 242, 196-200.
Lavigne, F., Paris, R., Grancher, D., Wassmer, P., Brunstein, D., Vautier, F., Leone F., Flohic, F., De Coster, B., Gunawan, T., Gomez, C., Setiawan, A., Cahyadi, R., Fachrizal, 2009. Reconstruction of tsunami inland propagation on December 26, 2004 in Banda Aceh, Indonesia, through field investigations. Pure and Applied Geophysics, 166, 259-281.
Lekkas, E., Andreadakis, E., Kostaki, I., Kapourani, E., 2013. A Proposal for a New Integrated Tsunami Intensity Scale (ITIS-2012). Bulletin of the Seismological Society of America, 103 (2B), 1493-1502.
Luque, L., Lario, J., Zazo, C., Goy, J.L., Dabrio, C.J., Borja, F., 2002. Sedimentary record of historical tsunamis in the Bay of Cádiz (Spain). Journal of Quaternary Science, 17, 623-631.
Martínez Solares, J.M., 2001. Los efectos en España del terremoto de Lisboa (1 de noviembre de 1755). Dirección General del Instituto Geográfico Nacional, Ministerio de Fomento, 756pp.
Medvedev, S., Sponheuer, W., Karník, V., 1964. Neue seismische Skala Intensity scale of earthquakes, 7. Tagung der Europäischen Seismologischen Kommission vom 24.9. Deutsche Akademie der Wissenschaften zu Berlin, 77, 69-76.
Michetti, A.M., Esposito, E., Guerrieri, L., Porfido, S., Serva, L., Tatevossian, R., Vittori, E., Audemard, F., Azuma, T., Clague, J., Comerci, V., Gurpinar, A., McCalpin, J., Mohammadioun, B., Morner, N.A., Ota, Y., Roghozin, E., 2007. Intensity Scale ESI 2007. In: Guerrieri, L., Vittori, E. (eds.). Memorie Descrittive Carta Geologica d’Italia, 74, Servizio Geologico d’Italia – Dipartimento Difesa del Suolo, APAT, Roma, 53pp.
Moore, A., Goff, J., McAdoo, B., Fritz, H., Gusman, A., Kalligeris, N., Kalsum, K., Susanto, A., Suteja, D., Synolakis, C., 2011. Sedimentary deposits from the 17 July 2006 Western Java tsunami, Indonesia-use of grain size analyses to assess tsunami flow depth, speed, and traction carpet characteristics. Pure and Applied Geophysics, 168, 1951-1961.
Mori, N., Takahashi, T., Yasuda, T., Yanagisawa, H., 2011. Survey of 2011 Tohoku earthquake tsunami inundation and run-up. Geophysical Research Letters, 38, L00G14.
Morton, R.A., Buckley, M.L., Gelfenbaum, G., Richmond, B.M., Cecioni, A., Artal, O., Hoffmann, C., Perez, F., 2010. Geological Impacts and Sedimentary Record of the February 27, 2010, Chile Tsunami: La Trinchera to Concepcion. U.S. Geological Survey Open-File Report 2010-1116, 22pp.
Morton, R.A., Gelfenbaum, G., Buckley, M.L., Richmond, B.M., 2011. Geological effects and implications of the 2010 tsunami along the central coast of Chile. Sedimentary Geology, 242, 34-51.
G e o l o g i c a A c t a , 1 4 ( 2 ) , 1 7 9 - 1 9 3 ( 2 0 1 6 )D O I : 1 0 . 1 3 4 4 / G e o l o g i c a A c t a 2 0 1 6 . 1 4 . 2 . 6
J . L a r i o e t a l . Tsunami Environmental Effects (TEE-16) Scale
193
Murty, T.S., Loomis, H.G., 1980. A new objective tsunami magnitude scale. Marine Geodesy, 4, 267-282.
Nakamura, Y., Nishimura, Y., Putra, P.S., 2012. Local variation of inundation, sedimentary characteristics, and mineral assemblages of the 2011 Tohoku-oki tsunami on the Misawa coast, Aomori, Japan. Sedimentary Geology, 282, 216-227.
Okal, E.A., Fritz, H.M, Synolakis, C., Borrero, J., Weiss, R., Lynett, P.J., Titov, V.V., Foteinis, S., Jaffe, B.E., Liu, P., Chan, I., 2010. Field Survey of the Samoa Tsunami of 29 September 2009. Seismological Research Letters, 81, 577-591.
Ontowirio, B., Paris, R., Mano, A., 2013. Modelling of coastal erosion and sediment deposition during the 2004 Indian Ocean tsunami in Lhok Nga, Sumatra, Indonesia. Natural Hazards, 65, 1967-1979.
Papadopoulos, G., Imamura, F., 2001. A proposal for a new tsunami intensity scale. International Tsunami Symposium (ITS) 2001 Proceedings, Session 5, Number 5-1, 569-577.
Papathanassiou, G., Kopsachilis, V., 2013. Earthquake Geosurvey, an application for reporting earthquake-induced environmental effects. In: Grützner, C., Rudersdorf, A., Pérez-López, R., Reicherter, K. (eds.). Seismic Hazard, Critical Facilities and Slow Active Faults, 193-196.
Paris, R., Lavigne, F., Wassmer, P., Sartohadi, J., 2007. Coastal sedimentation associated with the December 26, 2004 tsunami in Lhok Nga, west Banda Aceh (Sumatra, Indonesia). Marine Geology, 238, 93-106.
Putra, P.S., Nishimura, Y., Yulianto, E., 2013. Sedimentary Features of Tsunami Deposits in Carbonate-Dominated Beach Environments: A Case Study from the 25 October 2010 Mentawai Tsunami. Pure and Applied Geophysics, 170, 1583-1600.
Richmond, B., Szczuciński, W., Goto, K., Sugawara, D., Witter, R.C., Tappin, D.R., Jaffe, B., Fujino, S., Nishimura, Y., Chagué-Goff, C., Goff, J., 2012. Erosion, deposition, and landscape change on the Sendai coastal plain, Japan resulting from the March 11, 2011 Tōhoku-oki tsunami. Sedimentary Geology, 282, 27-39.
Satake, K., Nishimura, Y., Putra, P.S., Gusman, A.R., Sunendar, H., Fujii, Y., Tanioka, Y., Latief, H., Yulianto, E., 2012. Tsunami source of the 2010 Mentawai, Indonesia earthquake inferred from tsunami field survey and waveform modelling. Pure and Applied Geophysics, 170, 1567-1582.
Shuto, N., 1993. Tsunami mantle magnitude and disasters. In: Tinti, S. (ed.). Tsunamis in the World. Kluwer, Dordrecht, 197-216.
Sieberg, A., 1930. Geologie der Erdbeben. Handbuch der Geophysik, 2(4), 552-555.
Silva, P.G., Pérez-López, R., Ródriguez-Pascua, M.A., Giner, J.L., Huerta, P., Bardají, T., Martín-González, F., 2013. Earthquake Environmental Effects (EEEs) triggered by the 2011 Lorca earthquake (Mw 5.2, Betic Cordillera, SE Spain): Application of the ESI-07 Macroseismic Scale. In: Grützner, C., Rudersdorf, A., Pérez-López, R., Reicherter, K. (eds.). Seismic Hazard, Critical Facilities and Slow Active Faults, 237-240.
Silva, P.G., Guerrieri, L., Michetti, A.M., 2015a. Intensity scale ESI 2007 for assessing earthquake intensities. In: Beer, , M, Kougioumtzoglou, I.A., Patelli, E., Siu-Kui Au, I.. (eds.). Springer Encyclopaedia of Earthquake Engineering. Berlin (Germany), Springer-Verlag, 1-20.
Silva, P.G., Bardají, T., Roquero, E., Martínez-Graña, A., Perucha, M.A., Huerta, P., Lario, J., Giner-Robles, J.L., Rodríguez-Pascua, M.A., Pérez-López, R., Cabero, A., Goy, J.L., Zazo, C., 2015b. Seismic palaeogeography of coastal zones in the Iberian Peninsula: Understanding ancient and historic earthquakes in Spain. Cuaternario y Geomorfología, 29, 31-56.
Soloviev, S.L., 1970. Recurrence of tsunamis in the Pacific. In: Adams, W.M. (ed.). Tsunamis in the Pacific Ocean. Honolulu (Hawaii), East-West Center Press, 149-163.
Tappin, D.R., Evans, H.M., Jordan, C.J., Richmond, B., Sugawara, D., Goto, K., 2012. Coastal changes in the Sendai area from the impact of the 2011 Tōhoku-oki tsunami: interpretations of time series satellite images and helicopter-borne video footage. Sedimentary Geology, 282, 151-174.
United States Geological Survey (USGS), 2015. Shake Maps: Earthquakes Hazards Program. Last accessed: October 01, 2015. Web site: http://earthquake.usgs.gov/earthquakes/shakemap/
Wood, H.O., Neumann, F., 1931. Modified Mercalli intensity scale of 1931. Bulletin of the Seismological Society of America, 21, 277-283.
Manuscript received October 2015;revision accepted February 2016;published Online May 2016.