Embed Size (px)
Citation preview

Improving the employer brand image of Company X amongst students in
Finland
Rebecca Boyko
Bachelor’s Thesis
Degree Program in International
Business
2014

Abstract April 14, 2014 International Business
Author Rebecca Boyko
Year of entry 2011
Title of report Improving the employer brand image of Company X amongst students in Finland
Number of report and attachment pages 87 + 7
Teachers and supervisors Elizabeth San Miguel, Anita Pösö, Jutta Heikkilä
The following report was a research-oriented thesis commissioned by a case company, whose name will not be revealed, thus referred to as Company X. The aim of this thesis was to provide Company X with improvement suggestions on how it could enhance its employer brand image among students in Finland. In order to do so, the company’s current employer brand practices were examined and the em-ployer brand image of Company X was analyzed amongst students in Finland. The concept of employer branding was studied through its various components such as employee value proposition (EVP), employment experience and employer brand image. Because employer branding is a fairly new area of study, there is a limited amount of theoretical information and models. Therefore, several high quality theories and models were analyzed and combined with personal insight to create a tailor-made model for the case company, which served as a backbone to the student survey frame-work. The research design included a qualitative management workshop with the case com-pany and a quantitative survey for business students in Finland. The thesis had an in-ternational perspective analyzing the case company’s employer brand practices in the Nordic countries. Through the research, it was found that Company X’s employer brand practices were at the early stages of development and thus its employer brand had not been actively communicated externally. The student survey revealed that many students were already familiar with Company X as an employer, and most would consider it as their future employer. Nevertheless, students’ employer knowledge was lacking and only a few re-spondents had applied to Company X before. Therefore, the main improvement sug-gestion for Company X to enhance its employer brand image amongst students in Fin-land was to increase communication between students and the firm. The proposed key findings and improvement suggestions confirmed to be beneficial and useful for the case company. Keywords Employer branding, Employer brand image, Employee value proposition (EVP), Em-ployment experience, Employee expectations, Generation Y

Dedicated to my beloved father, Aku Petteri Pöysti.

Table of contents
1 Introduction ............................................................................................................................ 4
1.1 Topic background ......................................................................................................... 4
1.2 Case company ................................................................................................................ 5
1.3 Research question ......................................................................................................... 5
1.4 Key concepts ................................................................................................................. 8
1.5 Structure of report ........................................................................................................ 9
2 Employer branding .............................................................................................................. 10
2.1 Employer branding as a concept .............................................................................. 11
2.2 Employee value proposition and employment experience ................................... 11
2.2.1 Employee value proposition ......................................................................... 12
2.2.2 Employment experience ................................................................................ 15
2.3 Employer brand strength ........................................................................................... 18
2.3.1 Brand fundamentals ........................................................................................ 18
2.3.2 Employer attractiveness ................................................................................. 21
2.3.3 Employee engagement ................................................................................... 24
2.4 Employer brand image ............................................................................................... 27
2.5 Employer branding for Generation Y ..................................................................... 31
2.5.1 Communication for Generation Y ............................................................... 32
2.5.2 Students’ employee expectations, Universum report ................................ 33
2.6 Tailor-made model for case company ..................................................................... 35
3 Research methods ................................................................................................................ 39
3.1 Research design ........................................................................................................... 39
3.2 Research methods and data collection ..................................................................... 40
3.3 Data collection framework descriptions .................................................................. 45
3.4 Validity and reliability ................................................................................................. 47
4 Results .................................................................................................................................... 49
4.1 Qualitative management workshop on current employer branding practices ... 49
4.1.1 Employer branding ......................................................................................... 49
4.1.2 Employee value proposition and employment experience ....................... 50
4.1.3 Employer attractiveness ................................................................................. 52

4.1.4 Employer brand image ................................................................................... 53
4.1.5 Employer branding to business students .................................................... 55
4.2 Quantitative student survey on the employer brand image of Company X ...... 56
4.2.1 Demographics .................................................................................................. 57
4.2.2 Awareness ......................................................................................................... 61
4.2.3 Attractiveness .................................................................................................. 63
4.2.4 Reputation ........................................................................................................ 72
5 Conclusion ............................................................................................................................ 75
5.1 Key findings ................................................................................................................. 75
5.1.1 Qualitative management workshop .............................................................. 75
5.1.2 Quantitative student survey ........................................................................... 76
5.2 Improvement suggestions .......................................................................................... 77
5.2.1 Qualitative management workshop .............................................................. 77
5.2.2 Quantitative student survey ........................................................................... 78
5.3 Credibility of research findings ................................................................................. 79
5.3.1 Qualitative management workshop .............................................................. 79
5.3.2 Quantitative student survey ........................................................................... 79
5.4 Suggestions for further research ............................................................................... 80
5.5 Feedback and personal learning ................................................................................ 81
5.5.1 Feedback ........................................................................................................... 81
5.5.2 Personal learning ............................................................................................. 83
References .................................................................................................................................. 85
Attachments ............................................................................................................................... 88
Attachment 1. Workshop interview framework with Company X .............................. 88
Attachment 2. Company X’s external employer brand image questionnaire ............. 90
Attachment 3. Spearman’s correlation coefficient .......................................................... 94

4
1 Introduction
This chapter will provide the reader with an in-depth introduction to the thesis topic
and the research problem setting. In addition, the case company will be briefly present-
ed. Moreover, key concepts will be defined and the structure of the report will be ex-
plained.
1.1 Topic background
The term branding often provokes thinking only about product or service brands. How-
ever, according to Moroko and Uncles (2012), in recent years employers have begun to
brand themselves as well. In today’s global market, tough economic situation, and
growing competition it has become extremely important for companies to create an
employer brand which will differentiate them from others. Thus for many companies,
employer branding has become a critical management tool. Employer branding is a
fairly new concept, first defined by Ambler and Barrow (1996, 4) in the December edi-
tion of the Journal of Brand Management in 1996, and therefore only a few academic
books, articles, and other materials can be found within this new area of study.
This thesis is commissioned by a case company located in Helsinki, Finland. However,
due to the company’s wishes, the company name will not be revealed. The main reason
for this research is the case company’s interest in understanding the employer brand
image that students in Finland have of them.
The concept of employer branding will be studied through its various components,
such as employee value proposition (EVP), employment experience, employer brand
image, and others. The aim of the research is to analyze the employer brand image of
the case company, understand the company’s employer brand practices and be able to
provide beneficial recommendations. The research design includes a quantitative sur-
vey and a qualitative company workshop. The research will also include an internation-
al business perspective by analyzing the current employee expectations of students in
the Scandinavia countries, namely: Finland, Sweden, Norway, and Denmark.

5
1.2 Case company
By the request of the commissioning company, the name of the company will not be
revealed. Therefore in this thesis, the case company will be referred to as Company X.
In addition, no information will be provided which could pinpoint the company, such
as industry of operation, company size, net sales, and the like.
Company X is part of a large international firm selling its products in most countries of
the world. Its operations are regionalized with the Nordic countries comprising one
region. This is the region that commissioned the writing of this thesis and so will be
the focus of this thesis. Company X employs between 100 and 200 personnel at its
headquarters located in the Helsinki metropolitan area, Finland. (Company X Annual
Report 2012, 2.)
This thesis mainly benefits the Human Resources (HR) department of Company X.
The HR department for the Nordic region is located in the headquarters and is lead by
the HR manager, along with three subordinates. For additional support, Company X
has four administrative personnel located in other countries in the Nordic region. The
contact person for this thesis was the HR Manager and HR Development Specialist.
As requested by the commissioning company, more detailed information cannot be
provided at this point.
1.3 Research question
The aim of the research is to analyze the current employer brand image of Company
X, understand the case company’s employer brand practices, and give improvement
suggestions to Company X’s HR department. The research question and investigative
questions are presented below:
Research question: How could the external employer brand image of Company X be
improved amongst business students in Finland?
Investigative question 1: How is Company X currently promoting its employer brand?
6
The purpose of this investigative question is to gain an understanding of the current
employer branding practices in the Nordic countries through conducting a qualitative
workshop with the case company. This investigative question will answer questions
such as:
- What kind of an employer brand is Company X currently attempting to build in
the Nordic countries?
- What employee value proposition (EVP) does Company X have in place or is
attempting to build?
Investigative question 2: What is the current employer brand image of Company X
amongst business students in Finland?
This investigative question will be answered by conducting a quantitative survey at a
job convention, responded to by students in Finland. This investigative question will
answer questions such as:
- How familiar are students of Company X as an employer in Finland?
- What kind of perception do students currently have of Company X as an em-
ployer in Finland?
Investigative question 3: What improvement suggestions can be given to Company X?
Improvement suggestions will be created based on theory and key research findings in
order to enhance the case company’s employer brand image amongst students.

7
Table 1. Overlay matrix
Investigative Questions Theoretical Framework Chapters
Method Results Chapters
How is Company X currently promot-ing its employer brand?
2.1, 2.2, 2.3 Qualitative Work-shop with Company X. Focus: Nordic countries
4.1, 5.1.1
What is the current employer brand image of Company X amongst busi-ness students in Finland?
2.1, 2.2, 2.3, 2.4, 2.5 Quantitative Survey. Focus: Students in Finland
4.2, 5.1.2
What improvement suggestions can be given to Company X?
2.1, 2.2, 2.3, 2.4, 2.5 5.2
Demarcation
This thesis is based on a HRM topic of employer branding. A company’s product or
service brand may often be mistakenly interpreted as their employer brand. In fact,
Moroko and Uncles (2012) argue that marketing and employer brands have similar
principles, but are two different concepts. For this purpose, the thesis revolves only
around the employer brand, and not the marketing brand.
This thesis is commissioned so the employer brand image will be researched based on-
ly on the case company. Of interest to the case company is the employer brand per-
ceived by business students. Due to the case company’s field of work and interest, stu-
dents are further limited to include business students from traditional universities. Fur-
thermore, the employer brand image focuses on the external aspect only, demarcating
out the internal employer brand image of the case company. As Company X operates in
the Nordic countries, it did not bring added value to include cultural aspects in the the-
sis, and have therefore been left out.
This thesis research is limited to the aforementioned research and investigative ques-
tions. The purpose of this thesis is to give valuable improvement suggestions for the
case company, but not actually implementing the suggestions. In addition, this thesis
does not cover theory on how to build an employer brand, but on how to improve the

8
employer brand image, and thus only focuses on components of employer brand that
affect the employer brand image.
Benefits
This thesis will have several benefits to the case company. The research findings will
provide valuable information on the current employer brand image that business stu-
dents in Finland have of the case company. Based on the improvement suggestions the
case company, especially the Human Resources Department, will be able to improve
their employer branding practices according to their needs.
Upon finishing this thesis, the desired outcome is for the case company to implement
the provided improvement suggestions. In doing so, the thesis will also benefit the
employees. By improving employer attractiveness, the employees will feel honored
working for Company X.
In addition, this research will add value to the current business knowledge in the aca-
demic world. As employer branding is a relatively new concept, this thesis will attempt
to improve the understanding of the concept.
Finally, this thesis will specifically benefit myself, the writer, in two ways. Academically,
writing the thesis will improve my researching, writing, organizing, and analytical think-
ing skills. Professionally, writing this thesis will provide experience working with em-
ployer branding, networking with the case company, and will add value to my CV and
professional portfolio.
1.4 Key concepts
The following concepts are important for the reader to know in order to understand
the theoretical chapter of this thesis.

9
Employer branding is “The package of functional, economic and psychological bene-
fits provided by employment and identified with the employing company” (Ambler &
Barrow 1996, 4).
Employer brand image is the perception of what “Individuals believe about potential
employers, and job seeker’s memories and associations regarding an organization”
(Cable & Turban 2001, 123).
Employee value proposition (EVP) “Consists of what an organization has to offer
that prospective or existing employees would value and which would help to persuade
them to join or remain with the business” (Armstrong 2009, 496).
Employment experience is how an individual employee experiences his employment
at a company through various stages during his stay at the firm (Adapted from McLeod
& Waldman 2011, 10).
Employee expectations. In this report, I define employee expectations as the tangi-
ble and intangible expectations that current and prospective employees have for em-
ployers.
1.5 Structure of report
This thesis is comprised of five chapters, and begins with Chapter 1 introducing the
thesis topic, case company, and key concepts. Chapter 2 provides the relevant theoreti-
cal framework, which includes important components of employer branding. Chapter
3 describes the research design methods used for data collection, and explains the data
collection frameworks. Chapter 4 presents the results of the research and thoroughly
analyzes the data. The final chapter provides a conclusion to this thesis. This includes
key research findings, improvement suggestions, validity and reliability of the research,
suggestions for further research, feedback from relevant parties, as well as my personal
learning. Most importantly, Chapter 5 provides a clear answer to the research question.

10
2 Employer branding
This chapter describes the main theoretical concepts of employer branding. The theo-
retical framework presented in this chapter is illustrated below.
Figure 1. Theoretical framework
Chapter 2 is organized in the following manner. This chapter begins with subchapter
2.1 explaining employer branding as a concept. Two large elements that create the em-
ployer brand strength are employee value proposition (EVP) and employment experi-
ence, which are described in Chapter 2.2. Several other factors that shape the employer
brand strength are defined in Chapter 2.3. The first three subchapters are elements that
create an employer brand image. Employer brand image is analyzed in Chapter 2.4, and
more specifically branding to Generation Y is expounded in Chapter 2.5. From the
theoretical framework, I have created a tailor made model for Company X, which is
outlined in Chapter 2.6.
Employee Value Proposition
Employment Experience
Employer Brand
Strength
=
+
+
Employer Brand Image
-‐ Employer Knowledge -‐ Source of Information
Brand Fundamentals
Attractiveness
Employee Engagement
FORMS
Employer Branding to Generation Y
Tailor-‐made model for Company X
CH. 2.2
CH. 2.3 CH. 2.4
CH. 2.5
CH. 2.6

11
2.1 Employer branding as a concept
As employer branding is not a widely studied concept, there is no unified definition;
rather a range of theorists have verifying definitions. Simon Barrow’s is one of the
most commonly used definitions: “The package of functional, economic, and psycho-
logical benefits provided by employment and identified with the employing company”
(Barrow & Mosley 2005, xvi). Rosethorn defines it as a wider “Two-way deal between
an organization and its people – the reason they choose to join and the reasons they
choose – and are permitted – to stay” (Rosethorn 2009, 49).
Even though definitions vary, most theorists agree on several main functions of em-
ployer branding. These include attracting top talent, improving retention/minimizing
turnover, improving employee engagement and increasing profitability (Barrow &
Mosley 2005, xvi; Dyhre & Parment 2009, 14; Hubschmid 2012, 46; McLeod & Wald-
man 2011, 15-16). Theorists also agree that the employer brand needs to be linked to
the corporate culture of the organization in order for the employer brand to deliver a
proper representation of the company, and therefore be successful (Hubschmid 2012,
204; McLeod & Waldman 2011, 6).
On the other hand, many theorists talk about building an employer brand while McLeod
and Waldman (2011, 20) argue that every company already has an employer brand even
if they are not aware of it. An employer brand cannot be created since it already exists;
rather an employer brand can only be effectively managed – influencing the perception,
or employer brand image and strengthening the employer brand.
As stated in Chapter 1.1, the process of effectively building an employer brand has
been demarcated. Chapter 2 will focus on aspects of employer branding that form or
affect the employer brand image.
2.2 Employee value proposition and employment experience
Two large factors that create a strong employer brand are employee value proposition
(EVP) and employment experience. As defined by Armstrong (2009, 496), employee

12
value proposition “Consists of what an organization has to offer that prospective or
existing employees would value and which would help to persuade them to join or re-
main with the business.” Employment experience is defined as “How an individual
employee experiences his or her employment at a company through various stages dur-
ing his or her stay at the firm” (Adapted from McLeod & Waldman 2011, 10).
A model by Rosethorn (2009, 49) clearly illustrates the relationship between EVP and
employment experience, and the outcomes of a strong employer brand. Rosethorn
believes that to effectively define and manage an employer brand, a company needs to
comprise two elements: EVP – the promise for the employee – and an employment
experience – the delivery of the promise in reality. It is crucial that the EVP – the ex-
ternal promise – and the internal employment experience complement one another
(Rosethorn 2009, 49; McLeod & Waldman 2011, 22).
Figure 2. The employer brand in action (Rosethorn 2009, 49)
The distinctive elements in the figure above are consecutively described; EVP in Chap-
ter 2.21, employment experience in Chapter 2.2.2 and brand strength in Chapter 2.3.
The model is often referred back to in this paper.
2.2.1 Employee value proposition
Creating an employee value proposition (EVP) is crucial in developing a company’s
employer brand; EVP acts as a unique selling proposition to attract prospective em-
ployees by explaining what is distinctive and better about the company compared to all
Employee Value Proposition
The unique and differen-‐tiating promise a busi-‐ness makes to its em-‐ployees and potential candidates.
Employee Experience
Actual delivery of the promise throughout the employee lifecycle.
Brand Strength -‐ Attraction of the right candidates -‐ Employee engagement and retention -‐ Differentiation from competitors

13
other employers. EVP is not a separate brand; therefore it needs to be linked to the
overarching brand proposition. (Rosethorn 2009, 50.)
EVP is formed of everything an employee experiences and receives during an em-
ployment relationship; from intrinsic satisfaction of work, enjoyable environment and
colleagues, compensation, leadership and the like. Nevertheless, when communicating
the EVP to the external labor market, the EVP must focus only on the main aspects
that make the company superior to others. Answering the question “Why should a tal-
ented, well-qualified, and motivated person prefer this company over all the others as
an employer?" will be helpful when defining the EVP. (Hubschmid 2012, 52.)
Since a compelling EVP can send a clear message to a company’s prospective employ-
ees, it should be regarded as one of the most important aspects that the company pos-
sesses (Hubschmid 2012, 122). Additionally, the EVP needs to connect with the com-
pany’s current employees because they personally encounter the employment experi-
ence. As mentioned before, EVP is the promise and employment experience is the
delivery of the promise.
Dyhre and Parment (2009, 68-71) suggest a tool to help identify the current EVP of
the company, called IPI Analysis (Identity – Profile – Image). This tool may be useful
in order to find discrepancies between the current EVP and the desired EVP. The IPI
analysis has 3 steps:
1. Identity – This step is to clarify the understanding of what the employees perceive
or expect the company to be, what are the shared values and other commonalities.
Quantitative surveys and focus groups are helpful research tools to identify the
strengths and unique aspects of the employer.
2. Profile – This step is more future oriented: What does the organization pursue to
be? Top management needs to be interviewed on what their view of the organiza-
tion is and how they would like employees to view the company as an employer.

14
3. Image – Image is how external target groups perceive the company as an employer.
Quantitative surveys and focus groups are an acceptable way to gather information
on a company’s image. (Dyhre & Parment 2009, 68-71.)
EVP needs to be created from the inside of the company to attract the outside market.
Rosethorn (2009, 60) suggests creating a draft of the EVP before publishing it and test-
ing the draft inside the organization to ensure that the EVP accurately describes the
reality of the company.
Developing an EVP may be challenging. Both Hubschmid and Rosethorn agree that
an organization’s EVP must be distinctive and compelling to the target audience and it
needs to capture both rational and emotional aspects (Hubschmid 2012, 122; Ro-
sethorn 2009, 59). Rosethorn (2009, 70) further argues that companies must build the
EVP with a sufficiently wide appeal in order to engage the entire workforce to the
EVP. For this to be possible, the use of sublevel EVPs is crucial. Therefore, one of the
first steps is for the employer to define its target audience. Rosethorn suggests that an
EVP can be segmented into sub-EVPs for different target groups. For example, target
groups may be recent graduates or highly experienced HR specialists; Rosethorn calls
these talent segments. (Rosethorn 2009, 59.) Only after clarifying the target talent seg-
ments can a company proceed with developing its EVP. It is not possible to attract
everyone as people have distinctive employee expectations due to differences in age,
gender, educational background, and culture. Therefore, the EVP needs to be distinc-
tive specifically according to each target segment’s expectations. (Hubschmid 2012, 52,
56.)
The EVP needs to be compelling, and therefore needs to hold a peculiar excitement to
the prospective employee. EVP has several touch points that come from the employee
lifecycle, which is described in Chapter 2.2.2. Each touch point has three dimensions:
1. The look and feel – this is about the visual elements of employer branding. The
look and feel need to match the EVP in order for it to be believable.
15
2. The tone of voice – “Its not about what you say, but how you say it”
3. Behavioral content – Only identify best practices, both internally and externally,
which are true to the EVP. (Rosethorn 2009, 82-84.)
If the EVP and employment experience are consistent with one another, the EVP will
contribute to an employer brand image that is attractive to the potential employees,
and therefore the company will be known to meet expectations (Hubschmid 2012, 52).
2.2.2 Employment experience
Theorists have various views on the employment experience. Some theorists, like Bar-
row and Mosley divide the employment experience into twelve dimensions, while oth-
ers, including McLeod and Waldman argue that the employment experience is the
overall encounter of the employee lifecycle (Barrow & Mosley 2005, 149; McLeod &
Waldman 2011, 10). To better understand the topic, both models will be analyzed.
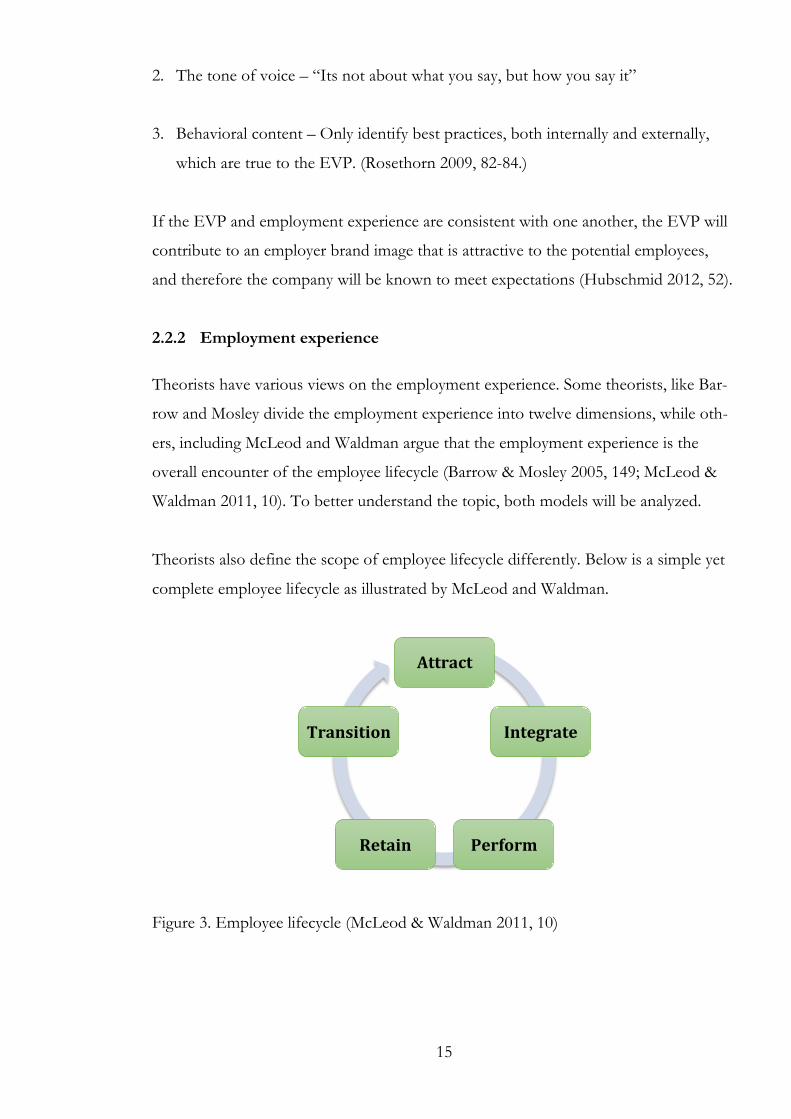
Theorists also define the scope of employee lifecycle differently. Below is a simple yet
complete employee lifecycle as illustrated by McLeod and Waldman.
Figure 3. Employee lifecycle (McLeod & Waldman 2011, 10)
Attract
Integrate
Perform Retain
Transition

16
McLeod and Waldman’s employee lifecycle consists of five phases: attract – integrate –
perform – retain – transition. Their model suggests that the employment experience
begins with an individual attracted to a company. The attract phase therefore includes
elements such as brand awareness, interview process, and recruitment. Continuing, the
integrate phase begins immediately after the person has accepted the job offer. This
phase is about induction to the company, the team, job tasks, company culture and the
like. The next phase, perform, occurs after the employee has integrated successfully to
the company and is able to contribute to the business. This phase is usually the longest
lasting phase of the employee lifecycle. This phase has elements such as engagement,
learning and development. Retain occurs when the employee is close to mastery of his
or her current job. At this stage the organization should maintain a close relationship
with the individual in order to identify what the following step may be in the individu-
al’s career. The final phase is transition, which may occur when the person transitions to
a new position, either laterally or vertically, within the organization or when he or she
moves to another company. The lifecycle starts over from the first phase, attract. How-
ever, if the move is within the company, then the cycle starts again from the integrate
phase of the employee lifecycle. (McLeod & Waldman 2011, 10-14.)
McLeod and Waldman argue that the strength of a company’s employer brand is linked
to its employees’ experiences in each of the aforementioned phases with the organiza-
tion. The employer brand is influenced through employees sharing their experiences
with their personal and professional networks, which then can reach wider audiences
providing a picture of how the company acts as an employer. (McLeod & Waldman
2011, 9, 14.)
Barrow and Mosley, on the other hand, provide a much more detailed employee expe-
rience model with twelve dimensions, which are divided into organizational and local
contexts. Barrow and Mosley’s model does not categorize the twelve employment ex-
perience dimensions into an employee lifecycle, but rather as equally important aspects
affecting the employer brand.

17
Figure 4. The employer brand mix (Barrow & Mosley 2005, 150)
Barrow and Mosley (2005, 162) suggest that the employer brand mix “Refers to the
wide range of constituent elements that shape people’s employment experience.” This
experience is composed of elements such as recruitment and induction, team manage-
ment, performance appraisal, reward and recognition, values and corporate social re-
sponsibility (CSR) of the company, internal communication and the like. An employee
encounters the aforementioned elements throughout the employee lifecycle.
These two models are different yet present the same message. Although Barrow and
Mosley do not include attraction and transition as a part of the employment experience,
they do include induction (integrate) learning and development (perform), different ele-
ments of retaining such as working environment and rewards and recognition. Whereas
McLeod and Waldman simply describe the stages from start to finish – from the first
contact the person has with the company to the employee leaving the company – Bar-
Employer Brand
ProposiTon
Recruitment and
InducTon Team
Management
Performance Appraisal
Learning and Development
Reward and RecogniTon
Working Environment
Service Support
Internal Measure-‐ment
Systems
Values and CSR
Senior Leadership
Internal Communi-‐caTon

18
row and Mosley focus on the employment experience only during the employees’ stay
at the firm.
2.3 Employer brand strength
Strong employer brand is the outcome of a functioning and congruent employee value
proposition (EVP) and employment experience, as shown in Figure 2. To further
strengthen the employer brand, and to properly utilize the EVP and the employment
experience, several other factors require analysis. In this chapter, elements of employer
brand strength such as the brand fundamentals, employer attractiveness, and employee
engagement will be analyzed.
2.3.1 Brand fundamentals
Many theorists discuss the importance of positioning, segmenting, and differentiating a
company’s employer brand. Barrow and Mosley call these three elements the brand
fundamentals (Barrow & Mosley 2005, 61).
Positioning
According to IE Business School (2012), brand positioning is derived through the con-
cepts of segmentation and differentiation. Segmentation answers to whom the product
of service is being positioned, while differentiation answers what is being sold and
what value proposition does the new product or service offer. Through these two con-
cepts, the brand positioning is created. Barrow and Mosley tie marketing tools to build-
ing an employer brand. Like customers, employees also have distinctly different needs
and aspirations; therefore the employer brand proposition needs to be correctly posi-
tioned to be motivating for the current and prospective employees. (Barrow & Mosley
2005, 61.)

19
Segmentation
In employer branding, segmentation refers to the most significant way of dividing em-
ployees into groups who can be catered to according to their needs (Barrow & Mosley
2005, 100). Rosethorn (2009, 59) calls these groups talent segments. Uncles and Moro-
ko (2012) argue that instead of treating all employees the same, it is more profitable to
treat specific groups of potential and current employees differently through segmenta-
tion. In addition, employers who use segmentation to clearly identify whom they need
to attract and how they need to attract candidates will have an advantage in the war for
talent.1
Uncles and Moroko (2012) suggest several segmentation approaches to attract and re-
tain the intended employees, which transform employer branding from a recruitment
expense to a strategic driver for profit.
1. Potential profitability: Identifying employee groups who have skills, experience or
knowledge that are critical to the business and devoting more resources toward
hiring and retaining those employees.
2. Product-feature preference: Employees have different psychographics and thus
they value different career benefits such as training and development versus travel
opportunities, flexible working hours versus on-site childcare. (Uncles and Moroko
2012.)
After an employer uses the profitability segmentation approach, it can use product-
feature segmentation to more thoroughly understand the benefits those employee
groups prefer. When an employer is clear about their target segments it becomes easier
to conduct research on the segments’ needs and aspirations, their awareness of the or-
1 War for Talent refers to McKinsey’s 1997 study that reveals the rise in competitiveness for companies to attract and retain talented employees.

20
ganization and it becomes easier to monitor success in attracting the best recruits. (Bar-
row & Mosley 2005, 105.)
In addition to the above, Barrow and Mosley (2005, 101) argue that the “Most useful
form of segmentation is to cluster employees according to the level and primary focus
of their engagement.” TNS (2004, in Barrow & Mosley 2005, 101-102) conducted a
commitment survey in 2002 and 2004 where they found four main segments in em-
ployees’ commitments.
1. Ambassadors (41 %): employees that are fully committed to their career and com-
pany. Usually these individuals are high performers and mid to upper managers.
2. Career oriented (25 %): employees who are more dedicated to their personal ca-
reers than to their company. These persons also tend to be top performers, but in
addition they constantly seek for training, development, and promotion.
3. Company oriented (8 %): Employees whose commitment to the company is great-
er than their interest in their personal careers. Employees in this category tend to
have solid skillsets but with limited talent.
4. Ambivalent (31 %): employees who are not committed to their company or career.
These individuals most often lack talent and skills.
Differentiation
After the segmentation is conducted, differentiation is used to reach the target pro-
spective employees via the value proposition and the characteristics of the product or
service itself. Barrow and Mosley (2005, 63) suggest companies to ask “What can the
organization offer its potential candidates and current employees that make it better or
different from the other alternatives open to them?” As reviewed in Chapter 2.2.1, the
EVP is a company’s main differentiator from its competitors. Differentiation is vital
and often the most difficult task in strengthening the employer brand. Furthermore, a

21
company should differentiate itself to the extent of being perceived as the employer of
choice (Hubschmid 2012, 54). Employer of choice is discussed in the following chap-
ter.
2.3.2 Employer attractiveness
This chapter contains two dimensions to it: attraction of candidates – attracting pro-
spective employees – and employer attractiveness – how the prospective employees
perceive the employer. A company needs to be attractive in order to attract candidates.
Employee value proposition (EVP) is a valuable tool for attracting candidates, while
employer attractiveness is linked to employer brand image.
One of the main purposes of creating a strong employer brand is to attract and recruit
the right potentials (Barrow & Mosley 2005, xvi; Hubschmid 2012, 46; McLeod &
Waldman 2011, 16). In order to do so, the company must ensure that it is in fact at-
tractive to the right people (Hubschmid 2012, 46). Most theorists agree that attraction
of candidates, especially the right candidates for a company, is an essential part of cre-
ating a strong employer brand. As shown in Figure 2, a strong EVP and employment
experience contribute to attracting the right candidates, thus the process is all inter-
linked. In order to attract candidates, the employer must work to become attractive.
Berthon, Ewing and Hah (2005, 156) define employer attractiveness as “The envi-
sioned benefits that a potential employee sees in working for a specific organization.”
Both Hubschmid (2012, 56) and Dyhre and Parment (2009, 86) agree that employer
branding will have little impact unless an attractive workplace can be offered. Given
this, the first step is to understand characteristics of an attractive employer. Further, it
is important to comprehend employee expectations; what desired prospective employ-
ees value and what job attributes they consider to be most important. One of the case
company’s target groups is business students, the employee expectations of this group
are reported in Chapter 2.5.2.

22
Attractive employer characteristics
Dyhre and Parment (2009, 87-88) suggest some of the most common attractive em-
ployer characteristics:
- Quality of working relationships: trust, respect, self-worth, and recognition
- Leadership: good team leaders and managers
- Participation: able to contribute to decision-making and day-to-day business
- Clear values: employees understand the company’s competitive advantage
- Learning and feedback: personal development and regular feedback
- Meaning and fun: there is a purpose to work, which makes it enjoyable
In addition to the intangible characteristics stated above, one tangible characteristic is
exceptionally important: location. Location is key in attracting top talent. Previous re-
search shows that organizational characteristics such as location, size, industry, and
culture often are used as pre-screens by job seekers before any specific job is even con-
sidered (Cable & Turban 2001, 119). Talented people usually have higher salaries, and
therefore live in more expensive housing areas that are often located near attractive
working areas. Location is appealing to people’s emotions, and has an effect on emo-
tional well-being. A great location is characterized by having areas with great views,
nice recreational areas, various restaurants and shops, and has easy access with a variety
of transport modes. (Dyhre and Parment 2009, 96.)
However, the aforementioned characteristics are not targeted to a specific audience,
and therefore can be misleading. Hubschmid argues that people define attractiveness
diversely due to their differences in age, gender, educational background and cultural
characteristics. Thus, having general attractive employer characteristics will not always
be accurate, making it exceedingly important to know the target segments’ employee
expectations. (Hubschmid 2012, 56.)
Employer attractiveness and EVP are strongly intertwined. To become an attractive
employer in the eyes of a specific group, an organization needs to create an EVP that is

23
appealing and captivating according to that group’s expectations. If the EVP has been
created effectively, it will act as a tool for attracting the right candidates within that
specific group.
Employer of Choice
Several theorists argue that it is not enough to be an attractive employer; rather an or-
ganization needs to become an employer of choice (EOC) for a targeted audience.
Hubschmid (2012, 53) defines EOC as when “Job seekers decide on which company
to apply to, the company is ‘top of mind’ and (their) first choice.”
Again in order to become an employer of choice, employer branding practices should
aim at matching candidates expectations with work realities (Hubschmid 2012, 111).
Furthermore, Rosethorn (2009, 54) argues that organizations should strive to become
the employer of choice for the employee of choice; as companies need to define the indi-
viduals who would be right for them and vise versa. Cable and Turban (2001, 154) add
that top of mind companies specifically for students result from sponsoring events to
targeted groups, funding scholarships and arranging speakers for classes.
Measuring attractiveness
In order to measure attractiveness, two things are needed: a model and data. Dyhre and
Parment suggest collecting data annually, which will create an attraction index measur-
ing one’s attraction development over a period of time. Attraction index does not have
to be a ranking, instead it can acts as a translator of attraction development with the set
targets of how a company desires to be perceived as an employer. (Dyhre & Parment
2009, 81.) The attraction index is a good tool to compare outcomes from internal em-
ployee surveys to search for discrepancies between the EVP and employment experi-
ence (Dyhre & Parment 2009, 66). The organization’s attractiveness may also be meas-
ured from its previous recruits. If the company has recently recruited individuals from
other attractive employers, it can be deducted that it is also an attractive employer (Dy-
hre & Parment 2009, 99). Dyhre and Parment (2009, 61) further suggest analyzing re-

24
cruitments over the past two years and searching for common denominators, such as
from what schools, target groups, and industries have the applicants and best recruits
stemmed from. This will also give insight into a company’s employer brand strength in
real numbers.
It may be beneficial for an organization to not only measure its own attractiveness, but
benchmark its competitors as well. One benefit may include the company being aware
of which organizations are aiming to recruit persons from similar target groups and are
therefore competing for the same candidates (Dyhre & Parment 2009, 64).
2.3.3 Employee engagement
After a company has attracted an employee to come work for it, it is in the company’s
best interest to retain the employee. For this, the company needs to engage its work-
force. Barrow and Mosley (2005, 104) emphasize that it is important to understand that
factors that attract potential employees are not necessarily the same factors that drive
engagement, motivation, and retention.
Engage for Success (2013) defines employee engagement as “A workplace approach
designed to ensure that employees are committed to their organization’s goals and val-
ues, motivated to contribute to organizational success, and are able at the same time to
enhance their own sense of well-being.” According to Wyatt (2011, in McLeod &
Waldman 2011, 15) research has proven that a company with an engaged workforce
outperforms a company with a disengaged workforce.
Gathered from several sources, the main factors that drive employee engagement are:
- Opportunities for development (Barrow & Mosley 2005, 88; McLeod & Wald-
man 2011, 12; Rosethorn 2009, 69)
- Supporting company vision and business strategy (Barrow & Mosley 2005, 88;
Rosethorn 2009, 69)
- Belief in the job and company’s products/services (Barrow & Mosley 2005, 88;
Rosethorn 2009, 69)

25
- Contributing to organizational success (Barrow & Mosley 2005, 88; Rosethorn
2009, 67)
Rosethorn provides an engagement model with four key engagement components.
These components include corporate reputation & brands, rewards & recognition, cul-
ture & environment, and opportunity, as seen in the model below. She demonstrates
the importance and balance of all four topics in order to have proper employee en-
gagement. For example, if a firm is socially responsible, provides competitive financial
rewards, and offers personal development for employees, yet has a tough social envi-
ronment, then an employee may be unable to fully be engaged. Nevertheless, this does
not apply to all employees since people are diverse and value things differently. Ro-
sethorn also suggests that there is a positive correlation between understanding how an
employee’s day-to-day job contributes to the business strategy and increased employee
engagement. (Rosethorn 2009, 68.)
Figure 5. Key components of employee engagement (Rosethorn 2009, 69)
Corporate ReputaTon & Brands CSR Corporate Purpose Corporate Performance Product/Service Quality Brand AssociaTon
Culture & Environment
Corporate & Cultural Values CommunicaTon
Physical & SocialEnvironment Variety/Nature of Work
Process & Tools Leadership
Rewards & RecogniTon Financial Rewards Security Other Rewards/Benefits RecogniTon
Opportunity
ContribuTon & Influence Work with high caliber colleagues Personal Development & Training
Career Progression
Engagement

26
Employee engagement is a two-way street between the employee and the employer. In
order for both parties to be engaged with each other, the right balance needs to be
found. Rosethorn suggests the balance components in her Brand Balance model, illus-
trated below.
Figure 6. The brand balance model (Rosethorn 2009, 71)
This model suggests that in order to attract, engage, and retain employees, both parties
– the company and employee – need to offer something in return. The company offers
the employee its unique selling point, its employee value proposition (EVP), explaining
what the employee can expect from the company. In return, the employee offers his or
her experience, skillset, attitude, and time to the company. Both parities have some-
thing to offer, and both parties need to be willing to pay; the company pays to attract,
engage, and retain the people it desires while the employee pays with his or her time
and contributions to success. (Rosethorn 2009, 71-72.)
Corporate reputation & Brands
Reward & Recognition
Opportunity
Culture
Attitude
Experience
Skills
Time
What the Employee offers
What the Employer offers

27
It is important to note that the engagement drivers and the balance will need to be re-
negotiated from time to time as companies grow and employees join and leave. Every
time a new employee joins the company, some aspects of engagement are negotiated;
for example salary and benefits. (Rosethorn 2009, 84.)
2.4 Employer brand image
Employer branding is a rather fresh topic, and employer brand image even more so,
therefore only a few valuable sources have touched upon this concept. McLeod &
Waldman (2011, 4) describe employer brand as “The perception of an organization as
a great place to work in the eye of the current employees, prospective employees and
people external to the organization,” which to my understanding could be the defini-
tion of employer brand image. No concrete definition of employer brand image has yet
been devised, however some theorists describe it as “The perception of a company as
an employer” (Hubschmid 2012, 53). The perception is created by an individual’s em-
ployer knowledge, described in this chapter.
Cable and Turban (2001, 117) use the term employer knowledge and are one of the few
theorists that have worked with this subject. Therefore, this subchapter is mostly com-
prised of Cable and Turban’s views of employer brand image. Cable and Turban (2001,
117 & 123) define employer knowledge (employer brand image) as “What individuals
believe about potential employers, and job seeker’s memories and associations regard-
ing an organization.”
Employer knowledge is important to understand because the insight that a person pos-
sesses about an employer affects:
- how the individual responds to information about the firm
- how attracted the person is to the company
- how effectively the person attempts to obtain a job with the company
- the desire of the person to build a relationship as an employee or consumer
(Cable & Turban 2001, 140.)

28
Adapted from Cable and Turban’s theoretical model of recruitment equity, below are
the main components that build up a person or job seeker’s employer knowledge.
Figure 7. Job seekers’ employer knowledge (Adapted from Cable & Turban 2001, 122)
Cable and Turban (2001, 124) propose that a job seekers’ knowledge about an employ-
er is composed of three different dimensions: employer familiarity, or awareness, em-
ployer reputation and employer image. These three dimensions act as the template that
prospective employees use to categorize, store and recall information about various
employers.
Employer familiarity
Employer familiarity, or awareness, is the first dimension because without fundamental
awareness of a company’s existence an individual cannot possess any employer
knowledge. Cable and Turban (2001, 124) define it as “The level of awareness that a
job seeker has of an organization.” There are various levels of awareness. Unawareness is
the lowest level of employer familiarity, which is a complete lack of knowledge of the
organization and the organization’s existence. Recognition is a slightly higher level where
a person is able to recognize the name of the company based on some minimal level of
exposure to the company. For example, a person might say that they have heard of
Unilever but they do not know about their area of business. The next level is recall
where a person is able to recall the company name when given a fact about the com-
pany. The highest level of awareness is top of the mind, where the specific organization is
Employer Image -‐ Employer information -‐ Job information -‐ People information
Job Seeker’s Employer Knowledge
Employer Familiarity
Employer Reputation

29
among the first ones that come into the person’s mind. (Cable & Turban 2001, 124-
125.) Based on Cable & Turban’s previous research (2001, 154), organizational charac-
teristics such as type of industry, size of the company, and firm’s corporate perfor-
mance are related to a person’s awareness of an organization.
Employer familiarity adds value to a firm in several ways: 1) familiarity acts as a node
to which additional company information is associated with 2) familiarity leads to con-
nection because people like the familiar, which will in return influence employer repu-
tation, and 3) familiarity will enhance attributes associated with a company and will
thus influence the employer brand image. (Cable & Turban 2001, 125.)
Employer reputation
As defined by Cable and Turban (2001, 127) employer reputation is the “Job seeker’s
beliefs about the public’s affective evaluation of the organization.” Employer reputa-
tion is a person’s belief of how others evaluate the organization, while employer image is
the person’s own beliefs about the firm. According to Cable and Turban, empirical re-
search has proven that employer reputations are a noticeable component of job seek-
ers’ employer knowledge. As employer reputation is built from how the person be-
lieves that others think of an organization, the individual’s opinion is often most affect-
ed by the people around them, such as family and friends. (Cable & Turban 2001, 127.)
Employer image
Cable and Turban suggest that three broad categories of employer image are important
to job seekers: employer information, job information, and people information. Em-
ployer information refers to objective aspects of a firm such as factual and historical at-
tributes, company policies, and procedures. Other information may include corporate
social responsibility and company culture and values. Job information refers to the infor-
mation about a certain position, job description, salary, and career development. People
information is about the individuals that make up the company and potential co-workers.
The existing employees of a firm send powerful information to prospective employees

30
about what it would be like to work for that company. With this information, prospec-
tive employees then decide if they would fit in the firm. (Cable & Turban 2001, 125-
127.)
Relationships between dimensions
As shown in Figure 7, the dimensions are associated with one another. Firstly, without
the basic awareness of an employer, a person cannot have employer knowledge and
cannot store the information into the template. Therefore, employer familiarity is the
foundation for employer reputation – analyzing other’s beliefs of an employer – and
employer image – creating own beliefs of an employer. Furthermore, there is a bi-
directional relationship between employer image and employer reputation. To begin,
employer image has an influence on employer reputation due to several organizational
attributes affecting how a society evaluates a firm. For example, if a job seeker believes
that a firm is ethically responsible and takes good care of its employees, then the job
seeker is also likely to believe that the company has a good reputation. Cable and Tur-
ban state that job seekers’ beliefs on industry, salary, and profitability are related to
reputation perceptions. On the other side, employer reputation also affects the em-
ployer image since a person’s view of an employer’s reputation relate to the person’s
perceptions of the organization’s attributes. (Cable & Turban 2001, 129-131.)
Attractiveness
Employer attractiveness is reviewed in Chapter 2.3.2. However, employer attractive-
ness is also associated with employer knowledge, as it is one of the more important
outcomes of employer knowledge. To state the obvious, if there is no employer aware-
ness, then the person cannot be attracted to the organization. Cable and Turban claim
that several empirical studies provide evidence that an organization’s reputation is as-
sociated with a person’s attraction to the organization, both positively and negatively.
Similarly, employer image may positively or negatively affect a person’s attraction to a
company based on the person’s fit of his/her personal values and needs compared to
the employer image. (Cable & Turban 2001, 143-144.)

31
2.5 Employer branding for Generation Y
While reading and researching employer branding, I noticed that many writers included
theory on employer branding specifically for Generation Y, many of whom are stu-
dents. An example would be the challenges and new trends of employer branding for
the younger generation. Due to the case company’s specific interest in employer brand-
ing for (business) students, I recognized the importance to include several key topics of
employer branding explicitly for Generation Y. These topics include communication
for Generation Y and students’ employer expectation in Scandinavian countries.
Generation Y is a group of individuals who are born around the same time and there-
fore, to an extent have similar external experiences during their adolescence and early
adulthood which in return construct their values, preferences, and attitudes (Hub-
schmid 2012, 13). Definitions vary on the exact years of birth that comprise Genera-
tion Y, however for clarification purposes I have chosen to use Rosethorn’s definition:
“Generation Y comprises of people born between 1977 and 1995” (Rosethorn 2009,
42).
Individuals within Generation Y tend to be very confident, team-oriented, pressured,
and achieving. Generation Y’s personal traits shape their employee expectations, some
of which include:
- Work-life balance: work in order to live a decent life
- Fun at work: work needs to be fun, and stressful tasks need to be rewarded
- Speed and innovation: the less bureaucracy, the better
- Rapid advancement opportunities: career development is top priority
- Meaningful work: work needs to have a purpose
(Dyhre & Parment 2009, 64; Hubschmid 2012, 70-76; Rosethorn 2009, 43.)
Rosethorn (2009, 43) adds that the aforementioned employee expectations are also a
part of the new rules of employee engagement for Generation Y and are critical to understand
and manage successful employer brands.

32
2.5.1 Communication for Generation Y
Communication is necessary in order to create employer knowledge; moreover specific
communication practices need to be in place for various audiences. Dyhre and Par-
ment touch up on the importance of effective communication to Generation Yers.
Due to the fact that Generation Yers have grown up with transparent and quick com-
munication, they tend to take it for granted. Therefore, the Yers expect organizations
to have smooth and transparent communication with very little policies. (Dyhre and
Parment 2009, 92.)
Based on student surveys, students prefer high level of personal contact; for example
being introduced to an employer face-to-face at an event or career fair. Students like to
hear about an employer through people already working for the company, if not direct-
ly then via videos on the company websites. Students are attracted to companies with
high level of contact, such as companies that attend events, fund scholarships and ar-
range speakers for classes. (Cable & Turban 2001, 154.)
Generation Yers are very technology oriented, and therefore company websites are
important information gathering points. Dyhre and Parment (2009, 72, 101) state that
printed media is still a popular channel, however it may be difficult to choose the right
media for the targeted audience. Cable and Turban (2001, 151) suggest that prospective
employees use websites to collect data about an organization, which in return forms
their impression of the firm and their belief of whether they will fit in the firm. There-
fore, corporate websites and recruitment sites are important to keep up to date and
target the intended audience, such as business students.
Social media is also a growing communication tool. HRM.ru carried out a study in
2011, which revealed that LinkedIn and Facebook represent the most popular online
networks for graduates when searching for information on potential employers (Hub-
schmid 2012, 79).

33
2.5.2 Students’ employee expectations, Universum report
As communicated in Chapter 2.3.2, in order to be an attractive employer a company
must know its target segment’s employee expectations. To the case company’s interest,
business students’ employee expectations are examined. Universum is a global leader in
employer branding, most known for its yearly published ‘Most Attractive Employers’
list based on student surveys around the world (Universum Global 2013). Universum
also conducts student surveys collecting information on what makes an employer at-
tractive. The case company purchased Universum’s report based on 2013 survey re-
sults. The report was tailored to the case company’s needs to include only busi-
ness/commerce students in Finland, Sweden, Norway, and Denmark. More than
15,000 students from the four aforementioned countries participated in the survey.
Due to the fact that the Universum report was purchased, the information that can be
shared is limited. I chose to discuss only the most critical aspects that shaped the quan-
titative survey explained in Chapter 3.2. This students survey is conducted by Univer-
sum, and thus is prior research. The survey measures students’ employee expectations,
the drivers that make an employer attractive, career goals, most preferred industries,
and expected salaries. Universum’s survey brings valuable information to this thesis
because it measured employee expectations from a large sample, specifically of busi-
ness students in the countries in which Company X operates. Understanding business
students’ employee expectations is key in tailoring Company X’s employee value prop-
osition (EVP) and attracting candidates in this particular talent segment.
Universum classifies its Drivers of Employer Attractiveness into four categories: employer
reputation & image, job characteristics, people & culture, and remuneration & ad-
vancement opportunities. When asked to rate the importance of the four aspects when
choosing the ideal employer, students responded rather evenly between all four catego-
ries; only employer reputation & image being slightly lower. This was true with all four
countries; employer reputation and image was voted between 19-21 % to be the top
preference, and the other three drivers were voted between 25-28 %. This shows great
similarity in students’ employee expectations in all four countries: Finland, Sweden,

34
Norway, and Denmark. Furthermore, Universum expands the four categories into
more detailed attributes.
Figure 8. The Universum Drivers of Employer Attractiveness (Universum 2013)
Within employer reputation & image, attractive/exciting products or services was ranked
number one in all four countries. For remuneration & advancement opportunities, all
four countries had good reference for future career and leadership opportunities in their top three
preference list. In addition, all countries had some sort of financial aspect in their top
three preference list; Finland and Norway had competitive base salary and Sweden and
Denmark had high future earnings. With job characteristics, the top three preferences
weren’t as clearly demarcated. Nevertheless, when looking at the top five preferences,
three aspects appear on all four countries’ lists: variety of assignments, professional training
EMPLOYER REPUTATION & IMAGE The attributes of the employer as an organiza-tion • Attractive/exciting products and services • Corporate Social Responsibility • Environmental sustainability • Ethical standards • Fast-growing/entrepreneurial • Financial strength • Innovation • Inspiring management • Market success • Prestige
PEOPLE & CULTURE The social environment and attributes of the workplace • A creative and dynamic work environment • A friendly work environment • Acceptance towards minorities • Enabling me to integrate personal interests in my
schedule • Interaction with international clients and col-
leagues • Leaders who will support my development • Recognizing performance (meritocracy) • Recruiting only the best talent • Respect for its people • Support for gender equality
JOB CHARACTERISTICS
The contents and demands of the job, including the learning opportunities provided by the job • Challenging work • Client interaction • Control over my number of working hours • Flexible working conditions • High level of responsibility • Opportunities for international travel/relocation • Professional training and development • Secure employment • Team-oriented work • Variety of assignments
REMUNERATION & ADVANCEMENT OPPORTUNITIES
The monetary compensation and other benefits, now and in the future • Clear path for advancement • Competitive benefits • Good reference for future career • High future earnings • Leadership opportunities • Overtime pay/compensation • Performance-related bonus • Rapid promotion • Sponsorship of future education

35
and development, and opportunities for international travel/relocation. People & Culture was
another driver that didn’t share the same opinions between the four countries. Still, a
creative and dynamic work environment was found on all top three preference lists, as well as
a friendly work environment was on both Finland’s and Norway’s top three preference lists.
Universum’s report did not analyze the data, but when I compared the career goals, the
four countries had similar outcomes. To have a work/life balance and be competitively or
intellectually challenged were on all top three preference lists. This confirms the theory
stated in Chapter 2.5; Generation Y is very achieving and they expect a work/life bal-
ance from employers.
2.6 Tailor-made model for case company
Employer brand image is a fairly new concept within employer branding, yet employer
branding largely contributes to employer brand image. Below is a representation of the
theoretical framework that is covered in Chapter 2.
Figure 9. Tailor-made model derived from theoretical framework
c
Employee Value Proposition
Employment Experience
Employer Brand
Strength
=
+
+
Employer Brand Image
-‐ Employer Knowledge -‐ Source of Information
Brand Fundamentals
Attractiveness
Employee Engagement
FORMS
Employer Branding to Generation Y
Tailor-‐made model for Company X
CH. 2.2
CH. 2.3 CH. 2.4
CH. 2.5
CH. 2.6

36
As seen from the figure above, Chapter 2.6 presents a tailor-made model for Company
X. All necessary theory has been covered throughout Chapter 2, and the figure shows
the relationship between different elements of employer branding. The tailor-made
model is mainly based on employer brand image components.
Due to the lack of theoretical research on employer brand image I experienced it to be
beneficial to create a tailor-made model for the case company, which would help
measure and identify the external employer brand image of Company X. The model
presented below is created using theory referenced earlier in this paper. As illustrated in
Figure 9, employer brand image is formed by other dimensions of employer branding,
such as employee value proposition (EVP), attractiveness and the like. These dimen-
sions are explained in great detail in Chapters 2.1 to 2.3. Furthermore, explicit aspects
of employer branding are addressed in Chapter 2.4 which have a clear relation to em-
ployer brand image. Thus, the tailored model below is mainly created from employer
knowledge and its three main elements outlined in Chapter 2.4: awareness, attractive-
ness, and reputation.
Figure 10. External employer brand image wheel
ABracCveness
-‐ ConsideraTon of employment in Company X -‐ CompeTtors -‐ Target groups percepTon
ReputaCon
-‐ Factual & Historical a_ributes
-‐ OrganizaTonal a_ributes
Awareness
-‐ Top of Mind -‐ Recall
-‐ RecogniTon -‐ Unawareness

37
Awareness
As explained in Chapter 2.4.1, Cable and Turban suggest that there are various stages
in awareness; complete unawareness, recognition of the name, recall of the company
and top of mind. In order to measure employer brand image, the first step is to find
out the level of awareness the target group has of the company. As Cable and Turban
state, employer familiarity or awareness is the foundation for reputation and attractive-
ness. (Cable & Turban 2001, 127-129.) Barrow and Mosley (2005, 107) suggest asking
questions as to whether the persons recognize the name of the organization, do they
have an idea of what the company does, and do they know the general size of the busi-
ness. Cable & Turban’s previous research (2001, 154), support Barrow and Mosley by
stating that organizational characteristics such as type of industry, size of the company,
and firm’s corporate performance are related to a person’s awareness of an organiza-
tion.
Attractiveness
After measuring the level of awareness, the next step is to measure the target group’s
attractiveness to the organization. Attractiveness can be calculated via the target
group’s consideration of employment for the company. Understanding the general
perception that the target group has of the company will also give insight for the com-
pany’s attractiveness. In addition, understanding the company’s competitors or the
target group’s other employer preferences can benchmark the company’s attractive-
ness. (Barrow and Mosley 2005, 107.)
Reputation
While awareness and attractiveness can be measured on an individual basis, reputation
has to be measured on a more general level of the target group’s perception of the or-
ganization. Factual and historical characteristics shape a company’s reputation. Organi-
zational attributes include subjects such as job characteristics, remuneration and ad-

38
vancement opportunities, people and culture, and employer reputation and image
(Universum 2013). Organizational attributes are a large part of a company’s reputation
as they often define the company in the public’s eye. For example, for some, Apple has
a great reputation because Apple has a creative and dynamic work environment and it
provides high-class remuneration packages. If a company has a positive reputation, it
often leads to higher attractiveness.

39
3 Research methods
This chapter explains the research design, research methods, and data collection ap-
proach. In addition, the data collection process is clarified in detail and the data collec-
tion frameworks are described. To review the research and investigative questions,
please review Chapter 1.3.
3.1 Research design
When conducting research, it is important to understand the difference between the
two most common data collection methods: the quantitative method and the qualita-
tive method. Below is a compilation of the distinctions between the two data collection
methods.
Table 2. Distinctions between quantitative and qualitative data (Saunders et al. 2012,
482)
Quantitative Data Qualitative Data
- Based on meanings derived from num-
bers
- Based on meanings expressed through
words
- Collection results in numerical and
standardized data
- Collection results in non-standardized
data requiring classification into categories
- Analysis conducted through the use of
diagrams and statistics
- Analysis conducted through the use of
conceptualization
The main contrast in the data collection methods above is that quantitative data is nu-
merical and can therefore be analyzed through diagrams and statistics whereas qualita-
tive data is expressive and analyzed through conceptualization.
This research utilized a combination of quantitative and qualitative data collection
methods. One of the advantages of combining data collection methods is the triangula-
tion concept. Triangulation is used by combining two or more data collection tech-
niques within one research project in order to make sure that the key findings com-
plement one another. (Saunders et al. 2012, 146.)

40
Presented below is an illustration of the research design, which shows the relationship
between the investigative questions.
Figure 11. Research Design
Investigative questions’ 1 & 2 focus, scope and research method is shown in the figure
above. It is important to notice that investigative question 1’s scope is international
including all Nordic countries, while question 2’s includes only business students in
Finland. The international aspect in this thesis is formed through investigative question
1: Company X’s promotion of employer branding in Nordic countries, as well as Uni-
versum’s student survey conducted in the Nordic countries.
Investigative question 3 provides improvement suggestions for Company X based on
theoretical data and results gained through investigative questions 1 & 2.
3.2 Research methods and data collection
This subchapter introduces each investigative question’s research and data collection
method in more detail.
Focus
Method
Scope
Investigative Question 1
Company X’s promotion of
Employer Branding
in Nordic countries
Primary data collection through company workshop
Investigative Question 2
Perception of Company X’s Employer Brand Image
by business students in Finland
Primary data collection through student survey
Investigative Question 3

41
Investigative question 1
A qualitative workshop was used as a data collection method because the method is
explorative, informative, and, if a need be, it allows the researcher to pursue different
questions and concepts during the workshop (DeVault 2013). When compared to the
quantitative method, the qualitative method is also more suitable for the workshop as
the collected data is based on meanings expressed through words instead of numbers.
In order to answer investigative question 1, a qualitative workshop was conducted with
the case company, in the form of a semi-structured interview. The workshop was a
face-to-face meeting with the HR Manager and the HR Development Specialist. The
HR Manager and HR Development Specialist were chosen as the participants for the
workshop due to the scope of their work, which included employer branding. One
more possible candidate was considered. However, as the candidate’s work tasks ex-
cluded employer branding, the candidate wasn’t chosen. Thus, the main selection crite-
ria for the workshop participants was having employer branding in the scope of work.
I created a qualitative interview framework as a discussion guide for the workshop. The
interview framework was based on theoretical concepts and findings from Chapter 2.
In more detail, the interview framework is described in Chapter 3.3 and the actual in-
terview framework can be found as Attachment 1.
The company workshop was conducted at the case company’s headquarters in Helsinki
metropolitan area, Finland on November 25th, 2013. The workshop aimed to collect
information regarding the case company’s current employer brand practices and ac-
tions in promoting its employer brand in the Nordic countries that it operates in, and
especially among students in Finland. Both the HR Manager and HR Development
Specialist were present at the workshop; the workshop was face-to-face and lasted
about 65 minutes, conducted by me, the author. In addition to taking notes during the
workshop, the full workshop session was recorded and transcribed afterwards. In prac-
tice, the workshop was implemented by agreeing on a set date for the workshop, for

42
which date the company reserved a meeting room. No special snacks or caterings were
offered, as there was no need due to the nature of the small, comfortable meeting.
The analysis and results of investigative question 1 are reported in Chapter 4.1 with the
key findings addressed in Chapter 5.1.1.
Investigative question 2
For investigative question 2, a quantitative survey, or a questionnaire, was created in
order to find out how students perceived Company X as an employer. A quantitative
data collection method was chosen for this particular investigative question for several
reasons. Quantitative data is analyzed through the use of diagrams and statistics and
the meaning of the data is derived from numbers (Saunders et al. 2012, 482). There-
fore, analyzing a large data sample is easier with a quantitative method, as is allows the
data to be visualized with graphs, as well as compare relationships between variables
(DeVault 2013). The survey was created based on theoretical concepts and findings as
well as Universum’s student survey. Universum is a global leader in employer branding,
most known for its yearly published ‘Most Attractive Employers’ list based on student
surveys from around the world (Universum Global 2013). Universum’s student survey
results from 2013 were specifically tailored to the case company’s needs to include only
business/commerce students in Finland, Sweden, Norway and Denmark. In more de-
tail, the interview framework is described in Chapter 3.3 and the actual interview
framework can be found as Attachment 2.
The quantitative survey for investigative question 2 was conducted at a career conven-
tion. The framework of the questionnaire was negotiated with the case company from
early September to October 8th, 2013. The case company requested the survey to be
very short due to the data collection taking place at a convention. However, I preferred
the survey to cover all the main aspects of employer brand image. Both parties came to
a mutual agreement during a meeting held at the case company’s premises on October
8th, 2013. After the survey framework was completed, I created the survey with an
online tool called Webropol. Soon after, the survey was tested by my family and friends

43
who were asked to participate and look for mistakes, misunderstandings, software
glitches, provide improvement suggestions and the time it took to complete the survey.
The survey was completed 21 times during the pilot run, and I received positive feed-
back with only a few improvements to make.
The case company participated at a job convention for students called Arena Messut
held at the Aalto University School of Business on November 13th, 2013. Per request
of the case company, the survey was conducted at the job convention. Statistically,
over 2500 students attend the job convention each year, mainly from Aalto University
School of Business. Therefore, a goal of 100-200 survey respondents seemed appropri-
ate, and was agreed on with the case company. In order to attract participants to an-
swer the survey, a small giveaway item was given to the first 100 participants. In addi-
tion, all survey respondents had the possibility to participate in a drawing; the prize
cannot be stated as it could reveal the case company. As majority of the convention
visitors usually have been business students, the population was homogenous and
therefore the survey was aimed at everyone. Due to the nature of conventions or fairs,
it was impossible to conduct probability sampling, such as simple random or other
sampling methods that would more accurately represent the population. Therefore, a
convenience sampling method was used. Convenience sampling is a non-probability
sampling method where the respondents are selected randomly on the basis that they
are easiest to access (Saunders et al. 2012, 241). Nevertheless, this sampling method
was appropriate due to the fact that majority of the students were business students,
which was the case company’s target group.
As stated, the data collection took place at Arena Messut job convention on November
13th, 2013, from 9 am until 4 pm. At the fair the case company had its own booth with
a dedicated area for the survey point. The survey point had two bar tables with three
laptops opened to the survey website, where participants were able to complete the
survey online. At the job convention, five company representatives were present, in-
cluding myself. However, only three representatives were at the stand at a time. It was
agreed on in advance, that I was in charge of the survey point, attempting to draw stu-
dents to complete the survey, and answering possible questions. The other two com-

44
pany representatives were directly in contact with the students and it was agreed on
that if a chance presented itself, the company representatives would also ask the stu-
dents to participate in the survey. Most respondents participated in the online survey,
and I was nearby if the respondents had questions. In addition, I conducted the survey
face-to-face with participants if all three laptops were already in use.
Research responsiveness was unrealistic to calculate because it was impossible for all
three company representatives to calculate every individual whom they asked to partic-
ipate in the survey, due to the large number of visitors at the convention. Nevertheless,
the outcome was very successful with 131 survey respondents, 15 of whom I inter-
viewed personally.
The results of the quantitative survey and investigative question 2 are analyzed in
Chapter 4.2, with the key findings addressed in Chapter 5.1.2.
Investigative question 3
As shown in the research design Figure 11, investigative question 3 provided im-
provement suggestions based on theoretical analysis and key research findings in order
to enhance the case company’s employer brand image. For this investigative question
no separate data collection was performed. Alternatively, the results from investigative
questions 1 and 2 provided important information in order to answer investigative
question 3. In addition to results from investigative questions 1 and 2, the theoretical
framework of employer branding functioned as groundwork for providing improve-
ment suggestions to the case company.
In many ways, investigative question 3 is the main objective of the thesis and the core
ingredient the case company anticipates to review and implement. Therefore, Chapter
5.2 is dedicated entirely to answering investigative question 3.

45
3.3 Data collection framework descriptions
In contemplation of understanding the data collection frameworks for investigative
question 1 and 2, this subchapter describes themes and topics found in the frame-
works.
Qualitative workshop
For investigative question 1, a qualitative workshop was conducted with the case com-
pany, as described in Chapter 3.2. The interview framework consisted of 21 questions,
most of them being open-ended. The actual interview framework can be accessed in
Attachment 1. The interview questions were divided into five themes, organized from
generic to more specific questions. The first theme was employer branding, with generic
questions of the employer brand the case company was aiming to build. The second
theme was employee value proposition (EVP) and employment experience (EE). This theme had
one main yes/no question which divided the theme into two sections. The question
was whether the case company already had a clearly defined EVP. If the answer was
yes, then the following questions aimed to answer questions such as how the EVP is
defined, how the EVP is communicated to the employees, and how the EVP is differ-
entiated from its competitors. If the answer was no, then the subsequent questions
asked whether the case company is attempting to build an EVP, and who the target
audience is for the EVP. The third theme was attractiveness and attraction that answered
questions as to how the case company is trying to attract the target audiences, what the
case company identifies as the most attractive employer characteristics, and does the
case company currently measure company attractiveness. The fourth theme was employ-
er brand image, which more specifically focused on actions, communication and channels
which the case company has taken or used in order to enhance their employer brand
image. The last theme was employer branding to business students. This theme questioned
the case company’s interest in employer branding specifically to business students and
actions taken by the case company to promote its employer brand to business students.

46
From the above, it is evident that the interview framework is organized from general
employer branding topics down to specific topics such as employer branding to busi-
ness students. All topics and questions are derived from theory covered in Chapter 2,
as seen below.
Table 3. Interview framework questions derived from theory
Theme Number Theme Chapter Number
Theme 1 Employer branding 2.1
Theme 2 EVP & EE 2.2 (2.2.1 & 2.2.2)
Theme 3 Attractiveness & Attraction 2.3 (2.3.2)
Theme 4 Employer brand image 2.4
Theme 5 Employer branding to business students 2.5
Quantitative survey
For investigative question 2, a quantitative survey was created, as described in Chapter
3.2. The survey contained a total of 16 questions including mostly list, rating, matrix
and several open-ended questions. In the survey, the theme headings were purposefully
not labeled, demographics being the exception. As the survey was rather short and the
online Webropol platform enhanced the clarity of the survey, I did not see the benefit
in adding theme labels. Nevertheless, the survey was structured into three parts. All
survey questions were mandatory, unless otherwise mentioned. The reader may consult
Figure 12 in Chapter 4.2 to visualize the survey structure.
Part one of the survey was the introduction with four general demographic questions;
gender, year of birth, field of study and years lived in Finland. These demographic
questions were chosen together with the case company to act as background and data
filtering questions. For example, the case company only wanted to focus on students
with a field of study in business, with this question all other areas of study could be
filtered.

47
Part two of the survey was further divided into two sections. Question number 5 calcu-
lated the level of awareness the respondent had of the case company. This question
determined which part of the survey the respondent would answer, as questions 6-14
were divided into two sections. Respondents answering not familiar to question 5 only
needed to answer questions 6-7 and 15-16. (Question 7 was not mandatory.) If re-
spondents chose any other option other than not familiar on question 5, they were asked
to answer questions 8-16. (Question 12 being not mandatory.) Questions 6 and 7 were
the same as questions 10 and 12, which focused on considering the case company as a
future employer and other favorable employers. These questions did not need the re-
spondent to be familiar with the case company. All other questions 8-14 required the
respondent to at least have heard of the case company in order to answer them. All of
the questions were carefully written by the author to reflect the theory, especially from
the tailor-made model Figure 10 in Chapter 2.6. The questions aimed to answer all
three parts of the model: reputation, awareness, and attractiveness. Question 14 from
part two of the survey was a special case. This question was tailored from the results of
the Universum’s student report, which the case company had acquired. The report is
discussed in Chapter 2.5.2 and the results influenced which drivers of employer attrac-
tiveness were to be questioned in the survey about the case company. At least one as-
pect from each of the four categories of employer attractiveness where present in ques-
tion 14.
The third, and final, part of the survey were questions 15 and 16, which asked the re-
spondent’s personal information if he or she wanted to participate in the prize drawing.
As this is not directly part of the thesis, these two questions will not be analyzed in the
following chapter.
3.4 Validity and reliability
In order to reduce bias and increase validity and reliability, certain measures were taken
before the data collections.
For the qualitative management workshop, both interviewees worked in the HR de-
partment and their responsibilities included employer branding, therefore the inter-
48
viewees had the latest information about Company X’s employer branding practices,
which in return increased the reliability of data. In order to reduce interviewer bias, the
workshop interview questions were designed to avoid yes or no answers, or include
follow up questions. According to Saunders et al. (2012, 326-327) validity and reliability
may become vulnerable if there is a lack of trust and between the interviewer and in-
terviewee(s), and the interviewer is not seen as credible by the interviewee(s), affecting
the amount of information provided by the interviewee(s). This issue was limited due
to the good relationship the interviewer and interviewees formed throughout the thesis
process.
For the quantitative student survey, or questionnaire, validity refers to the ability of the
questionnaire to measure what it is intended to measure and designing the questions
accordingly (Saunders et al. 2012, 372). The questionnaire was designed using different
types of questions in order to measure them more accurately. Question types used
were: list, open, rating and matrix. The theoretical chapters behind the questionnaire
can be seen in the overlay matrix, in Chapter 1.3.
To the case company’s interest, the research question of this thesis focused on busi-
ness students in Finland, therefore a filter question was placed in the survey to be able
to exclude all other students from the data results. This increased the data validity of
the questionnaire results.

49
4 Results
At this stage, the research results are presented and analyzed from the aforementioned
investigative questions 1 and 2. Results are further divided into themes from the re-
search frameworks. Within each theme, the data results are described, followed by the
analysis of the data. For a better understanding between the investigative questions and
results please check Table 1, the overlay matrix in Chapter 1.3.
4.1 Qualitative management workshop on current employer branding
practices
Theoretical framework in Chapter 2 describes the various elements and concepts con-
tained in employer branding, from which the workshop interview framework was cre-
ated. The results of the workshop are outlined and analyzed below.
4.1.1 Employer branding
According to the interviewees, Company X’s employer branding practices were at the
early stages of development at the time of research. Roughly two years ago, Company
X started working on its employer brand, however it was often left untouched for sev-
eral months due to other matters taking priority. Company X was building its employer
brand by gathering elements of employer branding that were already in place. These
elements included recruitment practices, career- and succession planning. Theoretically,
a company should specify several main functions that its employer brand will focus on.
Functions may include attracting top talent, improving retention, minimizing turnover
or improving employee engagement. However, Company X had no clarified function
that employer branding would bring to the firm. Nevertheless, all these functions did
exist within career development at Company X, but were not specifically thought
through in the employer branding perspective. Company X did not have a clear defini-
tion of the kind of employer brand it wanted to build, and therefore employer brand-
ing had not been targeted to any particular area. Company X had an internal employer
branding team consisting of two HR representatives, two Marketing representatives
and three Communications representatives. Company X’s employer branding team had

50
personnel from three departments which, according to Barrow and Mosley, should
increase the firm’s commitment to building the employer brand.
4.1.2 Employee value proposition and employment experience
As Company X’s employer branding practices were still in the early stages at the time
of research, more specific employer branding elements were even farther from comple-
tion. Company X did not have a clearly defined employee value proposition (EVP).
During an employer brand meeting in October 2013, Company X’s team began work-
ing on its EVP. The team defined elements of the EVP and used employer branding
architecture model by Jason Ginsburg (2013) as an example. The team had a brain-
storming session on what their company stands for as an employer and what kind of
promises Company X can give to its employees. The team also compared their compa-
ny to their competitors, analyzing what makes their employer stand out from the rest
of the employers in Finland. According to the interviewees this was fairly easy task to
do for the team, as they all shared the same views. The final point discussed at the
meeting was finding elements of employer branding that were completely missing from
Company X. The interviewees felt the meeting had been a good start for the team.
As the EVP was not defined at the time, it would have been difficult for Company X
to specify its targeted prospective employees. However, as Company X was attempting
to build its employer brand from HR practices already in place, during the workshop I
assumed that Company X would adapt its target audience from current recruitment
strategies and practices. The interviewees confirmed my assumption. In recruitment
Company X identifies targeted prospective employees by certain knowledge, skills, and
abilities (KSA) that are critical to its business. At the time of research, some of these
critical KSAs for Company X were international experience, performance-oriented
mindset and industry knowledge in which Company X operates. Language skills in
English and the local language were mandatory and knowledge of any other Nordic
language was a benefit. A Bachelor’s degree was usually preferred, however adequate
experience in the field could have sufficed. In addition to the general targeted audience
of prospective employees, Company X had a few talent segments with more specific
guidelines. One of the talent segments were technical positions at the company. The

51
candidates for this segment were required to have technical expertise in addition to the
general KSAs, and were generally needed for two departments (which cannot be fur-
ther specified). Another talent segment was for students and recent graduates. For this
talent segment, Company X had created both a graduate and a trainee program. The
targeted audiences were both students in the middle of their studies and recent gradu-
ates looking for a strong start to their careers.
As mentioned in the theory chapter, EVP is the promise for the employee and em-
ployment experience is the promise in reality. When asked if Company X compared its
EVP, or the small aspects of EVP that it currently had in place, with the actual em-
ployment experience, the interviewees responded with a declination.
Rosethorn (2009, 59) and Hubschmid (2012, 56) agree that as candidates seek for an
employer, candidates have certain expectation from employers that need to be empha-
sized in the company’s EVP. According to the interviewees, many international em-
ployers in Finland have similar things to offer to employees, such as benefits, therefore
the main differentiator between the firms in Finland is the company culture. According
to the interviewees at the time of research, Company X offered a truly international
employer and a culture that thrived on team spirit. Company X’s culture was very per-
formance oriented and therefore, Company X was able to offer challenging tasks to
employees in all positions. Thus, development opportunities were available for those
who showed that they were capable.
From the data above, it can be seen that Company X’s EVP is not yet defined, howev-
er the employer branding team had taken necessary steps in order to begin developing
the EVP. Unknowingly, the team used part of a tool called IPI analysis, described in
Chapter 2.2.1. The IPI analysis is a tool used for finding gaps between the reality and
the EVP the company is attempting to build. The employer branding team used this
tool during their brainstorming session when they were attempting to identify what
their company represents as an employer and what kind of promises Company X can
give to its employees. However, the employer branding team, consisting of only a few
persons, used the tool. In order to enhance the understanding of what Company X

52
represents as an employer, more employees at Company X should share their opinions,
if not all the employees. For this, Dyhre and Parment (2009, 68-71) suggest to conduct
quantitative surveys or interviews to identify the strengths and unique aspects of the
employer. As Company X is still building its EVP, in my opinion, it would be benefi-
cial for it to use all parts of the IPI Analysis tool, so that the EVP will be realistically
achievable given the current employment experiences at the company.
In addition, the EVP needs to be positioned to a certain audience: the targeted pro-
spective employees. Hubschmid (2012, 56) states that the EVP will be more attractive
when a firm knows the specific groups it wants to target, and knows the target groups’
employee expectations. As the EVP is still being developed, it is more flexible to
change. Therefore, it is crucial for Company X to specify its target groups and to know
the groups’ employee expectations already in the beginning stages of creating its EVP.
4.1.3 Employer attractiveness
Several attractive employer characteristics of Company X were international employer,
quality of working relationships (team spirit), development opportunities, pride in
product, and the location of the headquarters in a very prestigious area in the metro-
politan Helsinki area. Company X had a fairly traditional approach in attracting its tar-
get audience, mainly through recruitment. Company X created job ads for available
positions and posted them on suitable sites depending on the job description. In the
autumn of 2013, Company X posted its first job ad on LinkedIn. It was under consid-
eration by the Communication Director, whether Company X could expand posting
job ads to other social media channels such as Facebook and Twitter. Company X had
worked with making job ads more eye-catching and attractive. In addition, it was plan-
ning on creating a referral program where current employees could spread the word of
mouth and suggest suitable candidates for open positions in the company.
As a part of Company X’s project to improve its employer brand image amongst stu-
dents in Finland, it participated at a career convention for students in November 2013.
This was Company X’s first time participating at a convention. (The convention was
organized by Aalto University School of Business. This was the same convention

53
where I conducted my student survey for this thesis.) This convention was one specific
action taken by Company X in order to improve employer attractiveness to one of its
talent segments, business students.
In general, Company X does not measure employer attractiveness and has not done so
in the past. During the workshop it came to light that there was a possibility to meas-
ure this with no additional costs by placing a filter question on the recruitment site
and/or exit interview. Company X noticed that the product brand was measured in
social media, yet no measurements were in place for its employer brand. The first time
employer attractiveness was measured was from students’ perspective through my stu-
dent survey at the career convention.
Company X has identified its attractive employer characteristics, and it would be bene-
ficial for the firm to compare whether it fulfills its target groups’ employee expecta-
tions. This is extremely important as theorists like Hubschmid (2012, 56) and Dyhre
and Parment (2009, 86) agree that employer branding will have little impact unless an
attractive workplace can be offered. As Company X is in the process of creating more
attractive job postings in both old and new channels, it should advertise its EVP in the
new job postings and consider the three touch points mentioned in Chapter 2.2.1. In my
opinion, Company X’s participation at the career fair for students definitely increased
awareness and improved its employer brand image. My assumption is based on Cable
and Turban’s (2001, 154) statement that top of mind companies for students are those
who participate at events, fund scholarships and arrange speakers for classes. As Com-
pany X will develop its employer brand and build a strong and attractive EVP, it will
need to also measure its employer attractiveness and compare it to its competitors.
4.1.4 Employer brand image
Company X had taken many baby steps towards influencing its employer brand image.
For the external image, one of the main changes had been in the recruitment adver-
tisements. Together with a marketing agency, Company X had renewed the job ad
structures, images, layouts, and texts to be more simple and attractive. Also, Company
X had a student co-operation between an institute in Helsinki and the HR department.

54
This co-operation was short-term, organized for the students to give presentations for
Company X and in return received feedback, as well as an employer presentation.
Company X’s trainee and graduate program also influenced the employer brand image,
however this was an indirect outcome of the programs.
Internally, Company X had started to post job advertisements in the company premis-
es, such as coffee rooms, so that current employees would more easily notice open
positions. This was a direct intention to improve the employer brand image and
strengthen the company’s cross-functionality and development opportunities. The HR
team had also requested for permission to post job ads in the company Intranet, or
internal communication tool.
Company X did not have any concrete information about its employer brand image.
This was due the fact that no employer branding measurements had been taken. As a
result of this thesis, Company X received employer brand image information from stu-
dents’ perspective.
Communication is a large part of enhancing a firm’s employer brand image. However,
as Company X’s employer branding practices were still formulating, no specific actions
had been taken to communicate its employer brand. Similarly as before, communica-
tion of the employer brand was limited to the recruitment ads and the company’s first
attendance at the career convention. Therefore, the communication channels that
Company X had used for employer branding were at the time of research: recruitment
webpages, career convention, and other forms of job ads. In addition, Company X
created an employer brand brochure with employer information and career stories.
This brochure was first used at the career convention, and was planned to be used in
the future during recruitment interviews. Also, under consideration was for Company
X to communicate its employer brand in a magazine or newspaper in the near future.
Once again, Company X’s employer brand image practices are confined. Dyhre and
Parment (2009, 92) reiterate that it is important for Company X to communicate its
employer brand image through the correct channels, including media channels, once it

55
knows its target groups. Targeted prospective employees may have different prefer-
ences of searching for employer information, and Company X needs to aim its com-
munication efforts to the right channels.
4.1.5 Employer branding to business students
Company X was specifically interested in improving business students’ employer brand
image of its company. Company X understands that in order to deliver its promise, it
will need students or graduates who are innovative, passionate and able to drive the
company forward. Students and recent graduates also know about the latest theories,
studies and trends. In addition, Company X’s employee age structure was getting to a
place where many were retiring, and therefore they need to be replaced. This created a
chain-reaction in recruitment and thus many lower level positions opened up. As
Company X needs young employees, it is important for it to be able to attract these
people to become future employees. In addition, many young adults already have in-
ternational experiences both from school and work; therefore they are valuable pro-
spective employees for Company X.
In order to attract business students, Company X has a trainee and graduate program,
has had a student co-operation and has attended to a career convention. At the career
convention, Company X had both HR personnel and Graduate program Alumni pre-
sent. The two Alumni both participated in the Graduate program and were offered
full-time positions at the firm. Therefore, they were perfect representatives to network
with the students at the convention, increase awareness and reputation of Company
X’s employer brand and the Graduate program.
In my opinion, which is based on Cable and Turban (2001, 254), participating at a ca-
reer convention for students was a great choice for Company X. Fairs are a favorable
channel for students to receive employer knowledge, and therefore I believe the Aalto
Career Fair positively influenced Company X’s employer brand image amongst stu-
dents as well as increased awareness of Company X as an employer in Finland.

56
4.2 Quantitative student survey on the employer brand image of Company X
This subchapter will present and analyze the data and results gained through the quan-
titative student survey conducted at the Arena Fair in November 2013. The data will be
presented in five separate themes and the results and analysis are given simultaneously.
The reader may review Attachment 2, which consists of the actual questionnaire.
Figure 12. Survey structure with the number of respondents (Q= question(s), N=
number of respondents)
The figure above shows the structure of the survey. All respondents were required to
answer the demographic and awareness questions. Question 5 divided the respondents
into two groups: those who were and were not aware of Company X as an employer.
Those who were not aware thus answered only two more questions about general em-
ployer attractiveness before answering follow up questions to participate in the prize
drawing. Respondents who were aware of Company X as an employer were asked to
Awareness, Q: 5, N: 127
Not Aware Aware
Attractiveness Q: 6-‐7, N: 42
Attractiveness Q: 8-‐13, N: 85
Reputation Q: 14, N: 85
Prize Drawing, Q: 15-‐16, N: 127
Demographics, Q: 1-‐4, N: 127-‐131

57
answer more detailed employer attractiveness questions and a question on Company
X’s reputation, before answering the last two follow up questions. This figure above
will help the reader understand the structure of the survey, and why some questions
have varying amount of respondents.
4.2.1 Demographics
In order to receive background information about the respondents, as well as filter
respondents to include only business students, the survey began with several demo-
graphic questions.
The survey was completed by a total of 131 respondents. Due to the case company’s
specific interest towards business students, students’ field of study acted as a filtering
question for the rest of the survey analysis. From the 131 respondents, 124 specified
business as their field of study, one science, three engineering, and three others. ‘Other’
fields were further specified as communication and finance, which are a part of busi-
ness. Therefore, the rest of the data results will be analyzed through the perspective of
business students: including 124 business and 3 ‘other’ business students, equaling to
127 business students.
Figure 13. Respondents’ field of study (n = 131)
124
1
2
1
0
0
3
0 20 40 60 80 100 120 140
Business
Science
Engineering
Electrical Engineering
Chemical Technology
Art, Design or Architecture
Other, specify:
Frequency

58
As seen above, only a few respondents were studying something other than business.
This was predicted beforehand, as the survey was conducted at Aalto University
School of Business. From the 127 respondents studying business, over half were fe-
male, as seen in the figure below.
Figure 14. Respondents by gender (n = 127)
From the respondents, 59 % were female and 41 % were male. The majority of re-
spondents were aged between 18 and 27, and represented 89 % of the survey sample.
Respondents between ages 28 and 32 represented 9 % of the respondents, and the last
2 % were aged 35 and 39. As mentioned in Chapter 2.5, according to Rosethorn (2009,
42) Generation Y consists of persons born between years 1977 and 1995. Thus, 126
respondents, or 99.21 % of the sample are considered to be a part of Generation Y.
52; 41%
75; 59%
Male
Female

59
Figure 15. Respondents by age groups (n = 127)
The youngest respondent was 18 at the time of the survey and oldest respondent was
39 years of age. On average, the respondents’ age was 23 years and the median was also
23 years. This means that the respondent sample in this survey was very young and all,
with the exception of one respondent, represented Generation Y. Therefore, the in-
formation gained through this survey is representative of Generation Y’s perceptions
of Company X’s employer brand image.
Another important factor to consider when measuring the employer brand image of
Company X is how many years the respondent has lived in Finland. The amount of
years lived in Finland could correlate to the probability of the respondent being aware
of Company X as an employer in Finland. Below, the amount of years lived in Finland
is divided between groups.
59
54
12
1
1
0 10 20 30 40 50 60 70
18 -‐ 22
23 -‐ 27
28 -‐ 32
33 -‐ 37
38 -‐ and above
Freguency
Age grou
ps

60
Figure 16. Respondents by years lived in Finland (n = 127)
The figure above shows that majority of the respondents have lived in Finland either
between 0 to 5 years or 16 or more years, with only a few respondents who lived in
Finland between 6 to 15 years. Respondents who lived in Finland between 0 to 2 years
represented 30 % of the sample, and respondents who lived in Finland for 3 – 5 years
represented 17 % of the respondents. Similarly, respondents who lived in Finland be-
tween 16 to 20 years represented 13 % of the respondents, and respondents who lived
in Finland for 21 or more years represented 32 % of the respondents. Thus, the divi-
sion between respondents who lived in Finland for less than 10 years or more than 10
years is quite equal; 51 % living in Finland for 9 years or less and 49 % living in Finland
for 10 years or more.
In my opinion, this could mean that many native Finns have lived in Finland for all or
most of their lives. And as the youngest respondent was 18 years old, this could mean
that persons who have lived in Finland for 5 of fewer years could be foreigners. There-
fore, there are fewer respondents who have lived in Finland between 6 to 15 years.
38
22
5
4
17
41
0 5 10 15 20 25 30 35 40 45
0 -‐ 2
3 -‐ 5
6 -‐ 9
10 -‐ 15
16 to 20
21 -‐ or more
Frequency
Years
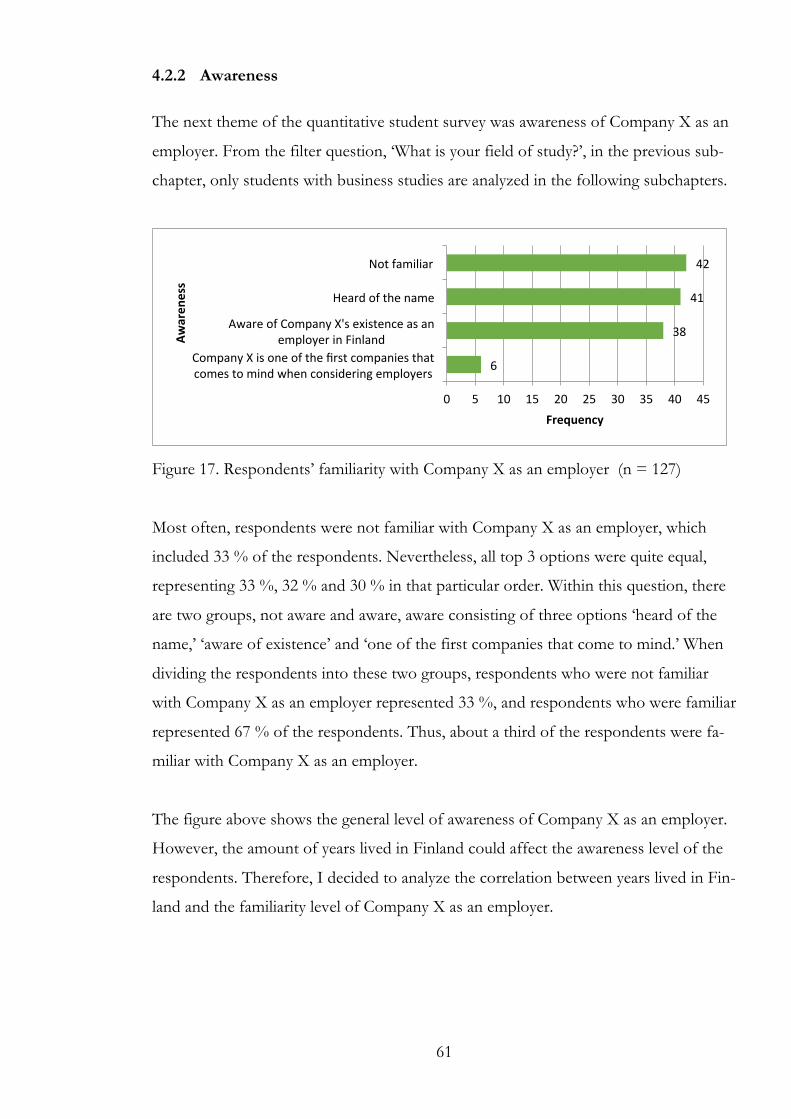
61
4.2.2 Awareness
The next theme of the quantitative student survey was awareness of Company X as an
employer. From the filter question, ‘What is your field of study?’, in the previous sub-
chapter, only students with business studies are analyzed in the following subchapters.
Figure 17. Respondents’ familiarity with Company X as an employer (n = 127)
Most often, respondents were not familiar with Company X as an employer, which
included 33 % of the respondents. Nevertheless, all top 3 options were quite equal,
representing 33 %, 32 % and 30 % in that particular order. Within this question, there
are two groups, not aware and aware, aware consisting of three options ‘heard of the
name,’ ‘aware of existence’ and ‘one of the first companies that come to mind.’ When
dividing the respondents into these two groups, respondents who were not familiar
with Company X as an employer represented 33 %, and respondents who were familiar
represented 67 % of the respondents. Thus, about a third of the respondents were fa-
miliar with Company X as an employer.
The figure above shows the general level of awareness of Company X as an employer.
However, the amount of years lived in Finland could affect the awareness level of the
respondents. Therefore, I decided to analyze the correlation between years lived in Fin-
land and the familiarity level of Company X as an employer.
6
38
41
42
0 5 10 15 20 25 30 35 40 45
Company X is one of the first companies that comes to mind when considering employers
Aware of Company X's existence as an employer in Finland
Heard of the name
Not familiar
Frequency
Awaren
ess

62
Figure 18. Familiarity of Company X as an employer by years lived in Finland (n =
127)
The figure above is a representation of the familiarity level by categories of years lived
in Finland. When analyzing the figure above, no clear pattern seems to emerge. Rather,
in every year group the awareness level is spread out, usually ‘not aware’ with the larg-
est frequency, followed by similar frequency with ‘heard the name’ and ‘aware of exist-
ence’ and with the lowest frequency for ‘one of the first companies that comes to
mind.’ The correlation coefficient further confirms this. Spearman’s correlation coeffi-
cient is -0.086, thus meaning that there is no relationship between the years lived in
Finland and the awareness level of Company X as an employer.
I was positively surprised with the level of awareness students in Finland had for
Company X. Furthermore, it was surprising that many respondents not only had heard
of the name of Company X, but also were fully aware of Company X as an employer
and a few even had Company X as a top of mind employer. I expected to find a correla-
tion between respondents’ awareness of Company X as an employer and the years
lived in Finland. Surprisingly, no correlation existed. This might be the result of Com-
pany X not having a strategic approach to communicating its employer brand to stu-
dents.
11
5
2
6
18
13
9
2
1
6
10
12
8
3
1
5
9
2
4
0 10 20 30 40 50
0 -‐ 2
3 -‐ 5
6 -‐ 9
10 -‐ 15
16 -‐20
21 or more
Frequency
Years lived
in Finland
Not familiar
Heard of the name
Aware of Company X's existence as an employer in Finland
Company X is one of the first companies that comes to mind when considering employers

63
4.2.3 Attractiveness
This subchapter further analyzes Company X’s employer attractiveness and candidate
attraction. This subchapter is divided into three sections; respondents who were and
who were not aware of Company X as an employer, and comparison of the two.
Respondents not aware of Company X as an employer
Theoretically, in order for a person to be attracted to a company he or she must al-
ready be aware of the company. Therefore, the questions asked of respondents who
are not aware of Company X are limited. The first question, asked whether they would
consider Company X as a possible employer in the future.
Figure 19. Respondents’ consideration of Company X as a future employer (n = 42)
From a total of 42 respondents, 67 % either agreed or strongly agreed that they would
consider Company X as their future employer. 14 % of the respondents disagreed or
strongly disagreed with this statement. 19 % were unable to answer, which could be
because the respondents were not aware of Company X as an employer and therefore
did not have the necessary information to base their opinion on.
8
2
4
24
4
0 5 10 15 20 25 30
Unable to answer
Strongly disagree
Disagree
Agree
Strongly agree
Frequency

64
The following question was optional, and therefore fewer responded. In order to know
Company X’s possible competitors for talent, respondents were asked to name top
three most favorable employers they would like to work for.
Figure 20. Top 3 most favorable employers (n = 35)
The question was open ended; therefore I manually created categories and sorted the
answers. Banks and IT or technology companies were the most popular employers for
respondents who were not aware of Company X as an employer, both at 24 %. Banks
included companies such as: Nordea, SEB, Osuuspankki, Goldman Sachs, Danske
Bank, and others. IT or technology companies included IBM, Kone, Nokia, Google,
Microsoft, and others. Nordea was the most favorable employer being mentioned 9
times, and Kone coming second, being named 8 times. Consulting firms were the third
most favorable employers at 13 %, with companies such as Ernst & Young, McKinsey,
Capgemini, and KPMG. Tied between 5th and 6th place, automotive industry was also
among the list of most favorable employers. This category included companies such as
BMW, Nissan, Toyota, and Audi.
When comparing results of the respondents who disagreed or strongly disagreed on
considering Company X as an employer and the respondents’ top 3 favorable employ-
ers, it came to light that all of these respondents’ top most favorable employers were
companies not operating in the same industry as Company X. One of the respondents
24%
24%
13%
10%
6%
8%
8% 5%
2%
Bank
Tech/IT
ConsulTng
Other
Manufacturers
AutomoTve
Consumer Goods
Airlines
Entrepreneur

65
who strongly disagreed with the statement above, stated his or her top most favorable
employer as ‘entrepreneur’. Therefore, I concluded that majority, if not all, of the re-
spondents disagreed to consider Company X as a possible future employer because
they were not interested in the industry in which Company X operates.
When analyzing the top most favorable employers within the category that Company X
operates, 50 % of the time respondents wrote Company X in their list.
Respondents aware of Company X as an employer
This subchapter analyzes persons consisting of the group aware and asks more detailed
questions about their employer attractiveness towards Company X. The group size is
85 respondents.
Figure 21. Channels through which respondents became aware of Company X (n =
85)
The question above asked respondents to choose all channels through which they have
gained information and became aware of Company X as an employer. The most popu-
lar channel was word of mouth, with 34 % of respondents choosing this as one of their
options. Company website was the second most chosen channel with 22 % of the re-
24
45
3
0
12
20
30
0 5 10 15 20 25 30 35 40 45 50
Other channels, please specify:
Word of mouth
Twi_er
Recruitment website
Company website
Frequency
Chan
nel

66
spondents’ votes. 15 % of respondents also chose recruitment website as one of the
channels. Company and recruitment websites together were chosen 37 % of the time,
and thus word of mouth and websites were the two most popular channels through
which respondents became aware of Company X as an employer. Social media was not
a very chosen option; Facebook was voted only 9 % and LinkedIn 2 % of the time.
The final option in the figure above is ‘other’. This represented 18 % of the chosen
channels. The respondents were asked to specify their answer, which included re-
sponses such as: friends, personal interest in Company X’s products, promotional
work, newspapers and magazines, owning Company X’s product and Google. 18 out
of 24 (or 13 % from the total) respondents who chose ‘other’ specified the channel to
be Arena Career Fair, where the survey was taking place.
As a student myself, I know that students tend to share information about companies
with trainee positions and graduate programs due to the fact that for many students it
is obligatory to obtain work experience as a part of their studies. As at the time of re-
search, Company X offered both training and graduate programs, it could explain why
word of mouth was the most popular channel through which students became aware
of Company X. Also, the reason no correlation was found between awareness of
Company X and years lived in Finland, could partly be due to word of mouth being the
most popular channel. Word of mouth tends to spread between friends and acquaint-
ance, without a strategic approach.
Another reason why social media channels were not popular is because Company X
had only begun using LinkedIn as a job board a few months before the career fair. Fa-
cebook had more information about Company X’s products rather than about the em-
ployer itself, and Twitter use had still been low. These results were fully expected and
verify the validity of the results.
The next questions aimed to measure how many respondents who were aware of
Company X as an employer, knew the size of the employer.

67
Figure 22. Respondents’ familiarity with Company X’s size as an employer (n = 85)
Company X is a medium sized employer with 100 – 200 employees. (Exact figure can-
not be given as it may reveal the employer.) 54 % of the respondents stated that they
were not aware of Company X’s size as an employer. Another 25 % chose correctly
with Company X being a medium sized employer. The remaining 21 % of the re-
spondents implied that they knew Company X’s size as an employer, yet chose incor-
rectly.
These results show that even though many respondents were aware of Company X as
an employer, they had limited knowledge of the employer. 21 % of respondents
guessed the answer for the question above. Therefore, of the 25 % who chose correct-
ly, some answers might have also been guesses. Thus, most likely less than 25 % of
respondents indeed knew Company X’s size as an employer.
According to Barrow and Mosley (2005, 107), measuring candidates’ consideration of
working for a certain company is directly related to their attractiveness to the company.
Therefore, the graph below shows respondents’ (who were aware of Company X as an
employer) consideration of Company X as a possible employer in the future.
46
7
10
21
1
0 5 10 15 20 25 30 35 40 45 50
Not familiar
Large: > 501 employees
Medium large: 201 – 500 employees
Medium: 51 – 200 employees
Small: < 50 employees
Frequency
Num
ber o
f employees

68
Figure 23. Respondents’ consideration of Company X as a future employer (n = 85)
From 85 respondents, 85 % either agreed or strongly agreed that they would consider
Company X as their future employer. 5 % of the respondents disagreed with the
statement, and the final 10 % were unable to answer. Even though most respondents
would consider Company X as a their future employer, not many respondents had yet
applied to Company X.
Figure 24. Amount of respondents who have applied to Company X (n = 85)
As shown in the figure above, 94 % of the respondents had never applied to Company
X before. The remaining 6 % had applied to positions such as HR Trainee, other train-
ee positions, and controlling coordinator.
It is important to know a firm’s competitors for talent, therefore, respondents were
asked to name top three most favorable employers they would like to work for. Fewer
responded, as the following question was optional.
9
0
4
42
30
0 5 10 15 20 25 30 35 40 45
Unable to answer
Strongly disagree
Disagree
Agree
Strongly agree
Frequency
5
80
0 10 20 30 40 50 60 70 80 90
Yes
No
Frequency
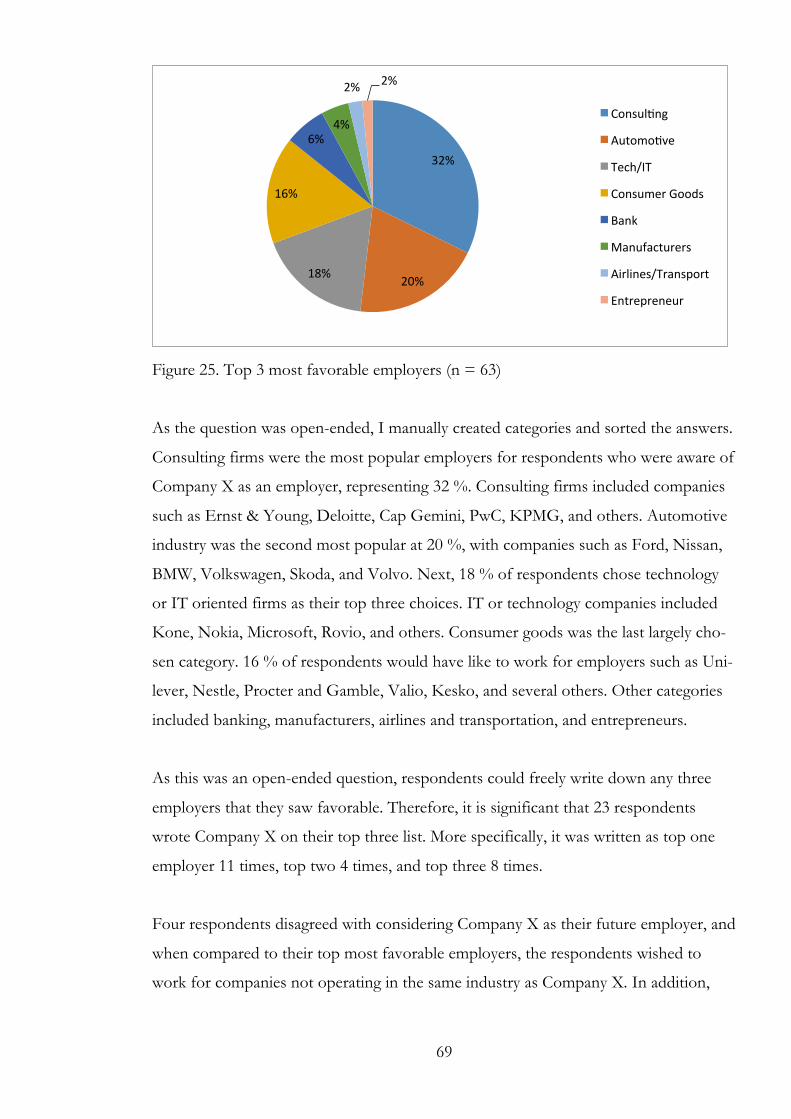
69
Figure 25. Top 3 most favorable employers (n = 63)
As the question was open-ended, I manually created categories and sorted the answers.
Consulting firms were the most popular employers for respondents who were aware of
Company X as an employer, representing 32 %. Consulting firms included companies
such as Ernst & Young, Deloitte, Cap Gemini, PwC, KPMG, and others. Automotive
industry was the second most popular at 20 %, with companies such as Ford, Nissan,
BMW, Volkswagen, Skoda, and Volvo. Next, 18 % of respondents chose technology
or IT oriented firms as their top three choices. IT or technology companies included
Kone, Nokia, Microsoft, Rovio, and others. Consumer goods was the last largely cho-
sen category. 16 % of respondents would have like to work for employers such as Uni-
lever, Nestle, Procter and Gamble, Valio, Kesko, and several others. Other categories
included banking, manufacturers, airlines and transportation, and entrepreneurs.
As this was an open-ended question, respondents could freely write down any three
employers that they saw favorable. Therefore, it is significant that 23 respondents
wrote Company X on their top three list. More specifically, it was written as top one
employer 11 times, top two 4 times, and top three 8 times.
Four respondents disagreed with considering Company X as their future employer, and
when compared to their top most favorable employers, the respondents wished to
work for companies not operating in the same industry as Company X. In addition,
32%
20% 18%
16%
6% 4%
2% 2%
ConsulTng
AutomoTve
Tech/IT
Consumer Goods
Bank
Manufacturers
Airlines/Transport
Entrepreneur

70
one respondent wanted to work as an entrepreneur. Once again, I concluded that ma-
jority of the respondents who disagreed to consider Company X as a possible future
employer were not interested in the industry in which Company X operates.
Figure 26. Respondents’ perception of Company X as an employer (n = 84)
The graph above illustrates respondents’ perception of Company X as an employer. 58
% of respondents saw Company X positively as an employer, and none of the re-
spondents perceived Company X negatively. 41 % of respondents held a neutral view
of Company X as an employer, and only 1 respondent was unable to answer.
Even though majority of the respondents saw Company X positively, still a large num-
ber of respondents observed it in a neutral light. Unfortunately, there is no corre-
sponding data to analyze why so many respondents saw Company X neutrally. My ed-
ucated guess is that respondents did not have enough employer information to see
Company X positively, yet they also didn’t have any negative experiences.
To conclude, 85 % agreed to consider Company X as their possible employer and only
6 % had actually applied to Company X. Furthermore, four persons who disagreed
were not interested in the industry in which Company X operates. 58 % perceived
Company X positively. Therefore, it is alarming that such a large percentage of re-
spondents have not applied to Company X. This can possibly mean, that although
Company X is seen as a possible employer, it needs to improve its attractiveness to
gain more applicants.
0
35
49
0 10 20 30 40 50 60
NegaTve
Neutral
PosiTve
Frequency

71
Comparison of respondents aware and now aware of Company X as an employer
In the survey respondents who were and were not aware of Company X as an employ-
er were both asked two of the same questions. The first question asked whether the
respondent would consider Company X as their future employer, and the second ques-
tion asked what were the top three most favorable employer the respondent would like
to work for. These two questions have earlier been analyzed separately for respondents
who were not aware and were aware of Company X as an employer. Now I would like
to combine and compare the results.
Figure 27. Comparison between respondents’ awareness with Company X as an em-
ployer and consideration of Company X as a future employer (n = 127; aware 85, not
aware 42)
From the figure above it can be concluded that if a respondent is aware of Company X
as an employer, then he or she is more likely to consider Company X as his or her fu-
ture employer compared to a person who is not aware of Company X. It can also be
concluded that if the respondent is aware of Company X, then he or she will less likely
not be able to answer whether he or she would consider Company X as his or her fu-
ture employer. However, these are rather general conclusions due to the fact that the
sample size is small compared to the overall amount of students in Finland.
10%
35 %
57 %
49 %
9%
5%
5% 19 %
11%
0% 20% 40% 60% 80% 100%
Not Aware
Aware
ConsideraCon of Company X as a future employer
Awaren
ess o
f Com
pany X
as an em
ployer
Strongly agree
Agree
Disagree
Strongly disagree
Unable to answer

72
The second question asked what top three most favorable employers the respondents
would like to work for. When comparing the two groups, only slight differences occur.
Figure 28. Comparison between respondents’ awareness with Company X as an em-
ployer and their top 3 most favorable employers by category (n = 127; aware 85, not
aware 42)
There are only a few noticeable differences between the categories of top three most
favorable employers between respondents aware and not aware not Company X as an
employer. The differences that emerge are that respondents not aware of Company X
were more interested in the banking sector and slightly more in technology or IT sec-
tor than those who were aware of Company X. On the other hand, respondents who
were aware of Company X were more interested in consulting firms and automotive
industry.
4.2.4 Reputation
Reputation was the subsequent category. To measure Company X’s reputation several
elements where chosen including exciting products, friendly work environment, variety
of work tasks and responsibilities, good reference for future career, and competitive
base salary. Respondents were then asked to rate the level of agreement for each of
these elements.
24 %
6%
24 %
16 %
13%
29 %
6%
4%
8%
18%
8%
15%
5% 10%
9%
0% 20% 40% 60% 80% 100%
Not Aware
Aware
Top 3 most favorable employers by category
Awaren
ess o
f Com
pany X
as an em
ployer
Bank
Tech/IT
ConsulTng
Manufacturers
AutomoTve
Consumer Goods
Airlines/Transport
Entrepreneur
Other

73
Figure 29. Respondents’ agreement level based on five elements shaping Company X’s
reputation (n = 85)
Exciting products
Figure 29 shows that 37 % of respondents strongly agreed and 46 % agreed that Com-
pany X has exciting products, totaling to 83 % of respondents. Only 1 % disagreed and
2 % strongly disagreed with this statement. The final 14 % of respondents were unable
to answer or were not familiar.
Friendly work environment
According to data, 55 % of respondents strongly agreed or agreed that Company X has
a friendly work environment. None of the respondents disagreed with this statement,
however one respondent strongly disagreed. A large amount of respondents were una-
ble to answer or were not familiar enough to answer, specifically 43 % of the respond-
ents.
Variety of work tasks and responsibilities
With regards to Company X providing a variety of work tasks and responsibilities, 20
% of respondents strongly agreed and 50 % agreed with this statement. Thus, a large
22 %
20 %
25 %
37 %
37 %
58 %
50 %
30 %
46 %
55 %
18 %
26 %
43 %
14 %
0% 20% 40% 60% 80% 100%
CompeTTve base salary
Good reference for future career
Variety of work tasks and responsibiliTes
Friendly work environment
ExciTng products
Frequency
Strongly Agree
Agree
Disagree
Strongly disagree
Unable to answer/Not familiar

74
majority, or 70 % of the respondents agreed with this statement. Only 2 % disagreed
and another 2 % strongly disagreed with this statement. On the other hand, 26 % were
unable to answer or were not familiar.
Good reference for future career
A large 80 % or respondents agreed or strongly agreed that Company X would be a
good reference for their future career. No respondents disagreed, however two re-
spondents (2 %) strongly disagreed. The remaining 18 % were unable to answer, or
were not familiar.
Competitive base salary
In contrast to the statements beforehand, more than half of the respondents were una-
ble to answer or were not familiar whether Company X had a competitive base salary.
Numerically, this equaled to 55 % of respondents. Nevertheless, 43 % of the respond-
ents either agreed or strongly agreed with this statement, leaving only 2 % of respond-
ents to disagreement.
Results
Respondents most fully agreed with Company X having exciting products and giving a
good reference for future career. On the other hand, between 14 % and 55 % of re-
spondents were unable to answer or were not familiar with the statements above.
Thus, confirming my earlier assumption that respondents have little knowledge of the
employer with regards to information such as the size of employer, what the employer
has to offer, and other employer branding elements. According to Cable and Turban
(2001, 140) these elements are important as they will increase Company X’s employer
attractiveness and enhance its employer brand.

75
5 Conclusion
The final chapter of the thesis introduces key research findings, discusses the credibility
of the research, proposes suggestions for further research, provides feedback from
relevant parties and analyzes my personal learning. Most importantly, this chapter an-
swers investigative question 3 and the main research question for this thesis – How
could the external employer brand image of Company X be improved amongst busi-
ness students in Finland?
5.1 Key findings
This chapter provides the key research findings, and the subchapters are divided into
the two data collection methods used in this thesis: qualitative management workshop
and quantitative student survey.
5.1.1 Qualitative management workshop
The main finding from the qualitative management workshop conducted with Compa-
ny X’s HR Manager and HR Development Specialist, was that Company X’s employer
branding practices were at the very early stages of development. Company X was
building its employer brand from HR practices already in use by the firm, which came
mostly from recruitment. Company X had not specified the main function that em-
ployer branding would achieve for the firm.
Furthermore, Company X had not placed much effort into enhancing its employer
attractiveness. Company X communicated to prospective employees mainly through
job postings on recruitment sites, but other channels were slowly being used. Job ad-
vertisements were being renewed to look and sound more attractive, however no other
actions to directly improve the firms employer attractiveness had been taken. One con-
crete action had been made to improve Company X’s employer brand image among
students: Company X’s participated at the career convention for students.

76
In the fall of 2013, Company X began working on its employee value proposition
(EVP) and so the target groups for the EVP had not been defined yet. An employer
cannot attract everyone, and therefore it needs to have a clear understanding of its tar-
get perspective employees. Company X’s EVP had not been targeted to many specific
talent segments, other than business students. This was another crucial finding.
Final key finding was that Company X did not measure or have any concrete data from
any of the employer branding elements. Explicitly, Company X did not have any em-
ployment experience data, which could help to create a more realistic EVP at the de-
velopment stage, and later to which they could compare and analyze a possible gap
between the EVP – the promise for the employee – and the employment experience –
the delivery of the promise. Company X also did not have any employer attractiveness
measurements. Even if the firm is in the early stage of developing its employer brand,
according to McLeod and Waldman (2011, 20) every company already has an employer
brand image. Therefore it would be beneficial for Company X to measure where it cur-
rently stands in the attraction index, and tailor the employer brand and EVP according-
ly.
5.1.2 Quantitative student survey
The key finding from the survey conducted amongst students in Finland was that ma-
jority of the survey respondents, namely 67 %, were aware of Company X as an em-
ployer in Finland. The amount of years lived in Finland had no correlation with the
awareness of Company X. Word of mouth was the most popular channel through
which respondents had become aware of Company X, which is understandable as
Company X’s employer brand practices were limited and lacked a strategic approach to
communicating its employer brand to students.
An important finding was that even though 67 % of the respondents were aware of
Company X as an employer, only a quarter or less knew the size of employer, suggest-
ing that most respondents had limited employer knowledge about Company X. Also,
of the 67 %, fifty-eight per cent perceived Company X positively and 85 % agreed to
consider Company X as their future employer. Nevertheless, only 6 % (of the 67 %)

77
had applied to Company X before, suggesting a lack of attraction to Company X from
job applicants.
To sum up, respondents’ employer awareness of Company X was unexpectedly high, if
compared to the low amount of effort placed to employer branding practices by Com-
pany X. Nevertheless, general employer knowledge of Company X was lacking from
students, affecting the overall employer attractiveness and attraction that students have
to actively become prospective employees of Company X.
5.2 Improvement suggestions
This chapter provides important improvement suggestions for the case company
which have been derived from the theory and results. The subchapters are divided into
the two data collection methods used in this thesis: qualitative management workshop
and quantitative student survey.
5.2.1 Qualitative management workshop
Since Company X is at the forming stage of its employee value proposition (EVP), it
can improve the outcome of the EVP by utilizing the IPI-Analysis suggested by Dyhre
and Parment in Chapter 2.2.1. This will also help the case company to determine the
main functions of the employer brand. As students are one of the target groups, the
EVP should attract them. Universum’s student survey, discussed in Chapter 2.5.2, indi-
cates students’ drivers of employer attractiveness, and can be used to tailor Company
X’s EVP accordingly. Other target groups also need to be specified, as a firm cannot
attract everyone. Company X should also improve its employer attractiveness efforts
by communicating its EVP to students through the students’ preferred channels. As
mentioned in Chapter 2.5.1, Generation Y students prefer high level of personal con-
tact and are very technology oriented; company websites and social media are popular
communication tools. Therefore, these communication channels should be used ac-
tively.

78
The most important improvement suggestion I can give is for Company X to measure
its employer branding elements, such as employment experience, employer attractive-
ness and employer brand image. Some elements like employment experience can be
measured by simply placing an additional question to an exit interview. The case com-
pany should preferably measure employer attractiveness and employer brand image
annually, so that development can be tracked over a period of time. More information
on this topic can be found in Chapter 2.3.2.
5.2.2 Quantitative student survey
In order for Company X to improve its employer brand image amongst students in
Finland, several steps should be taken.
First off, familiarity of Company X as an employer should be further improved. This
can be done by increasing presence in communication channels preferred by students,
such as career events, class speakers, and other face-to-face mediums. Also, social me-
dia should be actively used and the message should advertise an attractive EVP.
Another improvement could be made to students’ overall employer knowledge of
Company X. As seen in the results, a majority of the respondents were familiar with
the case company, yet most lacked general information about the company such as the
size of employer. Therefore, when communicating to students, Company X should
also provide students with employer information, as discussed in Chapter 2.4. Prospec-
tive employees often use this information to compare if they would fit in to the firm.
From the results it can also be noticed that most respondents would consider Compa-
ny X as their future employer, yet very few had actually applied. Thus, Company X is
seen positively by students, but possibly not as an attractive employer. Again, improv-
ing communication to students will enhance their attractiveness to the firm.
As a conclusion, communication is key in improving Company X’s employer brand
image amongst students in Finland. Currently the image students have is positive, and

79
thus if communication is improved the employer brand image will grow and attract
more applicants and prospective employees.
5.3 Credibility of research findings
Credibility of the research and research findings are analyzes through validity, reliability
and possible bias in the data. The chapter is divided in to the two data collection meth-
ods used in this thesis: qualitative management workshop and quantitative student sur-
vey.
5.3.1 Qualitative management workshop
Different threats to validity and reliability of data were evaluated. For example, the data
may have included response bias, threatening the data reliability. Response bias is when
the interviewee may not want to or be allowed to discuss certain issues, thus giving a
partial picture that places the interviewee in a socially desirable place (Saunders et al.
2009, 326-327). I do not have a reason to believe that such bias was present in the re-
search as the company identity is kept secret in this thesis, and the interviewee was the
head of HR in the Nordic region at Company X.
Observer bias was also assessed. The interview questions were carefully planned and
explained to the interviewees during the workshop. Also there were no, or very few,
cultural differences between the interviewer and interviewees. Therefore the possibility
of observer bias, or misinterpretation of the questions, is very low.
Finally, interpretation error by the interviewer is also a threat to data validity. To avoid
this, however, I took notes during the interview as well as recorded and later tran-
scribed the full interview, limiting this threat. Thus, I believe that the research findings
from the qualitative workshop with Company X are both valid and reliable.
5.3.2 Quantitative student survey
As mentioned in Chapter 3.4, validity refers to the ability of the questionnaire to meas-
ure what it is intended to measure and designing the questions accordingly (Saunders et

80
al. 2012, 372). One small mistake was found in question 5 in the survey. The question
asks ‘How familiar are you with Company X as an employer?’ The question does not
limit the respondents’ familiarity with the company only to Finland, which was the in-
tension. However, the third response option for the question stated ‘Aware of Compa-
ny X as an employer in Finland,’ thus limiting only to Finland. As the company head-
quarters are in Finland and the questionnaire was conducted in Finland, this error
should not have affected the results. Nevertheless, this was an error in detail in the
survey which I realized after the survey was conducted.
As the survey was conducted at a career convention setting, convenience sampling was
used. Therefore, convenience sampling bias might have occurred as only students who
were motivated answered the survey, leaving out perceptions of students who possibly
already had negative experiences with the case company.
Otherwise, no validity or reliability issues threated to skew the data. I believe that the
questionnaire results are credible. This can also be seen as the results from both the
workshop and questionnaire verify each other. For example, the workshop exposed
that social media channels had not been actively used and the questionnaire verified
this by showing that social media channels were the least popular communication me-
diums for students.
5.4 Suggestions for further research
This thesis had a very particular focus on the external employer brand image of Com-
pany X, specifically amongst students in Finland. Therefore, the results and data gained
from this thesis were only a small share of the overall employer brand image held by
the Nordic workforce. Thus, in order to gain a more profound understanding of Com-
pany X’s employer brand image, I would suggest the case company to expand its re-
search and measure its external employer brand image from both the Finnish and
Nordic business sector’s workforce. In addition, I would recommend Company X to
measure its internal employer brand image, as it would expose important information
such as employee’s commitment drivers and employment experiences. Comparing
Company X’s external and internal employer brand image will immensely enhance

81
Company X’s understanding of its employer brand by highlighting possible gaps be-
tween the internal and external brand image thus providing guidelines for further im-
provement suggestions.
5.5 Feedback and personal learning
This chapter will provide feedback from the case company and Universum as well as
reflect on my personal learning gained through writing this paper.
5.5.1 Feedback
Throughout this thesis process, I had been in contact mostly with two companies, my
commissioning company and Universum. This chapter contains valuable feedback
from both parties concerning benefits and strengths of this thesis and evaluation of my
work and process management. I presented the thesis findings to Elina Mauno, senior
employer branding advisor from Universum on April 8th, 2014, as well as Company X’s
HR team on April 9th 2014. The thesis results and especially improvement suggestions
proved to be useful and important for the case company, as stated in the feedback be-
low.
Feedback from commissioning company
“Overall we were very happy with Rebecca’s thesis work. Rebecca handled the process
outstandingly in close cooperation with us. She had always the best interest of our
company in mind when working with the thesis and fair concept. Her way of conduct-
ing the thesis process as well as preparations for the fair was structured, logical and
involving. She was fully committed to the task, and the result all through the different
phases of the thesis process was laudable.
In accordance with the recommendation we will e.g. attempt to increase our presence
in the most appropriate social media channels for attracting employees and for pro-
moting the employer brand image, and in those channels ensure the communication is
consistent with our employee value promise. We will also, before going out with any

82
employee value promise, ensure that our current employees can identify with the
promise, that it represents their perception of working within our company. We will
furthermore investigate how we can in the future measure our employer brand image
in order for us to know how the implemented approaches work.”
Helsinki, April 16th, 2014
(Name not revealed), HR Manager
Case Company X
Feedback from Universum
“We at Universum Finland have had the pleasure to work together with Rebecca Boy-
ko, by providing her case company with data & insights of the Nordic countries’ talent
markets and how business graduates view working life. Rebecca has utilized these in-
sights in her thesis to research how Company X employer brand is viewed by Finnish
students at Aalto university career fair and to provide Company X with recommenda-
tions on how to develop their employer brand further.
After discussing the results with Rebecca and reading the summary about her thesis
findings, I am happy to state that she has shown good understanding of the concept of
employer brand in a short time and been able to identify the essential causal relation-
ships affecting whether a company’s employer brand is successful or not. What I found
specifically commendable in her findings and conclusions are the concrete recommen-
dations she has been able to produce for Company X on how they should advance in
strengthening their employer brand and what activities need to be taken to put together
a solid operative plan. Her suggestions for Company X are very much aligned on what
I would recommend for the company as senior employer branding advisor, taken into
account her level of work experience on the subject and business life in general.”
Helsinki, April 14th, 2014
Elina Mauno, Senior Employer Branding Advisor
Universum Global

83
5.5.2 Personal learning
For the past year I have been slowly but steadily working on this research-oriented the-
sis. I have learned a lot both through the process management of this thesis and from
the theoretical point of view. Due to the nature of this thesis, time management, self-
motivation, and self-determination have been extremely important. Working for ap-
proximately a year on a paper with no clear deadline is harder than it sounds. Fortu-
nately, I was able to set clear deadlines for myself and follow through with my overall
plan, even with a few setbacks along the way. Writing this paper has definitely im-
proved my project management, researching, and writing skills.
During my studies, one of my courses touched upon the subject of employer branding.
I became interested in this topic and was blessed to have a commissioning company
which was interested in improving its employer brand image. While researching for the
topics’ theoretical framework, I read several very thorough employer branding books
along with many articles and other materials. The literature expanded my knowledge
on employer branding, and showed me various perspectives of the topic. I found out
that even tough the term ‘employer branding’ has been around since 1996, there are
not many books and other literature that explains the topic in great detail. Rather, there
are many theorists and HR professionals who have their own view on employer brand-
ing and have created new terminology for similar concepts. While reading literature for
this paper, one of the hardest obstacles for me was to understand the big picture of
employer branding, because so many theorist and books were discussing similar mat-
ters but in different terminology. For example, what McLeod and Waldman call an
‘employee lifecycle’, Barrow and Mosley call it the ‘employer brand mix’. And it is not
only the terminology that is different, but the factors and elements that make up each
larger concept vary between different theorists. Writing the theoretical framework for
this paper was the most difficult task. However, when reflecting upon it I am very sat-
isfied with my work and the outcome; possibly bringing a new perspective to employer
branding through my work of combining several theorists’ views into one.

84
Last but not least, I was able to network with several HR professionals from the case
company and Universum who gave me new insight into the professional world. Over-
all, my interest in employer branding grew immensely and I am very interested in work-
ing with a company’s employer brand, if such a possibility would arise in the future.

85
References
Ambler, T. & Barrow, S. 1996. The Employer Brand. Journal of Brand Management,
20, 3.
Armstrong, M. 2009. Armstrong’s Handbook of Human Resource Management Prac-
tice. 11th ed. Replika Press Pvt Ltd. Philadelphia.
Barrow, S. & Mosley, R. 2005. The Employer brand: Bringing the Best of Brand Man-
agement to People at Work. John Wiley & Sons Ltd. Chichester.
Berthon, P., Ewing, M. & Hah, L. 2005. Captivating company: dimensions of attrac-tiveness in employer branding. International Journal of Advertising. 24, 2, pp. 151- 172.
Cable, D. & Turban, D. 2011. Establishing the Dimensions, Sources and Value of Job
Seekers’ Employer Knowledge During Recruitment. 20, pp. 115-163.
Company X. 2012. Annual Report.
Company X Representative. 26 Nov 2013. HR Manager. Company X headquarters.
Interview. Helsinki.
Company X Representative. 26 Nov 2013. HR Development Specialist. Company X
headquarters. Interview. Helsinki.
DeVault, G. 2013. Market Research. Choosing between qualitative and quantitative
methods. URL:
http://marketresearch.about.com/od/market.research.techniques/a/Choosing-
Between-Qualitative-And-Quantitative-Methods.htm. Accessed: 25 Jan 2014.
Dyhre, A. & Parment, A. 2009. Sustainable Employer Branding: Guidelines, Worktools
and Best Practices. The authors and Liber AB. Malmö.
86
Engage for Success. 2013. What is employee engagement? URL:
http://www.engageforsuccess.org/about/what-is-employee-engagement/. Accessed:
13 Aug 2013.
Ginsburg, J. 2013. Brandemix bonus reel: The importance of Employer Branding.
URL: http://brandemixblog.blogspot.fr/2013/07/brandemix-bonus-reel-importance-
of.html. Accessed: 4 Feb 2014.
Hubschmid, E. 2012. Shaping Efficient Employer Branding Strategies to Target Gen-
eration Y. Peter Lang AG. Bern.
IE Business School. 2012. Positioning, Segmentation and Differentiation. URL:
http://www.youtube.com/watch?v=_0yFXLA6YW0. Accessed: 29 June 2013.
McLeod, C. & Waldman, J. 2011. The HR Trailblazer. Unlock the potential of your
employer brand in a digital age. URL:
https://www.ebookit.com/books/0000001256/The-HR-Trailblazer-Unlock-the-
Potential-of-Your-Employer-Brand.html. Accessed: 4 May 2013.
Moroko, L. & Uncles, M.D. 2012. Employer Branding. URL:
http://online.wsj.com/article/SB123740504559375085.html. Accessed: 20 May 2013.
Rosethorn, H. 2009. The Employer Brand: Keeping Faith with the Deal. Gower Pub-
lishing Ltd. Aldershot.
Saunders, M., Lewis, P. & Thornhill, A. 2012. Research methods for business students.
5th ed. Prentice Hall. Harlow.
Universum. 2013. Nordic Talent Insight 2013. Case company’s confidential document.

87
Universum Global. 2013. About Universum. URL:
http://universumglobal.com/about/. Accessed: 25 Jan 2014.

88
Attachments
Attachment 1. Workshop interview framework with Company X
Company X (CX) Definitions: Employer branding is “The package of functional, economic and psychological bene-fits provided by employment and identified with the employing company.” (Ambler & Barrow 1996, 4.) Employer brand image is the perception of what “Individuals believe about potential employers, and job seeker’s memories and associations regarding an organization” (Cable & Turban 2001, 123). Employee value proposition (EVP) “Consists of what an organization has to offer that prospective or existing employees would value and which would help to persuade them to join or remain with the business” (Armstrong 2009, 496). Employer branding
1. What kind of an employer brand is CX currently attempting to build? 2. Is there a certain focus on the employer brand? For example:
a. Attracting top talent b. Improving retention / minimizing turnover c. Improving employee engagement
Employee value proposition & Employee expectations
3. Does CX have a clearly defined employee value proposition (EVP)? IF YES:
4. How is the EVP defined at CX? a. What elements does the EVP contain?
5. How is the EVP communicated to CX’s employees? 6. Is the EVP communicated externally?
a. If yes, how? 7. Does CX compare the EVP to the actual employment experience?
a. If yes, how is it done and how often? 8. How is CX’s EVP differentiated from its competitors? 9. Segmentation answers ‘to whom’ the product or service is being positioned.
Has CX segmented its EVP specifically to certain talent segments? IF NO:
10. Is CX currently attempting to build an EVP? a. If yes, how is CX trying to build it?

89
b. If no, why not? 11. Who is CX’s target audience when considering prospective employees?
a. Are there several main ‘target audiences’? (These are called talent seg-ments)
12. In order to define an EVP, Hubschmid, an employer branding professional suggests to answer the following question: “Why should a talented, well-qualified, and motivated person prefer CX over all the others as an employer?"
Attractiveness & Attraction
13. What are CX’s most attractive employer characteristics? 14. How is CX trying to attract the target audience(s)? 15. Does CX measure employer attractiveness?
a. If yes, how is it done? b. How often is it measured?
Employer brand image
16. What kind of actions has CX taken in order to influence its employer brand im-age? (Within the past 3 years?)
17. How much information does CX currently have about its employer brand im-age?
18. How has CX’s employer brand been communicated externally? 19. What channels does CX use for employer branding?
Employer Branding to Business Students 20. Why is CX’s interested in specifically improving business students’ employer
brand image of CX? 21. What kind of actions has CX taken to promote its employer brand specifically
to business students?

90
Attachment 2. Company X’s external employer brand image questionnaire
Cover Letter We would kindly like to ask you to participate in this survey to help us understand our employer brand image amongst students in Finland. Participate in this survey: - For a change to WIN ***** Prize - To be among the first 100 participants and receive a Company X phone bag - To provide Company X with valuable information
We appreciate your help! This survey will take 2 to 5 minutes of your time. Demographics
1. Please specify your gender a. Male b. Female
2. What year were you born in? a. : ______________
3. What field are your studies in? a. Business b. Science c. Engineering d. Electrical engineering e. Chemical technology f. Art, Design or Architecture g. Other, specify: ______________
4. How many years have you lived in Finland? a. : ______________
Awareness (Filter question. If answered a, answer question 6 & 7 and proceed to question 15. If answered b, c, or d proceed to question 8.)
5. How familiar are you with Company X as an employer? a. Not familiar b. Heard of the name c. Aware of Company X’s existence as an employer in Finland d. Company X is one of the first companies that comes to mind when con-
sidering employers.

91
Attractiveness
6. Please rate your level of agreement with the following statement: I would consider Company X as my future employer.
a. Strongly agree b. Agree c. Disagree d. Strongly disagree e. Unable to answer
7. What are the 3 most favorable employers that you would like to work for? (Op-
tional question) 1) ______________ 2) ______________ 3) ______________
Attractiveness
8. Through what channels have you become aware of Company X? (Mark all that apply)
a. Company website b. Recruitment website c. Facebook d. Twitter e. LinkedIn f. Word of mouth g. Other channels, please specify: ______________
9. Are you familiar with Company X’s size as an employer? a. Small: < 50 employees b. Medium: 51-200 employees c. Medium large: 201-500 employees d. Large: > 501 employees e. Not familiar
10. Please rate your level of agreement with the following statement: I would consider Company X as my future employer.
a. Strongly agree b. Agree c. Disagree d. Strongly disagree e. Unable to answer
11. Have you applied to Company X before?
a. Yes, position (optional): ______________ b. No

92
12. What are the 3 most favorable employers that you would like to work for? (Optional question)
1) ______________ 2) ______________ 3) ______________
13. What kind of perception do you currently have of Company X as an employer?
a. Positive b. Neutral c. Negative d. Unable to answer
Reputation
14. Please rate your level of agreement with the following statements. Company X offers (a):
Strongly
agree Agree Disagree
Strongly
disagree
Unable to answer /
Not familiar
Competitive base salary
Good reference for future career
Variety of work tasks and responsi-
bilities
Friendly work environment
Exciting products
Prize drawing background questions
15. Do you have an I.D. valid in Finland? Note: If you have an I.D. valid in Finland, however would not like to participate in the drawing, please select ‘no’.
a. Yes b. No
16. In order to participate in the drawing for a chance to *****, please fill in the
contact information below: First Name: ______________ Last Name: ______________

93
Phone number: ______________ Email: ______________ City of residence: ______________
The winner of the drawing will be contacted personally via phone within the following two weeks. Good luck! Company X would like to thank you for your contribution and your time!

94
Attachment 3. Spearman’s correlation coefficient
Correlations How many years
have you lived in
Finland?
How familiar are
you with Company
X as an employer?
Spearman's
rho
How many years have you
lived in Finland?
Correlation Coefficient 1,000 -,086
Sig. (2-tailed) . ,336
N 127 127
How familiar are you with
Company X as an employer?
Correlation Coefficient -,086 1,000
Sig. (2-tailed) ,336 .
N 127 127