Embed Size (px)
Citation preview

1
Final Report In-car Mobile Signal Attenuation
Measurements
Contact person:
Mr. Saul Friedner
Tel: +44 (0)20 3740 6472
Mob: +44 (0) 7931 824500
Email: [email protected]
Final report
8th November 2017 LS telcom UK
Riverside House
Mezzanine Floor
2a Southwark Bridge Rd
London
SE1 9HA
UK
Tel: +44 (0) 20 3740 6470
Email: [email protected]
Internet: www.LStelcom.com
In-car Mobile Signal Attenuation Measurements
November 8, 2017 Page 2/50
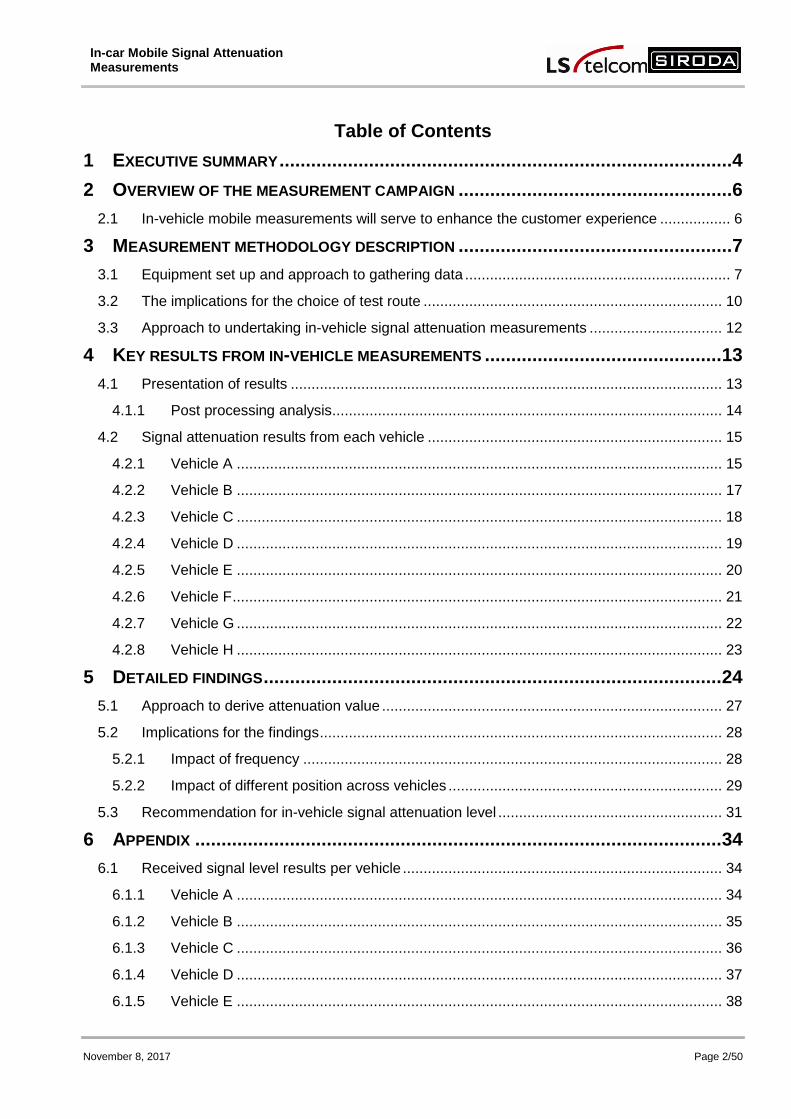
Table of Contents
1 EXECUTIVE SUMMARY ......................................................................................4
2 OVERVIEW OF THE MEASUREMENT CAMPAIGN ....................................................6
2.1 In-vehicle mobile measurements will serve to enhance the customer experience ................. 6
3 MEASUREMENT METHODOLOGY DESCRIPTION ....................................................7
3.1 Equipment set up and approach to gathering data ................................................................ 7
3.2 The implications for the choice of test route ........................................................................ 10
3.3 Approach to undertaking in-vehicle signal attenuation measurements ................................ 12
4 KEY RESULTS FROM IN-VEHICLE MEASUREMENTS ............................................. 13
4.1 Presentation of results ........................................................................................................ 13
4.1.1 Post processing analysis .............................................................................................. 14
4.2 Signal attenuation results from each vehicle ....................................................................... 15
4.2.1 Vehicle A ..................................................................................................................... 15
4.2.2 Vehicle B ..................................................................................................................... 17
4.2.3 Vehicle C ..................................................................................................................... 18
4.2.4 Vehicle D ..................................................................................................................... 19
4.2.5 Vehicle E ..................................................................................................................... 20
4.2.6 Vehicle F ...................................................................................................................... 21
4.2.7 Vehicle G ..................................................................................................................... 22
4.2.8 Vehicle H ..................................................................................................................... 23
5 DETAILED FINDINGS ....................................................................................... 24
5.1 Approach to derive attenuation value .................................................................................. 27
5.2 Implications for the findings ................................................................................................. 28
5.2.1 Impact of frequency ..................................................................................................... 28
5.2.2 Impact of different position across vehicles .................................................................. 29
5.3 Recommendation for in-vehicle signal attenuation level ...................................................... 31
6 APPENDIX .................................................................................................... 34
6.1 Received signal level results per vehicle ............................................................................. 34
6.1.1 Vehicle A ..................................................................................................................... 34
6.1.2 Vehicle B ..................................................................................................................... 35
6.1.3 Vehicle C ..................................................................................................................... 36
6.1.4 Vehicle D ..................................................................................................................... 37
6.1.5 Vehicle E ..................................................................................................................... 38
In-car Mobile Signal Attenuation Measurements
November 8, 2017 Page 3/50
6.1.6 Vehicle F ...................................................................................................................... 39
6.1.7 Vehicle G ..................................................................................................................... 40
6.1.8 Vehicle H ..................................................................................................................... 41
6.2 Range of RSRP and RSCP for console position across frequency and vehicle ................... 42
6.3 Coverage map of drive test route for LTE800 per position .................................................. 46
6.3.1 RSRP coverage roof position ....................................................................................... 46
6.3.2 RSRP coverage dash position ..................................................................................... 46
6.3.3 RSRP coverage console position ................................................................................. 47
6.3.4 RSRP coverage footwell position ................................................................................. 47
6.4 Impact on attenuation from an additional passenger ........................................................... 48
6.4.1 Vehicle with passenger ................................................................................................ 48
6.4.2 Vehicle without passenger ........................................................................................... 49
In-car Mobile Signal Attenuation Measurements
November 8, 2017 Page 4/50
1 Executive summary
This study was conducted by LS telcom UK and Siroda for Ofcom and involved using drive tests to
measure the attenuation of mobile signals in different frequency bands caused by a representative
range of different vehicle types. The key objective of the study was to better understand the effect of
vehicle signal losses and improve in-vehicle road coverage predictions for mobile services.
The measurements involved the use of four high speed TSMW scanners attached to different
antennas; one mounted on the roof of the vehicle, and three in different positions within the vehicle
(dashboard, console and foot-well). All of the four scanner measurements were made at the same
time to enable the level of attenuation caused by the vehicle in different locations within the vehicle to
be compared.
Eight different vehicle types were used in the tests, and their attenuation was measured along the
same 100km route through Berkshire which included a mix of urban, suburban and rural areas. This
approach enabled mobile signal level data to be captured across all the mobile frequencies of
interest; 800 MHz, 900 MHz, 1800 MHz, 2100 MHz and 2600 MHz.
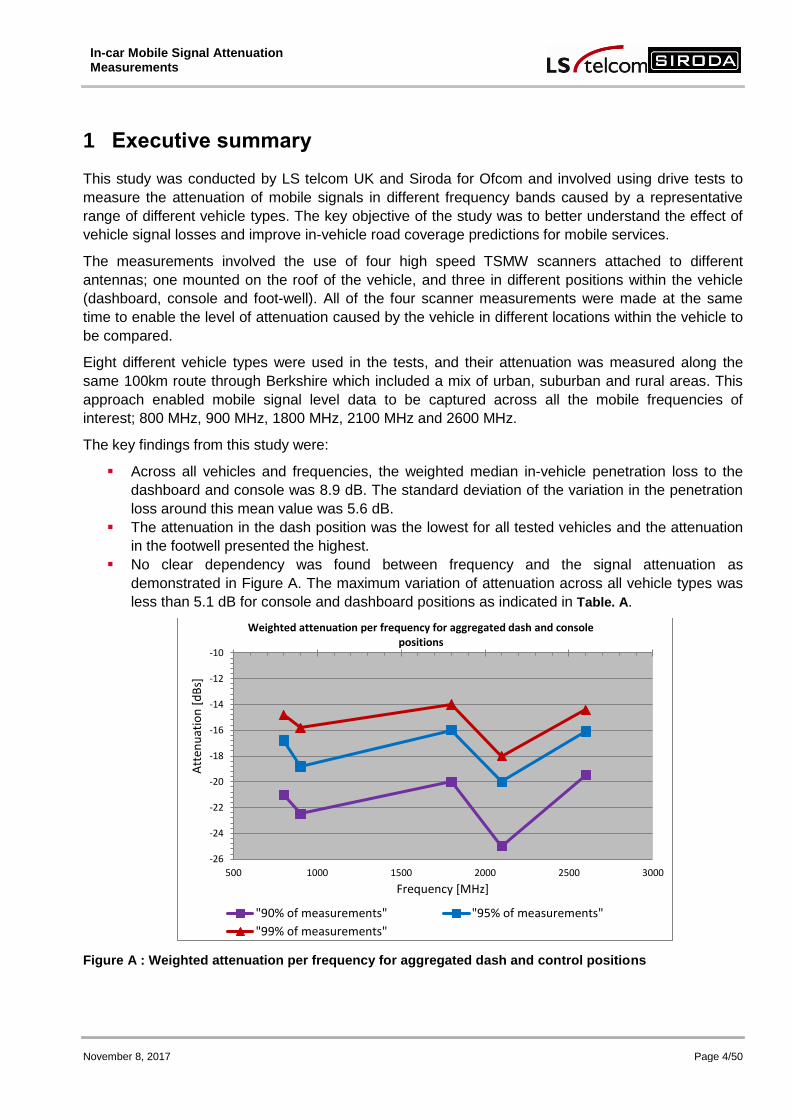
The key findings from this study were:
▪ Across all vehicles and frequencies, the weighted median in-vehicle penetration loss to the
dashboard and console was 8.9 dB. The standard deviation of the variation in the penetration
loss around this mean value was 5.6 dB.
▪ The attenuation in the dash position was the lowest for all tested vehicles and the attenuation
in the footwell presented the highest.
▪ No clear dependency was found between frequency and the signal attenuation as
demonstrated in Figure A. The maximum variation of attenuation across all vehicle types was
less than 5.1 dB for console and dashboard positions as indicated in Table. A.
Figure A : Weighted attenuation per frequency for aggregated dash and control positions
-26
-24
-22
-20
-18
-16
-14
-12
-10
500 1000 1500 2000 2500 3000
Att
enu
atio
n [
dB
s]
Frequency [MHz]
Weighted attenuation per frequency for aggregated dash and console positions
"90% of measurements" "95% of measurements"
"99% of measurements"
In-car Mobile Signal Attenuation Measurements
November 8, 2017 Page 5/50
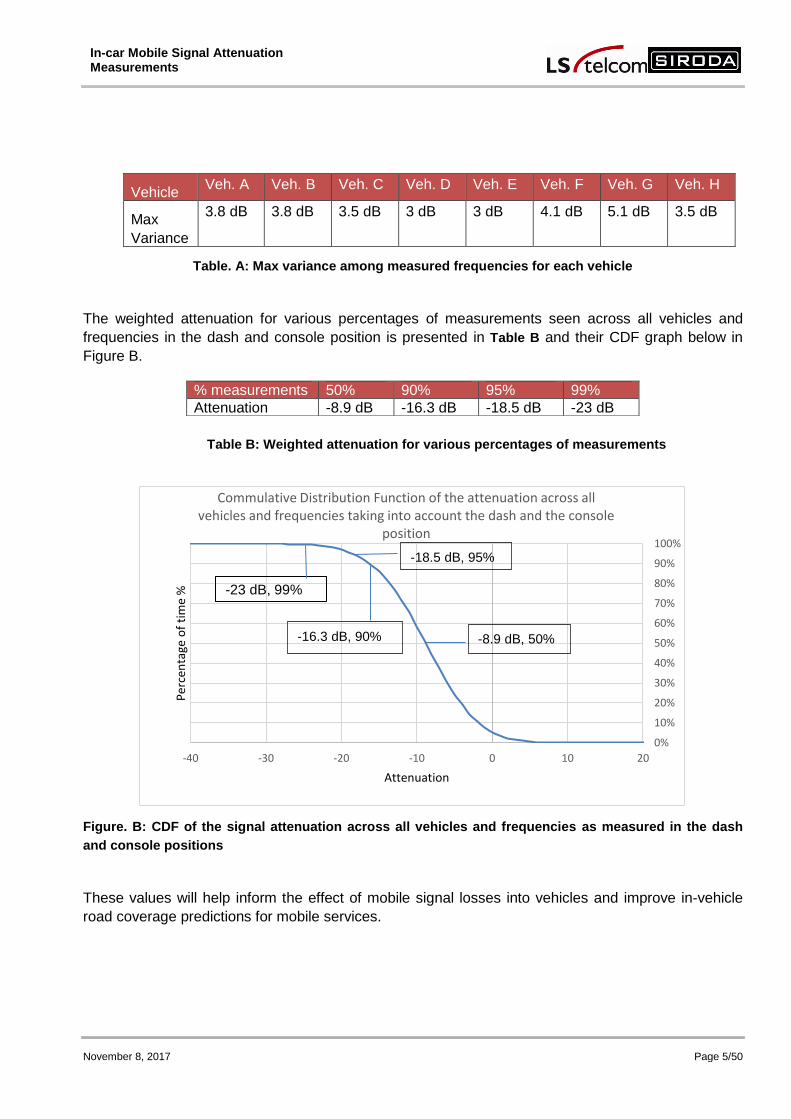
Vehicle Veh. A Veh. B Veh. C Veh. D Veh. E Veh. F Veh. G Veh. H
Max
Variance
3.8 dB 3.8 dB 3.5 dB 3 dB 3 dB 4.1 dB 5.1 dB 3.5 dB
Table. A: Max variance among measured frequencies for each vehicle
The weighted attenuation for various percentages of measurements seen across all vehicles and
frequencies in the dash and console position is presented in Table B and their CDF graph below in
Figure B.
Table B: Weighted attenuation for various percentages of measurements
Figure. B: CDF of the signal attenuation across all vehicles and frequencies as measured in the dash
and console positions
These values will help inform the effect of mobile signal losses into vehicles and improve in-vehicle
road coverage predictions for mobile services.
0%
10%
20%
30%
40%
50%
60%
70%
80%
90%
100%
-40 -30 -20 -10 0 10 20
Per
cen
tage
of
tim
e %
Attenuation
Commulative Distribution Function of the attenuation across all vehicles and frequencies taking into account the dash and the console
position
-23 dB, 99%
-16.3 dB, 90%
-18.5 dB, 95%
-8.9 dB, 50%
% measurements 50% 90% 95% 99%
Attenuation -8.9 dB -16.3 dB -18.5 dB -23 dB

In-car Mobile Signal Attenuation Measurements
November 8, 2017 Page 6/50
2 Overview of the measurement campaign
2.1 In-vehicle mobile measurements will serve to enhance the customer experience
The use of mobile phones is ubiquitous and coverage of 4G cellular networks has expanded to almost
98% of UK premises outdoor1. The availability of the different services varies from location to location
(urban and rural) however, there has been increasing levels of 4G coverage from all the operators in
underserved areas. Ofcom regularly provides an update on the UK communications market via its
Communications Market Report1 which includes how both coverage and performance from across the
mobile operators has changed from the previous year.
In addition, Ofcom has gathered increasingly more informative data on coverage and quality of
experience for consumers including call quality of networks and performance of different types of
handsets. Therefore, given the developments in the type of materials used to manufacture vehicles,
Ofcom would like to better understand the signal attenuation inside vehicles for consumers using their
mobile phones.
In the early years of the mobile industry, in-vehicle car phones were the most common type of
handset available and these professionally installed equipment complete with fixed cradle, external
antenna and dedicated handset design for the vehicle. As new mobile technology generations
emerged, the in-vehicle installations evolved, with cradles mounted on the windscreen or centre
console and some with or without external antennas. In parallel, the car body materials have
changed, so too the interiors, windows and sunroofs each potentially causing a variation of the signal
attenuation.
Furthermore, mobile coverage along the roads is critical for both public services (i.e. emergency
services) and connectivity for consumers. In this study, we have examined the impact of mobile
phone use in different types of vehicle and particularly the position of the handsets and the impact this
has to user performance for a range of frequency bands.
The position of the handset in the vehicle is important because depending on where the handset is
located could greatly reduce the quality of experience and lose service completely. Therefore, Ofcom
would like to gain a better understanding of mobile phone usage on the road network and also
develop a figure for in-vehicle signal attenuation that could be used for planning and prediction
exercises of mobile networks for road coverage.
This study also demonstrates how not only the car body material impacts the signal attenuation but
also the position of the handset in the vehicle. This may help Ofcom provide further consumer
information to both the car industry and consumers themselves in the most suitable position for a
mobile phone inside vehicles to ensure optimum quality of experience.
1 Communications Market Report, Ofcom 2016
In-car Mobile Signal Attenuation Measurements
November 8, 2017 Page 7/50
3 Measurement methodology description
In this section we describe our approach to the in-vehicle signal attenuation measurement that we have undertaken for Ofcom.
3.1 Equipment set up and approach to gathering data
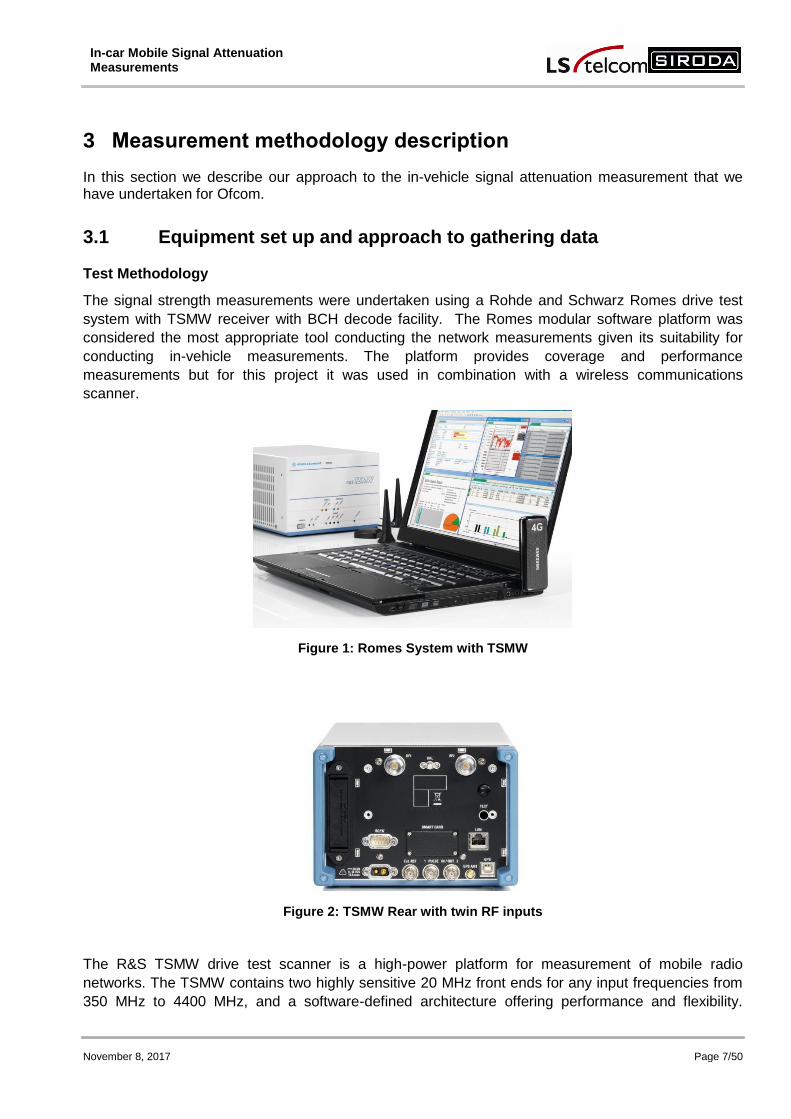
Test Methodology
The signal strength measurements were undertaken using a Rohde and Schwarz Romes drive test
system with TSMW receiver with BCH decode facility. The Romes modular software platform was
considered the most appropriate tool conducting the network measurements given its suitability for
conducting in-vehicle measurements. The platform provides coverage and performance
measurements but for this project it was used in combination with a wireless communications
scanner.
Figure 1: Romes System with TSMW
Figure 2: TSMW Rear with twin RF inputs
The R&S TSMW drive test scanner is a high-power platform for measurement of mobile radio
networks. The TSMW contains two highly sensitive 20 MHz front ends for any input frequencies from
350 MHz to 4400 MHz, and a software-defined architecture offering performance and flexibility.
In-car Mobile Signal Attenuation Measurements
November 8, 2017 Page 8/50
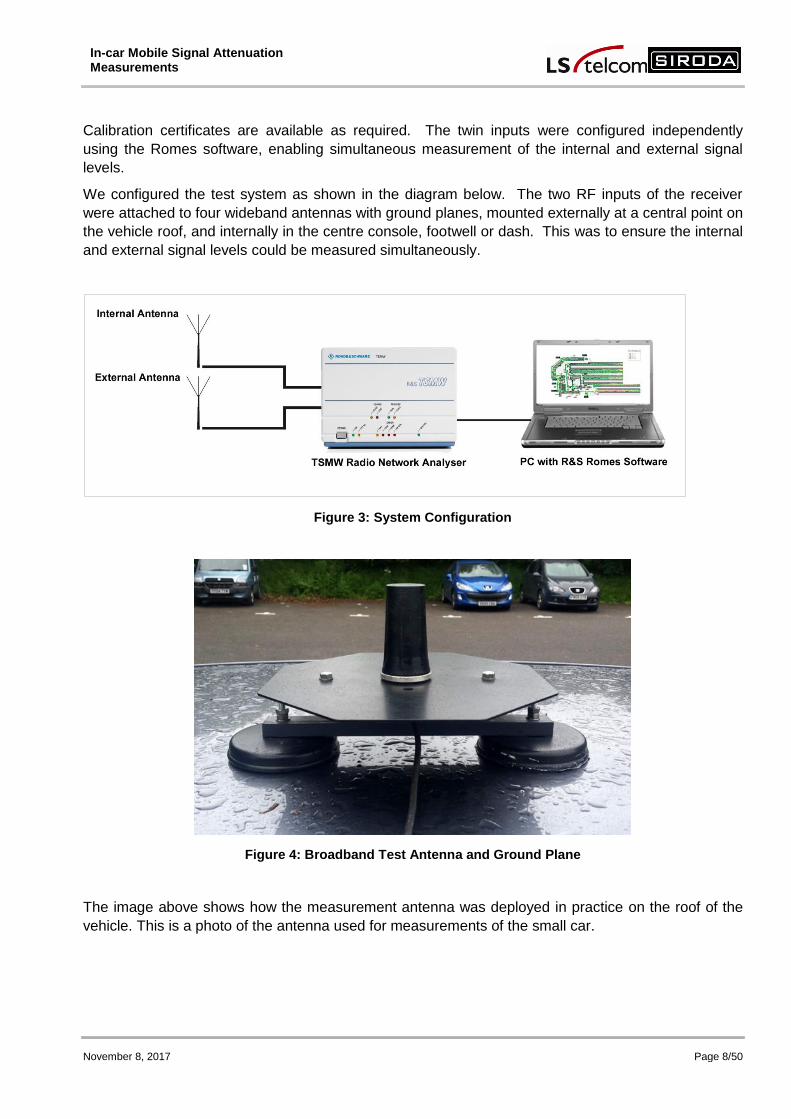
Calibration certificates are available as required. The twin inputs were configured independently
using the Romes software, enabling simultaneous measurement of the internal and external signal
levels.
We configured the test system as shown in the diagram below. The two RF inputs of the receiver
were attached to four wideband antennas with ground planes, mounted externally at a central point on
the vehicle roof, and internally in the centre console, footwell or dash. This was to ensure the internal
and external signal levels could be measured simultaneously.
Figure 3: System Configuration
Figure 4: Broadband Test Antenna and Ground Plane
The image above shows how the measurement antenna was deployed in practice on the roof of the
vehicle. This is a photo of the antenna used for measurements of the small car.
In-car Mobile Signal Attenuation Measurements
November 8, 2017 Page 9/50
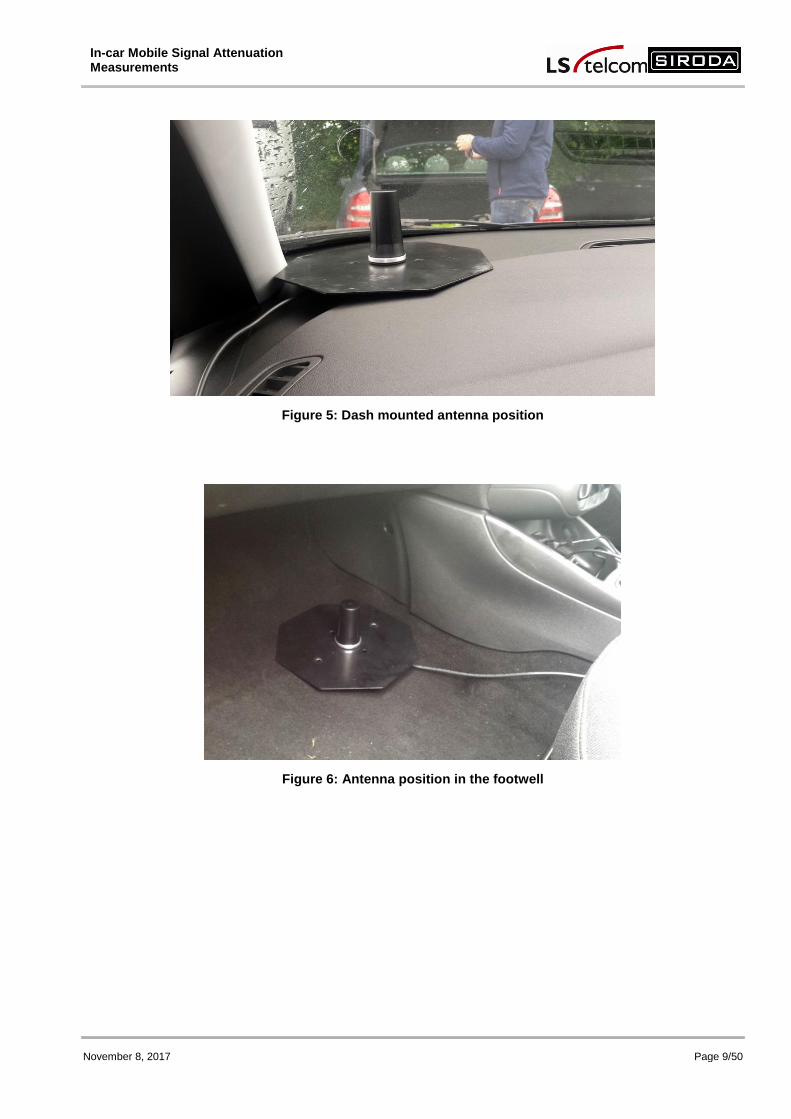
Figure 5: Dash mounted antenna position
Figure 6: Antenna position in the footwell
In-car Mobile Signal Attenuation Measurements
November 8, 2017 Page 10/50
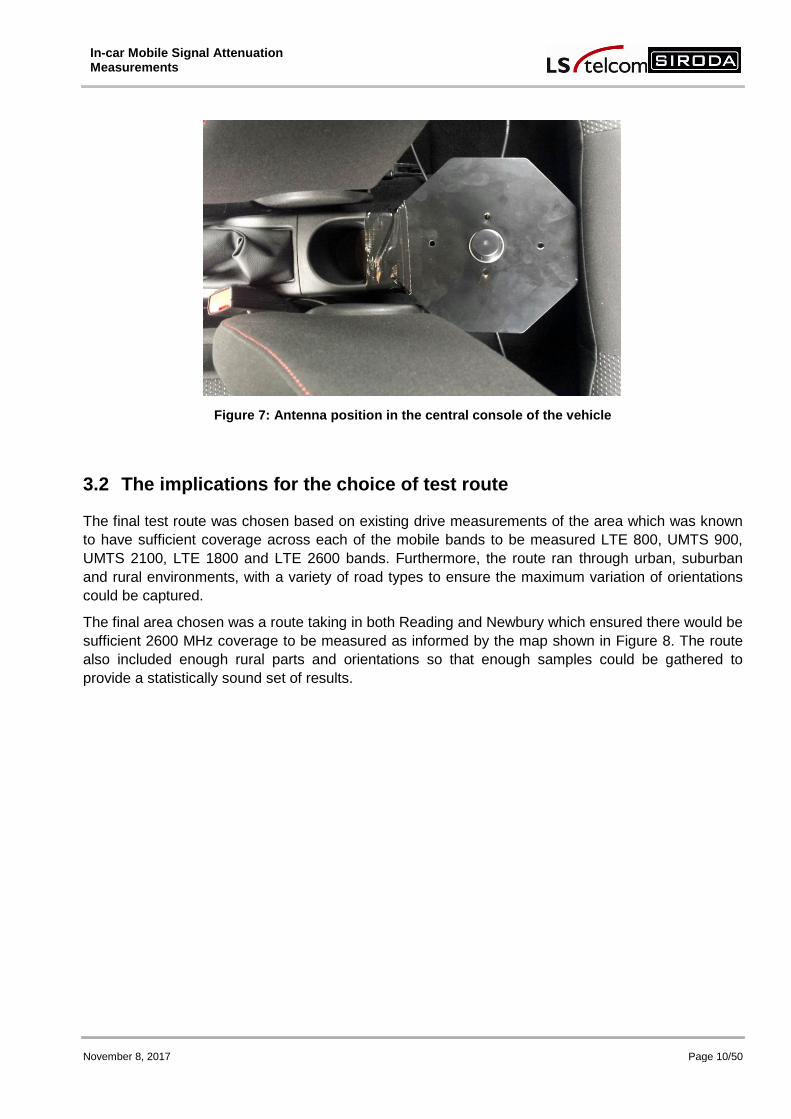
Figure 7: Antenna position in the central console of the vehicle
3.2 The implications for the choice of test route
The final test route was chosen based on existing drive measurements of the area which was known
to have sufficient coverage across each of the mobile bands to be measured LTE 800, UMTS 900,
UMTS 2100, LTE 1800 and LTE 2600 bands. Furthermore, the route ran through urban, suburban
and rural environments, with a variety of road types to ensure the maximum variation of orientations
could be captured.
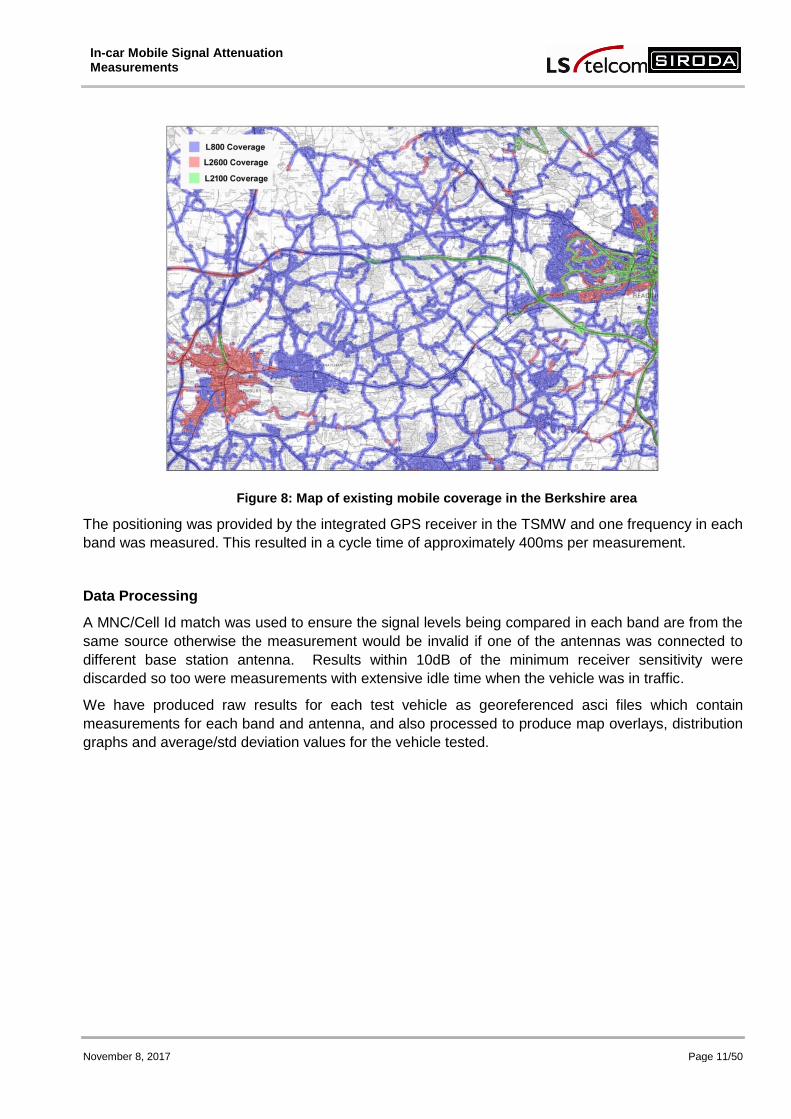
The final area chosen was a route taking in both Reading and Newbury which ensured there would be
sufficient 2600 MHz coverage to be measured as informed by the map shown in Figure 8. The route
also included enough rural parts and orientations so that enough samples could be gathered to
provide a statistically sound set of results.
In-car Mobile Signal Attenuation Measurements
November 8, 2017 Page 11/50
Figure 8: Map of existing mobile coverage in the Berkshire area
The positioning was provided by the integrated GPS receiver in the TSMW and one frequency in each
band was measured. This resulted in a cycle time of approximately 400ms per measurement.
Data Processing
A MNC/Cell Id match was used to ensure the signal levels being compared in each band are from the
same source otherwise the measurement would be invalid if one of the antennas was connected to
different base station antenna. Results within 10dB of the minimum receiver sensitivity were
discarded so too were measurements with extensive idle time when the vehicle was in traffic.
We have produced raw results for each test vehicle as georeferenced asci files which contain
measurements for each band and antenna, and also processed to produce map overlays, distribution
graphs and average/std deviation values for the vehicle tested.
In-car Mobile Signal Attenuation Measurements
November 8, 2017 Page 12/50
3.3 Approach to undertaking in-vehicle signal attenuation measurements
The measurements were conducted by Siroda, who were responsible for supplying and setting up the
equipment and ensuring sufficient data was gathered from the measurement campaigns of each of
the vehicles. The set up required a consistent approach for conducting the tests and driving the same
route to ensure the results were comparable.
We were able to source and test all the specific vehicle models required by Ofcom which included:
1. Vehicle A popular small car
2. Vehicle B popular small car
3. Vehicle C popular hybrid
4. Vehicle D popular executive style car
5. Vehicle E popular executive style car
6. Vehicle F popular van
7. Vehicle G popular SUV
8. Vehicle H fully electric
The in-vehicle measurements used two scanners so that the three internal and one external antenna
positions could be measured at the same time. Bench testing was undertaken in each band to confirm
there was no variation in performance between each receiver input.
The test set up was repeated for each vehicle using the antenna positions as suggested by Ofcom
which included:
1. The car manufacturer installed handset cradle, if one is present, otherwise a windscreen
mounted cradle;
2. The central console storage area (typical location a user may place the handset if they were to
use Bluetooth handset);
3. Footwell area at the seat next to the driver’s seat.
In practice, given the range of different interiors for each of the cars, the mounting positions chosen
were dependent on a mix of convenience of attachment and alignment against the suggested
positions.
The route was agreed with Ofcom to take into account urban, suburban and rural areas and to ensure
a variety of received signal angles, which meant not too many long straight roads.
We shared the first set of raw measurement results with Ofcom after the first week of testing for one
vehicle. This was to ensure the results gathered were as expected and the relevant main data
captured (i.e. includes time, location and frequency details). It became apparent from Ofcom’s
feedback to the results that more samples were needed and the route extended.
It should be noted that the duration of the route is traffic dependent and when idle measurements are
not used. Therefore, the balance of samples for each band varied depending on where the delays
occur. For example, if in Reading, then proportionally, we gathered more 2600MHz readings and if
out of town, then more 800MHz measurements were gathered.
Furthermore, the number of samples will also depend to an extent on the characteristics of the
vehicle, as there needs to be a match between all 4 antenna measurements to get a result. In the
following sections, it is explained how this these deviations were taken into account.
In-car Mobile Signal Attenuation Measurements
November 8, 2017 Page 13/50
4 Key results from in-vehicle measurements
In this chapter, we present the key results from the in-vehicle measurements undertaken. This
includes making comparisons between some of the results which show the signal level recorded for
each of the positions and frequency bands and also the delta between the measurements at the
rooftop and those inside the vehicle. We refer to this delta as the attenuation.
4.1 Presentation of results
The raw data was gathered from four antennas mounted to the vehicle. One antenna was placed on
the rooftop and the other antennas in three designated positions inside the vehicle. The appropriate
signal level measurement was taken for each frequency band and technology as shown below:
▪ RSCP in dBm for UMTS 900/2100 MHz
▪ RSRP in dBm for LTE 800/1800/2600 MHz
We present the results of the measurements from the three following positions inside the vehicle:
▪ Dash
▪ Console
▪ Footwell
We calculate the difference in signal level (RSSI attenuation and RSRP attenuation) by subtracting
the signal level measured inside the vehicle from the signal level measured from the rooftop antenna.
We then use this level to determine the range of signal levels for each position. We present the core
high level results which show the mean, median and standard deviation of the measurements for
each position in the vehicle and each band to make comparisons. For example, we can identify from
the results how each of the vehicles compares in terms of attenuation for different frequency bands
and the positions of the antennas in the vehicle.
In-car Mobile Signal Attenuation Measurements
November 8, 2017 Page 14/50
4.1.1 Post processing analysis
Thousands of samples were gathered for each drive test across each of the frequency bands. This
number of samples (ranging from 3,000 to 11,500 depending on the frequency) enabled us to plot the
distribution of the signal level in each position for each vehicle and for each frequency.
However, given the processing of the large number of samples and the statistical variation that can be
introduced we also calculated the median and standard deviation values. As it is shown in the
dedicated results section of the document, the standard deviation calculated for each frequency was
very similar (within 1-2 dBs).
A description of the post processing methodology to derive a generalised value of the signal
attenuation is summarised below:
1. We calculated the delta between the antenna rooftop measurements and the antenna at each
position in each vehicle for every frequency.
2. We calculated the impact of the frequency for each vehicle and position
3. We calculated the impact of each position across the vehicles
4. Based on the consistently poor results (highest attenuation in most cases) for the footwell this
position was disregarded in the derivation of the final vehicle penetration loss.
5. We categorised each occurrence of the delta value for each position (console and dash) and
each frequency for every car. For example, using a range of 10 dB to -42 dB in 1 dB steps we
determined how many times each value was recorded. We then aggregated these values in a
single table which provided a representative picture of the delta occurrences for each car.
6. We determined and applied a weighting of the attenuation based on the market share across
all eight vehicles.
7. After applying the weighting factors, we added the weighted occurrences to produce the
picture of all eight vehicles.
8. By producing the CDF of the results, we were able to calculate the attenuation of 50%, 90%,
95%, 99% of the measurements.
In-car Mobile Signal Attenuation Measurements
November 8, 2017 Page 15/50
4.2 Signal attenuation results from each vehicle
The following sub-sections provide an overview of the results from the measurements of each vehicle.
Each of the tables presents the mean attenuation for each frequency band and position in the vehicle.
The objective of presenting these results was to identify particular trends in the attenuation levels
between the vehicles, internal antenna positions and the frequency bands.
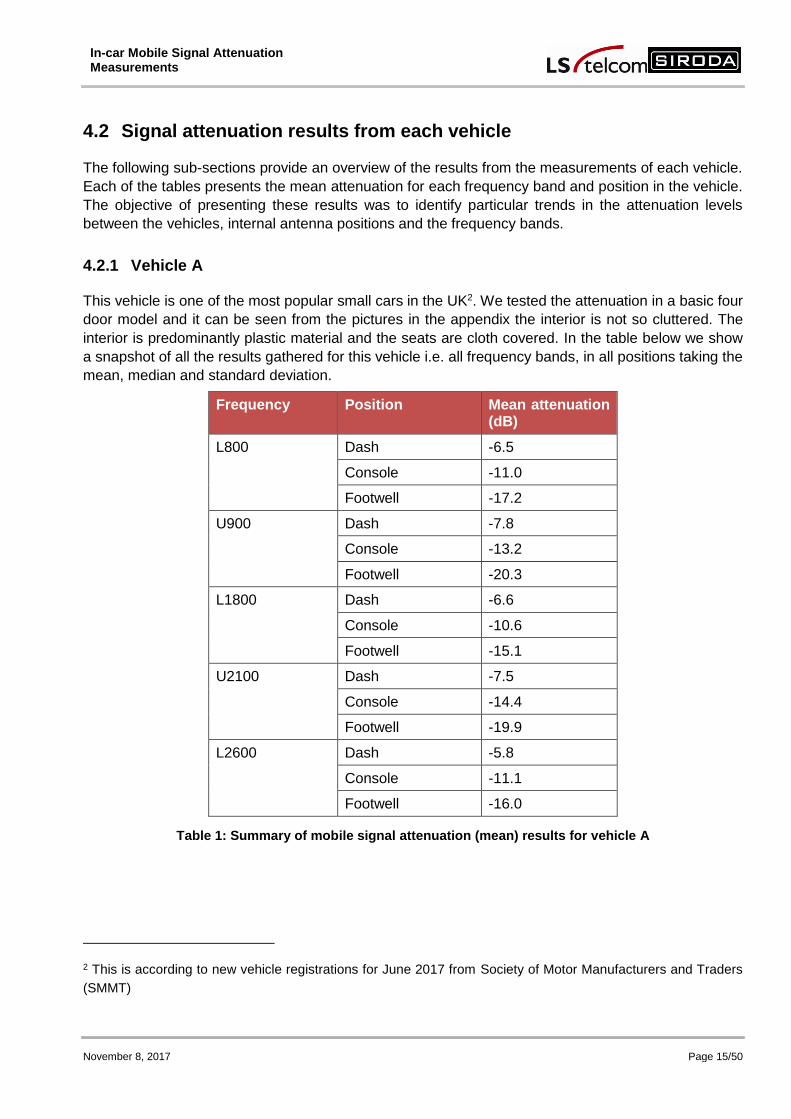
4.2.1 Vehicle A
This vehicle is one of the most popular small cars in the UK2. We tested the attenuation in a basic four
door model and it can be seen from the pictures in the appendix the interior is not so cluttered. The
interior is predominantly plastic material and the seats are cloth covered. In the table below we show
a snapshot of all the results gathered for this vehicle i.e. all frequency bands, in all positions taking the
mean, median and standard deviation.
Frequency Position Mean attenuation (dB)
L800 Dash -6.5
Console -11.0
Footwell -17.2
U900 Dash -7.8
Console -13.2
Footwell -20.3
L1800 Dash -6.6
Console -10.6
Footwell -15.1
U2100 Dash -7.5
Console -14.4
Footwell -19.9
L2600 Dash -5.8
Console -11.1
Footwell -16.0
Table 1: Summary of mobile signal attenuation (mean) results for vehicle A
2 This is according to new vehicle registrations for June 2017 from Society of Motor Manufacturers and Traders
(SMMT)
In-car Mobile Signal Attenuation Measurements
November 8, 2017 Page 16/50
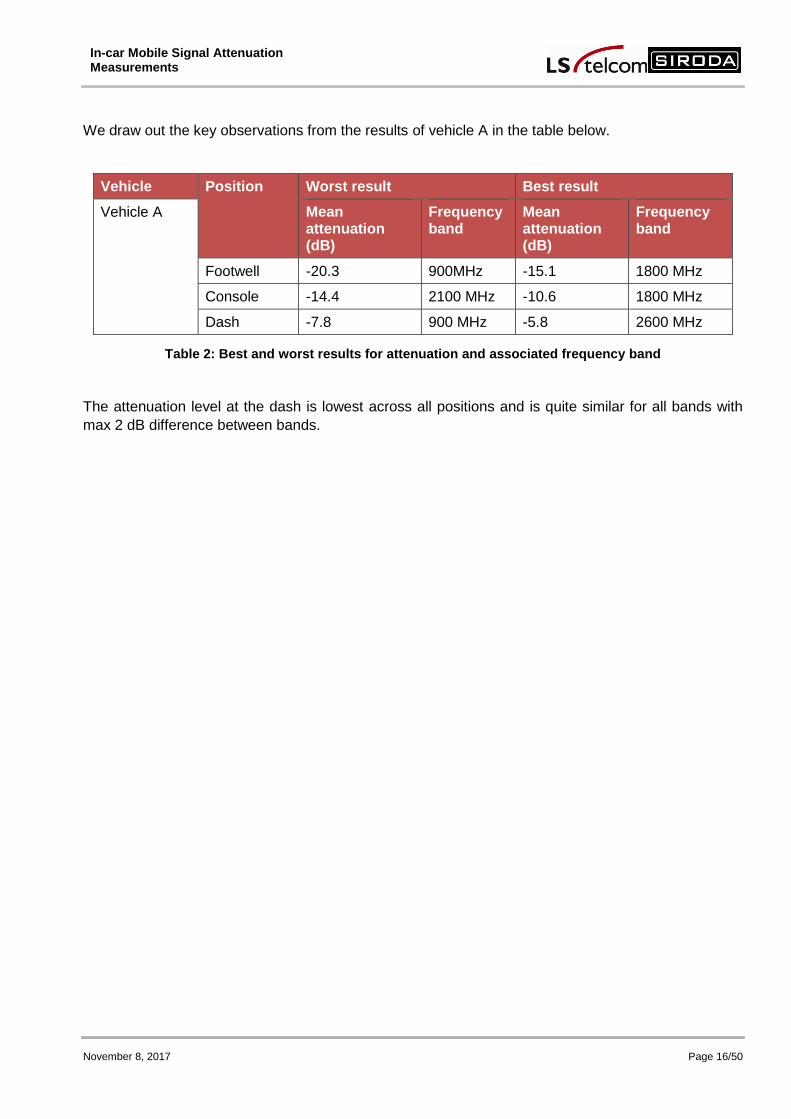
We draw out the key observations from the results of vehicle A in the table below.
Vehicle Position Worst result Best result
Vehicle A Mean attenuation (dB)
Frequency band
Mean attenuation (dB)
Frequency band
Footwell -20.3 900MHz -15.1 1800 MHz
Console -14.4 2100 MHz -10.6 1800 MHz
Dash -7.8 900 MHz -5.8 2600 MHz
Table 2: Best and worst results for attenuation and associated frequency band
The attenuation level at the dash is lowest across all positions and is quite similar for all bands with
max 2 dB difference between bands.
In-car Mobile Signal Attenuation Measurements
November 8, 2017 Page 17/50
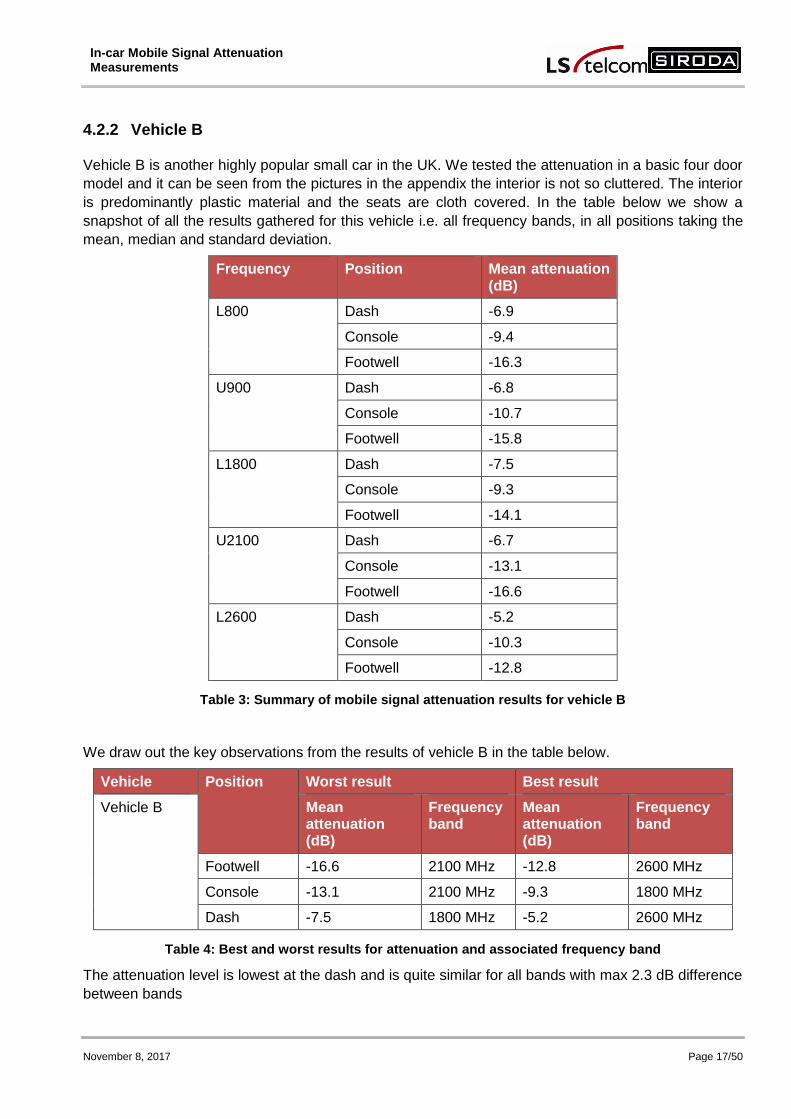
4.2.2 Vehicle B
Vehicle B is another highly popular small car in the UK. We tested the attenuation in a basic four door
model and it can be seen from the pictures in the appendix the interior is not so cluttered. The interior
is predominantly plastic material and the seats are cloth covered. In the table below we show a
snapshot of all the results gathered for this vehicle i.e. all frequency bands, in all positions taking the
mean, median and standard deviation.
Frequency Position Mean attenuation (dB)
L800 Dash -6.9
Console -9.4
Footwell -16.3
U900 Dash -6.8
Console -10.7
Footwell -15.8
L1800 Dash -7.5
Console -9.3
Footwell -14.1
U2100 Dash -6.7
Console -13.1
Footwell -16.6
L2600 Dash -5.2
Console -10.3
Footwell -12.8
Table 3: Summary of mobile signal attenuation results for vehicle B
We draw out the key observations from the results of vehicle B in the table below.
Vehicle Position Worst result Best result
Vehicle B Mean attenuation (dB)
Frequency band
Mean attenuation (dB)
Frequency band
Footwell -16.6 2100 MHz -12.8 2600 MHz
Console -13.1 2100 MHz -9.3 1800 MHz
Dash -7.5 1800 MHz -5.2 2600 MHz
Table 4: Best and worst results for attenuation and associated frequency band
The attenuation level is lowest at the dash and is quite similar for all bands with max 2.3 dB difference
between bands
In-car Mobile Signal Attenuation Measurements
November 8, 2017 Page 18/50
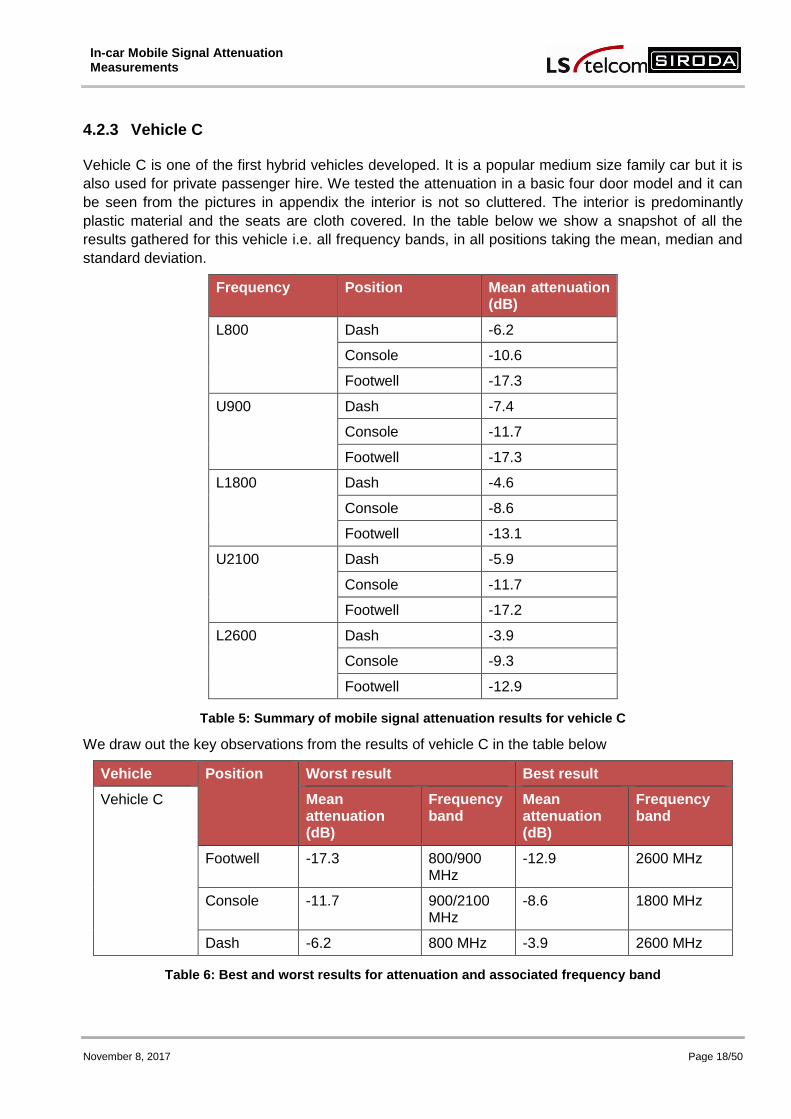
4.2.3 Vehicle C
Vehicle C is one of the first hybrid vehicles developed. It is a popular medium size family car but it is
also used for private passenger hire. We tested the attenuation in a basic four door model and it can
be seen from the pictures in appendix the interior is not so cluttered. The interior is predominantly
plastic material and the seats are cloth covered. In the table below we show a snapshot of all the
results gathered for this vehicle i.e. all frequency bands, in all positions taking the mean, median and
standard deviation.
Frequency Position Mean attenuation (dB)
L800 Dash -6.2
Console -10.6
Footwell -17.3
U900 Dash -7.4
Console -11.7
Footwell -17.3
L1800 Dash -4.6
Console -8.6
Footwell -13.1
U2100 Dash -5.9
Console -11.7
Footwell -17.2
L2600 Dash -3.9
Console -9.3
Footwell -12.9
Table 5: Summary of mobile signal attenuation results for vehicle C
We draw out the key observations from the results of vehicle C in the table below
Vehicle Position Worst result Best result
Vehicle C Mean attenuation (dB)
Frequency band
Mean attenuation (dB)
Frequency band
Footwell -17.3 800/900 MHz
-12.9 2600 MHz
Console -11.7 900/2100 MHz
-8.6 1800 MHz
Dash -6.2 800 MHz -3.9 2600 MHz
Table 6: Best and worst results for attenuation and associated frequency band
In-car Mobile Signal Attenuation Measurements
November 8, 2017 Page 19/50
The attenuation level at the dash is lowest and is quite similar for all bands with max 3.5 dB difference between bands.
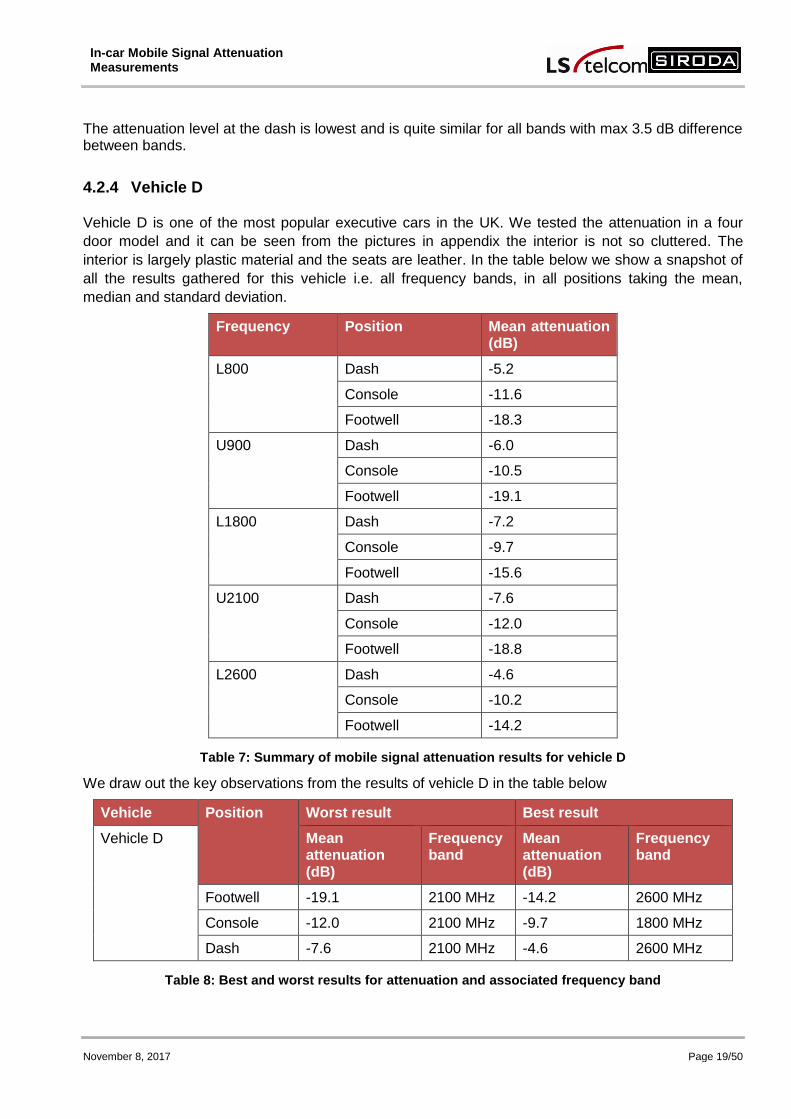
4.2.4 Vehicle D
Vehicle D is one of the most popular executive cars in the UK. We tested the attenuation in a four
door model and it can be seen from the pictures in appendix the interior is not so cluttered. The
interior is largely plastic material and the seats are leather. In the table below we show a snapshot of
all the results gathered for this vehicle i.e. all frequency bands, in all positions taking the mean,
median and standard deviation.
Frequency Position Mean attenuation (dB)
L800 Dash -5.2
Console -11.6
Footwell -18.3
U900 Dash -6.0
Console -10.5
Footwell -19.1
L1800 Dash -7.2
Console -9.7
Footwell -15.6
U2100 Dash -7.6
Console -12.0
Footwell -18.8
L2600 Dash -4.6
Console -10.2
Footwell -14.2
Table 7: Summary of mobile signal attenuation results for vehicle D
We draw out the key observations from the results of vehicle D in the table below
Vehicle Position Worst result Best result
Vehicle D Mean attenuation (dB)
Frequency band
Mean attenuation (dB)
Frequency band
Footwell -19.1 2100 MHz -14.2 2600 MHz
Console -12.0 2100 MHz -9.7 1800 MHz
Dash -7.6 2100 MHz -4.6 2600 MHz
Table 8: Best and worst results for attenuation and associated frequency band
In-car Mobile Signal Attenuation Measurements
November 8, 2017 Page 20/50
The attenuation level at the dash is lowest and is quite similar for all bands with max 3 dB difference
between bands.
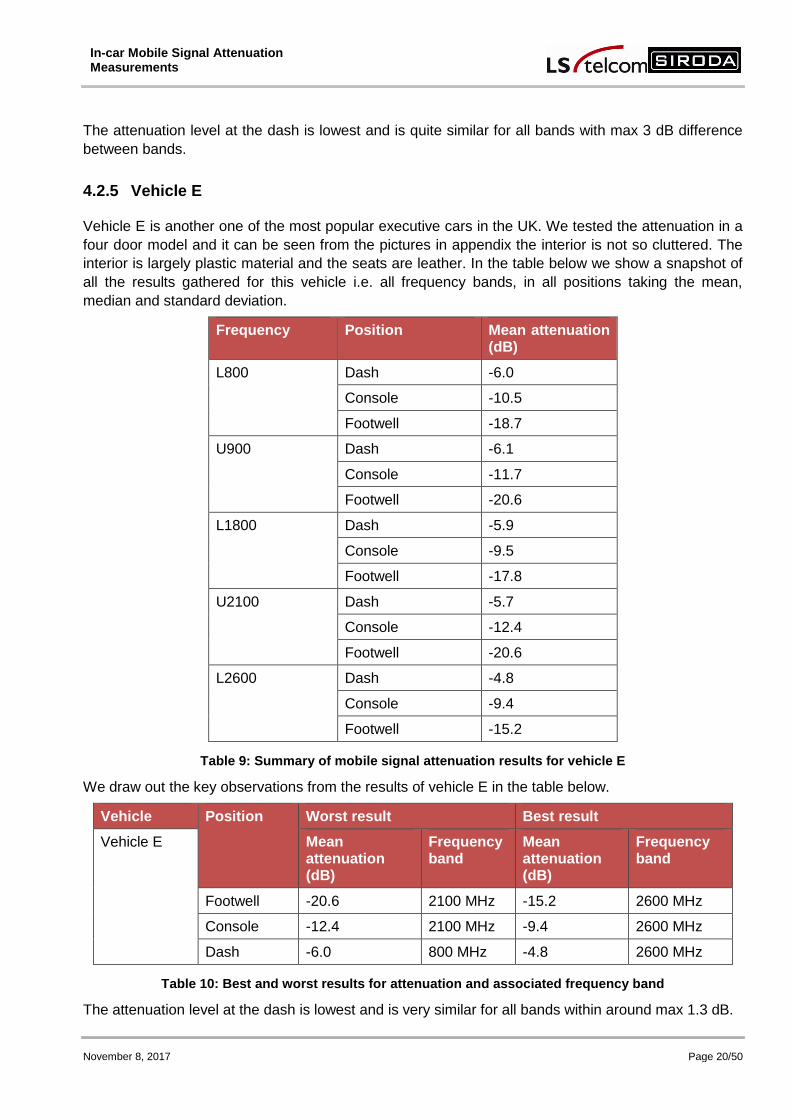
4.2.5 Vehicle E
Vehicle E is another one of the most popular executive cars in the UK. We tested the attenuation in a
four door model and it can be seen from the pictures in appendix the interior is not so cluttered. The
interior is largely plastic material and the seats are leather. In the table below we show a snapshot of
all the results gathered for this vehicle i.e. all frequency bands, in all positions taking the mean,
median and standard deviation.
Frequency Position Mean attenuation (dB)
L800 Dash -6.0
Console -10.5
Footwell -18.7
U900 Dash -6.1
Console -11.7
Footwell -20.6
L1800 Dash -5.9
Console -9.5
Footwell -17.8
U2100 Dash -5.7
Console -12.4
Footwell -20.6
L2600 Dash -4.8
Console -9.4
Footwell -15.2
Table 9: Summary of mobile signal attenuation results for vehicle E
We draw out the key observations from the results of vehicle E in the table below.
Vehicle Position Worst result Best result
Vehicle E Mean attenuation (dB)
Frequency band
Mean attenuation (dB)
Frequency band
Footwell -20.6 2100 MHz -15.2 2600 MHz
Console -12.4 2100 MHz -9.4 2600 MHz
Dash -6.0 800 MHz -4.8 2600 MHz
Table 10: Best and worst results for attenuation and associated frequency band
The attenuation level at the dash is lowest and is very similar for all bands within around max 1.3 dB.
In-car Mobile Signal Attenuation Measurements
November 8, 2017 Page 21/50
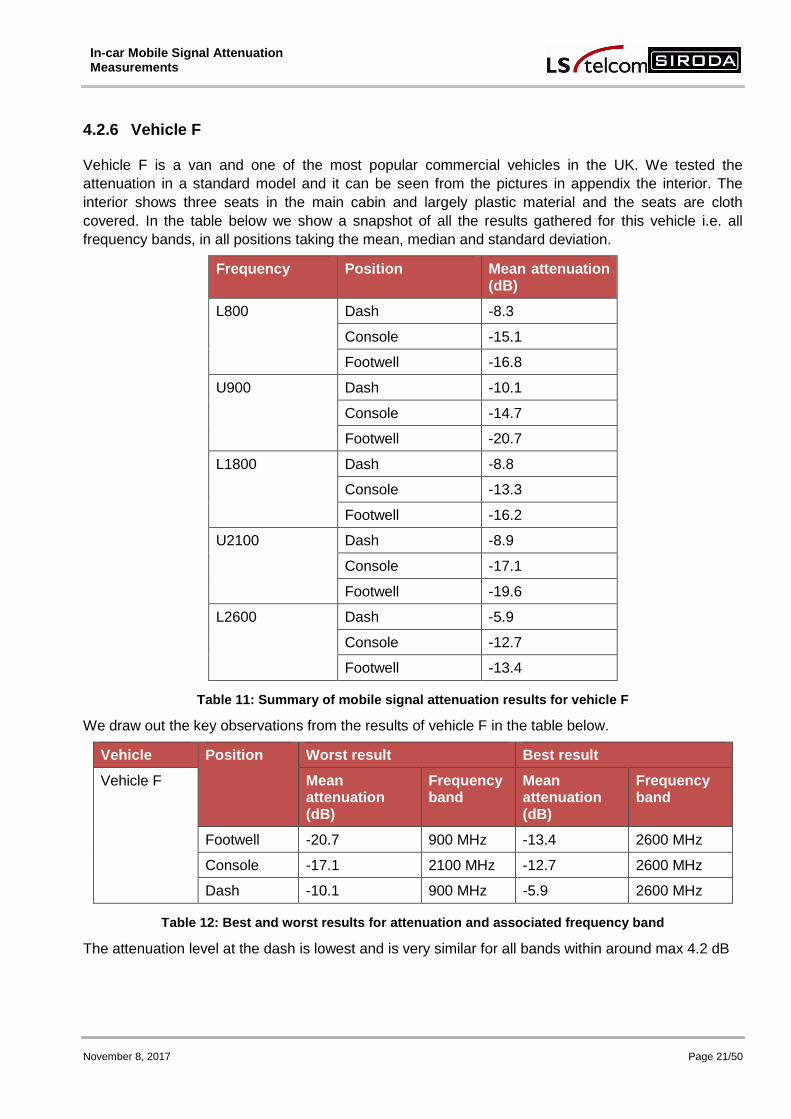
4.2.6 Vehicle F
Vehicle F is a van and one of the most popular commercial vehicles in the UK. We tested the
attenuation in a standard model and it can be seen from the pictures in appendix the interior. The
interior shows three seats in the main cabin and largely plastic material and the seats are cloth
covered. In the table below we show a snapshot of all the results gathered for this vehicle i.e. all
frequency bands, in all positions taking the mean, median and standard deviation.
Frequency Position Mean attenuation (dB)
L800 Dash -8.3
Console -15.1
Footwell -16.8
U900 Dash -10.1
Console -14.7
Footwell -20.7
L1800 Dash -8.8
Console -13.3
Footwell -16.2
U2100 Dash -8.9
Console -17.1
Footwell -19.6
L2600 Dash -5.9
Console -12.7
Footwell -13.4
Table 11: Summary of mobile signal attenuation results for vehicle F
We draw out the key observations from the results of vehicle F in the table below.
Vehicle Position Worst result Best result
Vehicle F Mean attenuation (dB)
Frequency band
Mean attenuation (dB)
Frequency band
Footwell -20.7 900 MHz -13.4 2600 MHz
Console -17.1 2100 MHz -12.7 2600 MHz
Dash -10.1 900 MHz -5.9 2600 MHz
Table 12: Best and worst results for attenuation and associated frequency band
The attenuation level at the dash is lowest and is very similar for all bands within around max 4.2 dB
In-car Mobile Signal Attenuation Measurements
November 8, 2017 Page 22/50
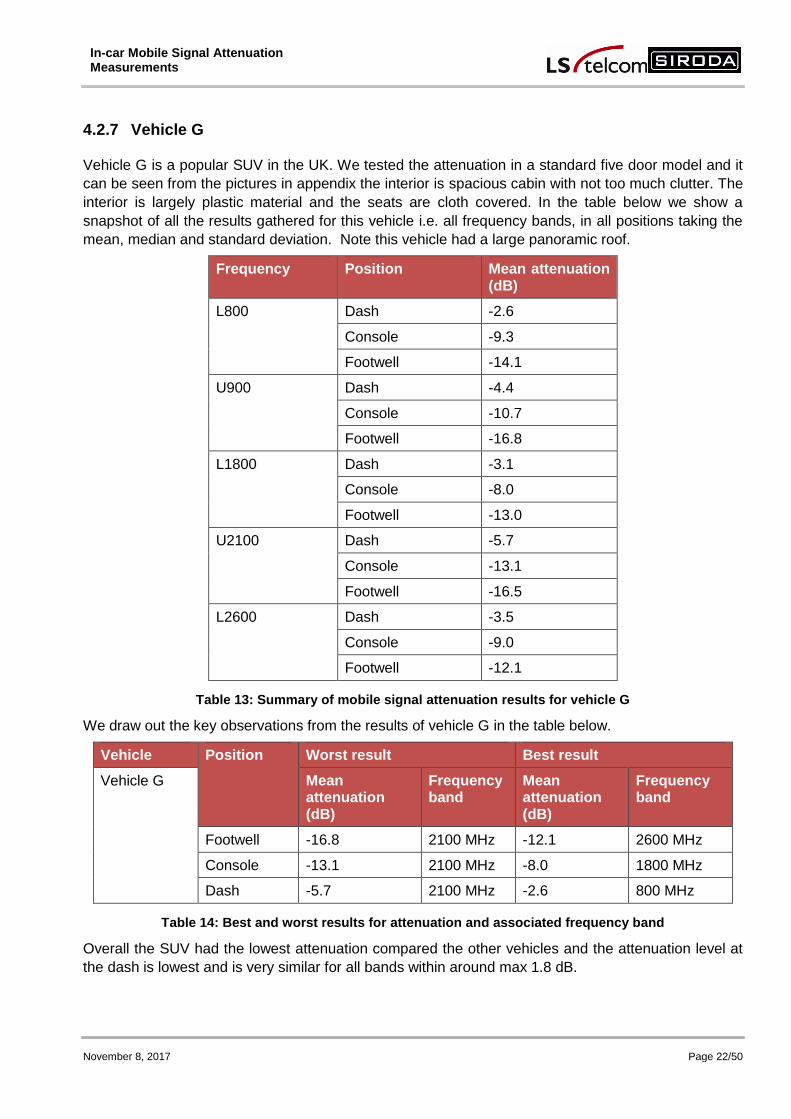
4.2.7 Vehicle G
Vehicle G is a popular SUV in the UK. We tested the attenuation in a standard five door model and it
can be seen from the pictures in appendix the interior is spacious cabin with not too much clutter. The
interior is largely plastic material and the seats are cloth covered. In the table below we show a
snapshot of all the results gathered for this vehicle i.e. all frequency bands, in all positions taking the
mean, median and standard deviation. Note this vehicle had a large panoramic roof.
Frequency Position Mean attenuation (dB)
L800 Dash -2.6
Console -9.3
Footwell -14.1
U900 Dash -4.4
Console -10.7
Footwell -16.8
L1800 Dash -3.1
Console -8.0
Footwell -13.0
U2100 Dash -5.7
Console -13.1
Footwell -16.5
L2600 Dash -3.5
Console -9.0
Footwell -12.1
Table 13: Summary of mobile signal attenuation results for vehicle G
We draw out the key observations from the results of vehicle G in the table below.
Vehicle Position Worst result Best result
Vehicle G Mean attenuation (dB)
Frequency band
Mean attenuation (dB)
Frequency band
Footwell -16.8 2100 MHz -12.1 2600 MHz
Console -13.1 2100 MHz -8.0 1800 MHz
Dash -5.7 2100 MHz -2.6 800 MHz
Table 14: Best and worst results for attenuation and associated frequency band
Overall the SUV had the lowest attenuation compared the other vehicles and the attenuation level at
the dash is lowest and is very similar for all bands within around max 1.8 dB.
In-car Mobile Signal Attenuation Measurements
November 8, 2017 Page 23/50
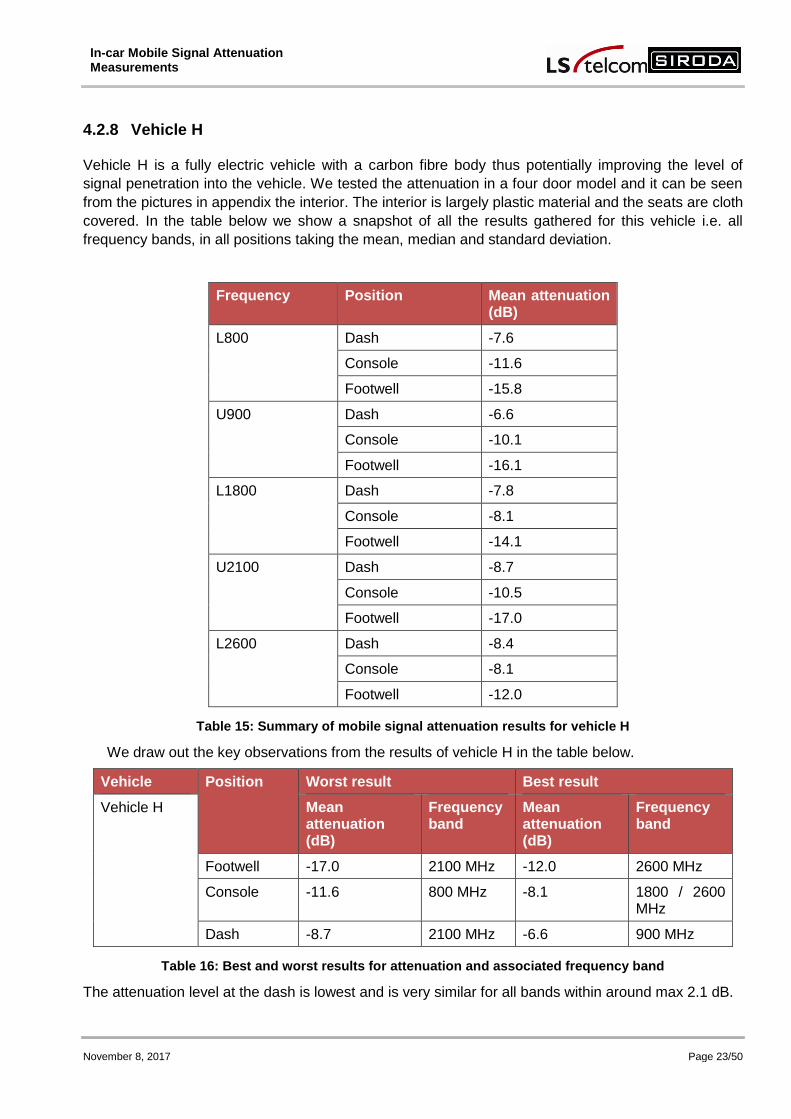
4.2.8 Vehicle H
Vehicle H is a fully electric vehicle with a carbon fibre body thus potentially improving the level of
signal penetration into the vehicle. We tested the attenuation in a four door model and it can be seen
from the pictures in appendix the interior. The interior is largely plastic material and the seats are cloth
covered. In the table below we show a snapshot of all the results gathered for this vehicle i.e. all
frequency bands, in all positions taking the mean, median and standard deviation.
Frequency Position Mean attenuation (dB)
L800 Dash -7.6
Console -11.6
Footwell -15.8
U900 Dash -6.6
Console -10.1
Footwell -16.1
L1800 Dash -7.8
Console -8.1
Footwell -14.1
U2100 Dash -8.7
Console -10.5
Footwell -17.0
L2600 Dash -8.4
Console -8.1
Footwell -12.0
Table 15: Summary of mobile signal attenuation results for vehicle H
We draw out the key observations from the results of vehicle H in the table below.
Vehicle Position Worst result Best result
Vehicle H Mean attenuation (dB)
Frequency band
Mean attenuation (dB)
Frequency band
Footwell -17.0 2100 MHz -12.0 2600 MHz
Console -11.6 800 MHz -8.1 1800 / 2600 MHz
Dash -8.7 2100 MHz -6.6 900 MHz
Table 16: Best and worst results for attenuation and associated frequency band
The attenuation level at the dash is lowest and is very similar for all bands within around max 2.1 dB.
In-car Mobile Signal Attenuation Measurements
November 8, 2017 Page 24/50
5 Detailed findings
The objective of this study was to understand the effects of mobile signal attenuation across a range
of different vehicle models. The impact of the signal attenuation that occurs can greatly impact the
service quality experienced by consumers. For example, in an area with already poor coverage the
impact of an additional 5-6 dB signal loss when trying to use a mobile phone can result in a complete
loss of service. This means that the poor mobile experience is enhanced due to the attenuation level
within the vehicle.
In this summary, we have considered the results from each of the vehicles tested and determined any
particular pattern or trend emerging. In particular, we examined differences between the positions of
the antenna in each of the vehicles and trends against the frequency bands, to identify if one band
performs better than another or if one position is more optimum than another in terms of limiting
attenuation.
Furthermore, we determined how the impact of the vehicle interior might affect the mobile signals.
▪ For every car and every frequency band the pattern largely holds such that the attenuation:
o for the footwell is highest (ranging from -12 dB to -20 dB),
o followed by the console (ranging from -8 dB to -17 dB)
o then the dash (ranging from -2 dB to -10 dB) has the lowest attenuation
▪ Overall vehicle G had the lowest attenuation compared the other vehicles. The vehicle with the
highest overall attenuation across positions and frequency bands was the vehicle F which is
the van with fewer windows compared to the cars.
Roof and dash position:
▪ The lowest overall attenuation is -2.6 dB for vehicle G over 800 MHz which is the only vehicle
that has a glass roof. Followed by vehicle C with -3.9 dB over 2600 MHz
▪ The highest overall attenuation is -8.7 dB for vehicle H over 2100 MHz and -10.1 dB for the
van vehicle F over 900 MHz
Roof and console position:
▪ The lowest attenuation is -8 dB for vehicle G over 1800 MHz, followed by vehicle H with -8.1
dB over 1800 MHz and 2600 MHz
▪ The highest attenuation is -14.4 dB for the car vehicle A over 2100 MHz and -17.1 dB for the
van vehicle F over 2100 MHz
Roof and footwell position:
▪ The lowest attenuation is -12 dB for van vehicle H over 2600 MHz and -12 dB for the car
vehicle H over 2600 MHz
▪ The highest attenuation is -20.6 for the car vehicle E and -20.7 dB for the van vehicle F over
900 MHz
For all in-car positions we found the following trend:
Average:
The average value of the received signal level for the dash, console and footwell values is similar to
the values shown by the console position: between -69.7 dBm for vehicle C (900 MHz) and -103.9
dBm for vehicle A (2600 MHz)
In-car Mobile Signal Attenuation Measurements
November 8, 2017 Page 25/50
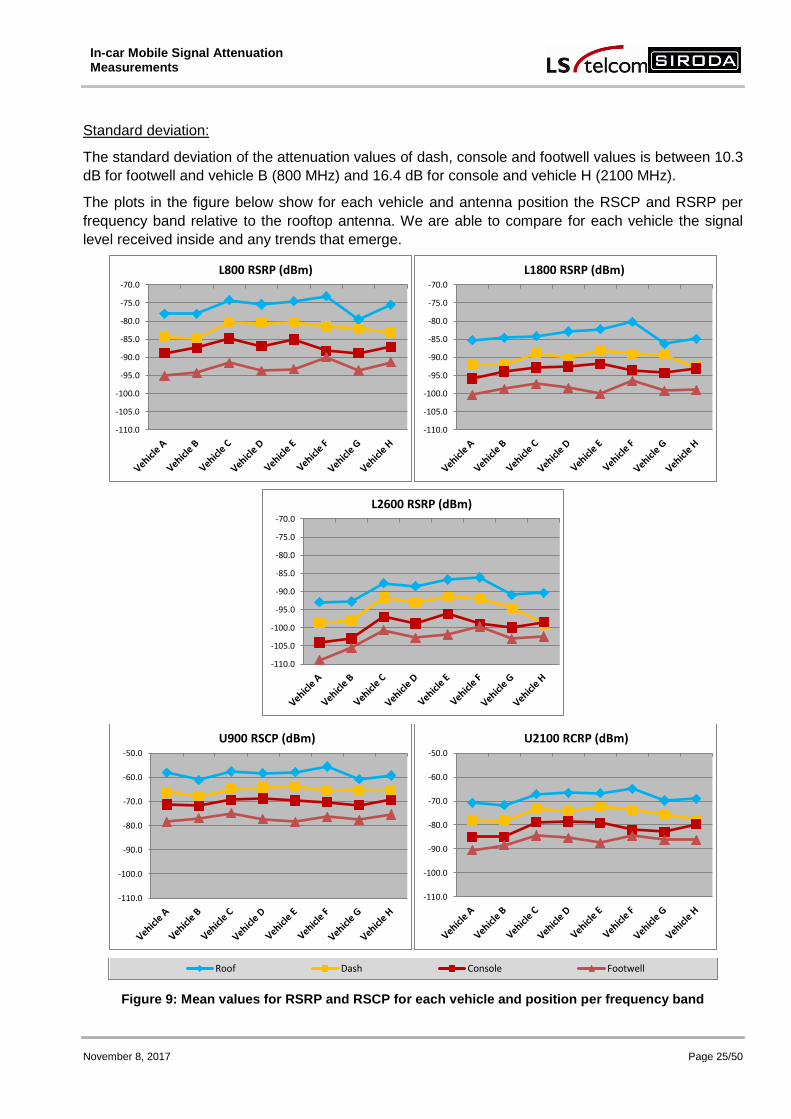
Standard deviation:
The standard deviation of the attenuation values of dash, console and footwell values is between 10.3
dB for footwell and vehicle B (800 MHz) and 16.4 dB for console and vehicle H (2100 MHz).
The plots in the figure below show for each vehicle and antenna position the RSCP and RSRP per
frequency band relative to the rooftop antenna. We are able to compare for each vehicle the signal
level received inside and any trends that emerge.
Figure 9: Mean values for RSRP and RSCP for each vehicle and position per frequency band
-110.0
-105.0
-100.0
-95.0
-90.0
-85.0
-80.0
-75.0
-70.0
L800 RSRP (dBm)
-110.0
-105.0
-100.0
-95.0
-90.0
-85.0
-80.0
-75.0
-70.0
L1800 RSRP (dBm)
-110.0
-105.0
-100.0
-95.0
-90.0
-85.0
-80.0
-75.0
-70.0
L2600 RSRP (dBm)
-110.0
-100.0
-90.0
-80.0
-70.0
-60.0
-50.0
U900 RSCP (dBm)
-110.0
-100.0
-90.0
-80.0
-70.0
-60.0
-50.0
U2100 RCRP (dBm)
-110.0-100.0-90.0-80.0-70.0-60.0-50.0
Nissan Mercedes Toyota Vauxhall BMW 3 BMW i3 Ford
M e a n U900 RSCPRoof Dash Console Footwell
In-car Mobile Signal Attenuation Measurements
November 8, 2017 Page 26/50
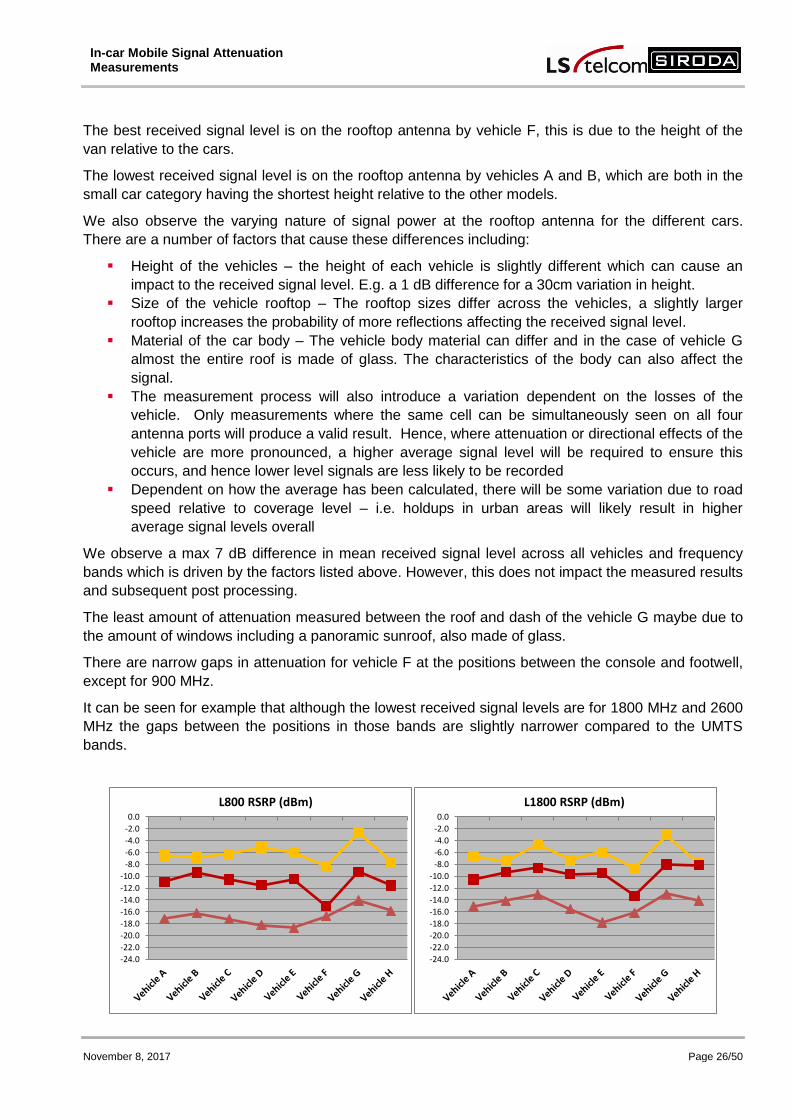
The best received signal level is on the rooftop antenna by vehicle F, this is due to the height of the
van relative to the cars.
The lowest received signal level is on the rooftop antenna by vehicles A and B, which are both in the
small car category having the shortest height relative to the other models.
We also observe the varying nature of signal power at the rooftop antenna for the different cars.
There are a number of factors that cause these differences including:
▪ Height of the vehicles – the height of each vehicle is slightly different which can cause an
impact to the received signal level. E.g. a 1 dB difference for a 30cm variation in height.
▪ Size of the vehicle rooftop – The rooftop sizes differ across the vehicles, a slightly larger
rooftop increases the probability of more reflections affecting the received signal level.
▪ Material of the car body – The vehicle body material can differ and in the case of vehicle G
almost the entire roof is made of glass. The characteristics of the body can also affect the
signal.
▪ The measurement process will also introduce a variation dependent on the losses of the
vehicle. Only measurements where the same cell can be simultaneously seen on all four
antenna ports will produce a valid result. Hence, where attenuation or directional effects of the
vehicle are more pronounced, a higher average signal level will be required to ensure this
occurs, and hence lower level signals are less likely to be recorded
▪ Dependent on how the average has been calculated, there will be some variation due to road
speed relative to coverage level – i.e. holdups in urban areas will likely result in higher
average signal levels overall
We observe a max 7 dB difference in mean received signal level across all vehicles and frequency
bands which is driven by the factors listed above. However, this does not impact the measured results
and subsequent post processing.
The least amount of attenuation measured between the roof and dash of the vehicle G maybe due to
the amount of windows including a panoramic sunroof, also made of glass.
There are narrow gaps in attenuation for vehicle F at the positions between the console and footwell,
except for 900 MHz.
It can be seen for example that although the lowest received signal levels are for 1800 MHz and 2600
MHz the gaps between the positions in those bands are slightly narrower compared to the UMTS
bands.
-24.0
-22.0
-20.0
-18.0
-16.0
-14.0
-12.0
-10.0
-8.0
-6.0
-4.0
-2.0
0.0
L800 RSRP (dBm)
-24.0
-22.0
-20.0
-18.0
-16.0
-14.0
-12.0
-10.0
-8.0
-6.0
-4.0
-2.0
0.0
L1800 RSRP (dBm)

In-car Mobile Signal Attenuation Measurements
November 8, 2017 Page 27/50
Figure 10: Attenuation of RSRP and RSCP mean values for each vehicle and position per frequency
band
The plots in Figure 10 show the attenuation of the RSRP and RSCP mean values for each vehicle
and position across the frequency bands. It shows for example which vehicles have the widest range
of attenuation over the three positions. Vehicles E and D appear to have a commonly high attenuation
in the footwell relative to the other positions across all frequency bands. Furthermore, the attenuation
levels for the LTE bands appear to be slightly better than the UMTS bands.
5.1 Approach to derive attenuation value
We use the post processed results to determine the value for attenuation that can be used to make
coverage predictions for mobile use inside vehicles. We examine the impact of attenuation across
each of the main parameters namely frequency band, position inside the vehicle and across vehicles.
We first look at the variance of the attenuation values across each parameter that determines the
magnitude of the range we consider for the attenuation value. Secondly, we determine the median
and standard deviation value across each of the parameters to derive a single number that represents
all vehicles, all positions and all frequencies. In order to derive as realistic value as possible we
calculate a weighted value of the attenuation based on the UK market penetration across each of the
vehicle types.
-24.0-22.0-20.0-18.0-16.0-14.0-12.0-10.0
-8.0-6.0-4.0-2.00.0
L2600 RSRP (dBm)
-24.0
-22.0
-20.0
-18.0
-16.0
-14.0
-12.0
-10.0
-8.0
-6.0
-4.0
-2.0
0.0
U900 RSCP (dBm)
-24.0-22.0-20.0-18.0-16.0-14.0-12.0-10.0
-8.0-6.0-4.0-2.00.0
U2100 RSCP (dBm)
-24.0-22.0-20.0-18.0-16.0-14.0-12.0-10.0-8.0-6.0-4.0-2.00.0
Vehicle G Vehicle D Vehicle I Vehicle B Vehicle E Vehicle H Vehicle A Vehicle C Vehicle F
D el t a L1800 RSRP (dBm)Dash-Roof Console-Roof Footwell-Roof
In-car Mobile Signal Attenuation Measurements
November 8, 2017 Page 28/50
5.2 Implications for the findings
In this section, we examine how each of the parameters vary comparing the impact of frequency
across vehicle types and impact of the positions across vehicle types. We then combine the two sets
of data to derive a single value of attenuation.
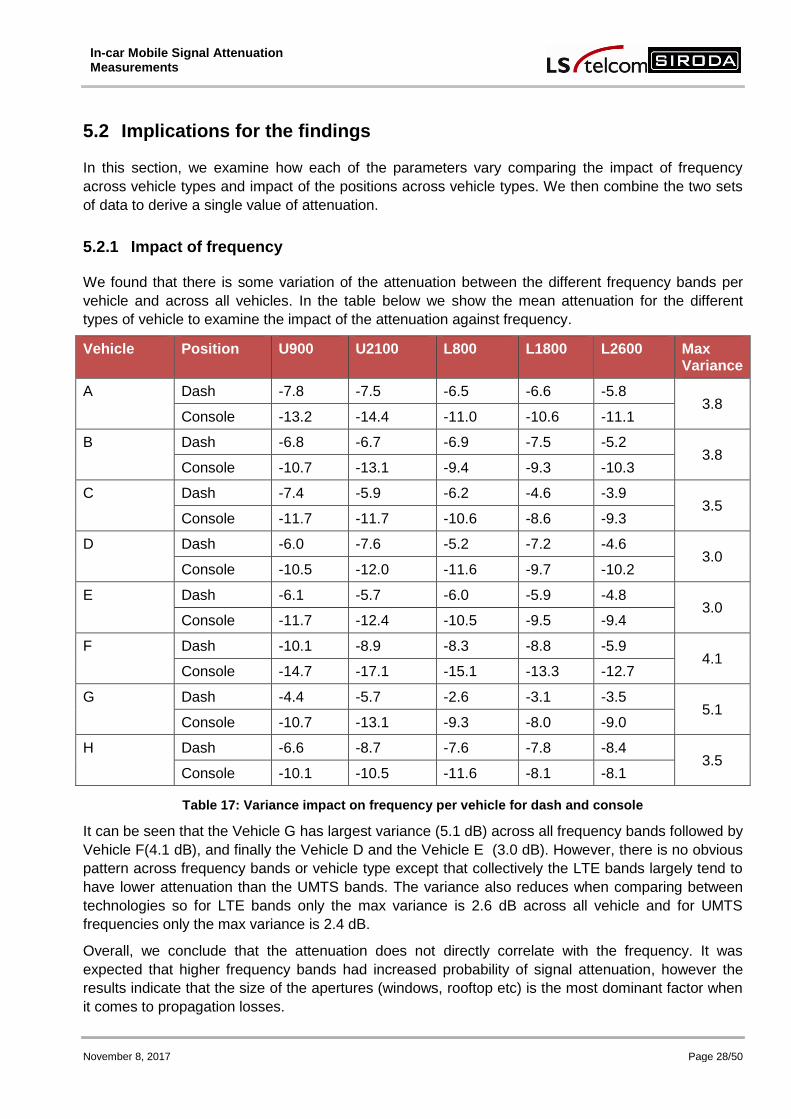
5.2.1 Impact of frequency
We found that there is some variation of the attenuation between the different frequency bands per
vehicle and across all vehicles. In the table below we show the mean attenuation for the different
types of vehicle to examine the impact of the attenuation against frequency.
Vehicle Position U900 U2100 L800 L1800 L2600 Max Variance
A Dash -7.8 -7.5 -6.5 -6.6 -5.8 3.8
Console -13.2 -14.4 -11.0 -10.6 -11.1
B Dash -6.8 -6.7 -6.9 -7.5 -5.2 3.8
Console -10.7 -13.1 -9.4 -9.3 -10.3
C Dash -7.4 -5.9 -6.2 -4.6 -3.9 3.5
Console -11.7 -11.7 -10.6 -8.6 -9.3
D Dash -6.0 -7.6 -5.2 -7.2 -4.6 3.0
Console -10.5 -12.0 -11.6 -9.7 -10.2
E Dash -6.1 -5.7 -6.0 -5.9 -4.8 3.0
Console -11.7 -12.4 -10.5 -9.5 -9.4
F Dash -10.1 -8.9 -8.3 -8.8 -5.9 4.1
Console -14.7 -17.1 -15.1 -13.3 -12.7
G Dash -4.4 -5.7 -2.6 -3.1 -3.5 5.1
Console -10.7 -13.1 -9.3 -8.0 -9.0
H Dash -6.6 -8.7 -7.6 -7.8 -8.4 3.5
Console -10.1 -10.5 -11.6 -8.1 -8.1
Table 17: Variance impact on frequency per vehicle for dash and console
It can be seen that the Vehicle G has largest variance (5.1 dB) across all frequency bands followed by
Vehicle F(4.1 dB), and finally the Vehicle D and the Vehicle E (3.0 dB). However, there is no obvious
pattern across frequency bands or vehicle type except that collectively the LTE bands largely tend to
have lower attenuation than the UMTS bands. The variance also reduces when comparing between
technologies so for LTE bands only the max variance is 2.6 dB across all vehicle and for UMTS
frequencies only the max variance is 2.4 dB.
Overall, we conclude that the attenuation does not directly correlate with the frequency. It was
expected that higher frequency bands had increased probability of signal attenuation, however the
results indicate that the size of the apertures (windows, rooftop etc) is the most dominant factor when
it comes to propagation losses.
In-car Mobile Signal Attenuation Measurements
November 8, 2017 Page 29/50
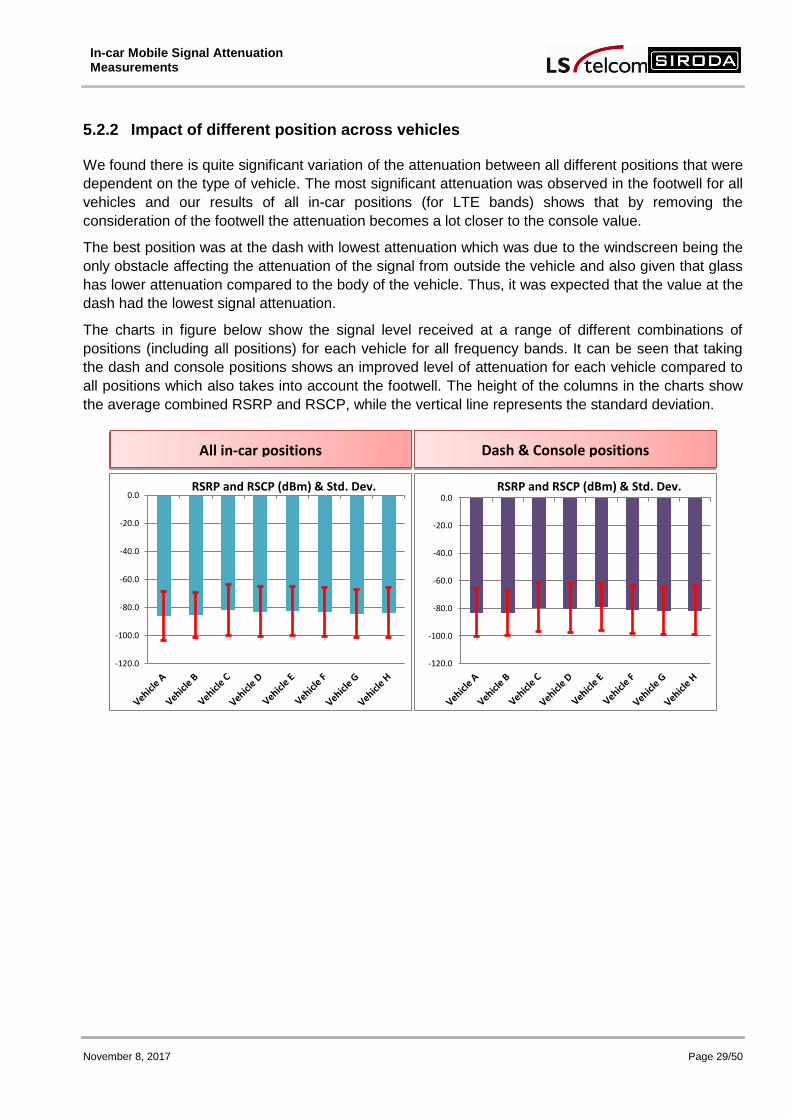
5.2.2 Impact of different position across vehicles
We found there is quite significant variation of the attenuation between all different positions that were
dependent on the type of vehicle. The most significant attenuation was observed in the footwell for all
vehicles and our results of all in-car positions (for LTE bands) shows that by removing the
consideration of the footwell the attenuation becomes a lot closer to the console value.
The best position was at the dash with lowest attenuation which was due to the windscreen being the
only obstacle affecting the attenuation of the signal from outside the vehicle and also given that glass
has lower attenuation compared to the body of the vehicle. Thus, it was expected that the value at the
dash had the lowest signal attenuation.
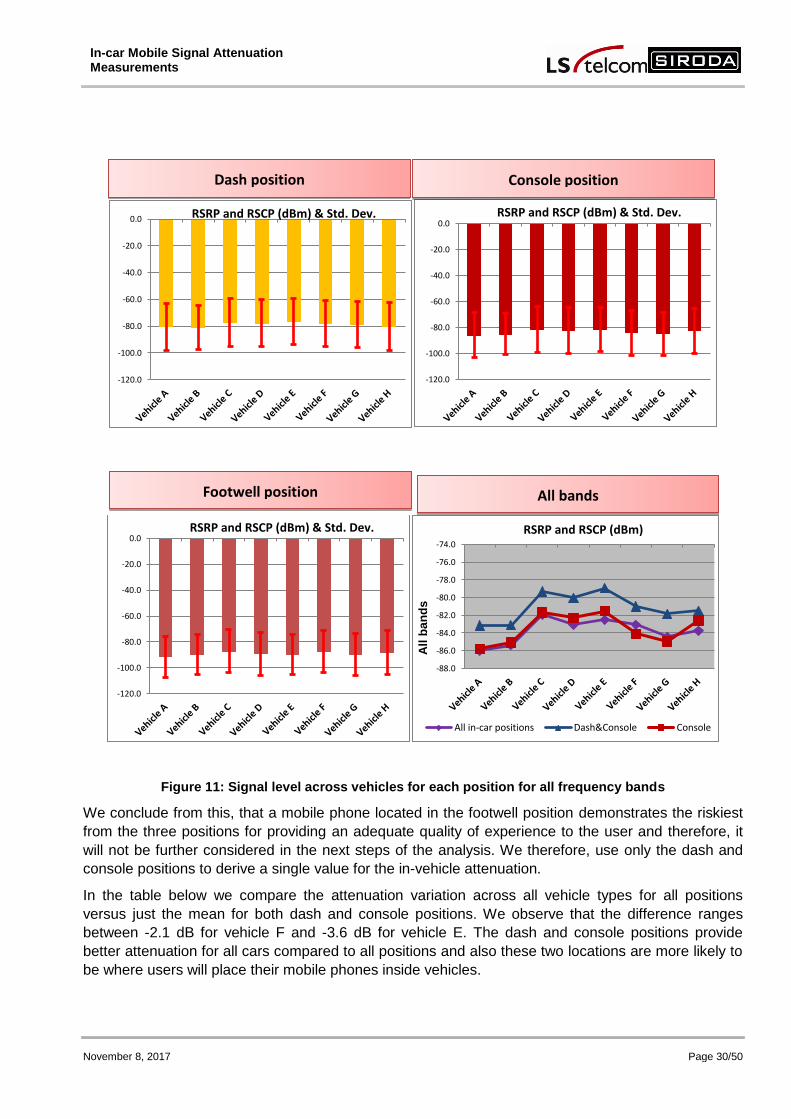
The charts in figure below show the signal level received at a range of different combinations of
positions (including all positions) for each vehicle for all frequency bands. It can be seen that taking
the dash and console positions shows an improved level of attenuation for each vehicle compared to
all positions which also takes into account the footwell. The height of the columns in the charts show
the average combined RSRP and RSCP, while the vertical line represents the standard deviation.
-120.0
-100.0
-80.0
-60.0
-40.0
-20.0
0.0RSRP and RSCP (dBm) & Std. Dev.
-120.0
-100.0
-80.0
-60.0
-40.0
-20.0
0.0RSRP and RSCP (dBm) & Std. Dev.
All in-car positions Dash & Console positions
In-car Mobile Signal Attenuation Measurements
November 8, 2017 Page 30/50
Figure 11: Signal level across vehicles for each position for all frequency bands
We conclude from this, that a mobile phone located in the footwell position demonstrates the riskiest
from the three positions for providing an adequate quality of experience to the user and therefore, it
will not be further considered in the next steps of the analysis. We therefore, use only the dash and
console positions to derive a single value for the in-vehicle attenuation.
In the table below we compare the attenuation variation across all vehicle types for all positions
versus just the mean for both dash and console positions. We observe that the difference ranges
between -2.1 dB for vehicle F and -3.6 dB for vehicle E. The dash and console positions provide
better attenuation for all cars compared to all positions and also these two locations are more likely to
be where users will place their mobile phones inside vehicles.
-120.0
-100.0
-80.0
-60.0
-40.0
-20.0
0.0 RSRP and RSCP (dBm) & Std. Dev.
-120.0
-100.0
-80.0
-60.0
-40.0
-20.0
0.0RSRP and RSCP (dBm) & Std. Dev.
-120.0
-100.0
-80.0
-60.0
-40.0
-20.0
0.0RSRP and RSCP (dBm) & Std. Dev.
-88.0
-86.0
-84.0
-82.0
-80.0
-78.0
-76.0
-74.0
All
ba
nd
s
RSRP and RSCP (dBm)
All in-car positions Dash&Console Console
Dash position Console position
Footwell position All bands
In-car Mobile Signal Attenuation Measurements
November 8, 2017 Page 31/50
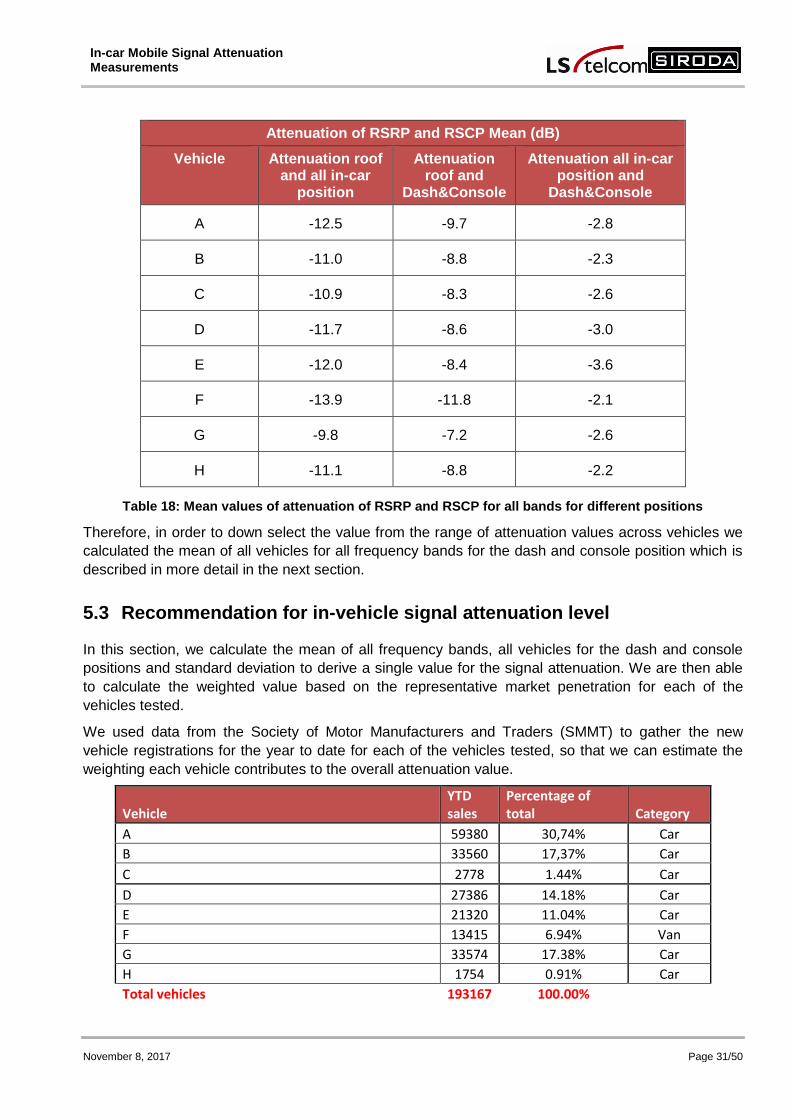
Attenuation of RSRP and RSCP Mean (dB)
Vehicle Attenuation roof and all in-car
position
Attenuation roof and
Dash&Console
Attenuation all in-car position and
Dash&Console
A -12.5 -9.7 -2.8
B -11.0 -8.8 -2.3
C -10.9 -8.3 -2.6
D -11.7 -8.6 -3.0
E -12.0 -8.4 -3.6
F -13.9 -11.8 -2.1
G -9.8 -7.2 -2.6
H -11.1 -8.8 -2.2
Table 18: Mean values of attenuation of RSRP and RSCP for all bands for different positions
Therefore, in order to down select the value from the range of attenuation values across vehicles we
calculated the mean of all vehicles for all frequency bands for the dash and console position which is
described in more detail in the next section.
5.3 Recommendation for in-vehicle signal attenuation level
In this section, we calculate the mean of all frequency bands, all vehicles for the dash and console
positions and standard deviation to derive a single value for the signal attenuation. We are then able
to calculate the weighted value based on the representative market penetration for each of the
vehicles tested.
We used data from the Society of Motor Manufacturers and Traders (SMMT) to gather the new
vehicle registrations for the year to date for each of the vehicles tested, so that we can estimate the
weighting each vehicle contributes to the overall attenuation value.
Vehicle YTD sales
Percentage of total Category
A 59380 30,74% Car
B 33560 17,37% Car
C 2778 1.44% Car
D 27386 14.18% Car
E 21320 11.04% Car
F 13415 6.94% Van
G 33574 17.38% Car
H 1754 0.91% Car
Total vehicles 193167 100.00%
In-car Mobile Signal Attenuation Measurements
November 8, 2017 Page 32/50
Table 19: Market representation of vehicles tested
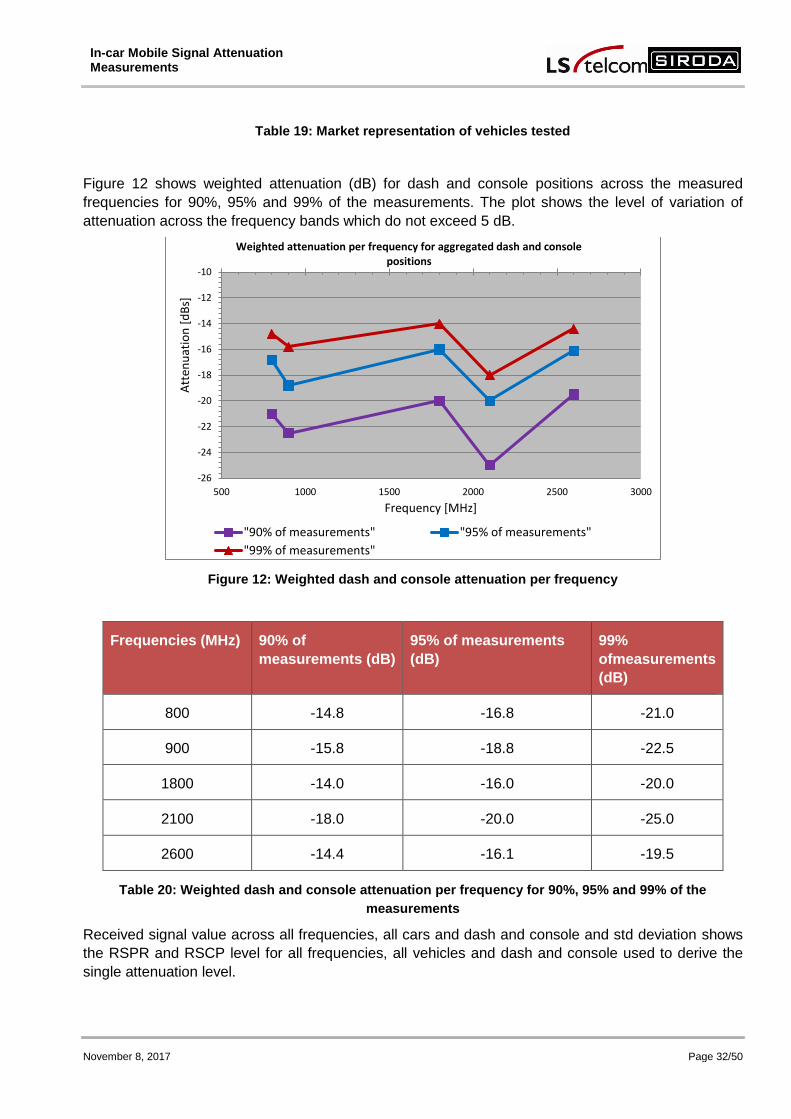
Figure 12 shows weighted attenuation (dB) for dash and console positions across the measured
frequencies for 90%, 95% and 99% of the measurements. The plot shows the level of variation of
attenuation across the frequency bands which do not exceed 5 dB.
Figure 12: Weighted dash and console attenuation per frequency
Frequencies (MHz) 90% of
measurements (dB)
95% of measurements
(dB)
99%
ofmeasurements
(dB)
800 -14.8 -16.8 -21.0
900 -15.8 -18.8 -22.5
1800 -14.0 -16.0 -20.0
2100 -18.0 -20.0 -25.0
2600 -14.4 -16.1 -19.5
Table 20: Weighted dash and console attenuation per frequency for 90%, 95% and 99% of the
measurements
Received signal value across all frequencies, all cars and dash and console and std deviation shows
the RSPR and RSCP level for all frequencies, all vehicles and dash and console used to derive the
single attenuation level.
-26
-24
-22
-20
-18
-16
-14
-12
-10
500 1000 1500 2000 2500 3000
Att
enu
atio
n [
dB
s]
Frequency [MHz]
Weighted attenuation per frequency for aggregated dash and console positions
"90% of measurements" "95% of measurements"
"99% of measurements"
In-car Mobile Signal Attenuation Measurements
November 8, 2017 Page 33/50
RSRP and RSCP for all
frequencies all vehicles and
dash and console dBm
(weighted)
RSRP and RSCP for all
frequencies all vehicles and
roof dBm (weighted)
Std dev. (dB) dash and
console
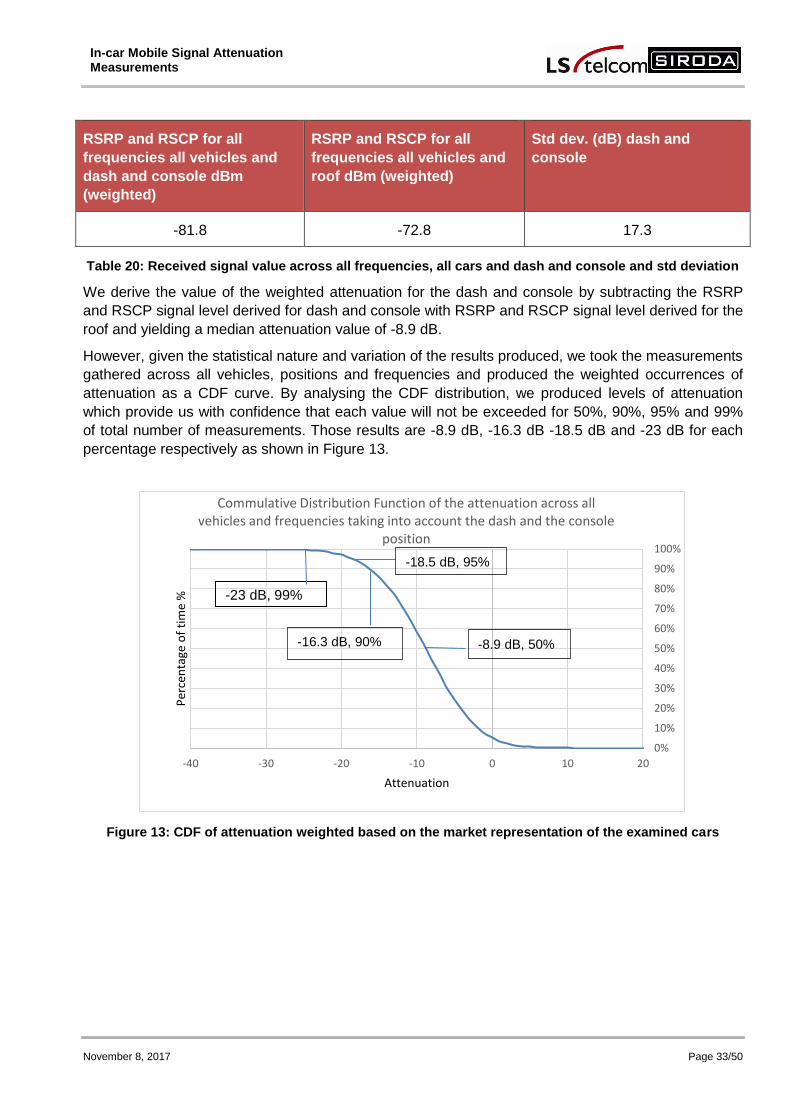
-81.8 -72.8 17.3
Table 20: Received signal value across all frequencies, all cars and dash and console and std deviation
We derive the value of the weighted attenuation for the dash and console by subtracting the RSRP
and RSCP signal level derived for dash and console with RSRP and RSCP signal level derived for the
roof and yielding a median attenuation value of -8.9 dB.
However, given the statistical nature and variation of the results produced, we took the measurements
gathered across all vehicles, positions and frequencies and produced the weighted occurrences of
attenuation as a CDF curve. By analysing the CDF distribution, we produced levels of attenuation
which provide us with confidence that each value will not be exceeded for 50%, 90%, 95% and 99%
of total number of measurements. Those results are -8.9 dB, -16.3 dB -18.5 dB and -23 dB for each
percentage respectively as shown in Figure 13.
Figure 13: CDF of attenuation weighted based on the market representation of the examined cars
0%
10%
20%
30%
40%
50%
60%
70%
80%
90%
100%
-40 -30 -20 -10 0 10 20
Per
cen
tage
of
tim
e %
Attenuation
Commulative Distribution Function of the attenuation across all vehicles and frequencies taking into account the dash and the console
position
-23 dB, 99%
-16.3 dB, 90%
-18.5 dB, 95%
-8.9 dB, 50%
In-car Mobile Signal Attenuation Measurements
November 8, 2017 Page 34/50
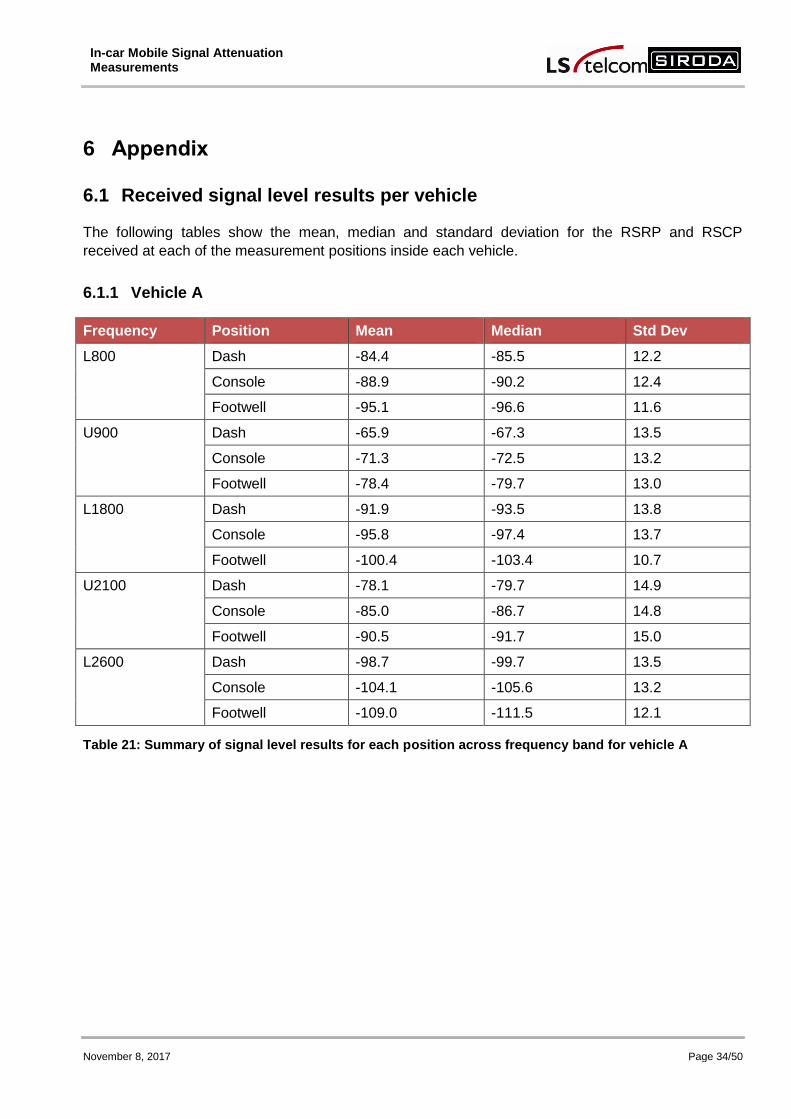
6 Appendix
6.1 Received signal level results per vehicle
The following tables show the mean, median and standard deviation for the RSRP and RSCP
received at each of the measurement positions inside each vehicle.
6.1.1 Vehicle A
Frequency Position Mean Median Std Dev
L800 Dash -84.4 -85.5 12.2
Console -88.9 -90.2 12.4
Footwell -95.1 -96.6 11.6
U900 Dash -65.9 -67.3 13.5
Console -71.3 -72.5 13.2
Footwell -78.4 -79.7 13.0
L1800 Dash -91.9 -93.5 13.8
Console -95.8 -97.4 13.7
Footwell -100.4 -103.4 10.7
U2100 Dash -78.1 -79.7 14.9
Console -85.0 -86.7 14.8
Footwell -90.5 -91.7 15.0
L2600 Dash -98.7 -99.7 13.5
Console -104.1 -105.6 13.2
Footwell -109.0 -111.5 12.1
Table 21: Summary of signal level results for each position across frequency band for vehicle A
In-car Mobile Signal Attenuation Measurements
November 8, 2017 Page 35/50
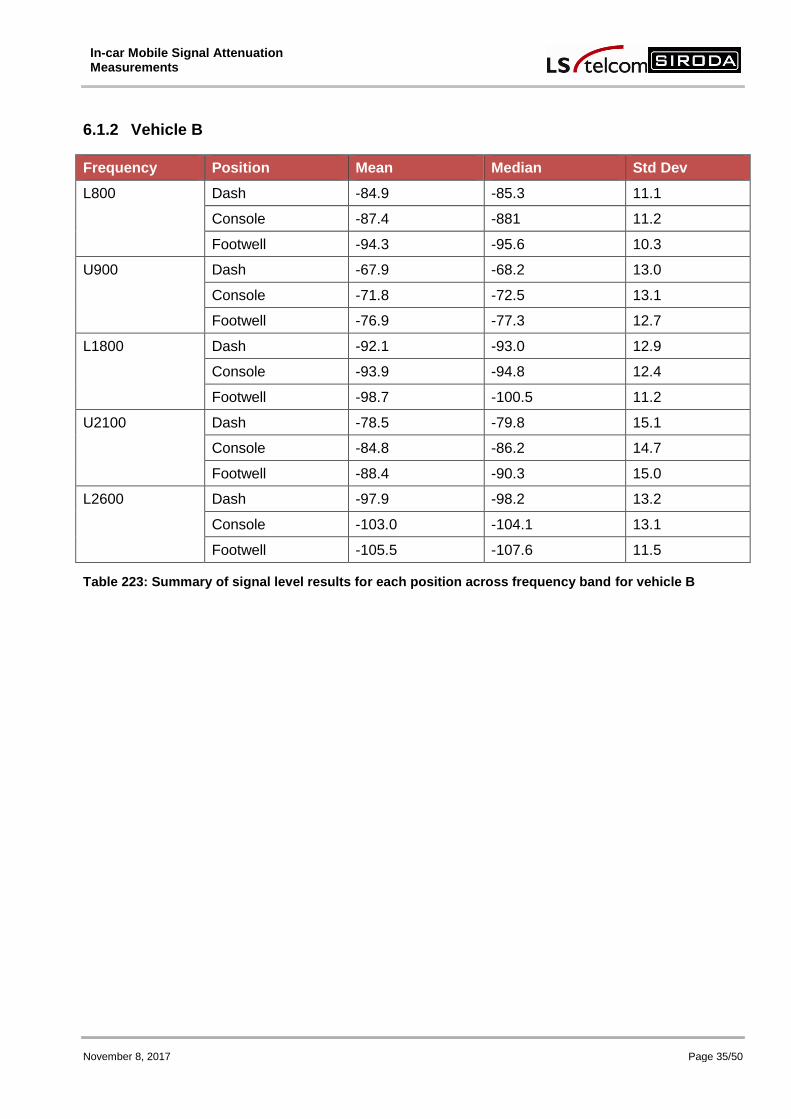
6.1.2 Vehicle B
Frequency Position Mean Median Std Dev
L800 Dash -84.9 -85.3 11.1
Console -87.4 -881 11.2
Footwell -94.3 -95.6 10.3
U900 Dash -67.9 -68.2 13.0
Console -71.8 -72.5 13.1
Footwell -76.9 -77.3 12.7
L1800 Dash -92.1 -93.0 12.9
Console -93.9 -94.8 12.4
Footwell -98.7 -100.5 11.2
U2100 Dash -78.5 -79.8 15.1
Console -84.8 -86.2 14.7
Footwell -88.4 -90.3 15.0
L2600 Dash -97.9 -98.2 13.2
Console -103.0 -104.1 13.1
Footwell -105.5 -107.6 11.5
Table 223: Summary of signal level results for each position across frequency band for vehicle B
In-car Mobile Signal Attenuation Measurements
November 8, 2017 Page 36/50
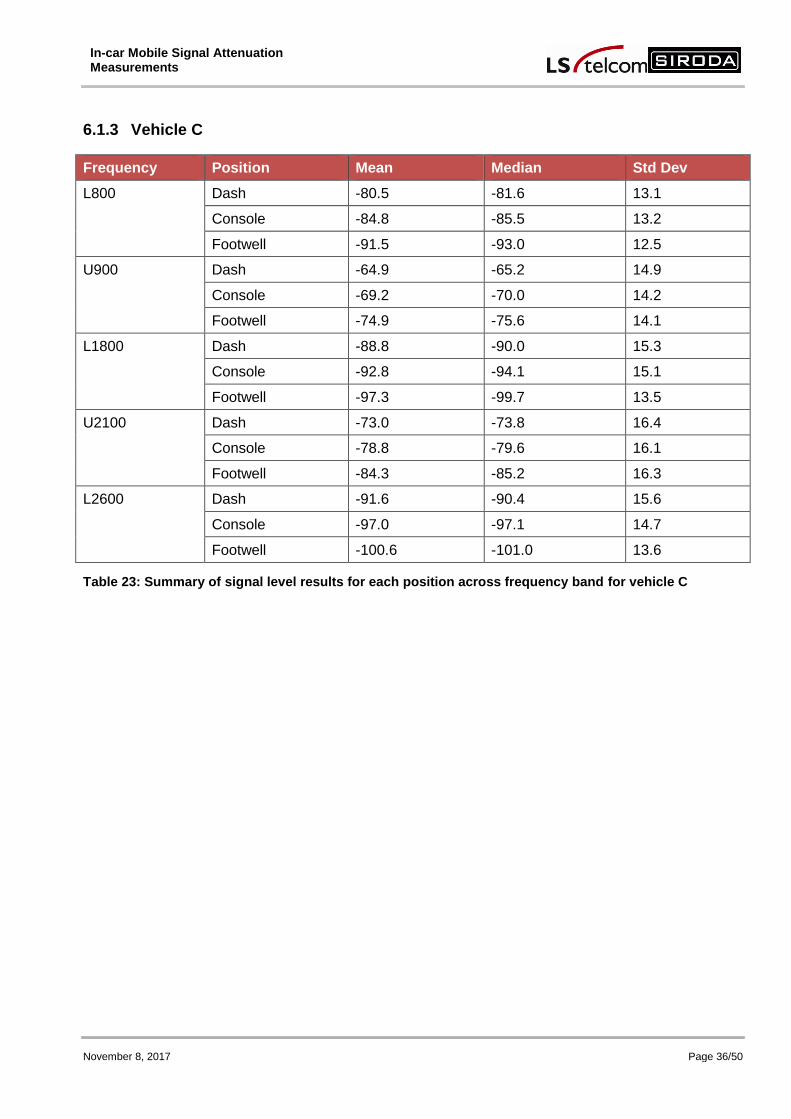
6.1.3 Vehicle C
Frequency Position Mean Median Std Dev
L800 Dash -80.5 -81.6 13.1
Console -84.8 -85.5 13.2
Footwell -91.5 -93.0 12.5
U900 Dash -64.9 -65.2 14.9
Console -69.2 -70.0 14.2
Footwell -74.9 -75.6 14.1
L1800 Dash -88.8 -90.0 15.3
Console -92.8 -94.1 15.1
Footwell -97.3 -99.7 13.5
U2100 Dash -73.0 -73.8 16.4
Console -78.8 -79.6 16.1
Footwell -84.3 -85.2 16.3
L2600 Dash -91.6 -90.4 15.6
Console -97.0 -97.1 14.7
Footwell -100.6 -101.0 13.6
Table 23: Summary of signal level results for each position across frequency band for vehicle C

In-car Mobile Signal Attenuation Measurements
November 8, 2017 Page 37/50
6.1.4 Vehicle D
Frequency Position Mean Median Std Dev
L800 Dash -80.6 -81.1 12.6
Console -87.0 -87.6 12.3
Footwell -93.7 -94.6 12.4
U900 Dash -64.2 -65.4 13.4
Console -68.8 -70.2 13.5
Footwell -77.4 -78.7 13.5
L1800 Dash -90.1 -91.4 14.7
Console -92.5 -94.1 14.8
Footwell -98.4 -100.6 14.0
U2100 Dash -74.2 -75.0 16.2
Console -78.6 -79.7 16.2
Footwell -85.4 -86.7 15.9
L2600 Dash -93.2 -91.7 15.4
Console -98.8 -98.7 14.1
Footwell -102.7 -103.6 12.7
Table 24: Summary of signal level results for each position across frequency band for vehicle D

In-car Mobile Signal Attenuation Measurements
November 8, 2017 Page 38/50
6.1.5 Vehicle E
Frequency Position Mean Median Std Dev
L800 Dash -80.5 -81.4 12.3
Console -85.1 -85.5 12.3
Footwell -93.3 -94.6 11.5
U900 Dash -64.0 -64.9 13.4
Console -69.6 -70.4 13.6
Footwell -78.4 -79.6 13.3
L1800 Dash -88.2 -89.3 14.7
Console -91.8 -93.4 14.3
Footwell -100.1 -102.2 13.1
U2100 Dash -72.5 -73.0 16.0
Console -79.1 -79.7 16.1
Footwell -87.4 -88.4 15.6
L2600 Dash -91.5 -92.3 13.6
Console -96.1 -97.8 13.5
Footwell -101.9 -104.4 10.5
Table 25: Summary of signal level results for each position across frequency band for vehicle E
In-car Mobile Signal Attenuation Measurements
November 8, 2017 Page 39/50
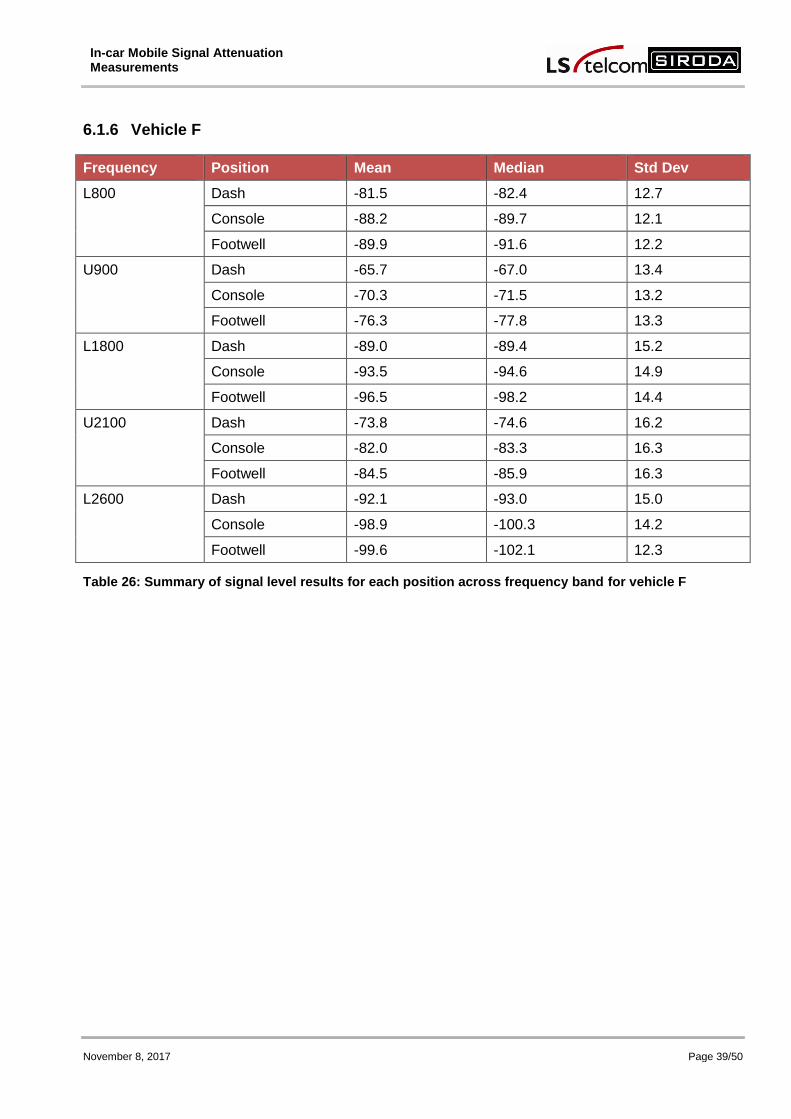
6.1.6 Vehicle F
Frequency Position Mean Median Std Dev
L800 Dash -81.5 -82.4 12.7
Console -88.2 -89.7 12.1
Footwell -89.9 -91.6 12.2
U900 Dash -65.7 -67.0 13.4
Console -70.3 -71.5 13.2
Footwell -76.3 -77.8 13.3
L1800 Dash -89.0 -89.4 15.2
Console -93.5 -94.6 14.9
Footwell -96.5 -98.2 14.4
U2100 Dash -73.8 -74.6 16.2
Console -82.0 -83.3 16.3
Footwell -84.5 -85.9 16.3
L2600 Dash -92.1 -93.0 15.0
Console -98.9 -100.3 14.2
Footwell -99.6 -102.1 12.3
Table 26: Summary of signal level results for each position across frequency band for vehicle F

In-car Mobile Signal Attenuation Measurements
November 8, 2017 Page 40/50
6.1.7 Vehicle G
Frequency Position Mean Median Std Dev
L800 Dash -82,2 -82,7 12,1
Console -88,8 -89,4 11,3
Footwell -93,6 -94,6 11,6
U900 Dash -65,2 -65,6 13,0
Console -71,5 -72,6 12,8
Footwell -77,6 -78,0 12,8
L1800 Dash -89,4 -90,4 14,0
Console -94,3 -95,8 13,4
Footwell -99,2 -101,2 13,4
U2100 Dash -75,5 -77,3 15,3
Console -82,9 -84,9 15,1
Footwell -86,3 -88,2 15,2
L2600 Dash -94,5 -93,2 15,3
Console -100,0 -98,9 14,1
Footwell -103,1 -103,0 12,7
Table 27: Summary of signal level results for each position across frequency band for vehicle G
In-car Mobile Signal Attenuation Measurements
November 8, 2017 Page 41/50
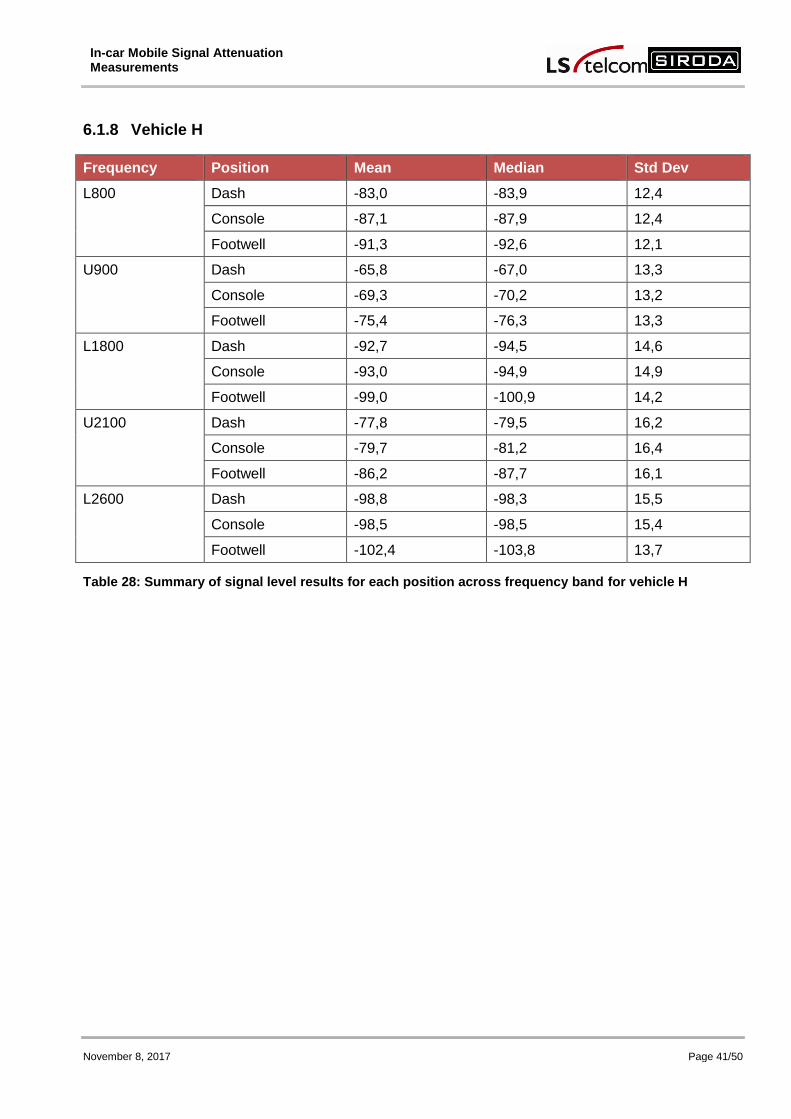
6.1.8 Vehicle H
Frequency Position Mean Median Std Dev
L800 Dash -83,0 -83,9 12,4
Console -87,1 -87,9 12,4
Footwell -91,3 -92,6 12,1
U900 Dash -65,8 -67,0 13,3
Console -69,3 -70,2 13,2
Footwell -75,4 -76,3 13,3
L1800 Dash -92,7 -94,5 14,6
Console -93,0 -94,9 14,9
Footwell -99,0 -100,9 14,2
U2100 Dash -77,8 -79,5 16,2
Console -79,7 -81,2 16,4
Footwell -86,2 -87,7 16,1
L2600 Dash -98,8 -98,3 15,5
Console -98,5 -98,5 15,4
Footwell -102,4 -103,8 13,7
Table 28: Summary of signal level results for each position across frequency band for vehicle H

In-car Mobile Signal Attenuation Measurements
November 8, 2017 Page 42/50
6.2 Range of RSRP and RSCP for console position across frequency and vehicle
Figure 14: Range of RSRP and RSCP for console position across frequency and vehicle
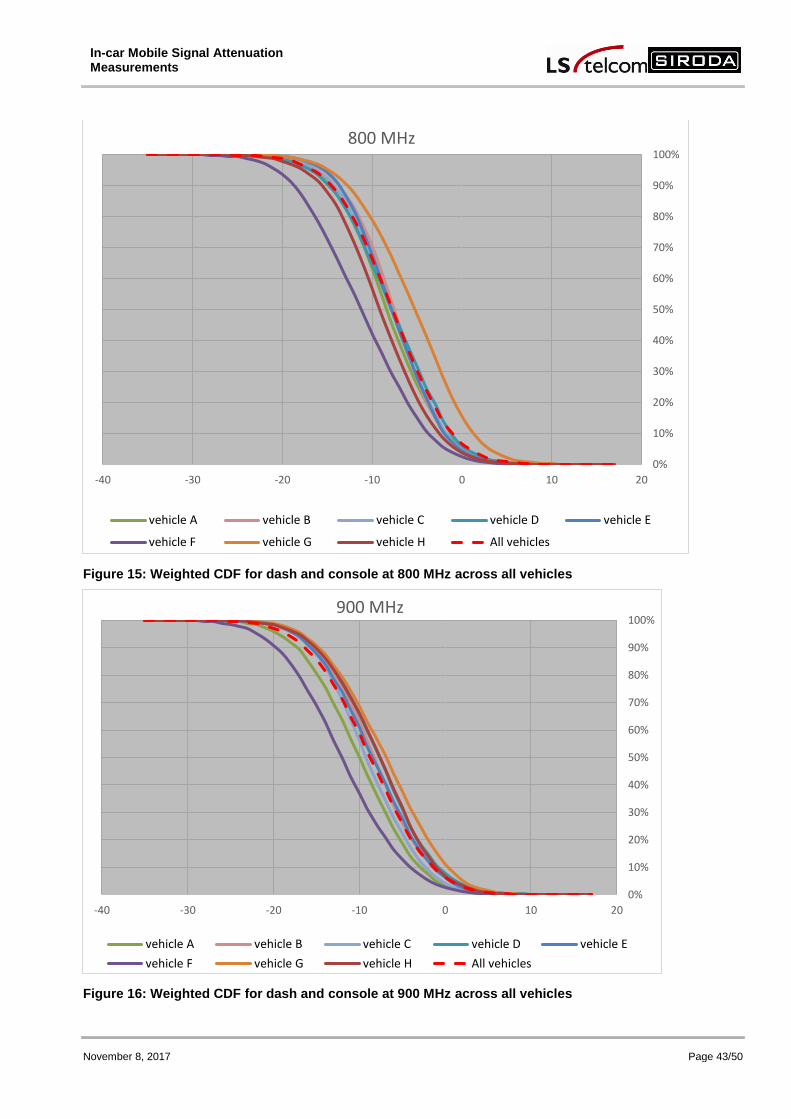
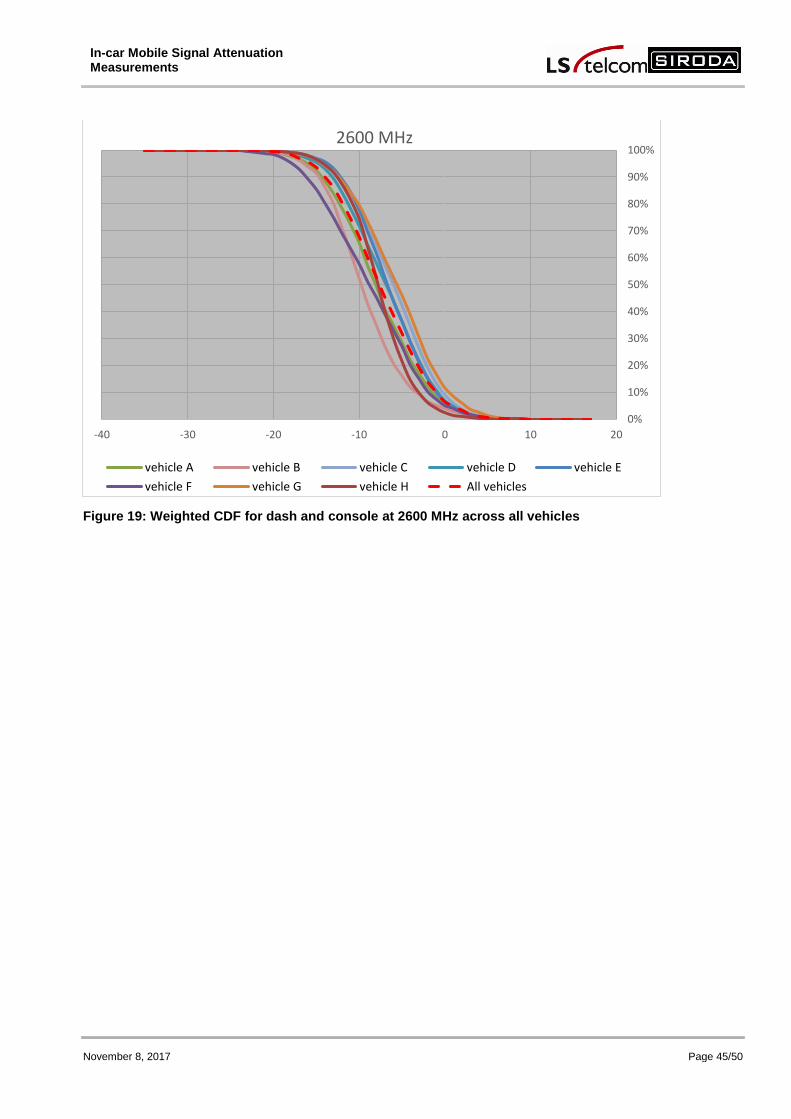
The following plots show the weighted CDF for dash and console for each vehicle. A plot is produced
for each frequency band to demonstrate the level of attenuation variance across frequency bands.
In-car Mobile Signal Attenuation Measurements
November 8, 2017 Page 43/50
Figure 15: Weighted CDF for dash and console at 800 MHz across all vehicles
Figure 16: Weighted CDF for dash and console at 900 MHz across all vehicles
0%
10%
20%
30%
40%
50%
60%
70%
80%
90%
100%
-40 -30 -20 -10 0 10 20
800 MHz
vehicle A vehicle B vehicle C vehicle D vehicle E
vehicle F vehicle G vehicle H All vehicles
0%
10%
20%
30%
40%
50%
60%
70%
80%
90%
100%
-40 -30 -20 -10 0 10 20
900 MHz
vehicle A vehicle B vehicle C vehicle D vehicle E
vehicle F vehicle G vehicle H All vehicles
In-car Mobile Signal Attenuation Measurements
November 8, 2017 Page 44/50
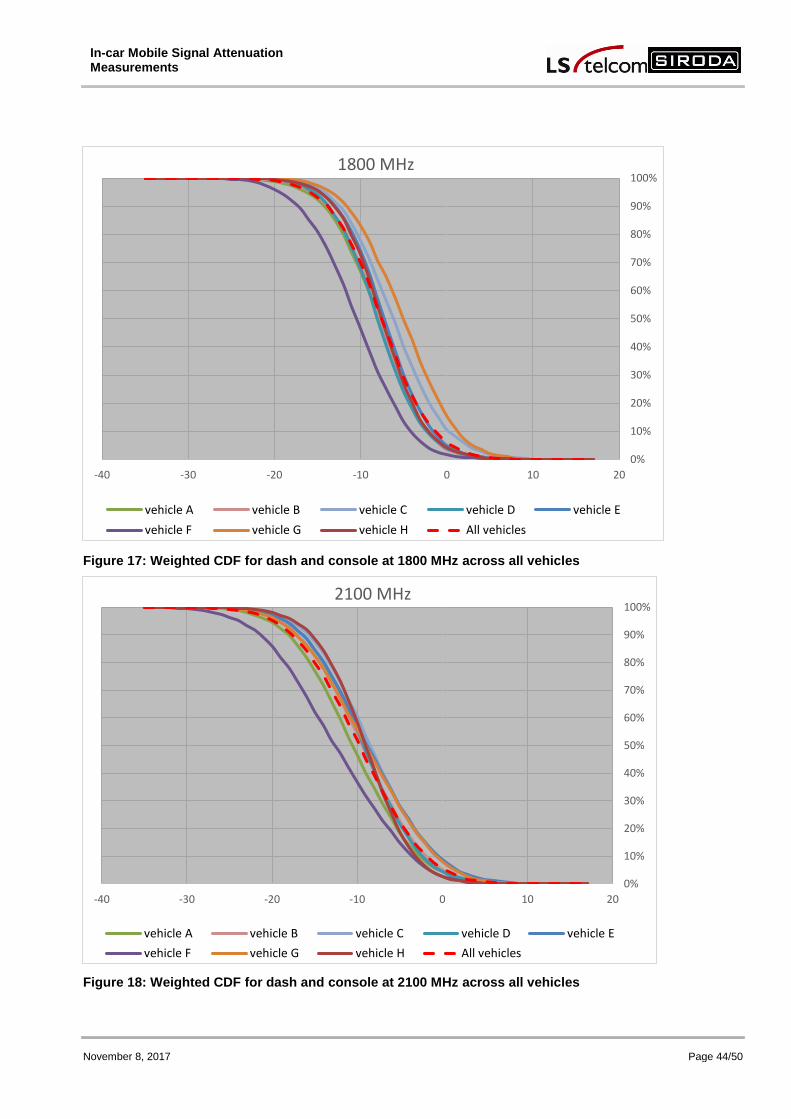
Figure 17: Weighted CDF for dash and console at 1800 MHz across all vehicles
Figure 18: Weighted CDF for dash and console at 2100 MHz across all vehicles
0%
10%
20%
30%
40%
50%
60%
70%
80%
90%
100%
-40 -30 -20 -10 0 10 20
1800 MHz
vehicle A vehicle B vehicle C vehicle D vehicle E
vehicle F vehicle G vehicle H All vehicles
0%
10%
20%
30%
40%
50%
60%
70%
80%
90%
100%
-40 -30 -20 -10 0 10 20
2100 MHz
vehicle A vehicle B vehicle C vehicle D vehicle E
vehicle F vehicle G vehicle H All vehicles
In-car Mobile Signal Attenuation Measurements
November 8, 2017 Page 45/50
Figure 19: Weighted CDF for dash and console at 2600 MHz across all vehicles
0%
10%
20%
30%
40%
50%
60%
70%
80%
90%
100%
-40 -30 -20 -10 0 10 20
2600 MHz
vehicle A vehicle B vehicle C vehicle D vehicle E
vehicle F vehicle G vehicle H All vehicles
In-car Mobile Signal Attenuation Measurements
November 8, 2017 Page 46/50
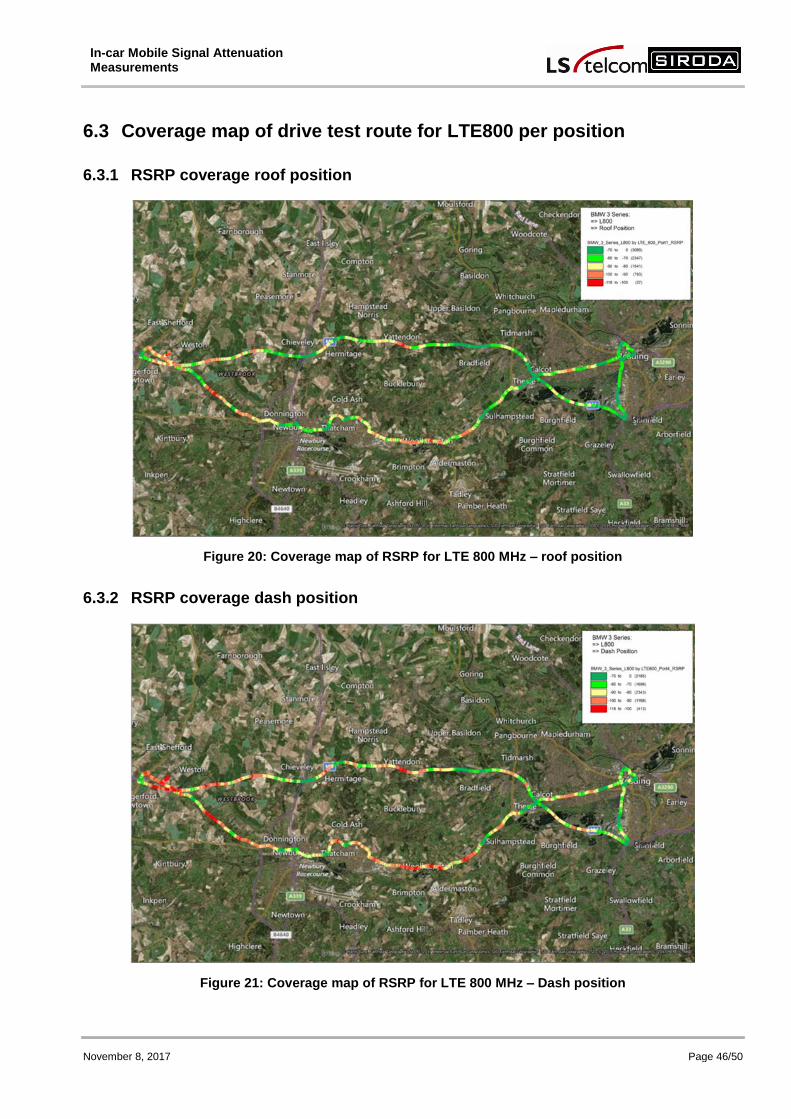
6.3 Coverage map of drive test route for LTE800 per position
6.3.1 RSRP coverage roof position
Figure 20: Coverage map of RSRP for LTE 800 MHz – roof position
6.3.2 RSRP coverage dash position
Figure 21: Coverage map of RSRP for LTE 800 MHz – Dash position
In-car Mobile Signal Attenuation Measurements
November 8, 2017 Page 47/50
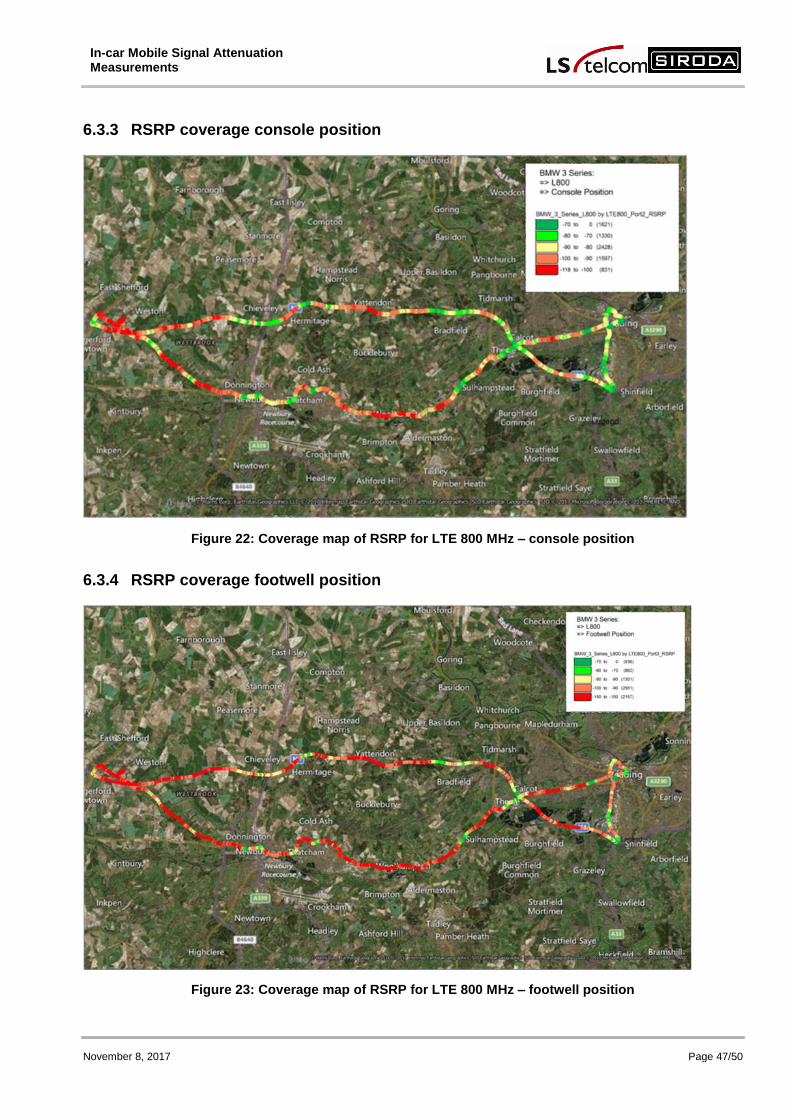
6.3.3 RSRP coverage console position
Figure 22: Coverage map of RSRP for LTE 800 MHz – console position
6.3.4 RSRP coverage footwell position
Figure 23: Coverage map of RSRP for LTE 800 MHz – footwell position
In-car Mobile Signal Attenuation Measurements
November 8, 2017 Page 48/50
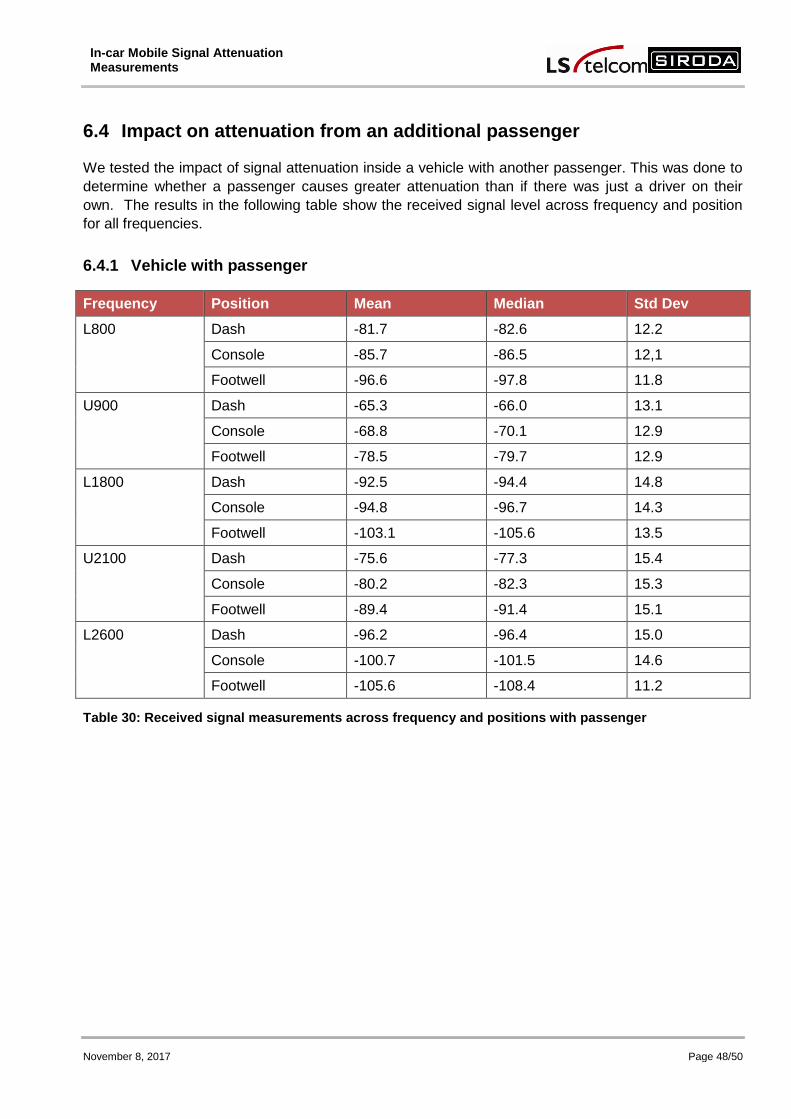
6.4 Impact on attenuation from an additional passenger
We tested the impact of signal attenuation inside a vehicle with another passenger. This was done to
determine whether a passenger causes greater attenuation than if there was just a driver on their
own. The results in the following table show the received signal level across frequency and position
for all frequencies.
6.4.1 Vehicle with passenger
Frequency Position Mean Median Std Dev
L800 Dash -81.7 -82.6 12.2
Console -85.7 -86.5 12,1
Footwell -96.6 -97.8 11.8
U900 Dash -65.3 -66.0 13.1
Console -68.8 -70.1 12.9
Footwell -78.5 -79.7 12.9
L1800 Dash -92.5 -94.4 14.8
Console -94.8 -96.7 14.3
Footwell -103.1 -105.6 13.5
U2100 Dash -75.6 -77.3 15.4
Console -80.2 -82.3 15.3
Footwell -89.4 -91.4 15.1
L2600 Dash -96.2 -96.4 15.0
Console -100.7 -101.5 14.6
Footwell -105.6 -108.4 11.2
Table 30: Received signal measurements across frequency and positions with passenger
In-car Mobile Signal Attenuation Measurements
November 8, 2017 Page 49/50
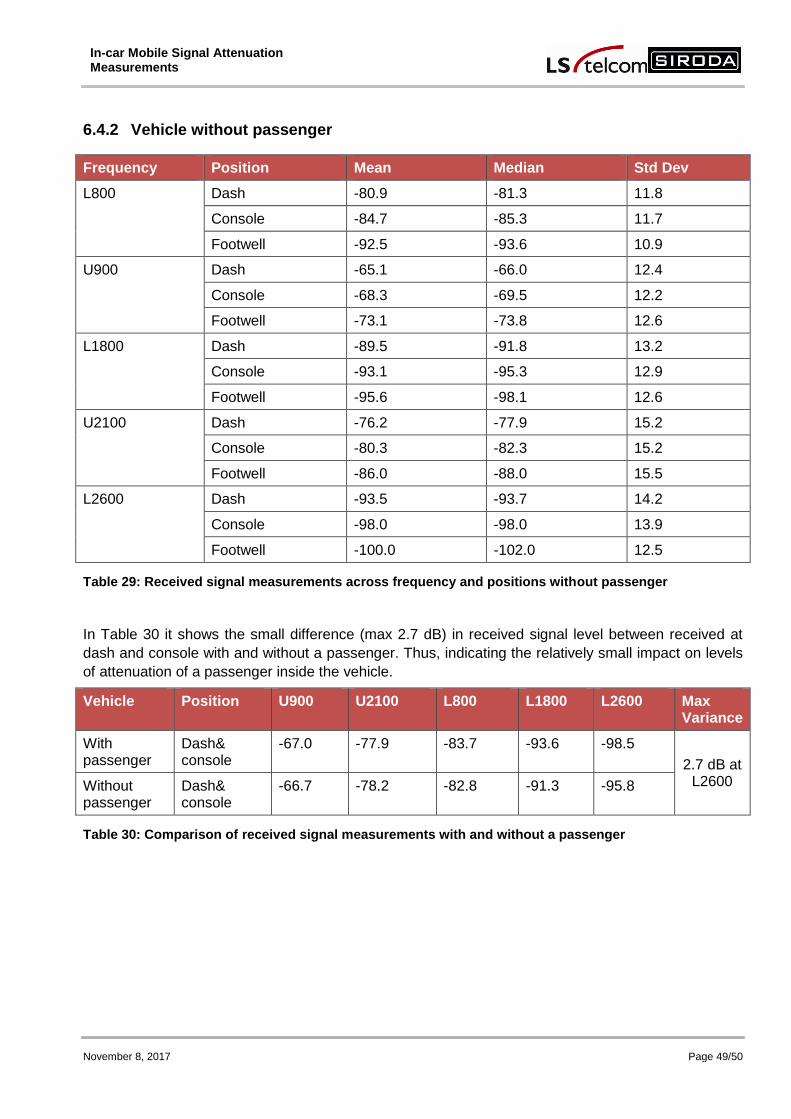
6.4.2 Vehicle without passenger
Frequency Position Mean Median Std Dev
L800 Dash -80.9 -81.3 11.8
Console -84.7 -85.3 11.7
Footwell -92.5 -93.6 10.9
U900 Dash -65.1 -66.0 12.4
Console -68.3 -69.5 12.2
Footwell -73.1 -73.8 12.6
L1800 Dash -89.5 -91.8 13.2
Console -93.1 -95.3 12.9
Footwell -95.6 -98.1 12.6
U2100 Dash -76.2 -77.9 15.2
Console -80.3 -82.3 15.2
Footwell -86.0 -88.0 15.5
L2600 Dash -93.5 -93.7 14.2
Console -98.0 -98.0 13.9
Footwell -100.0 -102.0 12.5
Table 29: Received signal measurements across frequency and positions without passenger
In Table 30 it shows the small difference (max 2.7 dB) in received signal level between received at
dash and console with and without a passenger. Thus, indicating the relatively small impact on levels
of attenuation of a passenger inside the vehicle.
Vehicle Position U900 U2100 L800 L1800 L2600 Max Variance
With passenger
Dash& console
-67.0 -77.9 -83.7 -93.6 -98.5
2.7 dB at L2600 Without
passenger Dash& console
-66.7 -78.2 -82.8 -91.3 -95.8
Table 30: Comparison of received signal measurements with and without a passenger

In-car Mobile Signal Attenuation Measurements
November 8, 2017 Page 50/50
Vehicle Position U900 U2100 L800 L1800 L2600 Max Variance
With passenger
Dash
7.1 6.6 6.3 7.2 4.8
0.9 dB at L1800 Without
passenger 7.0 6.8 5.9 6.1 4.6
With passenger
Console
10.6 11.2 10.3 9.4 9.3
0.6 dB at L800 Without
passenger 10.3 10.9 9.7 9.6 9.2
Table 31: Comparison of attenuation levels with and without a passenger