Embed Size (px)
Citation preview


In existence since 1969 (S.J. Slinger & C.Y. Cho)
Historically regarded as a key fish nutrition lab. Mind set, methodologies, equipment, feed formulae
Sustained funding by government agencies and industry Core funding from OMNR OMAFRA, NSERC, Fisheries and Oceans, AquaNet
Currently undergoing growth & youth movement Hosted and trained100 graduate students, post-docs, & research assistants since 1992


Freshwater Cage RBT Culture in Ontario, Canada
• Open-water cage production of rainbow trout
• Average grow-out period (10 g to 1 kg BW) = 16 months (long and risky!)
Winter Autumn
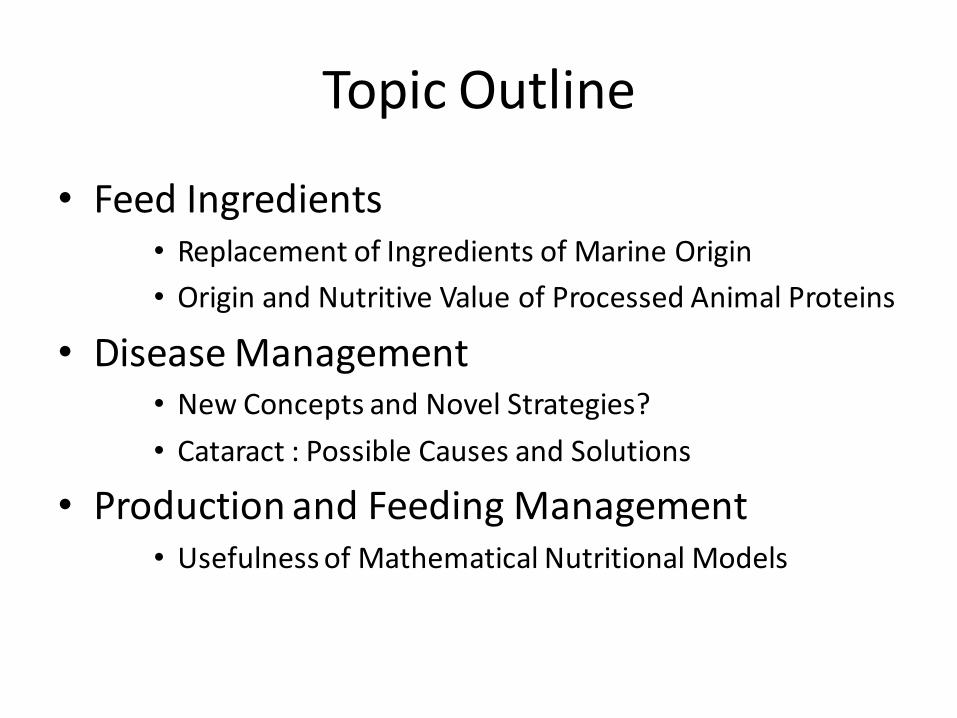
Topic Outline
• Feed Ingredients • Replacement of Ingredients of Marine Origin
• Origin and Nutritive Value of Processed Animal Proteins
• Disease Management • New Concepts and Novel Strategies?
• Cataract : Possible Causes and Solutions
• Production and Feeding Management • Usefulness of Mathematical Nutritional Models

1. Feed Ingredients

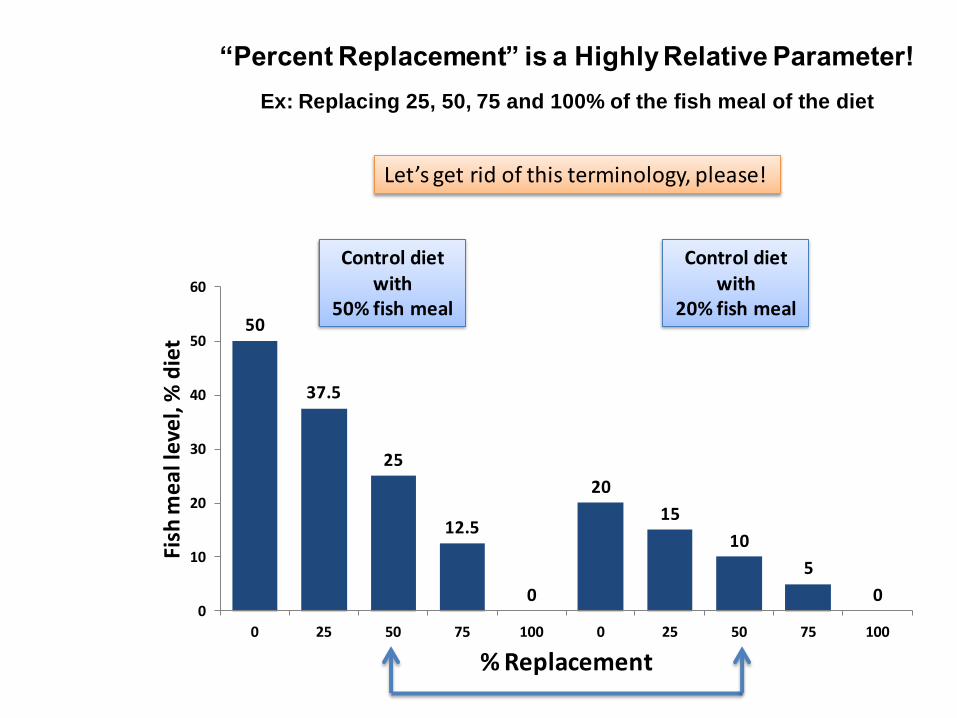
“Percent Replacement” is a Highly Relative Parameter!
Ex: Replacing 25, 50, 75 and 100% of the fish meal of the diet
50
37.5
25
12.5
0
20
15
10
5
0 0
10
20
30
40
50
60
0 25 50 75 100 0 25 50 75 100
Fish
me
al le
vel,
% d
iet
% Replacement
Control diet with
50% fish meal
Control diet with
20% fish meal
Let’s get rid of this terminology, please!

Animals Utilize NUTRIENTS not Proximate Components or Ingredients
What’s important?
– Individual nutrient requirements of animals
– Nutrient content of feed ingredients and associated variability
– Digestibility and bio-availability of nutrients
– Potential limitations (e.g. contaminants, anti-nutritional factors)
– Impacts (e.g. physical properties, waste outputs, final product quality) of the ingredients

NRC 2011
Review of state-of-the-art
Committee reviewed 1000s of papers
Imperfect document and recommendations represent best effort
NRC Committee of Nutrient Requirements of Fish and Shrimp (2009-2011)

What Does Fish Meal Bring That Plant Feed Ingredients Don’t?

Focusing on Nutrients, not Ingredients
A simple example

Trushenski et al. (2012)
oil oil

Trushenski et al. (2012)

Trushenski et al. (2012)

Trushenski et al. (2012)

Takeuchi (2001)
Evidence that for some species DHA is the essential fatty acid and that EPA doesn’t have to same efficacy.
This is a lot more informative and accurate than “fish oil replacement value”

What Are the Alternative Nutrient Sources?

0 45 90 135 180
Soybean meal
Canola/rapeseed/mustard …
DDGS (EU/NA)
Corn gluten meal
Poultry by-product meal
Meat and bone meal
Feather meal
Porcine meal
Aquatic animal protein
Pla
nt
pro
du
cts
(Wo
rld
) A
nim
al p
rod
uct
s
(No
rth
Am
eri
ca)
(MMT)
Feed Commodities :
Plant feedstuffs = Most abundant feed commodities!
Main nutrient sources
Complementary nutrient sources

Aquaculture Feed Formulation in Asia:
Complex mixtures of many different ingredients!
In Asia, aquaculture feeds can now be described as “plant-based feeds” with complementary use
of ingredients/additives of animal and microbial origins

• 35 million cattle (49% of live wt. not used for human food)
• 100 million hogs (44% not used for human food) “Eating high off the hog”
• 8 billion chickens (37% not used for human food)
• 280 million turkeys (36% not used for human food)
U.S. Animal Agriculture Annual Production

“When butchering time was over, there were the sausages and the headcheese, the big jars of lard
and the keg of white salt-pork out in the shed, and in the attic hung the smoked hams and shoulders.” (Laura Ingalls Wilder. 1932. Little House in the
Big Woods)
Full valorization of butchered animals in an agrarian society

Michel Charvet Salaisons d’Alsace
Dans le cochon, tout est bon!
En el cerdo, todo es bueno

Delicatessen (“Charcuterie”) Counter in Europe

Salade de gésiers (Gizzard salad)
France
Chicken feet dim sum China
Tkalia ou Douara (Lamb offals stew)
Morocco
Gastronomical Treasures…
Tripes à la mode de Caen (Caen-style tripes)
France

Chicago stockyards, ca. 1913.
Union Stock Yards, 1866. (CHS ICHi-06898)
Centralization of Meat Packing Facilities
"Five hundred animal pens covering 60 acres of land were used to house the livestock, and the whole operation could accommodate 21,000 head of cattle, 75,000 hogs, 22,000 sheep, and 200 horses at one time,"

A Potential Environmental Disaster


Sustainable Agriculture Systems

The Rendering Industry (U.S. and Canada)
• 273 facilities in the U.S. and 29 in Canada
• $3.5 billion annual revenue
• 26.3 MMT (59 billion lb) raw material each year
• 72.3 million kg raw material each day

Raw Materials
• Offals
• Bones and fat
• Blood
• Restaurant
grease
• Feathers
• Recalled meat

Stabilized Poultry
Fat
Stabilized Pet Food
Poultry Fat
Hydrolyzed Poultry
Feather Meal
Stabilized
Poultry
Protein Meal
Low Ash Pet Food
Poultry Protein Meal
Pet Food Poultry
Protein Meal
Examples of a Few Finished Products

Rendering is Cooking and Drying
• Continuous flow or batch
• Steam cookers
• 115º to 145º C. for 40 to 90 minutes (245º to 290º F.)
• Rendering offers a sanitary and eco-
friendly way to dispose of the
massive amount of meat and food
by-products produced every year.
• Such materials spoil easily and
make an excellent media for
pathogens to grow and multiply.
• Temperatures used during processing kill conventional disease-
causing organisms, such as bacteria
and viruses.


Fish Meal and Fish Oil Production Plant

Process Controls in Rendering
Cooking temperature, time and other conditions (loading, pressure/vacuum,
moisture levels, etc.) are closely monitored, controlled, and recorded.

Plant Operator Screen

Rendering Destroys Bacteria of Food Safety Concern
Bacteria Raw Tissue Post-Press
Clostridium perfingens 71% 0%
Listeria species 76% 0%
L. Monocytogenes 8% 0%
Campylobacter species 30% 0%
C. Jejuni 20% 0%
Salmonella species 85% 0%
U. Of Illinois, 2001. 17 rendering facilities sampled summer and winter.
Percentage of samples having pathogens present.

• Foot-and-Mouth Disease (FMD)
• Pseudorabies Virus (PRV)
• Bacillus Anthracis (Anthrax)
• Avian Influenza
Rendering Inactivates Organisms Important to
Human and Animal Health
Bacillus Anthracis cells with spores
Adequately Characterizing the Chemical Composition and Nutritive Value of Ingredients

1970-95 : Review of literature and discussions with feed industry personnel and researchers indicate general lack of trust in nutritive value of animal proteins for fish
Why? Digestibility values of certain animal products reported in the reference literature (up to 1993) were very low, making these ingredients uninteresting to use. USA National Research Council (1993): Apparent digestibility coefficient (ADC) of protein Feather meal 58% Poultry meal 68%
Historical Note (1995)
Data from Cho & Slinger (1979)
(U of Guelph)
Are these old Guelph reference values realistic?

The Guelph System (Cho et al., 1982)

Collection of Fecal Samples
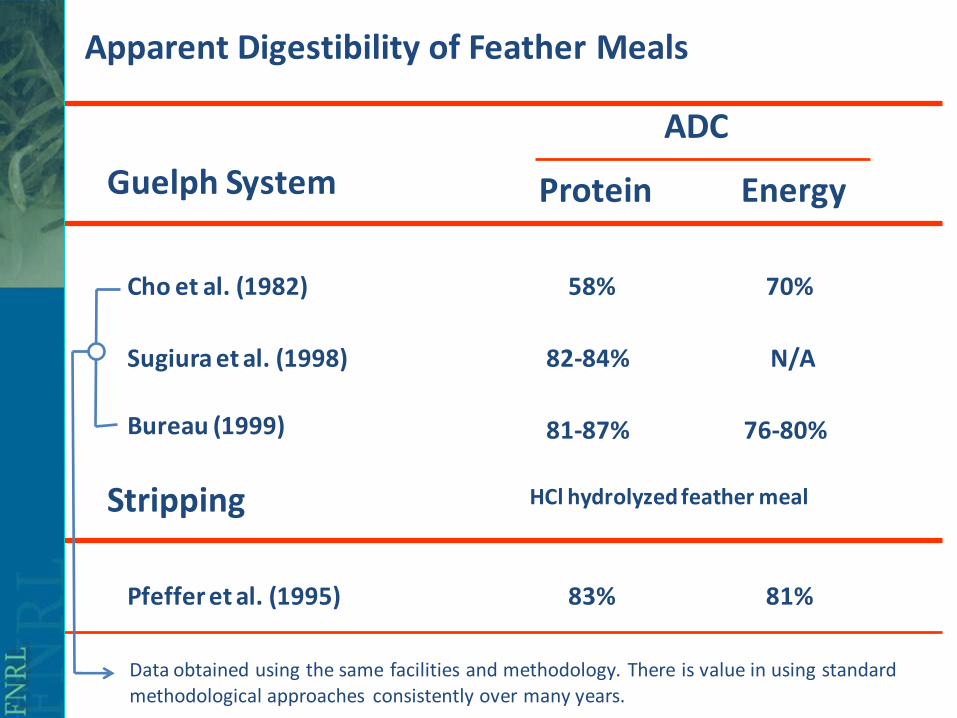
Apparent Digestibility of Feather Meals
Guelph System
ADC
Protein Energy
82-84% N/A Sugiura et al. (1998)
58% 70% Cho et al. (1982)
Stripping
81-87% 76-80% Bureau (1999)
83% 81% Pfeffer et al. (1995)
HCl hydrolyzed feather meal
Data obtained using the same facilities and methodology. There is value in using standard methodological approaches consistently over many years.

Apparent Digestibility of Poultry By-Products Meal
Guelph System
ADC
Protein Energy
68% 71% Cho et al. (1982)
Bureau et al. (1999) 87-91% 77-92%
74-85% 65-72% Hajen et al. (1993)
96% N/A Sugiura et al. (1998)
Data obtained using the same facilities and methodology

Meat and Bone Meal
Guelph System ADC
Protein Energy
62% 70% Cho et al. (1982)
Stripping
83-89% 68-82% Bureau et al. (1999)
59% N/A Skrede et al. (1980)
70% N/A Dimes et al. (1994)

Apparent Digestibility Coefficients (%) Ingredients DM CP GE
Trial #1
Feather meal 1 82 81 80 Feather meal 2 80 81 78 Feather meal 3 79 81 76 Feather meal 4 84 87 80 Meat and bone meal 1 61 83 68 Meat and bone meal 2 72 87 73 Trial #2
Meat and bone meal 3 72 88 82 Meat and bone meal 4 66 87 76 Meat and bone meal 5 70 88 82 Meat and bone meal 6 70 89 83 Trial #3
Feather meal 5 86 88 84 Feather meal 6 83 86 81 Feather meal 7 83 88 83 Meat and bone meal 7 78 92 86 Meat and bone meal 8 72 89 81 Meat and bone meal 9 69 88 80
Apparent Digestibility of Processed Animal Proteins in the late 1990s
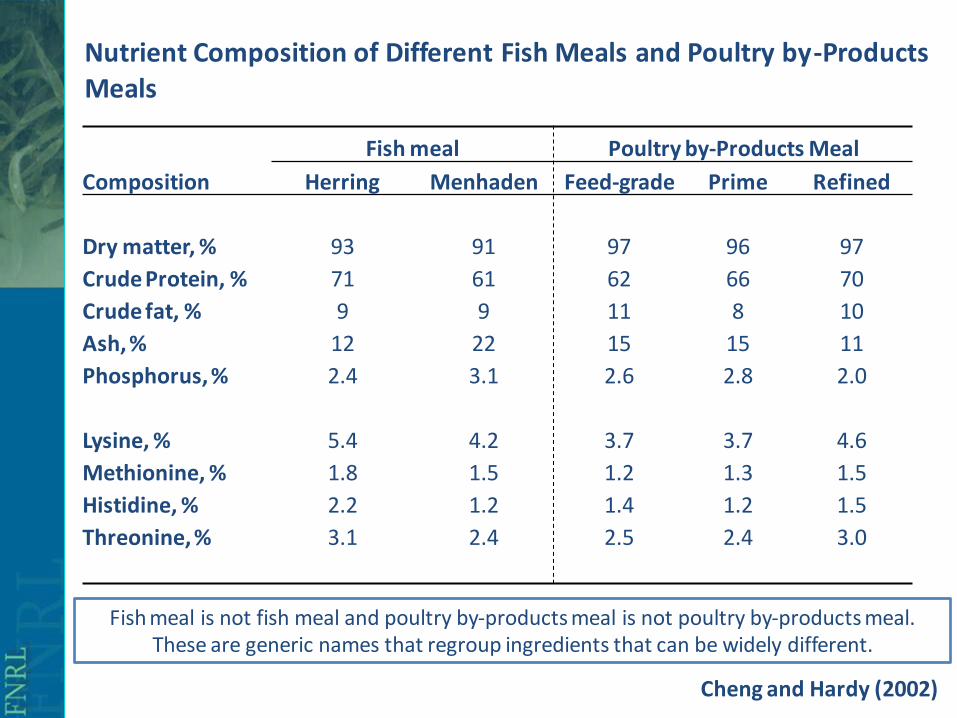
Cheng and Hardy (2002)
Nutrient Composition of Different Fish Meals and Poultry by-Products Meals
Fish meal Poultry by-Products Meal
Composition Herring Menhaden Feed-grade Prime Refined
Dry matter, % 93 91 97 96 97
Crude Protein, % 71 61 62 66 70
Crude fat, % 9 9 11 8 10
Ash, % 12 22 15 15 11
Phosphorus, % 2.4 3.1 2.6 2.8 2.0
Lysine, % 5.4 4.2 3.7 3.7 4.6
Methionine, % 1.8 1.5 1.2 1.3 1.5
Histidine, % 2.2 1.2 1.4 1.2 1.5
Threonine, % 3.1 2.4 2.5 2.4 3.0
Fish meal is not fish meal and poultry by-products meal is not poultry by-products meal. These are generic names that regroup ingredients that can be widely different.

Fish meal Poultry by-Products Meal
Component Herring Menhaden Feed-grade Prime Refined
%
Dry matter 81 71 71 72 75
Crude Protein 90 86 83 85 87
Crude fat 92 91 80 83 80
Phosphorus 58 47 49 46 56
Lysine 95 95 89 92 93
Methionine 95 95 92 95 94
Histidine 92 93 85 89 89
Threonine 90 92 82 85 85
Apparent Digestibility of Nutrients of Different Fish Meals and Poultry By-Products Meals
Cheng and Hardy (2002)
Information on EAA content and digestibility is extremely meaningful for the formulation of cost-effective feeds

Use of Rendered Animal Proteins in Practical Feeds

Formulation of Experimental Diets Used in Feather Meal Trial
Ingredients Diet 1 2 3 4 5 6 7 8
Herring meal 50 35 35 35 50 40 30 20
Blood meal, tube-dried 10 10 10 10 6 9 12 15
Feather meal 1 15
Feather meal 2 15
Feather meal 4 15 8 12 16 20
Corn gluten meal 10 10 10 10 6 9 12 15
Whey 12 12 12 12 12 12 12 12
Vitamins + minerals 3 3 3 3 3 3 3 3
Fish oil 15 15 15 15 15 15 15 15

Performance of rainbow trout fed diets with different feather meals
Diet Gain Feed FE RN RE
g/fish g/fish g/fish kJ/fish
1- Control 73.5 ab 51.6 1.42 ab 1.9 a 587 a
2- 15% FEM 1 74.3 ab 51.4 1.44 a 1.9 a 553 a
3- 15% FEM 2 71.1 bc 52.0 1.37 bc 1.8 a 561 a
4- 15% FEM 4 73.0 abc 52.3 1.40 abc 1.9 a 547 a
5- 20% FEM-CGM-BM 74.5 a 51.8 1.44 a 1.9 a 574 a
73.2 abc 51.7 1.42 abc 1.9 a 554 a
73.3 abc 52.2 1.41 abc 1.9 a 579a
70.1 c 51.8 1.35 c 1.8 a 537a
G:F
6- 30% FEM-CGM-BM
8- 50% FEM-CGM-BM
7- 40% FEM-CGM-BM
Could not highlight differences in the nutritive value of feather meals with different digestible protein levels. Diets 2-4 contained at least 35% fish meal.

Experimental Diets for Protein Combination Trial

Diet Weight Efficiency TGC*
g/fish
1- Control 278 a 1.19 a 0.261 a
2- FEM + MBM 247 bcd 1.04 bc 0.241 bc
3- FEM+MBM+Met 248 bcd 1.06 bc 0.241 bc
4- FEM+MBM+Lys 242 d 1.03 c 0.238 c
5- FEM+PBM 264 ab 1.14 ab 0.252 ab
251 bcd 1.06 bc 0.243 bc
261 abc 1.11 abc 0.250 abc
245 cd 1.04 c 0.239 bc
G:F
Fish Performance in Protein Combinations Trial
Duration = 12 weeks Temperature = 15 oC Initial weight = 35 g/fish
6- FEM+PBM+Met
8- MBM+PBM
7- FEM+PBM+Lys
Final Feed
*TGC = (FBW1/3 - IBW1/3) / (Temp. (oC) * days)
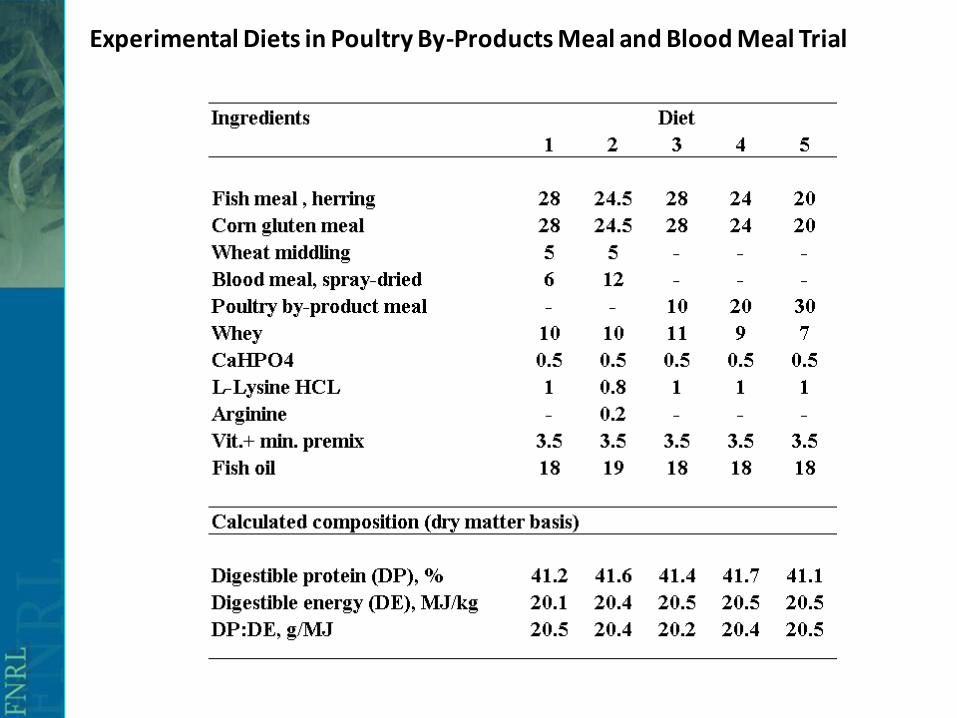
Experimental Diets in Poultry By-Products Meal and Blood Meal Trial

Diet FBW TGC FE
g/fish G:F
1- Control 6% BM 209 0.200 1.11
2- 12% BM 215 0.205 1.19
3- 10% PBM 201 0.195 1.11
4- 20% PBM 202 0.199 1.13
5- 30% PBM 209 0.199 1.13
Performance in Poultry By-Products Meal & Blood Meal Trial
Initial body weight = 17 g/fish, Duration= 16 weeks, Temp. = 15 oC
ADC
Protein Energy
96 92
95 91
95 93
94 92
93 92
No significant difference according to Tukey’s HSD test.

1 2 3 4 5 6
Ingredients MM10 MM20 HM10 HM20 NFM Profishent
Fish meal, herring
-
-
100
200
-
+
Fish meal, menhaden 100 200 - - - -
Poultry by-prod. meal 300 200 300 200 400 +
Soybean meal 90 80 120 120 70 +
Corn gluten meal 150 150 120 90 150 +
Feather meal 50 70 50 70 70 +
Wheat 100 100 110 130 100 +
Fish oil, herring 120 110 120 110 130 +
Poultry Fat 60 60 60 60 50 +
Feeds Based on Herring Meal, Menhaden Meal or Poultry Meal
Unit: kg/tonne of feed

Diet Initial
weight
Final
weight
Weight
gain
Feed
intake FE TGC
(g/fish) (g/fish)
(g/fish) (g/fish) (gain/feed
intake) (%)
MM10 15.5 205 189.2 180.1 1.05b
0.199
MM20 15.5 193 177.3 158.4 1.12ab
0.192
HM10 15.4 203 187.5 161.0 1.16ab
0.199
HM20 15.8 222 206.4 171.7 1.20a
0.208
NFM 16.0 208 192.1 182.2 1.06b
0.199
Profishent 15.9 203 187.5 165.3 1.13ab
0.197
SEM 6.2 6,2 5.2 0.03 0.03
1
Values with different subscript letters are significantly different (P<0.05)
Growth and Feed Efficiency of Rainbow Trout Fed the Test Feeds
for 16 weeks at 15ºC.


Trials Conducted by a Salmon Feed Manufacturer

2. Novel Concepts in Disease Management

Better Nutrition = Better Disease Resistance?
Magic “nutritional” bullet against bacterial gill disease!

Cumulative mortality of rainbow trout challenged with Flavobacterium branchiophilum and subjected to different feeding regimes

Effect of exposure to a mycotoxin (deoxynivalenol) on resistance of rainbow trout to
coldwater disease
Ian Ryerse
MSc. Candidate
Supervisors: Dr. John Lumsden, Dr. Dominique Bureau and Dr. Tony Hayes

Experimental diets
4 - Treatment Groups
1. Control <0.5 ppm 2. 4 ppm 3. 6 ppm 4. Pair-fed control <0.5 ppm
Daily Feed Intake:
Control:
4 ppm DON:
6 ppm DON:
Pair-fed:
Red
uce
d fe
ed in
tak
e

Trial # 1
• 4 treatments
• 40 fish/ tank (7.5 g/fish)
• triplicates
• fed to apprent satiety
• water temperature 11 C
– ideal for F. psychrophilum
Experimental Infection (i.p.) • 5x10⁶ CFU/mL F. psychrophilum
(100uL) • controls – sham infected – sterile
broth Image from -billkasal.com

Results: Survival Curve
*All curves significantly differed in comparison to control and pair-fed groups (Holm-Sidak, p<0.05)
Survival curve – Trial #1
a a
c
b

Results: Survival Analysis
Trial # 1 Replicate trial
a a
b
c
a,b a,b
b
a

Results
*Pair-fed and 6 ppm group significantly differed in comparison to the control fed group (Holm-Sidak, p<0.05)
Survival curve – Trial #2
a
ab
b
a

“DON residues do not appear to accumulate in
tissues to any appreciable extent”
Results
Inhibitory action of DON on the growth of F. psychrophilum
- Prelusky and Trenholm, 1992
• No significant findings from blood work

Potential implications:
Potential for developing feeding strategies and diets for disease states?
The paradigm “Better nutrition equals better disease resistance” is not always true. In some cases, nutrient supply can have a negative effect on the ability of the animal to cope with pathogens and stress (at least for Flavobacterium spp.
Infections)
Relative to feeding or supply of specific nutrients (needed by pathogens?)
Most effective strategy? STOP FEEDING! (for several days)
Better Nutrition = Better Disease Resistance? No, not necessarily!

Cataract : Causes and Management
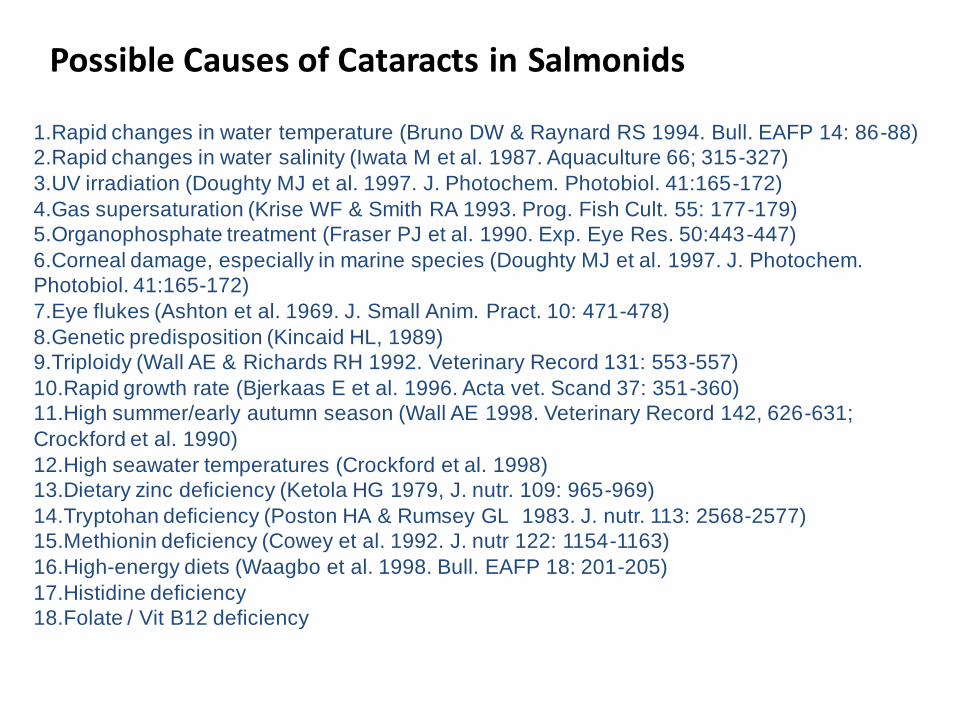
1.Rapid changes in water temperature (Bruno DW & Raynard RS 1994. Bull. EAFP 14: 86-88)
2.Rapid changes in water salinity (Iwata M et al. 1987. Aquaculture 66; 315-327)
3.UV irradiation (Doughty MJ et al. 1997. J. Photochem. Photobiol. 41:165-172)
4.Gas supersaturation (Krise WF & Smith RA 1993. Prog. Fish Cult. 55: 177-179)
5.Organophosphate treatment (Fraser PJ et al. 1990. Exp. Eye Res. 50:443-447)
6.Corneal damage, especially in marine species (Doughty MJ et al. 1997. J. Photochem.
Photobiol. 41:165-172)
7.Eye flukes (Ashton et al. 1969. J. Small Anim. Pract. 10: 471-478)
8.Genetic predisposition (Kincaid HL, 1989)
9.Triploidy (Wall AE & Richards RH 1992. Veterinary Record 131: 553-557)
10.Rapid growth rate (Bjerkaas E et al. 1996. Acta vet. Scand 37: 351-360)
11.High summer/early autumn season (Wall AE 1998. Veterinary Record 142, 626-631;
Crockford et al. 1990)
12.High seawater temperatures (Crockford et al. 1998)
13.Dietary zinc deficiency (Ketola HG 1979, J. nutr. 109: 965-969)
14.Tryptohan deficiency (Poston HA & Rumsey GL 1983. J. nutr. 113: 2568-2577)
15.Methionin deficiency (Cowey et al. 1992. J. nutr 122: 1154-1163)
16.High-energy diets (Waagbo et al. 1998. Bull. EAFP 18: 201-205)
17.Histidine deficiency
18.Folate / Vit B12 deficiency
Possible Causes of Cataracts in Salmonids


The lens fiber cells are normally held in a relatively dehydrated state by the action of the Na+/K+ pump. Changes in the Na+, K+ and Cl- permeability of the lens can alter the ability of the lens to control its swelling. Consequently, any agent, event or factor that increase permeability of the lens membrane can comprise the clarity of the lens
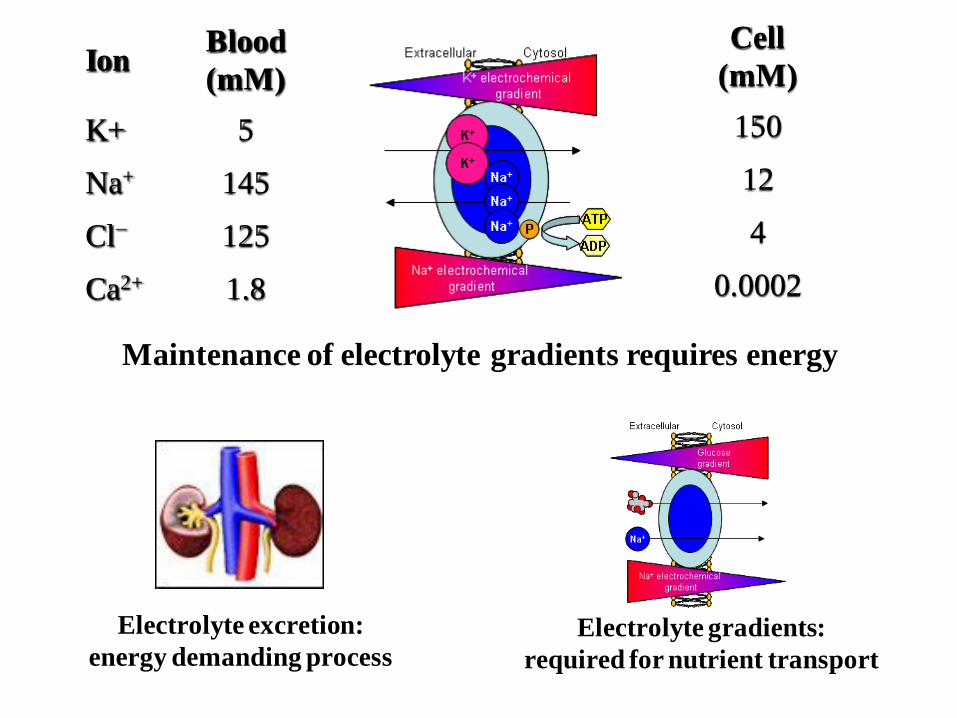
Ion Blood
(mM)
K+ 5
Na+ 145
Cl− 125
Ca2+ 1.8
Crenshaw, 1991
Cell
(mM)
150
12
4
0.0002
Maintenance of electrolyte gradients requires energy
Electrolyte gradients:
required for nutrient transport
Electrolyte excretion:
energy demanding process

–Environmental - temperature, oxygen level, pollutions, predators….
–Physiological - fasting, infections, and reproduction (such as maturation, migration, mating behaviours…) are stressful processes;
Stress results in animal plasma cortisol level increase to combat the unsuitable environment
Stressors:

Pathogenic haemoflagellate parasite found in salmonids on west coast of North America. About the size of red blood cell
Cryptobia salmositica

↑ Stress, ↑ Cortisol
↓Immune Response
↑Susceptibility to infection ↑Multiplication of parasites
Stress vs. Susceptibility to Parasites (Cryptobiosis)
1. Elevated cortisol level (implant) suppressed immunocapacity and increased parasitaemia in rainbow trout (Woo et al., J. Fish Biol, 1987);

↑ Stress, ↑ Cortisol
↑Multiplication of parasites
?
Stress vs. Susceptibility to Parasites
2. Addition of cortisol to cultures (10ng/ml) increased parasite multiplication (Woo, 2008 unpld)

The stress hormone, Cortisol, promotes parasite (Cryptobia salmositica) multiplication under in vitro conditions: Possible applications
to aquaculture practices
Mao Li
Department of Integrative Biology, University of Guelph

Weeks Post-Exposure
Pa
ras
ite
nu
mb
ers
.ml-1
0
100x103
200x103
300x103
400x103
Control
10 ng
25 ng
50 ng
2 3 4 5
Results : Cortisol at physiological levels enhance parasite replication
Li et al., IJP (2013)

Weeks Post-Exposure
Pa
rasi
tes.
ml-
1
0
500x103
1x10⁶
2x10⁶
2x10⁶Control
Cort
Cort+RU486
Dex
Dex+RU486
Result 2: The type of response of parasite to cortisol is similar to that observed in vertebrate cells
-- GR-like protein exists in the parasite!
2 3 4 5

Weeks Post-Exposure (WPE)
Pa
ra
site
s.m
l-1
0.0
500.0x10³
1.0x10⁶
1.5x10⁶
2.0x10⁶
2.5x10⁶
Control
50ng RU486
100ng RU486
a b
a a
a a
2 3 4 5
Result 3: RU486 suppresses parasite multiplication
Li and Woo, IJP (2014)
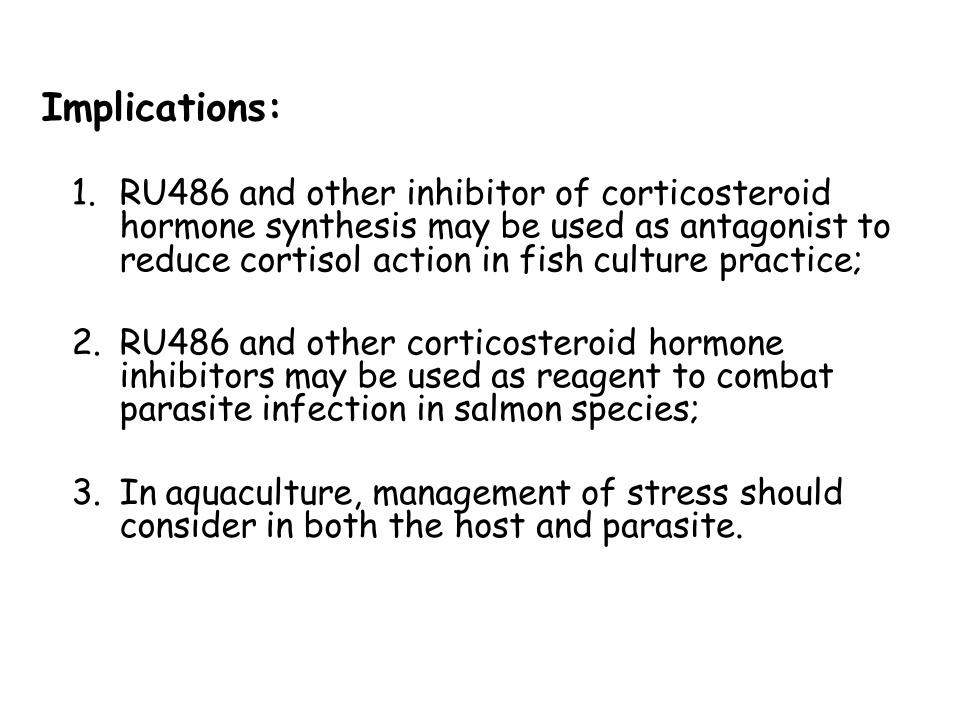
Implications:
1. RU486 and other inhibitor of corticosteroid hormone synthesis may be used as antagonist to reduce cortisol action in fish culture practice;
2. RU486 and other corticosteroid hormone inhibitors may be used as reagent to combat parasite infection in salmon species;
3. In aquaculture, management of stress should consider in both the host and parasite.

3. Production and Feeding Management

Modeling Growth and Feed Requirements of Fish under Commercial Conditions:
Matching Science and Practice to Improve Efficiency and
Sustainability

Aquaculture producers require tools to: Manage and/or forecast production Estimate feed requirements Audit feed conversion ratio (feed:gain) achieved Estimate the amount of waste outputs from their facilities
Wanted: Effective Production Management Tools

A lot of information is collected every day/week/month by aquaculture operations. Much of the information is collected and analyzed in a “piece-meal” fashion (i.e. not very systematically or meaningfully) How can we make best use of this information?
Making Better Use of Information
Example: I may have a lot of information but …
How can I meaningfully compare the growth rate or FCR of groups of
fish (or shrimp) reared at two different production sites with different
temperature profiles, over a different time periods or live weight
intervals and fed different diets?

Approaches for Dealing with Current Challenges?
Dairy producers have been using mathematical models to manage production, breeding and feeding of dairy cows for decades
Mathematical models have proven to be very valuable for other animal industries and stand as prominent tools to meet current challenges in aquaculture
Mathematical modeling has been shown to be an effective way of compiling, integrating, and interpreting production information and enabling the development of practical and reliable tools for feed formulation and production, feeding, and waste outputs management.

Evolution of Average Production of Holstein Cows in Canada
Attributable to Genetic Gain, Better Feeding and Better Management
Enabled by: 1) systematic recording of performances, 2) sharing of data , 3) very advanced mathematical models and 4) practical tools (genetic selection index, feeding
management software, etc.)

Better Understanding
Improved Practices
Precise Models & Management
Tools
Quality Data & Information
Continuous Improvement Framework (virtuous cycle)
Combining information and models to improve efficiency of production

Mathematical Models as Tools for Dealing with Production Challenges
on Fish Culture Operations
From the laboratory to the field…

Starting from the lab….

Thermal-Unit Growth Coefficient (TGC) =
Final Body Weight1/3 - Initial Body Weight1/3
Sum ( Temperature (oC) x Days)
Iwama and Tauz (1981)
Cho (1992)
Simple Growth Model - Only Middle School Maths Required
Growth indice: independent of fish size
independent of length of time intervals
independent of water temperature
dependant of genetics
dependant of rearing practices, etc.

(Live w eight)1/3 = 0.019x + 5.38
R2 = 1.000
0
100
200
300
400
500
600
700
0 28 56 84 112 140 168
Days
Liv
e w
eig
ht
(g/f
ish
)
0
10
20
30
Liv
e w
eig
ht
(g/f
ish
) 1
/3
Rainbow trout fed to near-satiation at reared 8.5oC for 24 weeks
Growth Potential Hypothesis : Animals seek to a target growth trajectory unless limited by some
constraints or modified by interventions

0
20
40
60
80
100
120
0 28 56 84 112
Days
Liv
e w
eig
ht
(g/f
ish
) 15
12
9
6
Rainbow trout fed to near-satiation
at reared 6, 9, 12 and 15oC for 12 weeks
This rational/predictable growth pattern/trajectory remains fundamentally the same across environmental conditions (within certain boundaries)

DGC = 0.1933(Temp.)
R2 = 0.9921
0
0.5
1
1.5
2
2.5
3
3.5
0 5 10 15 20
Temperature (oC)
DG
C o
r T
GC
DGC
TGC
The effects of environmental conditions (e.g. temperature) is also rational/ predictable and can, thus, be described with relative simple mathematics.

Winter on a rainbow trout farm in Canada
Making our way to the field….
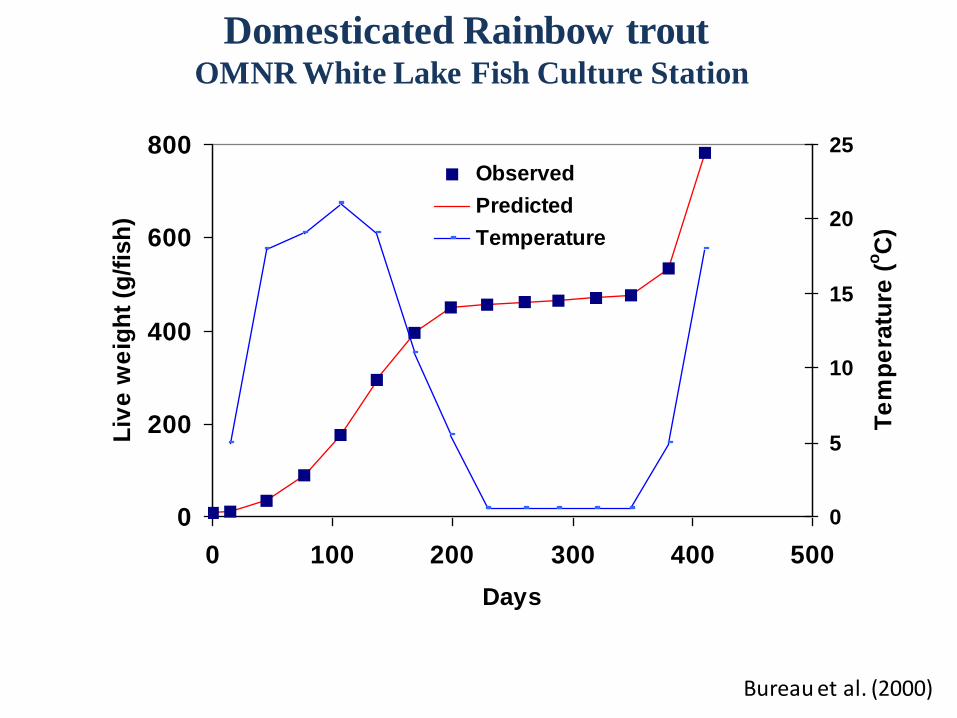
Domesticated Rainbow trout OMNR White Lake Fish Culture Station
0
200
400
600
800
0 100 200 300 400 500
Days
Liv
e w
eig
ht
(g/f
ish
)
0
5
10
15
20
25
Te
mp
era
ture
(oC
)
Observed
Predicted
Temperature
Bureau et al. (2000)

Evidence of three (3) growth stanzas for rainbow trout: = Need a modification of the TGC model to separate the three stanzas
Limitations of the TGC Model
Dumas et al. (2007)

Better Understanding
Improved Practices
Precise Models & Management
Tools
Quality Data & Information
Continuous Improvement Framework
Using available information in order to determine validity of models and to improve or refine them

Growth Performance and Feed Conversion Ratio of Commercial Rainbow Trout Farms in Ontario,
Canada
Owen Skipper-Horton, Gord Vander Voort, Flavio Schenkel, Dominique P. Bureau
Dept. of Animal and Poultry Science, University of Guelph

AB
AB
B
AB AB
0.000
0.050
0.100
0.150
0.200
0.250
A B C D E ELA
TGC
Farm ID
Mean
- Results -
Thermal Unit Growth Coefficients (TGC*) *TGC = (FBW1/3- IBW1/3) / Σ (temp* days)

0
5
10
15
20
25
0
100
200
300
400
500
600
700
800
900
0 50 100 150 200 250 300 350 400
Tem
pe
ratu
re (
C)
AB
W (g
)
Days
Standard TGC
Modified TGC
Observed
Temperature
Application to commercial rainbow trout farm data
Farm reported live body weight values from one individual lot

Farm Body Weight Estimates Relative to Model Predictions
Site “E,” Cage “Y”

Farm Estimates Appear to Deviate Towards Size of Largest Individuals Within Cages
***Farm-reported estimates of fish weight at different intervals are thus not highly reliable***

Reliability of Farm Estimates? • To estimate body weight of fish, most producers use
feed enticement and dip-netting
• Typical body weight estimates involve small numbers of fish (e.g. <1% of population)
• Little to no quantification of
within-cage size variability
Dip-netting with seine net

Better Understanding
Improved Practices
Precise Models & Management
Tools
Quality Data & Information
Continuous Improvement Framework
Using available information and modeling allowed us to point out to significant sampling bias by fish producers

Feed served (ex.: 1 kg of feed)
Biomass gain
(ex.: 1 kg of gain)
Efficiently Conversion of Feed into Fish Biomass and Products
Key Focus of Research Program of Fish Nutrition Research Laboratory

Starting from the lab….

The Fish-PrFEQ Bioenergetics Approach (Cho, 1991)
1- Predict or describe growth
2- Determine energy gains (RE)
3- Estimate heat and metabolic losses
4- Digestible energy requirement = sum
Need an appropriate growth model
Need information on carcass composition
Carcass gross energy (GE) x Weight gain
Maintenance (HeE) + Heat increment (HiE) + Non-fecal losses (UE+ZE)
DE = RE + HeE + HiE + (UE+ZE)

Intake of Energy (IE)
Fecal Energy (FE)
Digestible Energy (DE)
Urine Energy (UE)
Branchial Energy (ZE)
Metabolizable Energy (ME)
Net Energy (NE)
Recovered Energy (RE)
Basal Metabolism (HeE) Voluntary Activity (HjE)
Heat increment (HiE)
Bioenergetics Scheme (NRC-NAC, 1982)
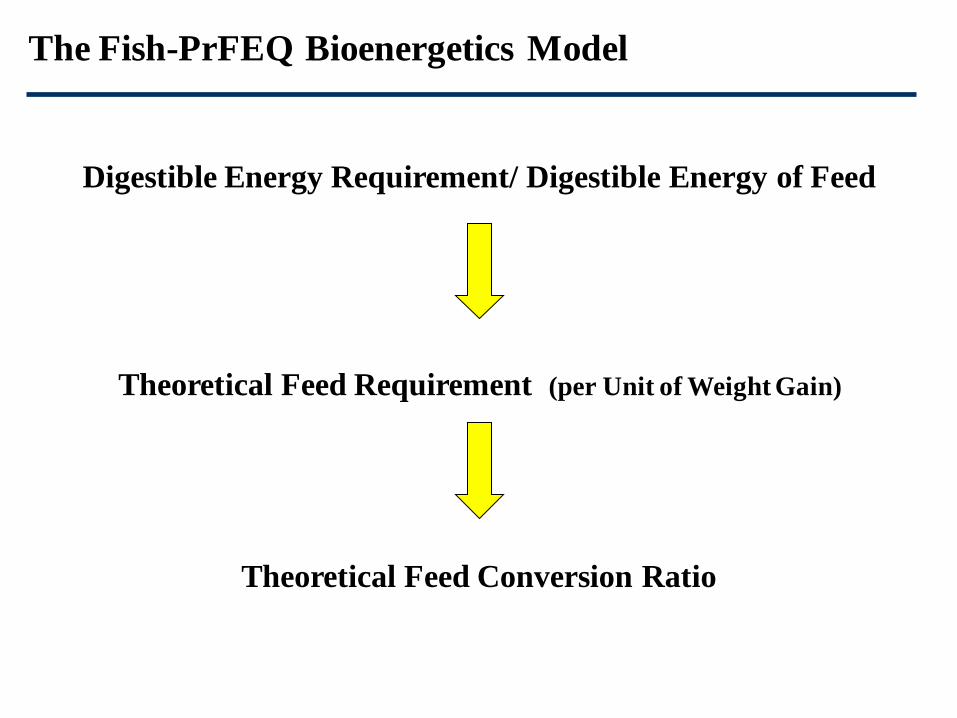
Digestible Energy Requirement/ Digestible Energy of Feed
Theoretical Feed Requirement (per Unit of Weight Gain)
Theoretical Feed Conversion Ratio
The Fish-PrFEQ Bioenergetics Model

0
0.2
0.4
0.6
0.8
1
1.2
1.4
1.6
0 500 1000 1500 2000 2500
FC
R (
Fe
ed
:Ga
in)
Live weight (g/fish)
Prediction of FCR of rainbow trout of increasing weight using a model developed by the UG/OMNR Fish Nutrition Research Laboratory

0.00
0.20
0.40
0.600.80
1.00
1.20
1.40
10-600 10-1000 10-1500
Fish Weight Range (g/fish)
FC
R (
Feed
:Gain
)Expected FCR of fish reared to different harvest weights
Feed: 37% DP, 20 MJ DE

To the field…
Feeding Time on Cage Rainbow Trout Culture Operation

0
0.4
0.8
1.2
1.6
2
0 200 400 600 800 1000
Weight (g/fish)
FC
R (
fee
d:g
ain
)
FCRtheo
FCRNWF
FCR Data courtesy of NorthWind Fisheries & Gregor Reid
Model Predictions vs. Farm Data
Discrepancies

Dietary Amino Acids
Protein gain ~ Biomass gain
Dietary energy
Carcass energy gain
Evolution of Feed Utilization Models
Food/Feed
Biomass gain

Model Simulations vs. Farm Data
0.00
0.50
1.00
1.50
2.00
2.50
0 200 400 600 800 1000 1200
Body Weight (g/fish)
Feed
Eff
icie
ncy (
G:F
)
FishPrFEQ Model
Hybrid Protein Bioenergetics Model
Farm Data
Bureau and Hua (2006)

– Results –
FCR vs. BW
0.0
0.2
0.4
0.6
0.8
1.0
1.2
1.4
1.6
1.8
2.0
0 500 1000 1500
Bio
logi
cal F
CR
Body Weight (g)
All Commercial Data, Ontario
• Data suggests increase in feed conversion ratio as fish weight increases • Consistent with results from controlled research trials and model
predictions

The Power of Combining Real Production Data and Model Simulations
Ex: FCR vs. Average Body Weight (ABW)
• Data suggests increase in feed conversion ratio as fish weight increases • Consistent with results from controlled research trials and model predictions
0
0.2
0.4
0.6
0.8
1
1.2
1.4
1.6
1.8
2
0 500 1000 1500
Bio
logi
cal F
CR
ABW (g)
Median
90th Percentile
10th Percentile

-1
0
1
2
3
4
5
0 150 300 450 600 750 900 1050 1200
Bio
logi
cal F
CR
(fe
ed:g
ain
)
Body Weight (g/fish)
Farm-Est BFCR
TGC-Est BFCR
Fish-PrFEQ BFCR
Biological FCR: Farm Estimates vs. Model Estimates (Interval Basis)
Estimates based on sample weights are highly variable and unrealistic

Conclusion
Models could be very valuable for improving productive efficiency of aquaculture operations Information from the lab or the field can be used to construct models Analysis of available information using models can : 1) Highlight limitations of models and contribute to improving
them 2) Held identify areas of improvement for production
management practices
Never blindly believe “model outputs” or “field data” !!!

Acknowledgements
Sincere thanks to Salmofood and Nicovita for this kind invitation
Funding Partners: National Science and Engineering Research Council (NSERC) Ontario Ministry of Natural Resources (OMNR) Dept. of Fisheries and Oceans Canada (DFO) Ontario Ministry of Agriculture, Food and Rural Affairs (OMAFRA) Fats and Proteins Research Foundation (FPRF) United Soybean Board AquaNet, Canadian Network of Centres of Excellence Martin Mills Aqua-Cage Fisheries Ltd. Jefo Nutrition