Embed Size (px)
Citation preview

Full Terms & Conditions of access and use can be found athttp://www.tandfonline.com/action/journalInformation?journalCode=ujfm20
Download by: [Matthew Kornis] Date: 01 June 2016, At: 19:48
North American Journal of Fisheries Management
ISSN: 0275-5947 (Print) 1548-8675 (Online) Journal homepage: http://www.tandfonline.com/loi/ujfm20
Factors Affecting Prestocking Coded Wire Tag Lossin Lake Trout Tagged by an Automated System
Matthew S. Kornis, Kevin W. Pankow, Allen A. Lane, James L. Webster &Charles R. Bronte
To cite this article: Matthew S. Kornis, Kevin W. Pankow, Allen A. Lane, James L. Webster &Charles R. Bronte (2016) Factors Affecting Prestocking Coded Wire Tag Loss in Lake TroutTagged by an Automated System, North American Journal of Fisheries Management, 36:3,670-680
To link to this article: http://dx.doi.org/10.1080/02755947.2016.1165768
Published online: 01 Jun 2016.
Submit your article to this journal
View related articles
View Crossmark data

ARTICLE
Factors Affecting Prestocking Coded Wire Tag Loss in LakeTrout Tagged by an Automated System
Matthew S. Kornis,* Kevin W. Pankow, Allen A. Lane, James L. Webster, andCharles R. BronteU.S. Fish and Wildlife Service, Green Bay Fish and Wildlife Conservation Office, Great Lakes Fish Tagand Recovery Laboratory, 2661 Scott Tower Drive, New Franken, Wisconsin 54229, USA
AbstractTag loss is an important consideration in tagging studies. We used two approaches to describe prestocking coded
wire tag (CWT) loss in Lake Trout Salvelinus namaycush tagged by an automated tagging system and released in theLaurentian Great Lakes. First, four strains of Lake Trout tagged by an automated system through the Great LakesMass Marking Program were observed for up to 254 d to describe how tag loss and adipose fin clip success relates totime posttagging. Second, we also evaluated final tag loss and fin clip success from 197 tag lots from 2011 to 2013 thatwere tagged with an automated system to explore the factors affecting tag loss and fin clip success, and to compare tagloss and fin clip success rates with those from 1,080 tag lots from 1985 to 2003 that were manually tagged. Coded wiretag losses from experimental lots of four strains of Lake Trout were low and ranged from 2.8% to 5.7%. Coded wiretag losses stabilized 150 d posttagging, when fish had a mean length of 131 mm, which is far longer than that reportedfor other salmonines (30 d). We developed a descriptive model to correct for time effects on tag loss; tag loss could beestimated with high confidence after 100 d posttagging. Coded wire tag losses varied by genetic strain, possibly due todifferences in body size and shape. Fish that lost a CWTwere significantly smaller than fish retaining a CWT. In ourcomparison of the automated system with manual tagging, CWT loss across 197 automated tag lots was highlyvariable (0.0–14.0%), but it was <5.5% in 86% of samples and less than the loss rates from manually tagged fish(<5.5% in 72% of samples). Our results provide important details for CWT studies on Lake Trout and other species.
Coded wire tags (CWTs; Jefferts et al. 1963) are exten-sively used in fisheries studies, especially for salmonines(Bergman et al. 1992; Johnson 2004). Coded wire tags aresmall pieces of wire typically implanted in cartilaginous tissue(i.e., the snout) and are usually accompanied by an adipose finclip to identify tagged individuals. Coded wire tags typicallyhave little impact on the survival or growth of tagged fish(Blankenship and Thompson 2003). All tags are etched withunique numerical codes that identify different stocking ortreatment groups (hereafter, “tag lots”), enabling their use infisheries stock assessments and evaluations of the movement,survival, and spatial distribution of fish post-release.
Initially, CWTs were implanted by hand using multiple person-nel (Jefferts et al. 1963; Solomon and Vander Haegen 2012).Although manual tagging remains effective in many instances, it
is impractical when large numbers of fish (millions) need to beprocessed within a short time, as is the case for hatchery-rearedsalmonines in the Pacific Northwest (Nandor et al. 2010) and theLaurentian Great Lakes (Bronte et al. 2012). To address thesechallenges, an automated system known as the AutoFish System(Northwest Marine Technology, Shaw Island, Washington) wasdeveloped during the late 1990s and early 2000s for use on Pacificsalmonines (Webster and Bergman 1998; Tempel 2000; Solomonand Vander Haegen 2012). AutoFish systems rapidly inject CWTsand clip adipose fins from juvenile fish in hatcheries withoutremoving them from water or use of anesthesia (Vander Haegenet al. 2011), and have increased tagging rates and improved fin clipquality and tagging success compared with manual tagging(Solomon and Vander Haegen 2012; Hand et al. 2014). and haveincreased tagging rates and improved fin clip quality and tag
*Corresponding author: [email protected] July 28, 2015; accepted February 7, 2016
670
North American Journal of Fisheries Management 36:670–680, 2016American Fisheries Society 2016ISSN: 0275-5947 print / 1548-8675 onlineDOI: 10.1080/02755947.2016.1165768
Dow
nloa
ded
by [
Mat
thew
Kor
nis]
at 1
9:48
01
June
201
6

success compared with manual tagging (Hand et al. 2010;Solomon and Vander Haegen 2012; Hand et al. 2014).
Pre- and poststocking tag loss are important considerations inall tagging studies because tag loss affects estimates of popula-tion demographics from recovered fish (Blankenship 1990). Theamount of tag loss can vary with time posttagging; therefore,knowing when tag loss stabilizes prior to stocking is needed foraccurate estimation. For example, CWT loss has been shown tostabilize in the hatchery at about 30 d posttagging in Brown TroutSalmo trutta, Rainbow Trout Oncorhynchus mykiss (Hale andGray 1998), Chinook SalmonO. tshawytscha, and Coho SalmonO. kisutch (Blankenship 1990). Coded wire tags and theAutoFish system were first developed primarily for managingPacific salmon on the northwest coast of North America(Bergman et al. 1968; Hand et al. 2007; Brignon et al. 2008;Nandor et al. 2010). As a result, studies of CWT loss in fishtagged using an AutoFish system have been limited to Pacificsalmonines such as Chinook Salmon (Hand et al. 2010).
There is considerably less information available on CWT lossin Lake Trout Salvelinus namaycush, despite an extensive stockingprogram in the Laurentian Great Lakes that began in the 1960s(Hansen 1999). Historically, Lake Trout were the dominant pisci-vore in Great Lakes pelagic food webs but were mostly extirpatedfrom the lower four Great Lakes by the 1960s due to overfishingand predation by invasive Sea Lamprey Petromyzon marinus(Smith 1968; Wells and McLain 1973; Hansen 1999).Rehabilitating Lake Trout to self-sustainability has been a majorpriority of state, tribal, and federal agencies due to their ecologicaland cultural importance, and their potential to again supportrecreational and commercial fisheries (United States et al. v.State of Michigan 2000; Bronte et al. 2008). Since restorationefforts began, stocked Lake Trout have received fin clips thatwere annually rotated to help identify year-class membership(Eck and Wells 1983). Manual coded wire tagging of all LakeTrout began in the 1970s in Lake Ontario (Elrod and Schneider1986) and in the 1980s on a fraction of Lake Trout stocked inLakesMichigan and Huron (Bronte et al. 2008). Manually appliedCWTs have allowed for the evaluation of post-release survival offish stocked at different locations, life stages, and genetic strains aswell as descriptions of maturity schedules, movements, and dis-tribution patterns (Elrod and Schneider 1986; Elrod et al. 1988;Madenjian et al. 1998; McKee et al. 2004; Bronte et al. 2006,2007).
Beginning in 2010, all hatchery-reared Lake Trout stocked bythe U.S. Fish and Wildlife Service into the U.S waters of theLaurentian Great Lakes (4.6 to 6.4 million fish/year) have beencoded-wire-tagged and adipose fin-clipped using the AutoFishsystem, with the objectives of estimating natural reproduction,contributions to fisheries, post-release survival among strains andstocking locations, andmovement within and among lakes (Bronteet al. 2012). The automatic tagging of Lake Trout in the AutoFishsystem, which was originally developed for Pacific salmonines,was made possible by hardware, software, and operational mod-ifications (e.g., fish control apparatuses, a specialized computer
control mode, the manual delivery of fish into the system) thataccommodated Lake Trout behavior and morphology. Throughputand tag and clip quality of Lake Trout is now similar to that ofChinook Salmon (both >8,000 fish/h; authors’ unpublished data),demonstrating the potential for the automated tagging of othersalmonines.
Describing CWT loss for Lake Trout in both the hatchery(reported here) and post-release (future results) is essential forthe accurate interpretation of CWT return data. Identifyingpossible mechanisms of tag loss is also important to helpdetermine where tag loss may be reduced. Body length, mor-phology, or behavior (or a combination thereof), among otherfactors, could influence tag loss by affecting body positionduring automated processing, which depends on a precise tagline calibration to fish size and shape to maximize efficacy.
To address these needs, our objectives were to (1) determinewhen tag loss in automated-tagged Lake Trout stabilizes inhatchery raceways prior to stocking; (2) determine how manydays posttagging are necessary to estimate tag loss with reason-ably high confidence; (3) compare CWT loss time series in fourgenetic strains of Lake Trout, which differ in their body mor-phology (indicated by length-to-weight ratio in this study) andbehavior (authors’ observation) in ways that affect tag loss; (4)compare final (i.e., prior to release) CWT loss and fin clipsuccess rates from automated and manual tagging–clippingmethods; and (5) assess whether final tag loss and fin clipsuccess rates in automated-tagged fish differed among geneticstrain, hatcheries, or fish sizes, or were affected by the percentof fish that were manually tagged because of size or rejectionfrom the tag and clip quality control system.
METHODSMost Lake Trout are stocked into the Great Lakes during
April–June at 16–18-months-old. Tagging and fin clippingoccurs during August–October of the previous year when thefish are 80–120-mm TL, which is optimal for automated tag-ging. Our study included a detailed observational time seriesat one hatchery where coded-wire-tagged Lake Trout from onetagging event (September 19, 2012) were regularly evaluatedfor tag loss (i.e., the percent of fish without a tag) and fin clipsuccess (i.e., the percent of successfully clipped fish) over a254-d period posttagging from September 20, 2012, to May30, 2013 (hereafter, “time series experiment”). We also eval-uated final tag loss just prior to stocking in spring from 197automated tagging events in four federal hatcheries that stockLake Trout in the U.S. waters of the Great Lakes during 2011–2013. The time series observations enabled us to determinewhen tag loss occurs and stabilizes, develop a descriptivemodel to correct for the effects of time on tag loss, and detectpossible differences in tag loss among genetic strains andsizes. The final tag loss rates provided 197 replicates to helpdescribe tag loss variability and to evaluate factors contribut-ing to tag loss.
CODED WIRE TAG LOSS IN LAKE TROUT 671
Dow
nloa
ded
by [
Mat
thew
Kor
nis]
at 1
9:48
01
June
201
6
Time series experiment.—Lake Trout were reared at theIron River National Fish Hatchery, Iron River, Wisconsin,operated by the U.S. Fish and Wildlife Service. All LakeTrout were coded-wire-tagged (hereafter, “tagged”) andadipose fin-clipped (hereafter, “marked”) using an AutoFishSCT6 mobile tagging trailer (Northwest Marine Technology).The AutoFish system sorts and delivers fish by size (length tonearest 0.1 mm) to one of six lines that automatically clipadipose fins and inject CWTs (1.1 × 0.25 mm, stainless steel)into cartilaginous snout tissue. Each tagging and marking lineis equipped to handle fish within an 8.5–12.5-mm lengthrange; together, the six lines automatically tag and mark fishfrom 66.0–142.0 mm. Sensors and computer imagingdetermine if tagging–marking was successful; fish that arenot successfully tagged or marked, as well as those that falloutside of the target size range, are routed for manual tagging–marking. The percent of fish manually tagged and marked isrecorded. (See Vander Haegen et al. 2011 for a completedescription of the AutoFish system.)
Four genetic strains of Lake Trout stocked in Lakes Huron(USFWS and GLFC 2014) and Michigan (Bronte et al. 2008)were tagged for the time series experiment: Lewis Lake,Superior Klondike, Seneca Lake, and Huron Parry Sound.Tag loss was evaluated by sampling fish of each strain onthe day of tagging (day 0), the first day posttagging (day 1),every other day thereafter for an initial 41-d period, and thentwice per month until the fish were released in spring thefollowing year. Tag presence was determined with aV-detector, which detects small changes in the magnetic fieldcaused when a tagged fish is moved passed sensors (NorthwestMarine Technology). Fish were held up to 254 d posttagging,depending on release dates: 254 d for Superior Klondike, 251d for Lewis Lake, 212 d for Seneca Lake, and 211 d for HuronParry Sound.
On the day of tagging, fish were randomly sampled byselecting at least 100 fish every 2 h upon exiting the trailer,measuring their length (to 1 mm), and examining each fish forsuccessful tagging and fin clipping. For each sampling eventthereafter, fish were crowded in a raceway and were randomlysubsampled in 50-fish increments until 1,000 fish had beenexamined for each strain. All 50 fish were weighed (to 0.1 g)and measured (to 1 mm) in every fifth subsample (for a totalof 200 fish per sample), while fish without a CWT weremeasured and weighed in every subsample. Subsampled fishwere held in a separate area until sampling was complete toensure that no fish were reexamined. This protocol reduced themultiple handling effect associated with holding pen methods,where the same tagged fish are reevaluated over time.
To determine when tag loss stabilized, tag loss was mod-eled against time and fish growth (measured as TL) usinglinear, power, hyperbolic, and exponential rise to maximumfunctions. Tag loss was modeled against both time and fishgrowth because both predictors, and the interplay betweenthem, likely affect tag loss. Moreover, time and fish growth
are not independent and were modeled separately to determinewhich one was the stronger predictor of tag loss. Exponentialrise to maximum models, in which the dependent variableincreases to a stable asymptotic maximum, had the best fitfor both relationships (see Results). Thus, for each Lake Troutstrain, percent tag loss (y) versus time posttagging (x) orversus average TL (x) was modeled as an exponential rise tomaximum function of the form
y ¼ y0 þ a 1� e�bx� �
;
where y0 is the y-intercept, and a and b are constants deter-mined by the Marquardt–Levenberg algorithm (Marquardt1963; Press et al. 1986), which identifies the model coeffi-cients that best fit the data through an iterative curve fittingprocedure based on minimizing the sum of the squareddifferences between observed and predicted values. In modelsof this form, the asymtoptic maximum is y = y0 + a, and thusy0 + a was used to estimate tag loss at time or length = ∞.
To describe how time affected the accuracy of tag loss esti-mates and to determine how much time posttagging is needed toreasonably estimate CWT loss, we calculated the differencebetween predicted tag loss at time t and at t = ∞ from eachstrain-specific exponential rise to maximum model. We thenmodeled the average difference between predicted tag loss att and ∞ among strains versus time posttagging using an expo-nential decay function. The exponential decay function wasselected because the difference between tag loss at t and ∞approaches zero as t approaches ∞.
Body shape and length at tagging may also influence tagloss in Lake Trout by affecting body position during auto-mated processing. Morphometric data on body shape were notavailable on fish tagged in the time series experiment, soweight at length was used as a coarse substitute for bodyshape, particularly leanness. Length–weight relationshipsfrom 1 d posttagging were developed for each strain andcompared using an ANCOVA on log-transformed values todetermine whether weight differed among strains at a givenlength. Post-hoc pairwise comparisons (Holm–Sidak method)identified strain pairs with significantly different length–weight relationships. Because small size at tagging has beenshown to increase tag loss in manually tagged Lake Trout(Ostergaard 1982), we used a paired t-test to determine if theaverage TL of fish with tags was different than that of fishwithout; fish were paired by sampling date to remove theeffect of time on fish TL.
A proportion of Lake Trout processed by an automatedsystem go through the tagging lines upside down (authors’observation), which results in CWT injection into the mand-ible instead of the snout, and often results in an anal fin clipinstead of an adipose fin clip. This phenomenon is alsoobserved in Pacific salmon tagging programs, particularlywith small (>200/lb) Chinook Salmon (J. Rivera, U.S. Fish
672 KORNIS ET AL.
Dow
nloa
ded
by [
Mat
thew
Kor
nis]
at 1
9:48
01
June
201
6

and Wildlife Service, personal communication). Althoughthe proportion of fish processed upside down is thought tobe small, this information has not been quantified for anyspecies tagged by automated trailers. Thus, we measured thepercent of fish with anal fin clips (rather than adipose finclips) for each strain in the time series experiment to pro-vide an indication of the proportion of fish from each strainthat was processed upside down. A high percentage of analfin-clipped fish among those without a CWT would suggestimproper entry into the tagging line as a mechanism for tagloss. Fin-clipping rates are only presented from fish col-lected during the first 7 d posttagging because anal finswere observed to rapidly regenerate, and because tag lossdue to upside-down processing is thought to occur relativelyquickly. Curve fitting procedures and ANCOVAs were con-ducted using SigmaPlot version 13.0, while paired t-testswere conducted in R version 3.1.1. For all statistical ana-lyses, significance was set at α ≤ 0.05.
Final tag loss rates.—All Lake Trout CWT lots weresampled immediately prior to stocking to evaluate finalprestocking tag loss and adipose fin clip success. Wedescribed final tag loss and fin clip success rates from 197Lake Trout tag lots tagged with AutoFish during 2011–2013(data available from USFWS and GLFC 2014). These tag lotswere from four federal hatcheries: Iron River National FishHatchery, Pendills Creek National Fish Hatchery (Brimley,Michigan), Jordan River National Fish Hatchery (Elmira,Michigan), and Allegheny National Fish Hatchery (Warren,Pennsylvania). For all tag lots, genetic strain was known,while manual tagging–marking percentage, average length attagging, and average coefficient of variation (CV; 100 × SD/mean) of length at tagging were recorded by the AutoFishtrailers. All fish were tagged by one of four AutoFishoperators with similar experience, and no operator effect onfinal tag loss was observed (ANOVA: F3, 193 = 1.1, P = 0.34).In most cases, sampling occurred immediately before fish werestocked and at least 100 d after tagging (spring yearlings); fishstocked as fall fingerlings were sampled immediately prior tostocking but less than 100 d after tagging. A minimum of 100fish were randomly sampled from each tag lot. Fish were eithersubsampled from different areas of each raceway (a minimumof five subsamples), or were crowded together prior to samplingto avoid segregation. To facilitate handling, fish were immersedin a mild anesthetic bath, visually inspected for the presenceand quality of the adipose fin clip, and scanned for the presenceof a CWT with a V-detector. Based on the results from the timeseries experiment (see below), we limited our analysis toinstances where final tag loss was measured at least 100 dafter tagging (n =197 lots, including the four strains from thetime series experiment plus two additional strains: SuperiorApostle Island and Lake Champlain). In addition, we used ourmodel of the effect of time on tag loss from the time seriesexperiment (see Results) to correct all final tag loss rates fortime effects.
To compare automated and manual tagging methods, wealso described tag loss and fin clip success from 1,080 tag lotsof manually tagged and clipped fish from 1985–2010 (USFWSand GLFC 2014). The number of days posttagging prior torelease was not available for these tag lots, so tag loss rateswere not corrected for time effects.
Analyses of final tag loss rates immediately prior to stock-ing were conducted to address objectives 4 and 5 of the study(see Introduction). Density plots (smoothed histograms) wereused to describe the overall range and variability of LakeTrout tag loss and adipose fin clip success across 197 auto-mated and 1,080 manual tag lots (all genetic strains werepooled). To substantiate findings from the time series experi-ment, we tested for the effect of genetic strain and hatchery oforigin on tag loss in the 197 automated tag lots using a two-way ANOVA. For this ANOVA, tag loss was only comparedbetween Huron Parry Sound (n = 27), Lewis Lake (n = 45),and Seneca Lake (n = 99) strains because sample size was toolow to examine Superior Klondike (n = 2), and two otherstrains (Superior Apostle Island [n = 19] and LakeChamplain [n = 5]) were not included in the time seriesexperiment. We also evaluated the effect of manual tagging–marking percentage, average TL at tagging, and average CVof TL at tagging as possible factors contributing to the tag lossin automated-tagged Lake Trout using multiple linear regres-sion. An examination of density plots indicated no glaringviolation of the assumption of normality for variables in theANOVAs and the multiple linear regression. Density plots,ANOVAs, and multiple regressions were conducted using Rversion 3.1.1.
RESULTS
Time Series ExperimentFunctions where CWT loss rose to a stable asymptotic
value best described its relationships with time and fish growth(Table 1). Exponential rise to maximum models performedslightly better than hyperbolic models, with both functionsoutperforming non-asymptotic power and linear functions.Performance differences among model types were greater forLewis Lake and Superior Klondike strains than for HuronParry Sound and Seneca Lake strains (Table 1).
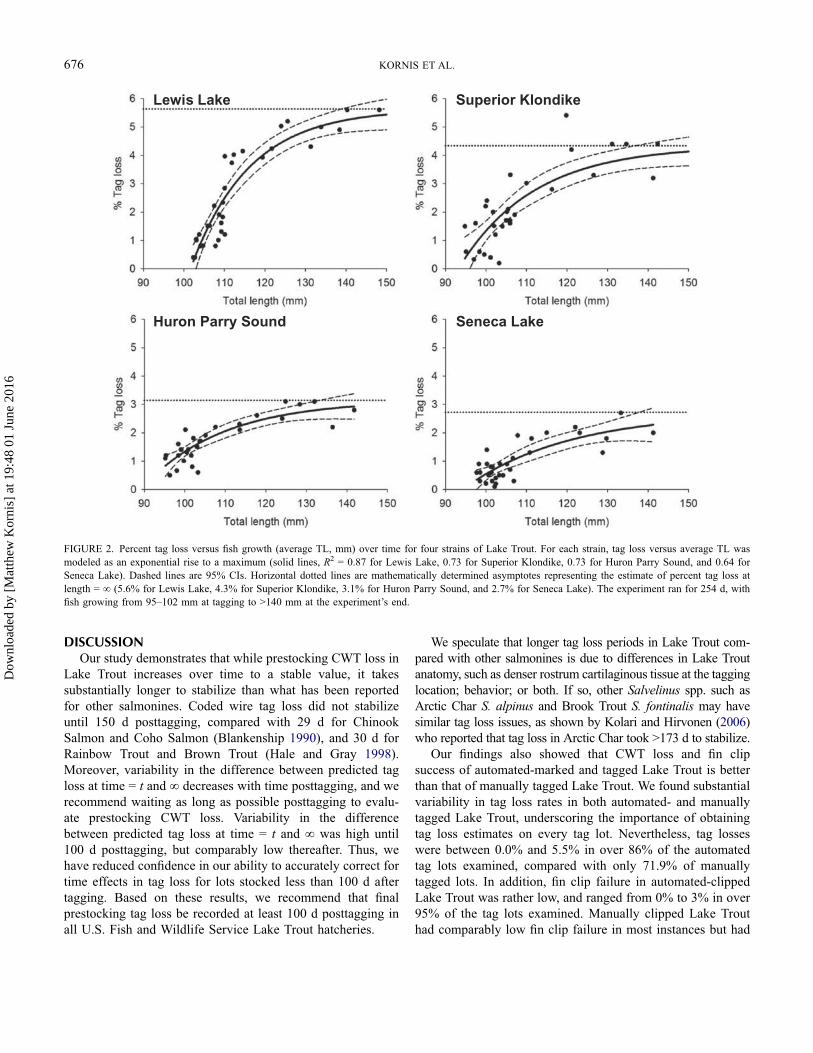
Lake Trout CWT loss stabilized at about 150 d (Figure 1).Coded wire tag loss also stabilized once Lake Trout grew toabout 130-mm TL (Figure 2; average TL at tagging rangedfrom 95 to 102 mm). These findings were corroborated by ourmodel, where the average difference between predicted tag lossat t and∞ reached a stable low point (difference of 0.45 ± 0.12%,average ± SE) after about 150 d posttagging (Figure 3), when theaverage length of all Lake Trout was 131 mm.
There was clear separation of tag loss versus time for allpairwise strain comparisons except for Huron Parry Soundversus Seneca Lake, which were similar (Figure 1). Timeposttagging explained a substantial amount of the variance in
CODED WIRE TAG LOSS IN LAKE TROUT 673
Dow
nloa
ded
by [
Mat
thew
Kor
nis]
at 1
9:48
01
June
201
6

tag loss for all strains (R2 = 0.90 for Lewis Lake, 0.81 forSuperior Klondike, 0.78 for Huron Parry Sound, and 0.72 forSeneca Lake). Tag loss at t = ∞ was estimated to be 5.7%for Lewis Lake, 4.2% for Superior Klondike, 3.1% for HuronParry Sound, and 2.8% for Seneca Lake (Figure 1). Similarrelationships existed between CWT loss and fish growth(measured as average TL; Figure 2), and produced similarestimates of tag loss at t = ∞ for all strains; differences rangedfrom –0.14% to 0.06 %. These similarities stem from non-independence between time and fish growth during theexperiment. However, we report tag loss at t = ∞ based onrelationships between tag loss and time (rather than TL)because time explained more variance in tag loss than TL, asevidenced by higher R2 values and lower RSS values forrelationships with time (Table 1).
Although tag loss stabilized at around 150 d posttagging,tag loss could be reasonably estimated with high confidenceafter only 100 d posttagging by correcting for the effect oftime. This is because the SE around the difference between tagloss at t and ∞ stabilized after about 100 d at ±0.15. Althoughestimates of Lake Trout tag loss would be most accurate after100 d posttagging, shorter time periods may sometimes benecessary, especially when fish are stocked as fall fingerlingsin November, which does occur in all lakes. Tag loss estimatesfor fall fingerlings could be corrected for days posttaggingusing the exponential decay model (Figure 3)
Tag loss correction factor ¼ 0:07973 þ 3:388e�0:01527x;
where x is the number of days posttagging that Lake Troutwere observed.Since tag loss increases with time posttagging,the output of this model would be added to the measured tagloss percentage at stocking to correct for time effects.
Anal fin-clipping, TL, and length-to-weight ratio all appearedto play a role in tag loss in Lake Trout. Analfin-clipping, indicativeof fish going through the automated tagging line upside down, wasobserved in 0.2% to 0.6% of all fish (range of values from the fourstrains). A high percentage of such fish (91.5%) also lost theirCWTwithin the first 7 d posttagging. Thus, it is no surprise that amuch higher rate of anal fin-clipping was observed in fish that hadlost their CWT: the two strains with the highest tag loss, LewisLake and Superior Klondike, had the highest rates of anal fin-clipping among fish that lost their CWT (48.9% and 21.1%,respectively, compared with 14.3 % for Seneca Lake and 15.4%for Huron Parry Sound). In addition, length–weight relationshipswere significantly different among the four treatment groups (one-way ANCOVA: F3, 152 = 12.7, P < 0.001; Figure 4). Lewis Lakeand Superior Klondike had significantly lower weight at lengthcomparedwith Seneca Lake andHuron Parry Sound (Holm–Sidakpairwise comparisons, all P < 0.05). Finally, individuals without aCWT were significantly smaller during the first 150 d of theexperiment than individuals with a CWT (Figure 5; paired t-test:t27 = 4.18,P = 0.0003), but over the entire time series, there was nosignificant difference in mean length between the groups (t34 =1.75, P = 0.09).
Evaluation of Final Tag Loss RatesFinal CWT loss ranged from 0.0% to 14.0% for automated-
tagged Lake Trout and from 0.0% to 32.6% for manuallytagged Lake Trout (Figure 6). Most automated tag lots(85.8%) experienced a less than 5.5% tag loss (Figure 6,upper panel), which was comparable to the tag loss in thetime series experiment (Figure 1). Tag loss exceeded 6.0% in13.2% of the automated lots, and exceeded 10.0% in five lots(2.5% of all samples). In contrast, the distribution of tag lossrates from tag lots of manually tagged fish was more positivelyskewed (Figure 6, upper panel), with only 71.9% of lots having
TABLE 1.— Performance of modeled relationships of Lake Trout CWT loss by genetic strain. Coded wire tag loss was modeled versus time (days posttagging)and fish growth (average TL). Model functions are listed in order of decreasing performance, as measured by R2 and the residual sum of squares (RSS).Exponential rise to maximum and hyperbolic functions increase to a stable asymptotic maximum; power and linear functions do not.
Lewis Lake Superior Klondike Huron Parry Sound Seneca Lake
Function R2 RSS R2 RSS R2 RSS R2 RSS
Models versus timeExponential rise to maximum 0.90 11.58 0.81 13.61 0.78 3.53 0.72 4.24Hyperbolic 0.89 12.64 0.79 14.53 0.78 3.60 0.72 4.28Power 0.84 17.70 0.76 17.00 0.77 3.78 0.70 4.46Linear 0.75 28.71 0.63 26.26 0.71 4.72 0.69 4.66
Models versus growth (TL)Exponential rise to maximum 0.87 14.54 0.73 18.95 0.73 4.33 0.64 5.45Hyperbolic 0.86 15.50 0.71 20.31 0.73 4.42 0.64 5.50Power 0.83 18.99 0.66 24.21 0.70 4.81 0.62 5.76Linear 0.73 30.01 0.58 29.68 0.67 5.36 0.61 5.92
674 KORNIS ET AL.
Dow
nloa
ded
by [
Mat
thew
Kor
nis]
at 1
9:48
01
June
201
6

a less than 5.5% tag loss. Adipose fin clip failure rates wereconsistently low in both automated and manually clipped LakeTrout (Figure 6, bottom), with unsuccessful clip rates of ≤1% in77.2% of automated-clipped fish and in 76.9% of manuallyclipped fish. However, clip failures from manually clipped fishhad a more right-skewed distribution and were more likely tohave events with low clip success, with unsuccessful clip ratesof ≥5% in 4.0% and 1.5% of manually and automated-clippedLake Trout, respectively.
In contrast to the time series experiment, final tag loss inautomated-tagged Lake Trout was not significantly differentamong strains (F2, 165 = 1.0, P = 0.36, two-way ANOVAexamining the effects of strain and hatchery). Average ± SEtag loss was similar for Lewis Lake (4.1 ± 0.3) Seneca Lake(3.6 ± 0.2) and Huron Parry Sound (3.3 ± 0.4). However, tag
loss differed among hatcheries (F3, 165 = 2.9, P = 0.03), with alower tag loss in fish reared at the Allegheny National FishHatchery than in fish from either Iron River (P = 0.04) orPendills Creek (P = 0.06), but not Jordan River (P = 0.20).There was no significant interaction between strain and hatch-ery (F4, 161 = 0.9, P = 0.48), and thus this term was droppedfrom the model. Low sample size precluded statistical com-parisons with the Superior Klondike strain (n = 2 final tag lossmeasurements); however, it is notable that tag loss from thosetwo instances (6.2% and 7.2%, respectively) were highcompared with that from other strains (3.4%; n = 197).Manual marking percentage (P = 0.96), average length attagging (P = 0.54), and average CV of length at tagging(P = 0.13) were not significant predictors of final tag loss inLake Trout (multiple linear regression).
Lewis Lake Superior Klondike
Huron Parry Sound Seneca Lake
FIGURE 1. Percent tag loss over time for four strains of Lake Trout. For each strain, tag loss over time was modeled as an exponential rise to a maximum of theform y = y0 + a(1 – e–bx), where y0 is the intercept and a and b are constants determined by an iterative curve fitting procedure (solid lines, R2 = 0.91 for LewisLake, 0.81 for Superior Klondike, 0.78 for Huron Parry Sound, and 0.72 for Seneca Lake). Dashed lines are 95% CIs. Horizontal dotted lines are mathematicallydetermined asymptotes representing the estimate of percent tag loss at time = ∞ (5.7% for Lewis Lake, 4.2% for Superior Klondike, 3.1% for Huron ParrySound, and 2.8% for Seneca Lake).
CODED WIRE TAG LOSS IN LAKE TROUT 675
Dow
nloa
ded
by [
Mat
thew
Kor
nis]
at 1
9:48
01
June
201
6
DISCUSSIONOur study demonstrates that while prestocking CWT loss in
Lake Trout increases over time to a stable value, it takessubstantially longer to stabilize than what has been reportedfor other salmonines. Coded wire tag loss did not stabilizeuntil 150 d posttagging, compared with 29 d for ChinookSalmon and Coho Salmon (Blankenship 1990), and 30 d forRainbow Trout and Brown Trout (Hale and Gray 1998).Moreover, variability in the difference between predicted tagloss at time = t and ∞ decreases with time posttagging, and werecommend waiting as long as possible posttagging to evalu-ate prestocking CWT loss. Variability in the differencebetween predicted tag loss at time = t and ∞ was high until100 d posttagging, but comparably low thereafter. Thus, wehave reduced confidence in our ability to accurately correct fortime effects in tag loss for lots stocked less than 100 d aftertagging. Based on these results, we recommend that finalprestocking tag loss be recorded at least 100 d posttagging inall U.S. Fish and Wildlife Service Lake Trout hatcheries.
We speculate that longer tag loss periods in Lake Trout com-pared with other salmonines is due to differences in Lake Troutanatomy, such as denser rostrum cartilaginous tissue at the tagginglocation; behavior; or both. If so, other Salvelinus spp. such asArctic Char S. alpinus and Brook Trout S. fontinalis may havesimilar tag loss issues, as shown by Kolari and Hirvonen (2006)who reported that tag loss in Arctic Char took >173 d to stabilize.
Our findings also showed that CWT loss and fin clipsuccess of automated-marked and tagged Lake Trout is betterthan that of manually tagged Lake Trout. We found substantialvariability in tag loss rates in both automated- and manuallytagged Lake Trout, underscoring the importance of obtainingtag loss estimates on every tag lot. Nevertheless, tag losseswere between 0.0% and 5.5% in over 86% of the automatedtag lots examined, compared with only 71.9% of manuallytagged lots. In addition, fin clip failure in automated-clippedLake Trout was rather low, and ranged from 0% to 3% in over95% of the tag lots examined. Manually clipped Lake Trouthad comparably low fin clip failure in most instances but had
Lewis Lake Superior Klondike
Huron Parry Sound Seneca Lake
FIGURE 2. Percent tag loss versus fish growth (average TL, mm) over time for four strains of Lake Trout. For each strain, tag loss versus average TL wasmodeled as an exponential rise to a maximum (solid lines, R2 = 0.87 for Lewis Lake, 0.73 for Superior Klondike, 0.73 for Huron Parry Sound, and 0.64 forSeneca Lake). Dashed lines are 95% CIs. Horizontal dotted lines are mathematically determined asymptotes representing the estimate of percent tag loss atlength = ∞ (5.6% for Lewis Lake, 4.3% for Superior Klondike, 3.1% for Huron Parry Sound, and 2.7% for Seneca Lake). The experiment ran for 254 d, withfish growing from 95–102 mm at tagging to >140 mm at the experiment’s end.
676 KORNIS ET AL.
Dow
nloa
ded
by [
Mat
thew
Kor
nis]
at 1
9:48
01
June
201
6

more extreme instances of clip failure. Our results are similarto those for Chinook Salmon that found the AutoFish Systemhad similar or improved tag loss, clip success, and injury ratecompared with manual methods (Hand et al. 2007; Brignonet al. 2008), which is partially a function of personnel experi-ence. Experienced manual tagging personnel may achieve tagloss and clip success rates comparable to that of the automatedprocess (Hand et al. 2010).
Smaller Lake Trout (TL) had more missing CWTs than largerones, similar to automated-tagged Chinook Salmon (J. Rivera,personal communication) and manually tagged Arctic Char(Kolari and Hirvonen 2006) and Lake Trout (Ostergaard 1982).Taken together, our and earlier studies suggest that size affectstag loss. There are several potential mechanisms for this. First,we observed that smaller Lake Trout are occasionally missortedinto tag lines calibrated for larger fish, as two small fish that enterthe AutoFish’s length sorter together are sometimes misread asone larger individual (authors’ observation). Such events, thoughrare, likely increase the probability of tag loss because of incor-rect tag placement in missorted fish. It is also possible that thereis a lower margin of error for smaller fish that are tagged by theAutoFish’s manual tagging lines, as these lines are calibrated fora broader length range of fish. However, we should have detecteda relationship between final tag loss and the percent of manuallymarked fish if this was the case. Finally, it is possible that smallerfish are more likely to go through the automatic tagging lineupside down than larger fish. Although the average length of fishwith anal fin clips (indicative of upside-down tagging) wassimilar to that of properly clipped fish in this study (98.0 mmversus 98.9 mm), the upside-down processing of smallerChinook Salmon (fish measured at more than 200 individuals/lb) has been commonly observed in automated tagging trailers onthe Pacific coast (J. Rivera, personal communication).
The evidence linking genetic strain to CWT loss was mixed.The time series experiment identified clear differences amongthe four strains examined, but strain did not have a significanteffect on final tag loss even though rank order of tag loss bystrain was the same as in the experiment. Thus, CWT loss mayor may not be linked to genetic strain in Lake Trout. Weinitially tested for strain-specific differences due to differencesin morphology and behavior relevant to processing efficiency in
FIGURE 3. Number of days posttagging necessary to obtain reasonableestimates of percent tag loss. For each strain, we calculated the differencebetween predicted tag loss at time = t and ∞. Values are the average differenceat day t among all four strains ± SE. We fit an exponential decay model tothese data (R2 = 1.0) using an iterative curve fitting procedure.
FIGURE 4. Length–weight relationships for each of the four treatmentgroups. For each Lake Trout strain, simple linear regression was used to relatelog length and log wet weight (R2 ≥ 0.98 for each strain). One-way ANCOVAidentified significant differences among strains represented by black and graylines; solid and dashed lines of the same color were not significantly different.
FIGURE 5. Average TL of Lake Trout with (black points and line) andwithout (gray points and line) a CWT over the first 150 d of the time seriesexperiment; R2 = 0.99 for CWT and 0.98 for No CWT.
CODED WIRE TAG LOSS IN LAKE TROUT 677
Dow
nloa
ded
by [
Mat
thew
Kor
nis]
at 1
9:48
01
June
201
6

the automated system. Lake Trout are a morphologicallydiverse species (Chavarie et al. 2016; Muir et al., in press),and different genetic strains are known to have different bodymorphologies (Goetz et al. 2010). Although these differencesare most pronounced during adulthood, small differences inbody morphology at tagging—indicated in this study by fishlength and length-to-weight ratio at tagging—may be relevantgiven the precise calibration needed in automated tagging.Indeed, Lake Trout body shape, regardless of whether it islinked to strain, appeared to contribute to the substantial varia-bility observed in final tag loss rates and to the differences intag loss between the experiment’s four treatment groups. Thetwo groups with the greatest tag loss (Lewis Lake and SuperiorKlondike) had significantly lower weight per unit length thanthe two groups with lower tag loss, and also had the greatestincidence of anal fin-clipping. Fish without a CWT also weresignificantly smaller than fish with a CWT. These findings areconsistent with the authors’ observation that leaner or shorterindividuals may be more likely to go through the tagging lineupside down, resulting in improper tag placement (e.g., in themandible instead of the snout) that increases the likelihood oftag loss over time. Our findings are also consistent with authorobservations of behavioral differences between genetic strains.For example, the Lewis Lake strain tended to be more lethargicand hesitant to enter the volitional entry systems in the lengthsorter and the tagging lines, while the Seneca Lake strain wasconsistently the most active (authors’ observation). Althoughqualitative, these observations have important implications fortagging efficiency because lethargy can decrease the likelihoodof processing in the upright position.
Independently, the two approaches used in this study hadsome limitations. The time series experiment was a controlledexperiment from a single tagging event at one hatchery, and thushad a low number of replicates (four strains each evaluated overone 254-d period). The final tag loss data was less controlled andlacked the ability to examine effects of time on tag loss, bututilized data from multiple hatcheries and years. We were able topartially protect against these limitations because the strengthsof each approach complemented one another. Nonetheless, weassumed final tag loss rates from the Lake Trout stocking pro-gram were comparable to those observed in the time seriesexperiment even though more individuals (1,000 versus atleast 100) were measured for the time series experiment. Wealso assumed that the time series experiment’s four treatmentgroups were sufficient to document the effect of time posttag-ging on tag loss. Although the addition of more treatment groupswould have increased confidence, the similar trajectories of thefour examined groups suggest we adequately captured the rela-tionship between tag loss and time. Finally, final tag loss and finclip rates from automated versus manual tagging were fromdifferent years (2011–2013 for automated, 1985–2003 formanual), and we assumed this had no effect on the comparisonbetween the two approaches.
FIGURE 6. Density plots (smoothed histograms) of CWT (top) and adiposefin clip failure (bottom) from Lake Trout tagged and clipped by an automatedsystem (black) and manually (gray). Note that x- and y-axes scales differbetween the top and bottom panels to best emphasize the within-panel com-parison of automated and manual methods. Estimates of tag loss and fin clipfailure were collected just prior to stocking. For automated-tagged Lake Trout,only tag lots examined at least 100 d posttagging were included, and eachsample consisted of a minimum of 100 fish. The percent of automated-taggedfish without a CWT was corrected for time effects by applying the correctionfactor model derived from the time series experiment (see Figure 3). Sincedata on days posttagging and number of fish per sample were not available formanually tagged Lake Trout, tag loss from manually tagged Lake Trout wasnot corrected for time effects. Instead, tag loss and fin clip success data frommanually tagged fish are as reported in the Great Lakes Fish StockingDatabase (USFWS and GLFC 2014).
678 KORNIS ET AL.
Dow
nloa
ded
by [
Mat
thew
Kor
nis]
at 1
9:48
01
June
201
6

CONCLUSIONWe demonstrated that tag loss in Lake Trout stabilizes over a
substantially longer time period (150 d) than other commonlytagged salmonines (30 d). The accurate estimation of tag loss isimportant for determining population demographics based ontag returns. Therefore, estimates of tag loss should be formallyestimated rather than relying on estimates of similar species. Wealso provided a method for correcting for time effects to esti-mate tag loss over short time intervals in species with long tagloss stabilization periods; this approach may be useful for othersuch species. Finally, we provided evidence that tag loss andadipose fin clip success are higher in Lake Trout tagged byautomated systems compared with manual tagging, which isconsistent with earlier studies on Pacific salmon.
ACKNOWLEDGMENTSFunding for this work was provided by the Great Lakes
Restoration Initiative. John Beckman, Sandy Lind, SandyPetersen, Nick Berndt, Martha Adams, Mary Rejo, DebraFrostman, and Kyle Krajniak collected data for the time seriesexperiment. We thank Dale Bast (Iron River National Hatcherymanager, retired) and his staff for assisting with the time seriesstudy, and personnel at the Pendills Creek, Jordan River, andAllegheny River National Fish hatcheries who collected tag andclip loss data prior to stocking. We also appreciate the construc-tive suggestions of Rachel Van Dam and two anonymousreviewers on earlier drafts of this manuscript. Reference totrade names does not imply endorsement by the U.S.Government. The findings and conclusions in this article arethose of the authors and do not necessarily represent the viewsof the U.S. Fish and Wildlife Service.
REFERENCESBergman, P. K., F. Haw., H. L. Blankenship, and R. M. Buckley. 1992.
Perspectives on design, use, and misuse of fish tags. Fisheries 17(4):20–25.
Bergman, P. K., K. B. Jefferts, H. F. Fiscus, and R. C. Hager. 1968. Apreliminary evaluation of an implanted coded wire fish tag. WashingtonDepartment of Fisheries Fisheries Research Papers 3:63–84.
Blankenship, H. L. 1990. Effects of time and fish size on coded wire tag lossfrom Chinook and Coho salmon. Pages 237–243 in N. C. Parker, A. E.Giorgi, R. C. Heindinger, D. B. Jester Jr., E. D. Prince, and G. A. Winans,editors. Fish-marking techniques. American Fisheries Society, Symposium7, Bethesda, Maryland.
Blankenship, H. L., and D. A. Thompson. 2003. The effect of 1.5-length anddouble-length coded wire tags on Coho Salmon survival, growth, homing,and electronic detection. North American Journal of Fisheries Management23:60–65.
Brignon, W. R., R. O. Engle, D. M. Hand, J. Rivera, and D. E. Olson. 2008.Comparative injury, adipose fin mark quality, and tag retention of springChinook Salmon marked and coded wire tagged by an automated trailerand manual trailer at Carson National Fish Hatchery. U.S. Fish andWildlife Service, Columbia River Fisheries Program Office Report,Vancouver, Washington.
Bronte, C. R., M. E. Holey, C. P. Madenjian, J. L. Jonas, R. M. Claramunt, P.C. McKee, M. L. Toneys, M. P. Ebener, B. Breidert, G. W. Fleischer, R.
Hess, A. W. Martell, and E. J. Olsen. 2007. Relative abundance, sitefidelity, and survival of adult Lake Trout in Lake Michigan from 1999 to2001: implications for future restoration strategies. North AmericanJournal of Fisheries Management 27:137–155.
Bronte, C. R., C. C. Krueger, M. E. Holey, M. L. Toneys, R. L. Eshenroder,and J. L. Jonas. 2008. A guide for the rehabilitation of Lake Trout in LakeMichigan. Great Lakes Fishery Commission, Miscellaneous Publication2008-01, Ann Arbor, Michigan.
Bronte, C. R., P. C. McKee, M. E. Holey, M. L. Toneys, and P. E. Haver.2006. Relative survival of Lake Trout stocked at different sizes and qualityin Lake Michigan. Journal of Great Lakes Research 32:386–394
Bronte, C. R., K. A.Walch, J. M. Dettmers, M. Gaden, M. J. Connerton, M. E.Daniels, and T. J. Newcomb. 2012. A coordinated mass marking programfor salmonines stocked into the Laurentian Great Lakes. Pages 27–42 in J.McKenzie, B. Parsons, A. Seitz, R. K. Kopf, M. Mesa, and Q. Phelps,editors. Advances in fish tagging and marking technology. AmericanFisheries Society, Symposium 76, Bethesda, Maryland.
Chavarie, L., K. Howland, P. Venturelli, B. C. Kissinger, R. Tallman, and W.Tonn. 2016. Life history variation among four shallow-water morphotypesof Lake Trout from Great Bear Lake, Canada. Journal of Great LakesResearch 42:193–203.
Eck, G. W., and L. Wells. 1983. Biology, population structure, and estimatedforage requirements of Lake Trout in Lake Michigan, Technical Paper 111.U.S. Fish and Wildlife Service, Ann Arbor, Michigan.
Elrod, J. H., D. E. Ostegaard, and C. P. Schneider. 1988. Comparison ofhatchery-reared Lake Trout stocked as fall fingerlings and as spring year-lings in Lake Ontario. North American Journal of Fisheries Management8:455–462.
Elrod, J. H., and C. P. Schneider. 1986. Evaluation of coded wire tags formarking Lake Trout. North American Journal of Fisheries Management6:264–271.
Goetz, F., D. Rosauer, S. Sitar, G. Goetz, C. Simchick, S. Roberts, R.Johnson, C. Murphy, C. R. Bronte, and S. Mackenzie. 2010. A geneticbasis for the phenotypic differentiation between siscowet and lean LakeTrout (Salvelinus namaycush). Molecular Ecology 19(Supplement1):176–196.
Hale, R. S., and J. H. Gray. 1998. Retention and detection of coded wire tagsand elastomer tags in trout. North American Journal of FisheriesManagement 18:197–201.
Hand, D. M., W. R. Brignon, and D. E. Olson. 2014. Adult recovery ofhatchery spring Chinook Salmon adipose fin-clipped and coded-wire-tagged using an automated and manual marking trailer. North AmericanJournal of Aquaculture 76:364–368.
Hand, D. M., W. R. Brignon, D. E. Olson and J. Rivera. 2010. Comparing twomethods used to mark juvenile Chinook Salmon: automated and manualmarking. North American Journal of Aquaculture 72:10–17.
Hand, D. M., W. R. Brignon, J. Rivera, and D. E. Olson. 2007. Comparativetag retention, clip quality, and injuries of juvenile spring ChinookSalmon marked by an automated marking trailer and manual markingtrailer at Warm Springs National Fish Hatchery. U.S. Fish and WildlifeService, Columbia River Fisheries Program Office Report, Vancouver,Washington.
Hansen, M. J. 1999. Lake Trout in the Great Lakes: basin-wide stock collapseand binational restoration. Pages 417–453 in W. W. Taylor and C. P.Ferreri, editors. Great Lakes fishery policy and management: a binationalperspective. Michigan State University Press, East Lansing.
Jefferts, K. B., P. K. Bergman, and H. F. Fiscus. 1963. A coded wireidentification system for macro-organisms. Nature (London) 198:460–462.
Johnson, J. K. 2004. Regional overview of coded wire tagging of anadromoussalmon and steelhead in Northwest America. Pacific States MarineFisheries Commission, Portland, Oregon.
Kolari, I., and E. Hirvonen. 2006. Long-term retention of coded wire tags injuvenile Arctic Charr Salvelinus alpinus. Fisheries Management andEcology 13:143–148.
CODED WIRE TAG LOSS IN LAKE TROUT 679
Dow
nloa
ded
by [
Mat
thew
Kor
nis]
at 1
9:48
01
June
201
6

Madenjian, C. P., T. J. DeSorcie, and R. M. Stedman. 1998. Maturity sche-dules of Lake Trout in Lake Michigan. Journal of Great Lakes Research24:404–410.
Marquardt, D. W. 1963. An algorithm for least-squares estimation of non-linear parameters. Journal of the Society for Industrial and AppliedMathematics 11:431–441.
McKee, P. C., M. L. Toneys, M. J. Hansen, and M. E. Holey. 2004.Performance of two strains of Lake Trout stocked in the midlake refugeof Lake Michigan. North American Journal of Fisheries Management24:1101–1111.
Muir, A. M., M. J. Hansen, C. R. Bronte, and C. C. Krueger. In press. If ArcticCharr Salvelinus alpinus is ‘themost diverse vertebrate’, what is the Lake CharrSalvelinus namaycush? Fish and Fisheries. DOI: 10.1111/faf.12114.
Nandor, G. F., J. R. Longwill, and D. L. Webb. 2010. Overview of the coded wiretag program in the Greater Pacific Region of North America. Pages 5–46 inK. S. Wolf and J. S. O’Neal, editors. Tagging, telemetry and markingmeasures for monitoring fish populations—a compendium of new and recentscience for use in informing technique and decision modalities. PacificNorthwest Aquatic Monitoring Partnership, Special Publication 2010-002,Cook, Washington.
Ostergaard, D. E. 1982. Retention of coded wire tags in Lake Trout.Progressive Fish Culturist 44:162.
Press, W. H., S. A. Teukolsky, W. T. Vetterling, and B. P. Flannery. 1986.Numerical recipes. Cambridge University Press, Cambridge, UK.
Smith, S. H. 1968. Species succession and fishery exploitation in the GreatLakes. Journal of the Fisheries Research Board of Canada 25:667–693.
Solomon, D. J., and G. E. Vander Haegen. 2012. Coded wire tag projectmanual: planning and conducting projects using coded wire tags.Northwest Marine Technologies, Shaw Island, Washington.
Tempel, M. A. 2000. Fish holding system. U.S. patent 6,145,476. November14, 2000.
United States et al. v. State of Michigan. 2000. Stipulation for entry of consentdecree. 2:73 CV 26 (U.S. District Court, Western District of Michigan,Southern Division).
USFWS (U.S. Fish and Wildlife Service) and GLFC (Great Lakes FisheryCommission). 2014. Great Lakes Fish Stocking Database [online data-base]. USFWS, Region 3, Fisheries Program and GLFC, Ann Arbor,Michigan. Available: http://www.glfc.org/fishstocking/.
Vander Haegen, G. H., H. L. Blankenship, and D. Knutzen. 2011. Advances incoded wire tag technology: meeting changing fish management objectives.Pages 127–140 in J. McKenzie, Q. Phelps, R. Kopf, M. Mesa, B. Parsons,and A. Seitz, editors. Advances in fish tagging and marking technology.American Fisheries Society, Symposium 76, Bethesda, Maryland.
Webster, J. L., and P. K. Bergman. 1998. Device and method for volitionallyorienting fish. U.S. patent 5,816,196. October 6, 1998.
Wells, L., and A. L. McLain. 1973. Lake Michigan: man’s effects on nativefish stocks and other biota. Great Lakes Fisheries Commission, TechnicalReport No. 20.
680 KORNIS ET AL.
Dow
nloa
ded
by [
Mat
thew
Kor
nis]
at 1
9:48
01
June
201
6