Embed Size (px)
Citation preview

Analysis from Kelley Blue Book’s Analytic Insights Team
BLUE BOOKMarket Report
www.kbb.com
Robyn Eagles | Director, Public Relations949.268.3049 | [email protected]
Joanna Pinkham | Senior Public Relations Manager949.268.3079 | [email protected]
Brenna Robinson | Public Relations Manager949.267.4781 | [email protected]
Kelley Blue Book Public Relations Contacts:
In This Issue:MARKET ANALYSIS Fuel-Efficient Vehicle Values Staring at 15 Percent Correction
Fuel Prices Continue Downward Trend
Kelley Blue Book Recommends Dealers Sell Fuel-Efficient Models, Replenish with Stable Crossovers
All-New Video - ‘Blue Book Minute’
LATEST HOT USED-CAR REPORT Summer Months Heat Up Large-Vehicle Interest
JULY2011
MARKET ANALYSIS:
Fuel-Efficient Vehicle Values Staring at 15 Percent Correction - Alec Gutierrez, manager of vehicle valuation, Kelley Blue Book
Annual Subscription Value: $500
A fter 20 weeks of consecutive gains, values for gas-sipping vehicles peaked in May in response to a decline in fuel prices. During the last 4 to 6 weeks, values of compacts and subcompacts declined approximately 1 to 2 percent, along with the overall market; however, Kelley Blue Book’s valuation team expects the overall used-vehicle market to decline no more than
an additional 3 to 5 percent between now and the end of the year. With fuel-efficient used vehicles reaching their peak in demand and price, larger drops are expected in this segment.
During 2011, Kelley Blue Book has reported remarkable strength among values of fuel-efficient subcompact, compact and hybrid cars. From January through May of this year, fuel-efficient vehicle values increased a noteworthy 20 to 25 percent, far surpassing the overall used-car market average increase of 5 percent during the same time period. This steep increase can be attributed to the following:
1. Gas prices increasing from $3.00 on January 1 to $3.97 per gallon on May 152. Supply constraints of new fuel-efficient vehicles resulting from the earthquake in Japan3. Continued supply constraints of good-condition vehicles due to reduced leasing and trade-ins
In addition to some much-needed relief at the pump, it appears as though Japanese manufacturers are expected to have their production facilities back to 100 percent capacity by September, which is earlier than originally anticipated. With gas prices continuing to decline and Japanese vehicle and part production recovering, demand for fuel-efficient vehicles is waning, and as a result, dealers are becoming more reluctant to pay premium prices for these vehicles at auction.
0.3%
-0.2
%
1.1% 2.
2%2.9%
9.1%
1.8%
5.6%
0.3%
2.8%
-1.7
%
-1.4
%
-6%
-4%
-2%
0%
2%
4%
6%
8%
10%
12%
Overall Market Average Fuel-Efficient Segments*
Monthly Valuation Change (MY08-10)
Jan
Feb
Mar
Apr
May
Jun
*Fuel-Efficient Segments include Subcompact Cars, Compact Cars, & Hybrid Cars

2 BLUE BOOK Market Report JULY 2011
MARKET ANALYSIS:continued
Fuel-Efficient Segments Drastically Outperform the Overall Market (MY09-10)Segment Jan Feb Mar Apr May Jun YTDFuel-Efficient Average -0.2% 2.2% 9.1% 5.6% 2.8% -1.4% 19.2%Overall Market Average 0.3% 1.1% 2.9% 1.8% 0.3% -1.7% 4.7%Difference* -0.5 1.1 6.2 3.8 2.5 0.4 14.4*Difference highlights point difference between the overall market and fuel-efficient segments
While depreciation has been relatively mild so far, based on changes in gas prices and issues with supply, Kelley Blue Book believes a significant 15 percent correction is likely by the end of the year. If we take a look back at the auction market in 2008 when gas prices hit $4.00 per gallon, we can foresee drops during the next few months.
$0
$2,000
$4,000
$6,000
$8,000
$10,000
$12,000
$14,000
KBB Auction Values for Fuel-Efficient Vehicles*- 2008 vs. 2011
Fuel-Efficient Vehicles - CY08 (MY05)Fuel-Efficient Vehicles - CY11 (MY08)
*Fuel-Efficient Vehicles include Subcompact, Compact, and Hybrid Cars
A
B
C
KBB Auction Value Change in Three-Year-Old Vehicles* (2008 vs. 2011)
Calendar Year January - July (A→B) July - December (B→C) January - December (A→C)2008 21.6% -39.8% -26.8%2011 21.2% ??? ???
*Three-Year-Old Vehicles represent MY05 for CY08 and MY08 for CY11
Market Change
Fuel-Efficient Vehicles
Key insights derived from the charts above:
1. Performance during the first half of the year in both 2008 and 2011 are trending very similarly, increasing 21 percent in response to rising gas prices.
2. Values of three-year-old fuel-efficient vehicles are significantly more expensive today than they were in 2008. Reduced leasing and trade-ins since 2008 have shrunk supply of these vehicles, while a weaker than expected economic recovery has kept demand strong for these budget-friendly vehicles.
3. Finally and most importantly, notice the severe 40 percent decline that occurred from July through December 2008. As gas prices dropped from $4.10 per gallon nationally in July 2008 to $1.60 by year-end, demand for gas-sipping vehicles evaporated.

3 JULY 2011 BLUE BOOK Market Report
MARKET ANALYSIS:continued
While there are many similarities between today’s market and that of 2008, there also are key differences that have allowed us to determine that there will be little need to panic during the latter half of 2011:
1. The level of economic uncertainty in 2008 was significantly higher than it is today. The unemployment rate was climbing fast into the end of the year, and the financial sector was in a free-fall with seemingly no end in sight.
2. Fuel prices declined significantly in the latter half of 2008, ending the year at $1.60 per gallon, while oil fell from a high of $140 per barrel down to $30 by year-end. Today, oil has only dropped from a high of $115 down to around $95, while fuel prices remain at $3.50 per gallon today.
3. Used vehicles were in abundant supply in 2008, while today we face a shortage of good-condition used vehicles due to the severe downturn in new-vehicle sales, leases and ultimately trade-ins. This should act to limit the downside potential for fuel-efficient vehicle values.
Based on the information above, Kelley Blue Book believes that while a correction may be looming, we do not expect to see a repeat of the 40 percent decline in values that took place during the second half of 2008. Rather, Kelley Blue Book predicts that the correction will be more like 15 to 20 percent. The chart shows that in 2009 and 2010, values declined between 6 to 11 percent. With values inflated 20 percent since the beginning of the year, we are likely to surpass the drops of both 2009 and 2010, although we will not repeat the heavy drops of 2008. The key factor determining the July to December drop in fuel-efficient vehicle values will be fuel prices and where they finally stabilize.
July - December Depreciation (One- to Three-Year-Old Vehicles)
Segment 2008 2009 2010 2011 ForecastSubcompact Cars -38.7% -11.0% -8.8% -13.0%Compact Cars -39.8% -11.4% -6.1% -15.0%Hybrid Cars -41.4% -9.6% -7.5% -16.0%
Calendar Year
Fuel Prices Continue Downward Trend
G as prices already have declined $0.40 per gallon since mid-May, and there is a strong likelihood of additonal softness moving forward. While fuel prices have performed similarly to the last run-up in 2008, they peaked earlier this year and are widely expected to continue to decline through summer. There are several factors that are likely to continue to push down both gas
and oil prices moving forward.
1. President Obama recently announced that the United States will release 30-million barrels of oil from strategic reserves. This should provide some temporary relief, but when we consider that the U.S. consumes approximately 18-million barrels of oil per day, this is not likely to have a lasting impact.
2. Saudi Arabia announced plans to increase oil production to 10-million barrels per day starting in July. Even if they don’t fully live up to their commitement, an increase in production from a major player such as Saudi Arabia should provide relief to any supply concerns.
3. The International Energy Agency (IEA) recently announced that they would release 60-million barrels of oil from member nations’ strategic reserves at a pace of 2-million barrels per day, 30 million of which will come from the United States. This should provide further relief to the increased supplies being provided by Saudi Arabia.
The severe drop in 2008 was the result of rampant speculation coupled with the near-total collapse of the U.S. economy. We may not be able to predict the bottom of the market, but we do expect prices to drop through summer, and as fuel prices continue to decline, values of fuel-efficient used vehicles will drop. While oil prices and subsequently gasoline prices will continue to fall based on increased supplies, a 15 percent decline will not send the industry into the tailspin experienced in 2008, when near 40 percent declines were seen across the board.
4 BLUE BOOK Market Report JULY 2011
MARKET ANALYSIS:continued
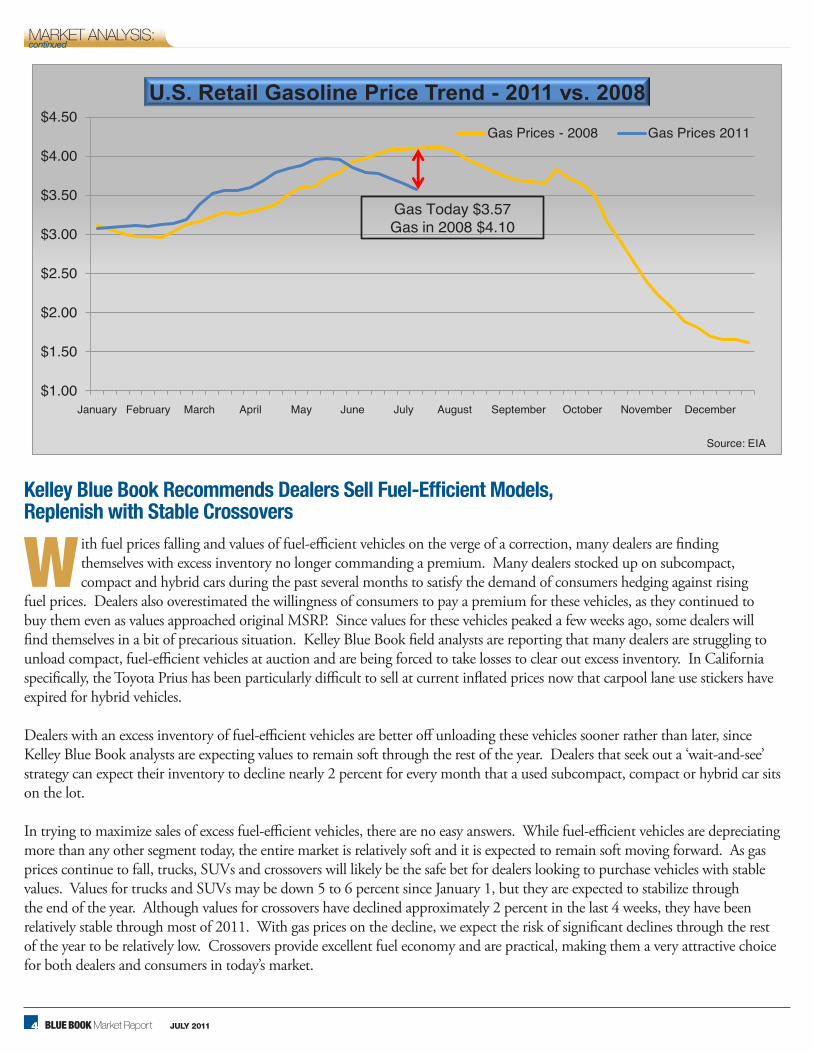
Kelley Blue Book Recommends Dealers Sell Fuel-Efficient Models, Replenish with Stable Crossovers
$1.00
$1.50
$2.00
$2.50
$3.00
$3.50
$4.00
$4.50
January February March April May June July August September October November December
U.S. Retail Gasoline Price Trend - 2011 vs. 2008Gas Prices - 2008 Gas Prices 2011
Gas Today $3.57Gas in 2008 $4.10
Source: EIA
W ith fuel prices falling and values of fuel-efficient vehicles on the verge of a correction, many dealers are finding themselves with excess inventory no longer commanding a premium. Many dealers stocked up on subcompact, compact and hybrid cars during the past several months to satisfy the demand of consumers hedging against rising
fuel prices. Dealers also overestimated the willingness of consumers to pay a premium for these vehicles, as they continued to buy them even as values approached original MSRP. Since values for these vehicles peaked a few weeks ago, some dealers will find themselves in a bit of precarious situation. Kelley Blue Book field analysts are reporting that many dealers are struggling to unload compact, fuel-efficient vehicles at auction and are being forced to take losses to clear out excess inventory. In California specifically, the Toyota Prius has been particularly difficult to sell at current inflated prices now that carpool lane use stickers have expired for hybrid vehicles.
Dealers with an excess inventory of fuel-efficient vehicles are better off unloading these vehicles sooner rather than later, since Kelley Blue Book analysts are expecting values to remain soft through the rest of the year. Dealers that seek out a ‘wait-and-see’ strategy can expect their inventory to decline nearly 2 percent for every month that a used subcompact, compact or hybrid car sits on the lot.
In trying to maximize sales of excess fuel-efficient vehicles, there are no easy answers. While fuel-efficient vehicles are depreciating more than any other segment today, the entire market is relatively soft and it is expected to remain soft moving forward. As gas prices continue to fall, trucks, SUVs and crossovers will likely be the safe bet for dealers looking to purchase vehicles with stable values. Values for trucks and SUVs may be down 5 to 6 percent since January 1, but they are expected to stabilize through the end of the year. Although values for crossovers have declined approximately 2 percent in the last 4 weeks, they have been relatively stable through most of 2011. With gas prices on the decline, we expect the risk of significant declines through the rest of the year to be relatively low. Crossovers provide excellent fuel economy and are practical, making them a very attractive choice for both dealers and consumers in today’s market.

5 JULY 2011 BLUE BOOK Market Report
MARKET ANALYSIS:continued
95
97
99
101
103
105
107
109
111Used-Car Price Index - Crossover Segments vs. Overall Market
Compact Crossover Mid-Size Crossover Full-Size Crossover Overall Market
*Index is calculated as a sales weighted average for all MY 2008-2010 KBB valued vehicles.
C heck out an all-new video featuring Juan Flores, director of vehicle valuation for Kelley Blue Book, detailing the latest insights into the marketplace for July. To view the video, click here: http://mediaroom.kbb.com/blue-book-minute
All-New Video - ‘Blue Book Minute’

6 BLUE BOOK Market Report JULY 2011
HOT USED-CAR REPORT:
Summer Months Heat Up Large-Vehicle Interest Kelley Blue Book’s Hot Used-Car Report captures monthly used-car shopper activity on kbb.com, including a list of the top and bottom movers in the same time period. Results are provided by the Kelley Blue Book Market Intelligence Team, in an effort to help dealers better understand which used vehicles consumers are looking at most each month.
About Kelley Blue Book www.kbb.com Founded in 1926, Kelley Blue Book, The Trusted Resource®, is the only vehicle valuation and information source trusted and relied upon by both consumers and the industry. Each week the company provides the most market-reflective values in the industry on its top-rated website www.kbb.com, including its famous Blue Book® Trade-In and Retail Values, and Fair Purchase Price, which reports what others are paying for new cars this week. The company also provides vehicle pricing and values through various products and services available to car dealers, auto manufactur-ers, finance and insurance companies, as well as governmental agencies. Kbb.com is a leading provider of new car prices, used car values, car reviews, new cars for sale, used cars for sale and car dealer locations. Kelley Blue Book Co., Inc., is a wholly owned subsidiary of AutoTrader.com.
T he arrival of summer changes the needs and wants of the car shopper, especially with summer vacation and family road trips this time of year. With sun and fun in mind, the month of June experienced an increase in shopping activity for larger vehicles across the board. However, gas prices are still atop consumers’ minds, as the hybrid sport utility segment experienced
the largest increase in kbb.com traffic share. In the early stages of summer, dealers can expect more foot traffic for SUVs and crossover vehicles. Some of the more popular used SUVs on kbb.com at this time are the 2008 Cadillac SRX, 2007 Nissan Armada, 2008 Ford Expedition and 2009 GMC Yukon. All of the aforementioned vehicles saw a near 50 percent increase of share month-over-month during June.
-41.9%
-39.9%
-39.6%
-33.2%
-30.8%
-29.5%
-28.9%
-28.2%
-27.3%
-27.0%
38.9%
39.2%
40.4%
41.8%
48.8%
51.5%
52.2%
52.4%
57.9%
161.2%
-100% 0% 100% 200%
2007 CHEVROLET SILVERADO (CLASSIC) 1500 EXTENDED CAB
2007 CHEVROLET SILVERADO (CLASSIC) 1500 CREW CAB
2007 CHEVROLET SILVERADO (CLASSIC) 2500 HD CREW CAB
2009 TOYOTA PRIUS
2009 DODGE RAM 1500 CREW CAB
2008 MERCEDES-BENZ S-CLASS
2008 CHRYSLER PT CRUISER
2008 KIA OPTIMA
2008 TOYOTA PRIUS
2007 PONTIAC SOLSTICE
2008 INFINITI EX
2008 JEEP LIBERTY
2007 NISSAN PATHFINDER
2007 HYUNDAI TIBURON
2009 GMC YUKON
2008 FORD EXPEDITION
2007 NISSAN ARMADA
2008 VOLVO S80
2008 CADILLAC SRX
2007 NISSAN 350Z
% Change in Share Month-Over-Month
Monthly Used-Car Shopping Activity Growth Top/Bottom 10 Models
Information based on 2009 to 2005 model-year vehicles
-13.2%
-7.7%
-5.7%
-4.3%
-3.6%
-3.2%
-2.0%
-1.8%
0.5%
0.6%
2.4%
5.3%
5.4%
5.8%
7.7%
9.9%
10.0%
11.1%
13.1%
23.8%
-30% -15% 0% 15% 30%
Hybrid Car
Full-Size Pickup Truck
Full-Size Car
Compact Car
Van
Subcompact Car
Mid-Size Car
Mid-Size Pickup Truck
Luxury Car
Luxury Sport Utility
Sports Car
Compact Crossover
Hybrid Crossover
Minivan
Full-Size Sport Utility
Mid-Size Crossover
Mid-Size Sport Utility
Luxury Crossover
Full-Size Crossover
Hybrid Sport Utility
% Change in Share Month-Over-Month
Monthly Used-Car Shopping Activity Growth Segments
Information based on 2009 to 2005 model year vehicles