Embed Size (px)
Citation preview
INCH CAPE OFFSHORE LIMITED
ANNEX 10A.3 WAVE CLIMATE ANALYSIS METHODOLOGY
TECHNICAL REPORT
Report Reference. Annex 10A.3 Rev1
Issued 20 May 2013
Metoc Limited Exchange House
Liphook Hants GU30 7DW
United Kingdom
Tel: +44 (0) 1428 727800 Fax: +44 (0) 1428 727122
E-mail: [email protected]
Web Site: www.metoc.co.uk
INCH CAPE OFFSHORE LIMITED ANNEX 10.3 WAVE CLIMATE ANALYSIS METHODOLOGY
REPORT REFERENCE: ANNEX 10A.3 REV2 20/05/2013
DOCUMENT RELEASE FORM
Title:
ANNEX 10.3 WAVE CLIMATE ANALYSIS METHODOLOGY TECHNICAL REPORT
Client: INCH CAPE OFFSHORE LIMITED
Report Reference: ANNEX 10A.3 REV1
Date of Issue: 20 May 2013
Hard Copy Digital
Distribution: INCH CAPE OFFSHORE LIMITED No: n/a PDF
Intertek Energy & Water consultancy services No: n/a PDF
Prepared By: Paul Taylor
Project Manager: Authoriser:
Paul Taylor Chris Mooij
Rev No Date Reason Author Checker Authoriser
Rev 0 16/10/12 Original PAT KRM CPM
Rev 1 14/05/13 To address client comments PAT KRM CPM
Rev 2 20/05/13 To address further client comments PAT KRM CPM
COPY NUMBER: (applies to hard copies only)
INCH CAPE OFFSHORE LIMITED ANNEX 10.3 WAVE CLIMATE ANALYSIS METHODOLOGY
REPORT REFERENCE: ANNEX 10A.3 REV2 1 20/05/2013
An analysis of the wave climate at the offshore boundaries of the Forth and Tay Modelling System (FTMS) was required for two principal reasons:
to provide FTMS model boundary inputs in the form of time series, for calibration and validation of the spectral wave model; and
to provide FTMS model boundary inputs in the form statistical wave climate tables, for undertaking the long-term metocean and coastal processes assessment.
The wave climate analysis used hindcast model output from the UK Meteorological Office (UKMO) 12 km UK Waters model (up to November 2008) and 12 km Wave Watch III model (from December 2008 onwards). Data from these models were amalgamated into a single time series to form 11 years of wind and wave data spanning the period March 2000 to April 2011.
Data were obtained for two selected locations (UKMO model grid points) on the eastern offshore boundary of the FTMS. During calibration and validation of the FTMS spectral wave model, time series inputs were required in order to run discrete events through the FTMS wave model. Both of the UKMO model grid points were used in order to provide temporally and spatially varying boundary conditions. Conversely, for the metocean and coastal processes assessment, it was necessary to model the general long-term wave climate, rather than specific events. In order to do this, data from just one of the UKMO model locations were used (named Grid Point 1, at location 488161E, 698382N). This location was selected as being the most suitable for delivering an accurate representation of wave conditions across the Inch Cape Development Area, Offshore Export Cable Corridor and the Regional Study Area.
In order to identify a set of boundary conditions that could be used to adequately represent the long-term wave climate, the time series data for UKMO model Grid Point 1 were initially analysed using a set of joint frequency tables. The five parameters analysed were:
significant wave height (Hs), analysed in 0.5 m bands;
peak wave period (Tp), analysed in 0.5 s bands;
mean wave direction (Hdir), analysed in 16 sectors of 22.5°;
mean wind speed (Ws), analysed in 1 m s-1 bands; and
wind direction (Wdir) , analysed in 16 sectors of 22.5°.
The following joint frequency tables were produced:
Hs versus Hdir;
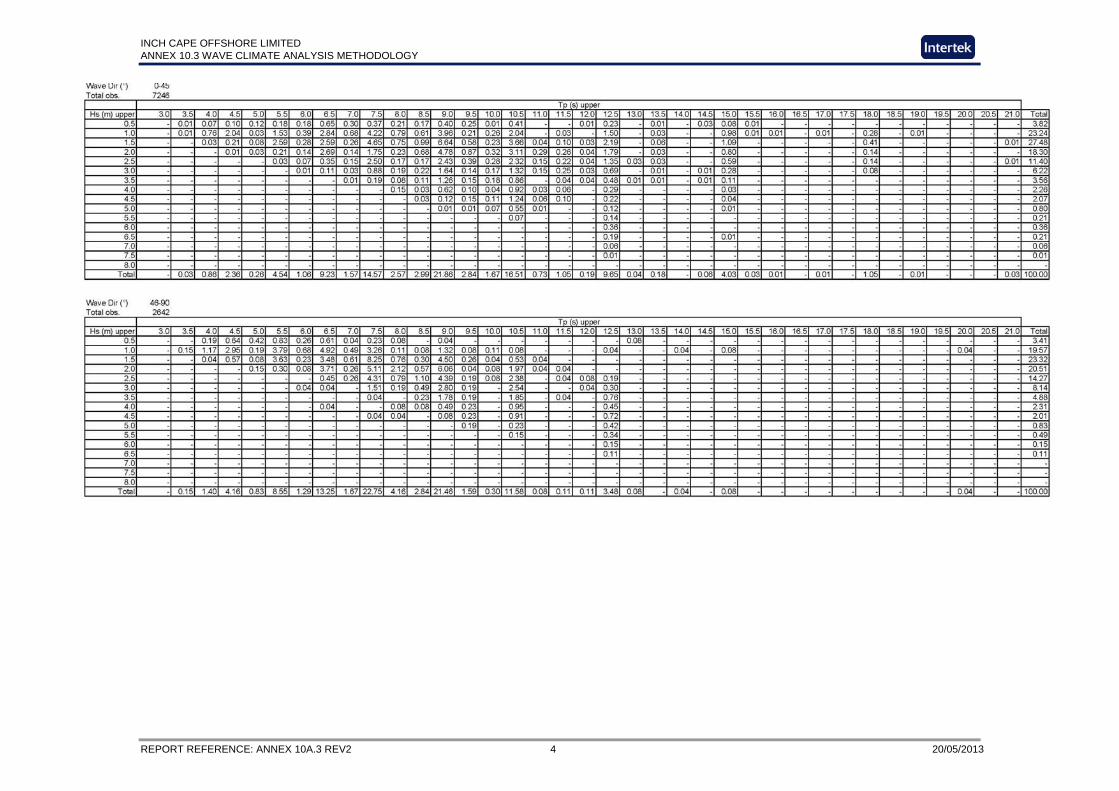
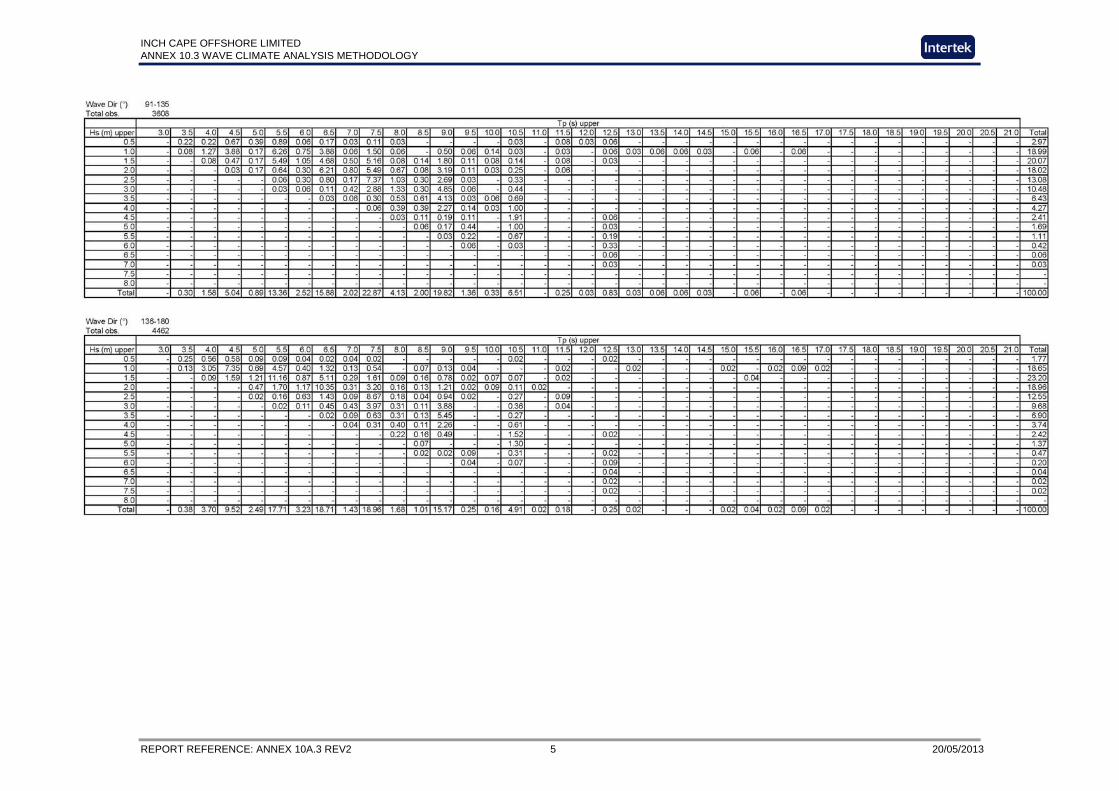
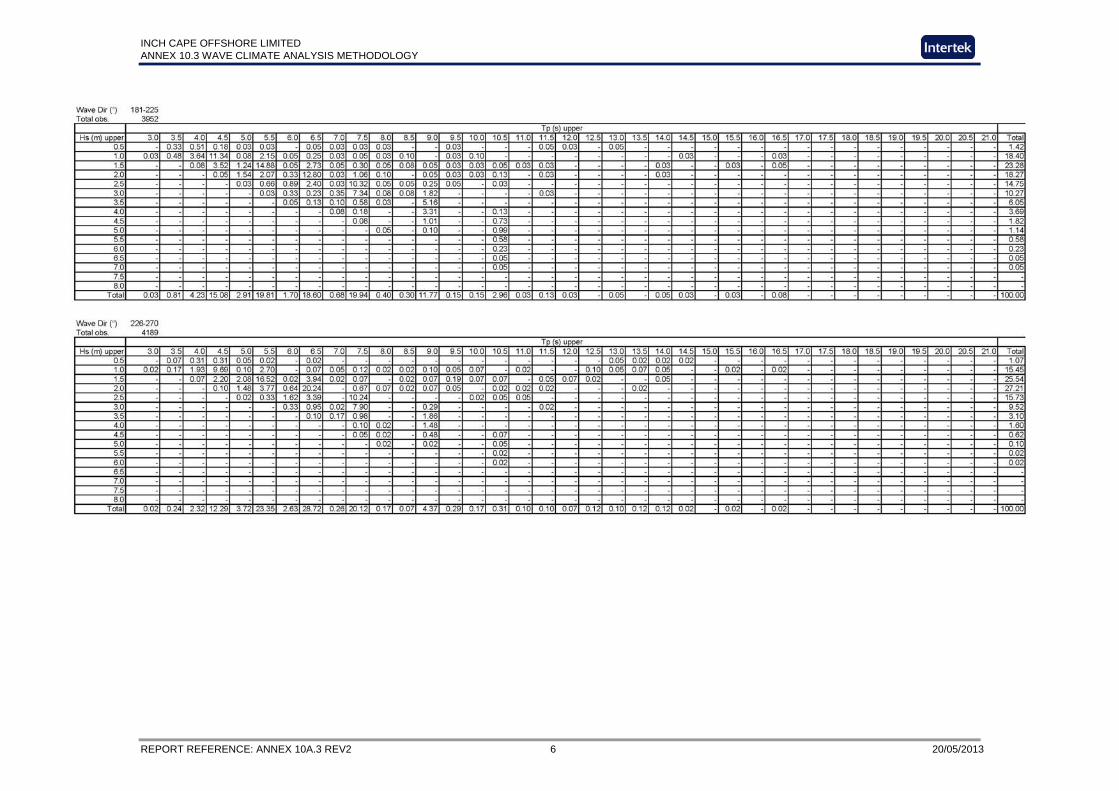
Hs versus Tp for each Hdir sector;
Hs versus Ws for each Hdir sector; and
Hdir versus Wdir.
Frequencies were calculated as percentage occurrence.
From the frequency analysis, two main types of scenario were identified. Wave conditions at the Inch Cape Development Area from roughly the eastern hemisphere are caused by waves propagating into the model domain from the North Sea. Conversely, waves from roughly the western hemisphere are caused by wind blowing over the sea between the coast and the Regional Study Area.
INCH CAPE OFFSHORE LIMITED ANNEX 10.3 WAVE CLIMATE ANALYSIS METHODOLOGY
REPORT REFERENCE: ANNEX 10A.3 REV2 2 20/05/2013
For the waves coming from the eastern hemisphere, a number of combinations of Hs, Tp and Hdir were selected that would fully represent the various combinations of these conditions that could occur throughout the lifetime of the development. For each one of these wave conditions, a suitable wind speed was also chosen, based on the observed relationship between wave height and wind speed. Finally, the wind direction was set equal to the mean wave direction, since analysis of the UKMO model data demonstrates that these two parameters are strongly correlated.
For waves coming from the western hemisphere, it was primarily necessary to specify wind speed and direction. Once more, a suitable number of wind conditions was selected based on the calculated joint frequency distributions of Ws and Wdir.
This analysis initially resulted in the identification of a large number of scenarios representing the wave/wind climate – primarily wave-driven from the east, and primarily wind-driven from the west. Each one of these scenarios has an associated frequency of occurrence. In order to focus on the scenarios of most significance to the metocean and coastal processes assessment, emphasis was placed on:
those scenarios with a relatively high frequency of occurrence; and
those scenarios of potential importance to the wider study (e.g. higher wave heights and longer periods, which are most likely to affect sediment movement at the seabed in the relatively deep waters of the Inch Cape Development Area).
Scenarios with similar values for wave height, period and direction were grouped together, so as to minimise model runs times while ensuring that the full long-term wave climate was suitably modelled. In this way, 196 separate model scenarios were identified, each with an associated frequency of occurrence, and each with a specific Hs, Tp, Hdir, Ws and Wdir. The 196 representative wave/wind conditions were modelled using a quasi-stationary solution to the spectral wave model, whereby each condition was modelled discretely. The wave conditions predicted across the study domain were subsequently analysed to determine the percentile values (50, 90, 95 and 9 percentile) for significant wave height, taking into account the percentage frequency of occurrence for each separate model scenario.
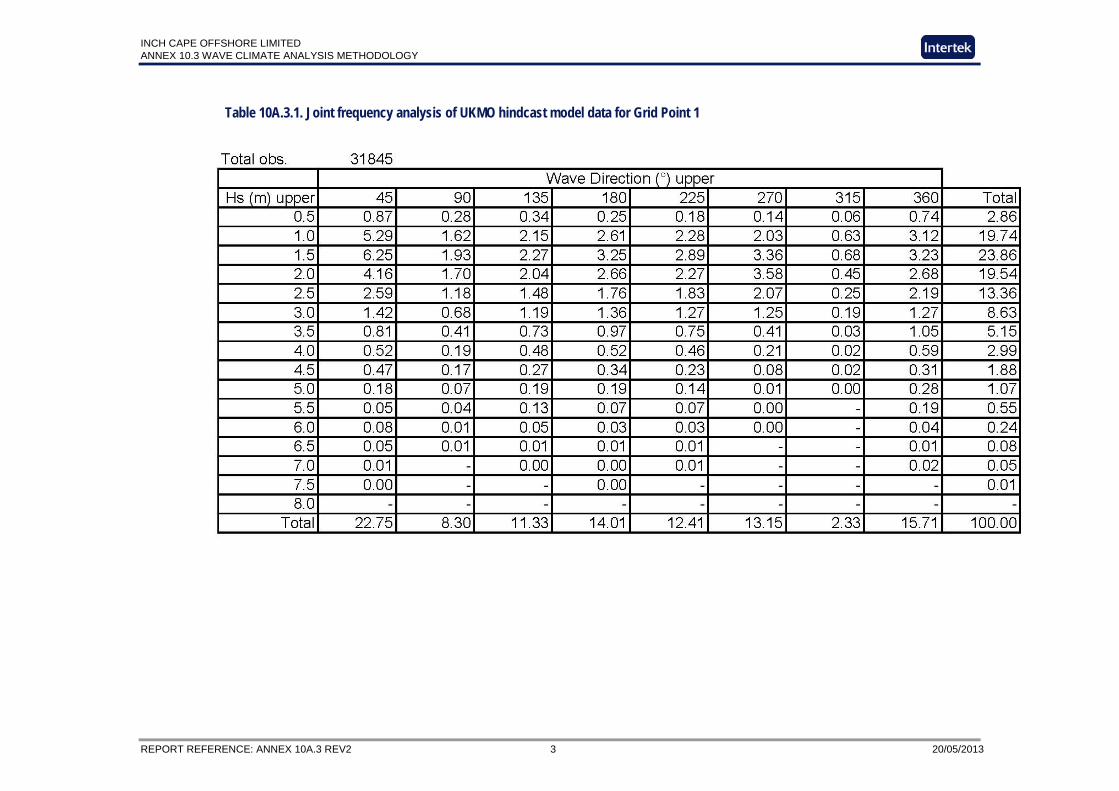
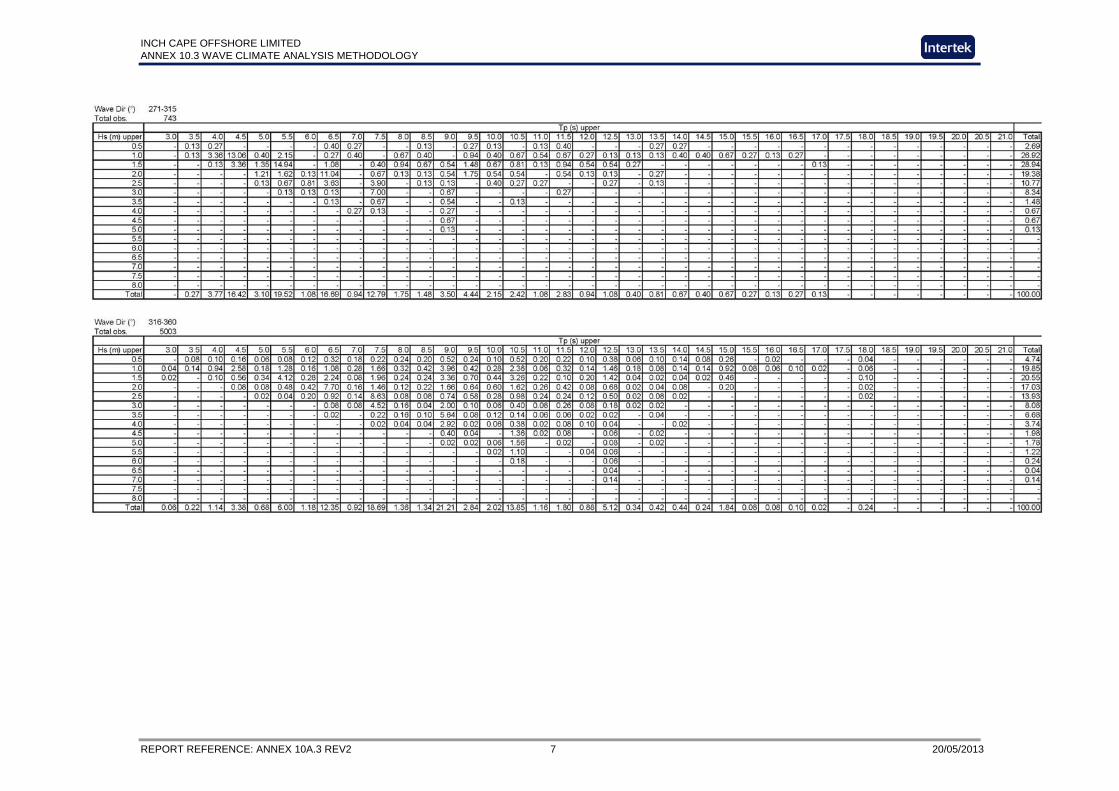
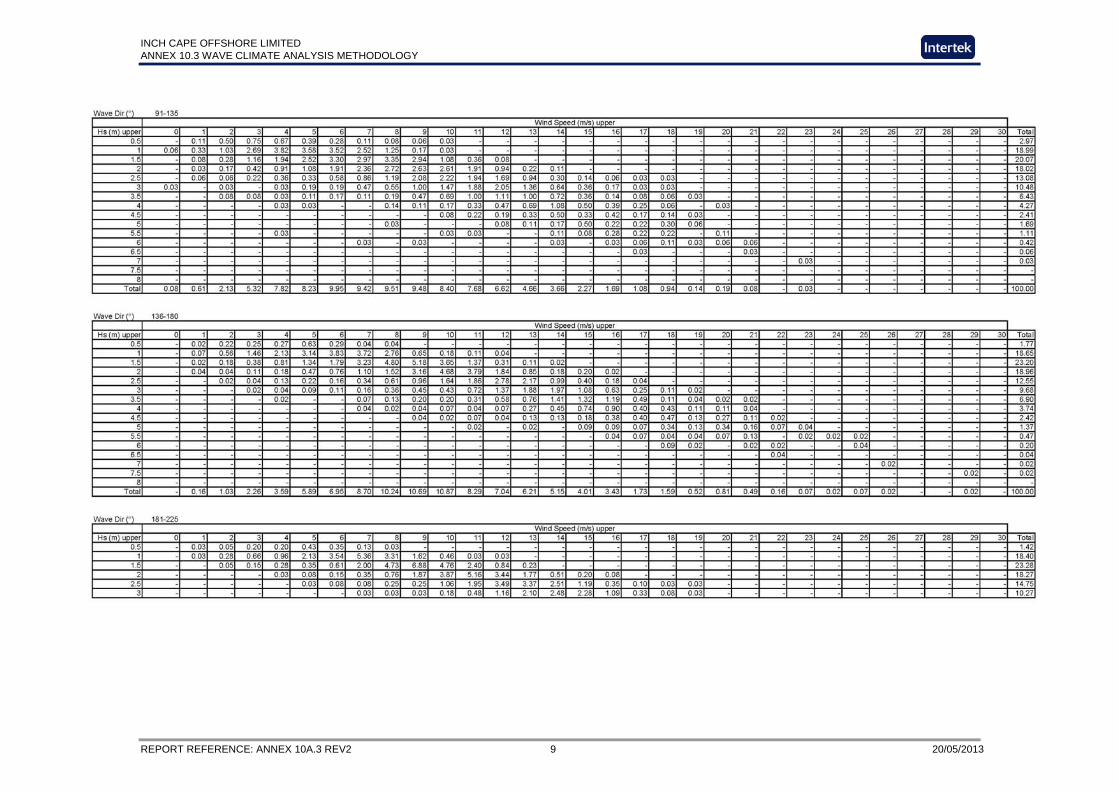
Table 10A.3.1 provides the results of the joint frequency analysis of the UKMO hindcast model data (Grid Point 1).
INCH CAPE OFFSHORE LIMITED ANNEX 10.3 WAVE CLIMATE ANALYSIS METHODOLOGY
REPORT REFERENCE: ANNEX 10A.3 REV2 3 20/05/2013
Table 10A.3.1. Joint frequency analysis of UKMO hindcast model data for Grid Point 1
INCH CAPE OFFSHORE LIMITED ANNEX 10.3 WAVE CLIMATE ANALYSIS METHODOLOGY
REPORT REFERENCE: ANNEX 10A.3 REV2 4 20/05/2013
INCH CAPE OFFSHORE LIMITED ANNEX 10.3 WAVE CLIMATE ANALYSIS METHODOLOGY
REPORT REFERENCE: ANNEX 10A.3 REV2 5 20/05/2013
INCH CAPE OFFSHORE LIMITED ANNEX 10.3 WAVE CLIMATE ANALYSIS METHODOLOGY
REPORT REFERENCE: ANNEX 10A.3 REV2 6 20/05/2013
INCH CAPE OFFSHORE LIMITED ANNEX 10.3 WAVE CLIMATE ANALYSIS METHODOLOGY
REPORT REFERENCE: ANNEX 10A.3 REV2 7 20/05/2013

INCH CAPE OFFSHORE LIMITED ANNEX 10.3 WAVE CLIMATE ANALYSIS METHODOLOGY
REPORT REFERENCE: ANNEX 10A.3 REV2 8 20/05/2013
INCH CAPE OFFSHORE LIMITED ANNEX 10.3 WAVE CLIMATE ANALYSIS METHODOLOGY
REPORT REFERENCE: ANNEX 10A.3 REV2 9 20/05/2013