Embed Size (px)
Citation preview

Income and Wealth:
How Did Households Owning Small Businesses Fare from 1998 to 2007
by
George W. Haynes, Ph.D. Montana State University
Bozeman, MT 59717
for
Under contract no. SBAHQ-08-M-0454
Release Date: January 2010
This report was developed under a contract with the Small Business Administration, Office of Advocacy, and contains information and analysis that was reviewed and edited by
officials of the Office of Advocacy. However, the final conclusions of the report do not necessarily reflect the views of the Office of Advocacy.
2
Contents Introduction 3 Literature Review 4 Conceptual Considerations 7 Empirical Considerations 8 Results 16 Conclusions 35 References 42 Appendix A 44 Appendix B 45 Appendix C 46

3
Introduction The general economic expansion earlier in this decade dramatically increased the wealth
of some individuals while leaving others with less modest increases, or decreases, in
wealth. While there is ample discussion of the growth of businesses in the United States
over the past 30 years, there is very limited knowledge about the owners (individuals or
households) of privately held businesses. The public debate about wealth distribution and
income inequality centered around the divide between the rich and the poor or the
wealthy and the poverty-stricken, rather than the difference between those who owned
and/or operated businesses versus those who worked for others and the unemployed. This
study examines changes in the distributions of income and wealth for three primary types
of households: households not owning a business, households owning and managing only
one small business (single business owners), and households owning and managing at
least one small business and owning other businesses (multiple business owners). Using
this classification of households (and business owners) and the Surveys of Consumer
Finances from 1998 to 2007, this study assesses changes in the income earned and wealth
accumulated by different types of small businesses from 1998 to 2007.
Using the Board of Governors of the Federal Reserve’s Survey of Consumer
Finances, this study examines two important questions:
(1) Did families with small business owners living in the household increase
their income and wealth by more than families without small business
owners living in the household from 1998 to 2007?
4
(2) Did families with more than one small business increase their income and
wealth by more than other families owning small businesses from 1998 to
2007?
Literature Review
The financial situation of U.S. families changed substantially between the early 1990s
and 2007. The literature review examines relevant literature assessing changes in the
income and wealth of U.S. families. Special attention is given to evidence of changes in
the income and wealth of U.S. families who own one or more small businesses. A
relatively comprehensive literature exists on the financial condition (income and wealth)
of families, but the literature is much less comprehensive for the subset of families who
own businesses. The Federal Reserve Board assesses recent changes in U.S. family
finances every three years when summarizing results derived from the most recent
Survey of Consumer Finances (Kennickell and Starr-McCluer, 1997; Kennickell, Starr-
McCluer and Surette, 2000; Aizcorbe, Kennickell and Moore, 2003; Bucks, Kennickell
and Moore, 2006; Bucks, Kennickell, Mach and Moore, 2009).
Between 1992 and 1995, real mean and median family income increased slightly,
although not sufficiently to offset the declines from 1989 to 1992 (Kennickell and Starr-
McCluer, 1997). By 1995, median income and wealth were nearly the same as in 1989;
however, mean income and wealth had not fully recovered. This period of time from
1992 through 1995 was one of continued economic expansion in the U.S. economy. By
1998, real mean and median family income had surpassed their 1989 levels, having
exhibited strong growth between 1995 and 1998. This period was marked by an increase
5
in the holding of stock equity and a booming stock market (Kennickell, Starr-McCluer
and Surette, 2000). While family indebtedness increased over this period of time, asset
growth was more rapid. By 1998, the economy was in the seventh year of an economic
expansion. Civilian unemployment was around 4.5% and the average annual inflation
rate of 2.2%, as measured by the consumer price index, had been low for the previous
three years. Mean and median family income continued to grow from 1998 through 2001
with the fastest growth occurring among higher income households (Azicorbe,
Kennickell and Moore, 2003).
The Survey of Consumer Finances shows that the median value of real family
income continued to trend upward, while the mean value of real family income actually
declined from 2001 to 2004 (Bucks, Kennickell and Moore, 2006). This result may
suggest distributional changes within the groups. The authors suggest that three important
shifts occurred during this time: (1) house values appreciated and homeownership
increased; (2) prices in the equity market generally recovered; and (3) the debt to asset
ratio increased.
The most recent Survey of Consumer Finances suggests that the median value of
real family income before taxes was unchanged from 2004 to 2007, while both median
and mean net worth increased (Bucks, Kennickell, Mach and Moore, 2009). The increase
in the share of total assets attributed to unrealized capital gains were especially important
from 2004 to 2007. The share of unrealized capital gains in total assets rose from 5.1% to
nearly 36% from 2004 to 2007.
While no other authors addressed small business owners, Wolff (1998) argued
that “. . . small business equity, which tends to move with stock prices, is also highly
6
concentrated among the rich.” While small business owners may have realized an
increase in the value of their assets with the increase in the stock market, other evidence
suggests that small business owners hold more debt than non-business-owning families
(Haynes and Avery, 1996). In addition, recent research suggests that small business
owners are willing to assume more risk and hold more risky portfolios of assets (Xaio,
Alhabeeb, Hong and Haynes, 2001). Thus, whether or not families owning small
businesses improved their financial status between 1989 and 2004 is an open question.
This study examines changes in the real income and wealth of families owning small
businesses to determine whether they had higher mean income and wealth and increasing
or decreasing shares of total income and wealth from 1989 to 2004.
Another study completed by Haynes (2005) suggests that households owning
small businesses, especially those owning only one small business, appear to have made
smaller contributions to total wealth in 2001 than in the early 1990s. The evidence
suggested that households owning only one small business seemed to be losing the race.
They were making progress in increasing income and wealth, but they were making less
progress than households not owning small businesses. A more recent study provides
further evidence that compared with other households, those with small businesses made
less progress in increasing their wealth and very similar progress in increasing their
income in the late 1980s, a time of robust business activity, and early 2000s, a time of
recovery for businesses (Haynes and Ou, 2006). However, an examination of data from
1992, a year of recovery, through 2004, another year of recovery, indicated that
households owning small businesses appeared to have progressed at about the same rate
as other households.
7
A sharp downturn in the stock market occurred in the second quarter of 2000
putting downward pressure on the income and wealth of many households. Financial
prosperity in the 1990s was primarily dependent upon the rise of the stock markets. The
2004 and 2007 SCFs capture this downturn in the stock market and enable a comparison
of the financial success of small-business-owning families and other families in a time
when the influence of the stock market changed substantially. On one hand, the lower
expected returns in the stock market should have encouraged investors to shift money to
business development. On the other hand, the downturn in the stock market substantially
reduced the wealth of some investors and limited their ability to invest in other ventures.
Thus, whether or not families owning small businesses improved their financial status by
2007 is an open question. This study examines changes in the real income and wealth of
families owning small businesses to determine if they had higher mean and median
income and wealth and increasing or decreasing shares of total income and wealth from
1998 to 2007.
Conceptual Considerations
This study utilizes a household decision-making model to assess the success of small
businesses, as measured by changes in income and wealth. While most other studies of
small business success utilize the profit function, this study utilizes household income
and wealth to assess the success of business-owning households. This strategy for
addressing small business issues was originally suggested by Lopez (1986) in the
following statement:
“ . . . the financial resources of the small firm are arguably intertwined with those of the household. This interdependence of resources suggests a theoretical model,

8
where the small business activity is integrated into the household utility maximization model.”
This conceptual model maximizes household utility subject to time and budget
constraints, where the business’s profit function is embedded in the budget constraint.
Recent work by Haynes and Onochie (2005) suggests that increases in the available cash
in the business (from higher gross sales or net profits) bring more cash into the
household, while only increases in the value of business (wealth) increase the amount of
money spent on other household assets. Interestingly, these business financial indicators
were not associated with measures of general well-being in the household.
In general, this model suggests that invoking the weak separability assumption
and treating the business profit function in isolation fails to recognize the intermingling
of resources between the business and household. This study recognizes the importance
of the intermingling of resources and examines two hypotheses:
(1) Families with small business owners living in the household increased
their income and wealth by more than families without small business owners living in
the household from 1998 to 2007; and
(2) Families with more than one small business increased their income and
wealth by more than other families owning one small business from 1998 to 2007.
Empirical Considerations
This section summarizes the data from the 1998 and 2007 Surveys of Consumer Finances
and presents the statistical models employed. While this is primarily a descriptive study
of small businesses in two time periods, it employs multivariate logistic and linear
9
regression models to assess the determinants of high income and wealth among
households owning small businesses.
Data
The 1998 through 2007 Surveys of Consumer Finances (SCF) were conducted for the
Federal Reserve Board by the National Opinion Research Center at the University of
Chicago. The surveys are designed to supply detailed and reliable information on balance
sheets, use of financial services, pensions, labor force participation, cash income and
demographic characteristics of U.S. households.
The SCF utilizes a dual frame sample to provide adequate coverage of the
population. One frame is a multistage area probability sample, which provides adequate
coverage of widely held assets and liabilities. The second frame is a list design employed
to over-sample relatively wealthy households. Response rates for the area probability and
list samples in 1998 and 2007 were approximately 70% and 30%, respectively.
Research conducted by the Federal Reserve Board suggests that nonresponse is
positively correlated with wealth. This study is primarily interested in examining small-
business-owning families. However, the entire sample is employed to assess the
differences between business-owning and non-business-owning families. The SCF survey
asks respondents about the previous year; hence, the SCF for 2007 actually gathers
information about the finances of the family and business in 2006.
The variables of interest in this study include business ownership status of the
household, household income and household wealth (including assets and debt held by
members of the household). Business ownership status was determined by whether an

10
individual owned and/or actively managed at least one business. Households owning
large businesses (500 or more employees) and households with only investors (owners,
but not managers) were not included in this study. Small business owners are separated
into two categories: single business owners, who own and manage only one business, and
multiple business owners, who own and manage at least one small business and own (and
possibly manage) other businesses.
Financial data, such as income and wealth data, often have a substantial
percentage of missing values. The SCF is a fully imputed data set with five separate
implicates available for every missing value. This study utilizes only one implicate in the
SCF. Household income and wealth were computed using all of the financial information
reported in the SCF. Household income is computed by summing the following sources
of income: wages and salaries, interest, dividends, asset sales, rents, unemployment, child
support, welfare, social security and other sources. The wealth of the household was
determined by generating a balance sheet, using a program supplied by the Federal
Reserve Board, to estimate the wealth of each household. Total wealth was computed by
subtracting total liabilities from total financial and nonfinancial assets. Financial assets
were computed by summing the value of transaction accounts, certificates of deposit,
directly held mutual funds, stocks, bonds, individual retirement accounts, saving bonds,
cash value of life insurance, other managed assets and other financial assets. Nonfinancial
assets were computed by summing the value of vehicles, primary residence, other
residential real estate, equity in nonresidential real estate, business interests and other
nonfinancial assets. Liabilities were tabulated by summing the value of housing debt,
11
other lines of credit, debt for other residential property, credit cards, installment loans and
other debts.
This study will discuss the changes in income from 1998 to the most recent data
collected in 2007. All income figures have been adjusted to 2007 dollars using the current
Consumer Price Index (CPI) as employed by Bucks, Kennickell, Mach and Moore
(2009).
Control variables include personal and demographic characteristics of the
household head and business owner, and characteristics of the business. The personal and
demographic characteristics include age, race (White, Black, Hispanic and other), gender,
education (no high school diploma, high school diploma, some college and college
degree or more), marital status (married, previously married or never married) and public
stock and real estate ownership (yes or no). Business characteristics include number of
employees, age of the firm, legal organization, industrial classification and founding
strategy.
The sampling frame for this analysis is U.S. households, which are referred to as
families in this report. Personal and demographic characteristics are those characteristics
of the respondent interviewed, typically the household head. If the respondent or
someone in the household owns and manages a business, this study is referring to the
largest business. No business information is available for businesses owned but not
managed by the respondent. Small businesses are businesses with fewer than 500
employees that are owned and managed by a family member. This study has not
differentiated between franchise and nonfranchise businesses.
12
Models
This study is primarily descriptive, where family income and wealth are compared for
business-owning and non-business-owning families from 1998 to 2007. This descriptive
analysis requires the careful comparison of means using regression analysis to assess
differences among business and non-business-owning families across time (1998 through
2007). The most important questions assessed in this study are the following:
(1) Did families with small business owners living in the household increase
their income and wealth by more than families without small business owners living in
the household from 1998 to 2007?
(2) Did families with more than one small business increase their income and
wealth by more than other families owning small businesses from 1998 to 2007?
Logistic and linear regression models are used to examine these two questions for three
time periods, 1998 to 2007, 2001 to 2007 and 2004 to 2007.
The first set of models utilizes dummy variables for the year 2007 and households
with a small business to determine whether households owning a small business fared
better from 1998 to 2007 than other households. The variables of interest are the main
effects on the dummy variables (year 2007 and small business) and the interaction term.
To be consistent with previous studies, high income and wealth are based on levels
established in 1992, where high income was income over $50,000 per year and high
wealth was net worth over $1 million in 1992 dollars. When these 1992 levels are
adjusted for inflation, high income is $73,779 and high wealth is $1.476 million in 2007
dollars. Six separate models are used in this study: (1) logistic regression model to
examine the probability of being high income; (2) logistic regression model to examine
13
the probability of being high wealth, where high wealth is holding $1 million in 1992
dollars; (3) logistic regression model to examine the probability of being high income,
where high income is being in the top 50% of income earners; (4) logistic regression
model to examine the probability of being high wealth, where high wealth is being in the
top 50% of wealth holders; (5) linear regression model utilizing log of household income
as the dependent variable; and (6) linear regression model utilizing log of household
wealth as the dependent variable. The six models are specified as follows:
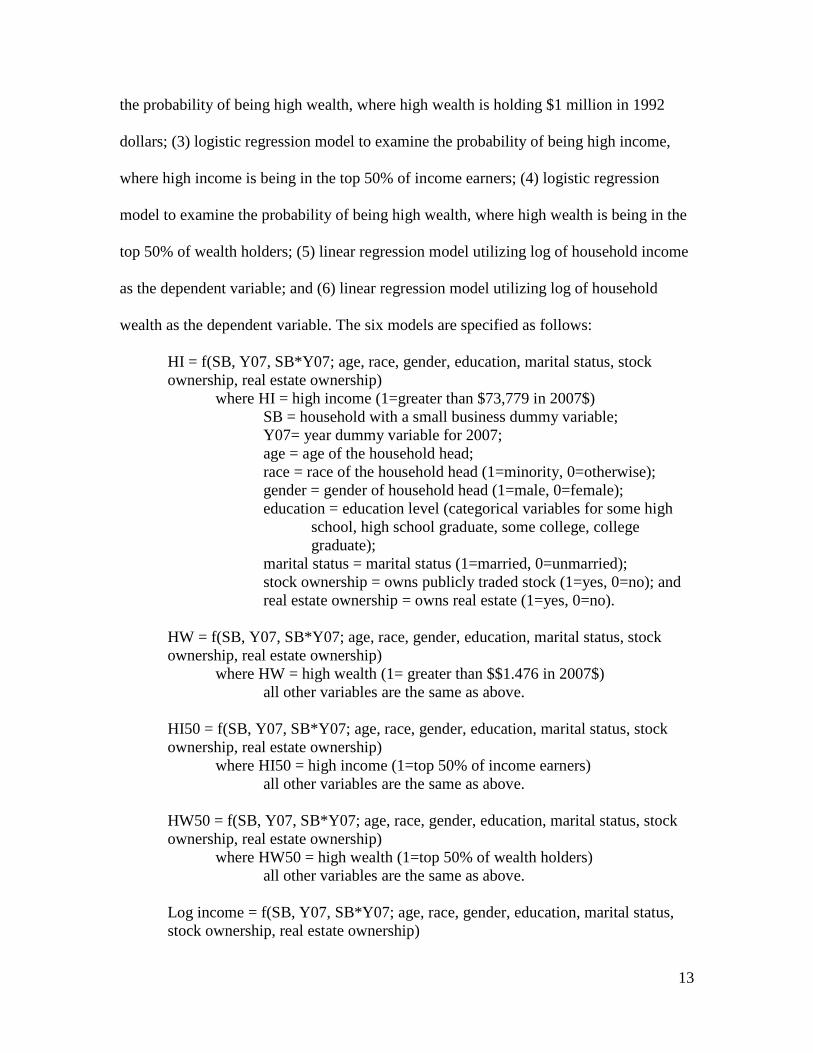
HI = f(SB, Y07, SB*Y07; age, race, gender, education, marital status, stock ownership, real estate ownership) where HI = high income (1=greater than $73,779 in 2007$)
SB = household with a small business dummy variable; Y07= year dummy variable for 2007;
age = age of the household head; race = race of the household head (1=minority, 0=otherwise); gender = gender of household head (1=male, 0=female); education = education level (categorical variables for some high
school, high school graduate, some college, college graduate);
marital status = marital status (1=married, 0=unmarried); stock ownership = owns publicly traded stock (1=yes, 0=no); and real estate ownership = owns real estate (1=yes, 0=no).
HW = f(SB, Y07, SB*Y07; age, race, gender, education, marital status, stock ownership, real estate ownership) where HW = high wealth (1= greater than $$1.476 in 2007$) all other variables are the same as above.
HI50 = f(SB, Y07, SB*Y07; age, race, gender, education, marital status, stock ownership, real estate ownership) where HI50 = high income (1=top 50% of income earners) all other variables are the same as above. HW50 = f(SB, Y07, SB*Y07; age, race, gender, education, marital status, stock ownership, real estate ownership) where HW50 = high wealth (1=top 50% of wealth holders) all other variables are the same as above.
Log income = f(SB, Y07, SB*Y07; age, race, gender, education, marital status, stock ownership, real estate ownership)

14
Log wealth = f(SB, Y07, SB*Y07; age, race, gender, education, marital status, stock ownership, real estate ownership) Using the first model (high-income logistic regression) as an example, a positive
and significant coefficient on the year variable would indicate that all households have a
higher probability of being classified as high income in 2007 than 1998, ceteris paribus.
A positive and significant coefficient on the small business variable would indicate that
households with a small business owned and operated by a household member would
have a higher probability of being classified as high income than other households
without a small business owned and operated by a household member, ceteris paribus. A
positive and significant coefficient on the interaction term would indicate that households
with small businesses fared better than other households from 1998 to 2007. This same
analysis was conducted for 2001 to 2007 and 2004 to 2007 to test for the robustness of
these results over time.
The second set of regressions utilizes the same dummy variable for the year 2007
and a dummy variable to identify households owning multiple small businesses to
determine whether households owning multiple small businesses fared better from 1998
to 2007 than households owning just one small business. This set of regressions uses
observations for households owning and managing one or more small businesses only.
The variables of interest are the main effects on the dummy variables (year 2007 and
multiple small business ownership) and the interaction term. The second set of models is
specified as follows:
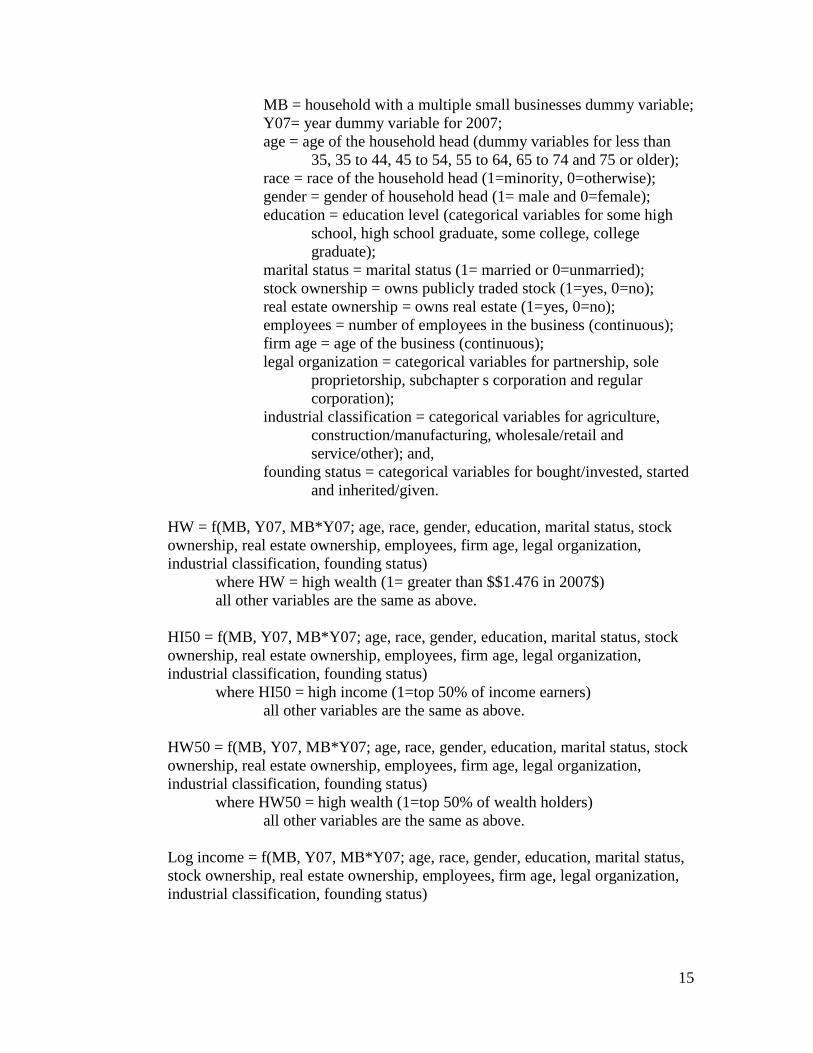
HI = f(MB, Y07, MB*Y07; age, race, gender, education, marital status, stock ownership, real estate ownership, employees, firm age, legal organization, industrial classification, founding status) where HI = high income (1=greater than $73,779 in 2007$)
15
MB = household with a multiple small businesses dummy variable; Y07= year dummy variable for 2007;
age = age of the household head (dummy variables for less than 35, 35 to 44, 45 to 54, 55 to 64, 65 to 74 and 75 or older);
race = race of the household head (1=minority, 0=otherwise); gender = gender of household head (1= male and 0=female); education = education level (categorical variables for some high
school, high school graduate, some college, college graduate);
marital status = marital status (1= married or 0=unmarried); stock ownership = owns publicly traded stock (1=yes, 0=no); real estate ownership = owns real estate (1=yes, 0=no); employees = number of employees in the business (continuous); firm age = age of the business (continuous); legal organization = categorical variables for partnership, sole
proprietorship, subchapter s corporation and regular corporation);
industrial classification = categorical variables for agriculture, construction/manufacturing, wholesale/retail and service/other); and,
founding status = categorical variables for bought/invested, started and inherited/given.
HW = f(MB, Y07, MB*Y07; age, race, gender, education, marital status, stock ownership, real estate ownership, employees, firm age, legal organization, industrial classification, founding status) where HW = high wealth (1= greater than $$1.476 in 2007$) all other variables are the same as above. HI50 = f(MB, Y07, MB*Y07; age, race, gender, education, marital status, stock ownership, real estate ownership, employees, firm age, legal organization, industrial classification, founding status) where HI50 = high income (1=top 50% of income earners) all other variables are the same as above. HW50 = f(MB, Y07, MB*Y07; age, race, gender, education, marital status, stock ownership, real estate ownership, employees, firm age, legal organization, industrial classification, founding status) where HW50 = high wealth (1=top 50% of wealth holders) all other variables are the same as above.
Log income = f(MB, Y07, MB*Y07; age, race, gender, education, marital status, stock ownership, real estate ownership, employees, firm age, legal organization, industrial classification, founding status)
16
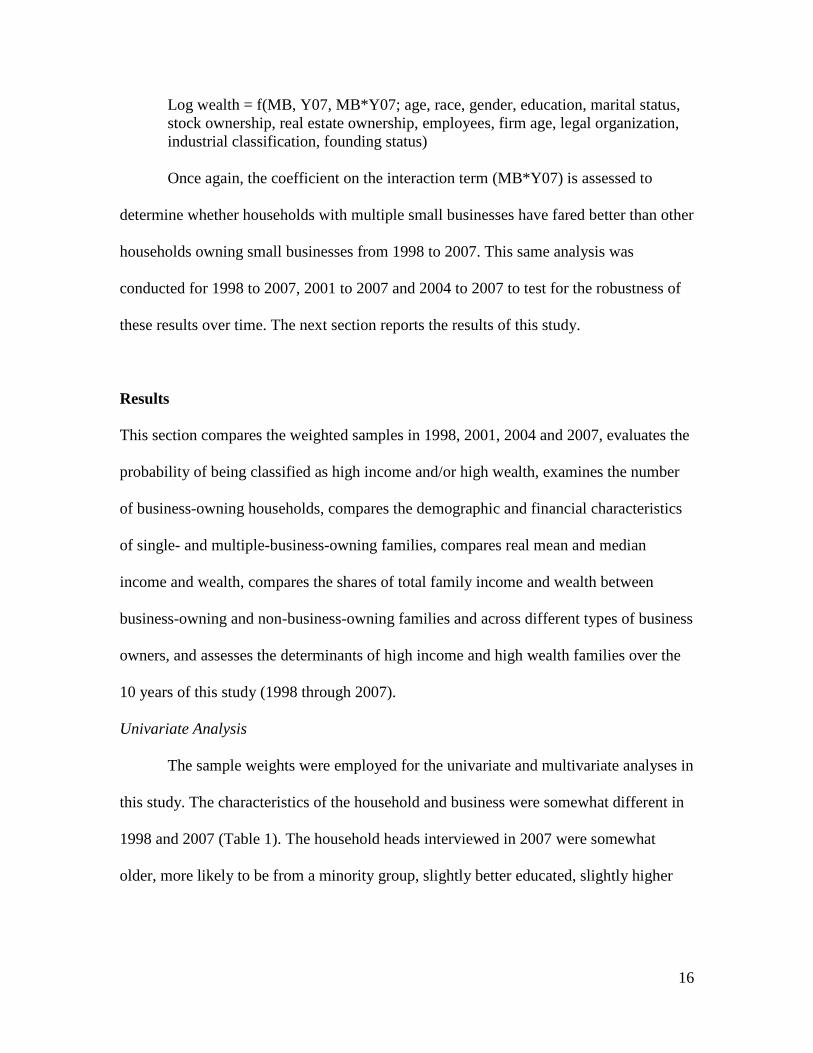
Log wealth = f(MB, Y07, MB*Y07; age, race, gender, education, marital status, stock ownership, real estate ownership, employees, firm age, legal organization, industrial classification, founding status)
Once again, the coefficient on the interaction term (MB*Y07) is assessed to
determine whether households with multiple small businesses have fared better than other
households owning small businesses from 1998 to 2007. This same analysis was
conducted for 1998 to 2007, 2001 to 2007 and 2004 to 2007 to test for the robustness of
these results over time. The next section reports the results of this study.
Results
This section compares the weighted samples in 1998, 2001, 2004 and 2007, evaluates the
probability of being classified as high income and/or high wealth, examines the number
of business-owning households, compares the demographic and financial characteristics
of single- and multiple-business-owning families, compares real mean and median
income and wealth, compares the shares of total family income and wealth between
business-owning and non-business-owning families and across different types of business
owners, and assesses the determinants of high income and high wealth families over the
10 years of this study (1998 through 2007).
Univariate Analysis
The sample weights were employed for the univariate and multivariate analyses in
this study. The characteristics of the household and business were somewhat different in
1998 and 2007 (Table 1). The household heads interviewed in 2007 were somewhat
older, more likely to be from a minority group, slightly better educated, slightly higher

17
Table 1 Sample Characteristics
Characteristics 1998 2001 2004 2007 Age Less than 35 23.3 22.7 22.2 21.7 35 to 44 23.3 * 22.3 * 20.7 19.6 45 to 54 19.2 20.7 20.7 20.8 55 to 64 12.8 * 13.2 * 15.3 * 16.8 65 to 74 11.2 10.7 10.4 10.5 75 or more 10.2 10.3 10.7 10.6
Gender Man 72.1 73.3 71.9 72.3 Woman 27.9 26.7 28.1 27.7
Race Nonwhite or Hispanic 22.2 * 23.7 * 26.4 26.1 White, non-Hispanic 77.8 * 76.3 * 73.6 73.9
Education No high school diploma 16.3 * 15.9 * 14.5 13.5 High school diploma 31.8 31.6 30.7 * 32.9 Some college 18.5 18.4 18.3 18.4 College degree 33.3 34.2 36.5 35.2
Marital Status Married 52.2 53.2 * 50.4 51.0 Not married 47.8 46.8 * 49.6 49.0
Income of household (2007 dollars) Less than $10,000 9.5 * 7.6 * 7.2 6.4 $10,000 to $24,999 19.4 18.1 18.9 19.6 $25,000 to $49,999 27.2 27.0 26.1 26.4 $50,000 to $99,999 28.6 28.7 28.4 28.0 $100,000 or more 15.3 * 18.6 19.3 19.6
Net Worth of Household (2007 Dollars) Less than $50,000 39.5 * 37.7 38.3 36.6 $50,000 to $99,999 11.9 * 11.7 * 11.4 10.2 $100,000 to $249,999 21.2 * 18.8 18.9 18.8 $250,000 to $499,999 14.0 13.9 12.6 * 14.9 $500,000 to $999,999 7.8 * 9.5 9.8 10.5 $1,000,000 or more 5.6 * 8.5 9.0 9.1
Owns Public Stock Yes 15.3 18.6 * 19.3 * 19.6 No 84.7 81.4 * 80.7 * 80.4
Owns Real Estate (>$50,000) Yes 9.5 * 7.6 * 7.2 6.4 No 90.5 * 92.4 * 92.8 93.6

18
Table 1 Sample Characteristics (continued)
Characteristics 1998 2001 2004 2007 Business Owner Yes 12.7 13.7 13.2 13.6 No 87.3 86.3 86.8 86.4
Business Owners Only
Small Business Owner Manager Yes 55.4 53.8 52.4 52.3 No 44.6 46.2 47.6 47.7
Business Age Less than 1 year 4.4 5.7 9.2 * 5.5 1 to 4 years 29.0 22.8 25.2 25.9 5 to 9 years 18.9 17.5 21.0 17.9 10 to 19 years 24.9 23.8 21.3 23.0 20 years or more 22.8 30.2 23.4 27.7
Business Size (including owner) 1 or fewer 42.3 43.7 44.1 44.9 2 to 4 35.0 31.1 32.1 29.8 5 to 9 12.7 12.8 9.7 9.9 10 to 24 4.8 * 6.9 7.1 8.3 25 or more 5.2 5.6 6.9 7.1
Business Size (gross sales) Less than $50,000 54.9 * 49.6 51.9 47.8 $50,000 - $99,999 11.5 10.7 13.6 12.0 $100,000 - $249,999 10.3 12.2 9.7 13.1 $250,000 - $499,999 8.4 9.4 8.3 7.7 $500,000 - $999,999 6.7 6.7 3.9 6.0 $1,000,000 or more 8.1 * 11.5 12.6 13.3
Legal Organization Partnership 24.1 * 24.0 * 28.1 * 34.2 Sole proprietorship 51.1 * 49.3 48.3 44.2 Subchapter S corporation 13.0 15.7 14.2 14.1 Subchapter C corporation 11.8 11.0 * 9.3 7.4
Business Industrial Classification Agriculturally related 10.0 13.4 9.6 10.3 Mining/construction/manufacturing 24.4 19.4 23.6 23.9 Wholesale, retail 16.2 11.8 17.8 13.7 Services and other 49.4 55.3 49.0 52.1
Founding Status Bought or invested 20.9 * 18.3 16.2 16.2 Started 66.1 68.3 71.6 * 65.5 Inherited/given/other 12.9 * 13.5 * 12.2 * 18.3 Number of Observations, all 4,305 4,442 4,519 4,418Number of Observations, business only ho 1,277 1,354 1,385 1,417

19
income earners, slightly higher wealth holders, and more likely to own real estate than
household heads in 1998.
The businesses operated by members of the household were quite similar in 1998
and 2007. Businesses were somewhat larger, more likely to be organized as partnerships
and less likely to be organized as sole proprietorships, and less likely to have been
purchased (bought or invested in) businesses and more likely to have been inherited
businesses in 2007 than in 1998.
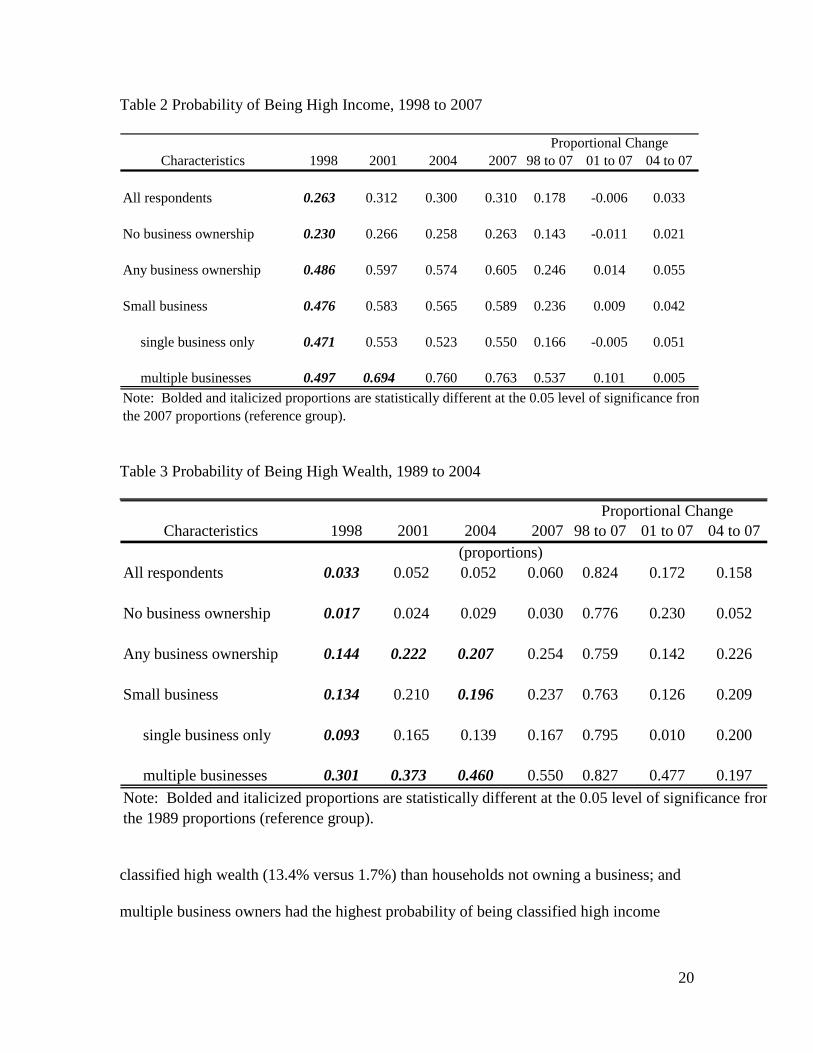
All respondents were significantly more likely to be high income earners in 2007
than 1998 with 26.3% of households being high income in 1998 and 31.0% of households
being high income in 2007 (Table 2). Families owning any businesses were significantly
more likely to be high income earners in 2007 than 1998. Just under 48% of small
business owners were classified as high income in 1998, while nearly 59% of small
business owners were classified as high income by 2007. The largest percentage gain in
the likelihood of being high income (53.7%) from 1998 to 2007 was achieved by small
business owners with more than one business.
The wealth picture was very similar, with all households realizing a significant
increase in the likelihood of being classified as high wealth. Small-business-owning
households realized an increase in the likelihood being classified as high wealth from
13.4% in 1998 to 23.7% in 2007 (Table 3). Again, the largest percentage gain in the
likelihood of being high wealth (82.7%) from 1998 to 2007 was achieved by small
business owners with more than one business.
In 1998, small-business-owning households were over two times more likely to be
classified as high income (47.6% versus 23.0%) and about eight times more likely to be
20
Table 2 Probability of Being High Income, 1998 to 2007
Characteristics 1998 2001 2004 2007 98 to 07 01 to 07 04 to 07
All respondents 0.263 0.312 0.300 0.310 0.178 -0.006 0.033
No business ownership 0.230 0.266 0.258 0.263 0.143 -0.011 0.021
Any business ownership 0.486 0.597 0.574 0.605 0.246 0.014 0.055
Small business 0.476 0.583 0.565 0.589 0.236 0.009 0.042
single business only 0.471 0.553 0.523 0.550 0.166 -0.005 0.051
multiple businesses 0.497 0.694 0.760 0.763 0.537 0.101 0.005Note: Bolded and italicized proportions are statistically different at the 0.05 level of significance fromthe 2007 proportions (reference group).
Proportional Change
Table 3 Probability of Being High Wealth, 1989 to 2004
Characteristics 1998 2001 2004 2007 98 to 07 01 to 07 04 to 07
All respondents 0.033 0.052 0.052 0.060 0.824 0.172 0.158
No business ownership 0.017 0.024 0.029 0.030 0.776 0.230 0.052
Any business ownership 0.144 0.222 0.207 0.254 0.759 0.142 0.226
Small business 0.134 0.210 0.196 0.237 0.763 0.126 0.209
single business only 0.093 0.165 0.139 0.167 0.795 0.010 0.200
multiple businesses 0.301 0.373 0.460 0.550 0.827 0.477 0.197Note: Bolded and italicized proportions are statistically different at the 0.05 level of significance fromthe 1989 proportions (reference group).
(proportions)
Proportional Change
classified high wealth (13.4% versus 1.7%) than households not owning a business; and
multiple business owners had the highest probability of being classified high income

21
(49.7%) and high wealth (30.1%) of the small business owners. In 2007, a household
owning any small business had nearly a 59% chance of being classified high income and
more than a 23% chance of being classified as high wealth. By 2007 the income gap
between households with and without small businesses had widened slightly and the
wealth gap had remained about the same. Small-business-owning households were now
just over two times more likely to be classified high income (58.9% versus 26.3%) and
nearly eight times more likely to be classified as high wealth (23.7% versus 3.0%).
Multiple business owners still appeared to be the most prosperous small business group,
with over three-fourths of them high income and over one-half classified as high wealth.
From 1998 to 2007 the likelihood of being high income and high wealth increased
for all groups. More recently (from 2004 to 2007), households owning a small business
have done much better than other households. Households owning a small business
realized a 4.2% increase in the likelihood of being high income and more than 20%
increase in the likelihood of being high wealth, while households with no business
ownership realized increases of 2.1% and 5.2% in the likelihood being high income and
high wealth, respectively. Given this relatively positive increase in the likelihood of being
a high income earner or high wealth holder one would expect the percentage of small-
business-owning households to increase. Interestingly, the percentage of households with
small businesses increased slightly from 11.7% of all households in 1998 (about 12
million small businesses and 102.5 million households) to nearly 12.4% of all households
in 2007 (14.3 million small businesses and 116.1 million households).
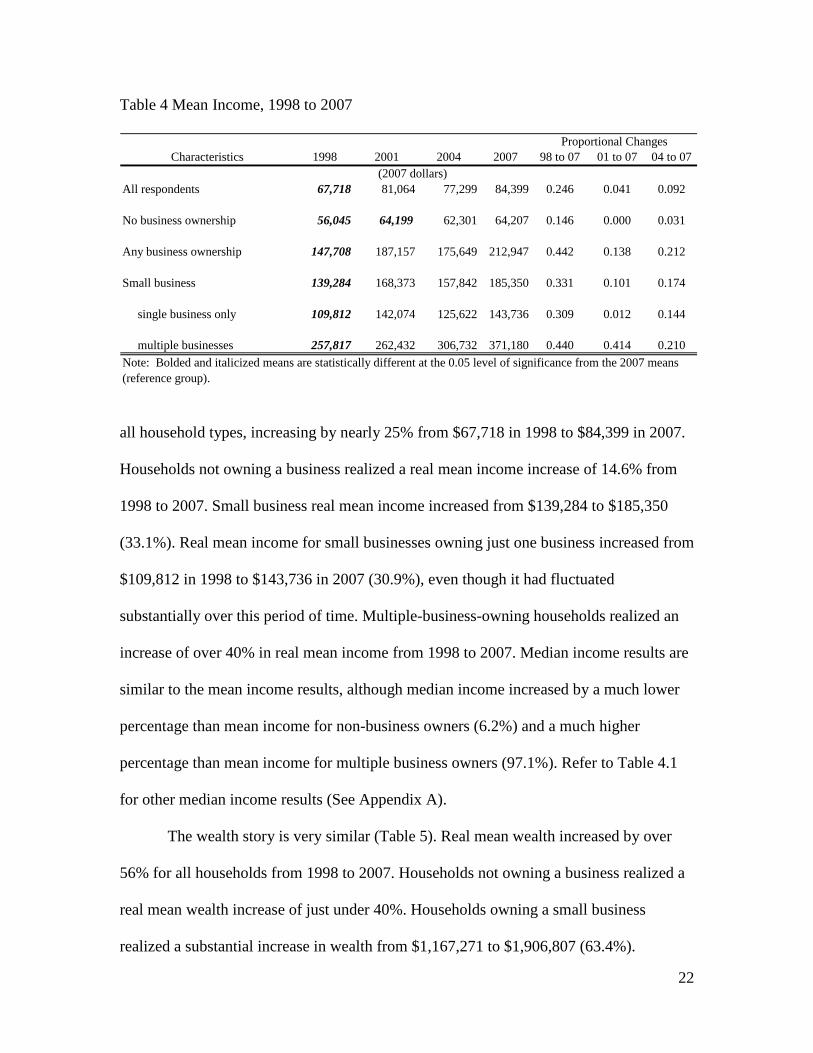
Table 4 compares mean household income for all households and those owning at
least one business. Real mean income was significantly higher in 2007 than in 1998 for
22
Table 4 Mean Income, 1998 to 2007
Characteristics 1998 2001 2004 2007 98 to 07 01 to 07 04 to 07
All respondents 67,718 81,064 77,299 84,399 0.246 0.041 0.092
No business ownership 56,045 64,199 62,301 64,207 0.146 0.000 0.031
Any business ownership 147,708 187,157 175,649 212,947 0.442 0.138 0.212
Small business 139,284 168,373 157,842 185,350 0.331 0.101 0.174
single business only 109,812 142,074 125,622 143,736 0.309 0.012 0.144
multiple businesses 257,817 262,432 306,732 371,180 0.440 0.414 0.210Note: Bolded and italicized means are statistically different at the 0.05 level of significance from the 2007 means(reference group).
Proportional Changes
(2007 dollars)
all household types, increasing by nearly 25% from $67,718 in 1998 to $84,399 in 2007.
Households not owning a business realized a real mean income increase of 14.6% from
1998 to 2007. Small business real mean income increased from $139,284 to $185,350
(33.1%). Real mean income for small businesses owning just one business increased from
$109,812 in 1998 to $143,736 in 2007 (30.9%), even though it had fluctuated
substantially over this period of time. Multiple-business-owning households realized an
increase of over 40% in real mean income from 1998 to 2007. Median income results are
similar to the mean income results, although median income increased by a much lower
percentage than mean income for non-business owners (6.2%) and a much higher
percentage than mean income for multiple business owners (97.1%). Refer to Table 4.1
for other median income results (See Appendix A).
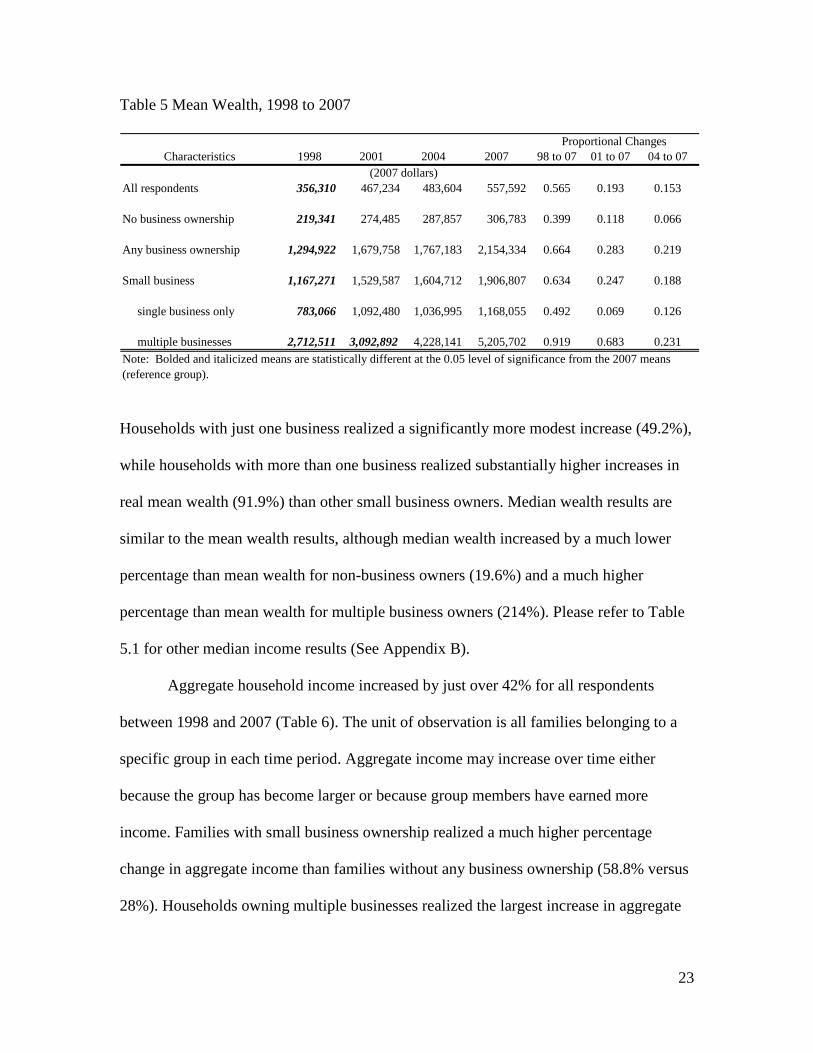
The wealth story is very similar (Table 5). Real mean wealth increased by over
56% for all households from 1998 to 2007. Households not owning a business realized a
real mean wealth increase of just under 40%. Households owning a small business
realized a substantial increase in wealth from $1,167,271 to $1,906,807 (63.4%).
23
Table 5 Mean Wealth, 1998 to 2007
Characteristics 1998 2001 2004 2007 98 to 07 01 to 07 04 to 07
All respondents 356,310 467,234 483,604 557,592 0.565 0.193 0.153
No business ownership 219,341 274,485 287,857 306,783 0.399 0.118 0.066
Any business ownership 1,294,922 1,679,758 1,767,183 2,154,334 0.664 0.283 0.219
Small business 1,167,271 1,529,587 1,604,712 1,906,807 0.634 0.247 0.188
single business only 783,066 1,092,480 1,036,995 1,168,055 0.492 0.069 0.126
multiple businesses 2,712,511 3,092,892 4,228,141 5,205,702 0.919 0.683 0.231Note: Bolded and italicized means are statistically different at the 0.05 level of significance from the 2007 means(reference group).
Proportional Changes
(2007 dollars)
Households with just one business realized a significantly more modest increase (49.2%),
while households with more than one business realized substantially higher increases in
real mean wealth (91.9%) than other small business owners. Median wealth results are
similar to the mean wealth results, although median wealth increased by a much lower
percentage than mean wealth for non-business owners (19.6%) and a much higher
percentage than mean wealth for multiple business owners (214%). Please refer to Table
5.1 for other median income results (See Appendix B).
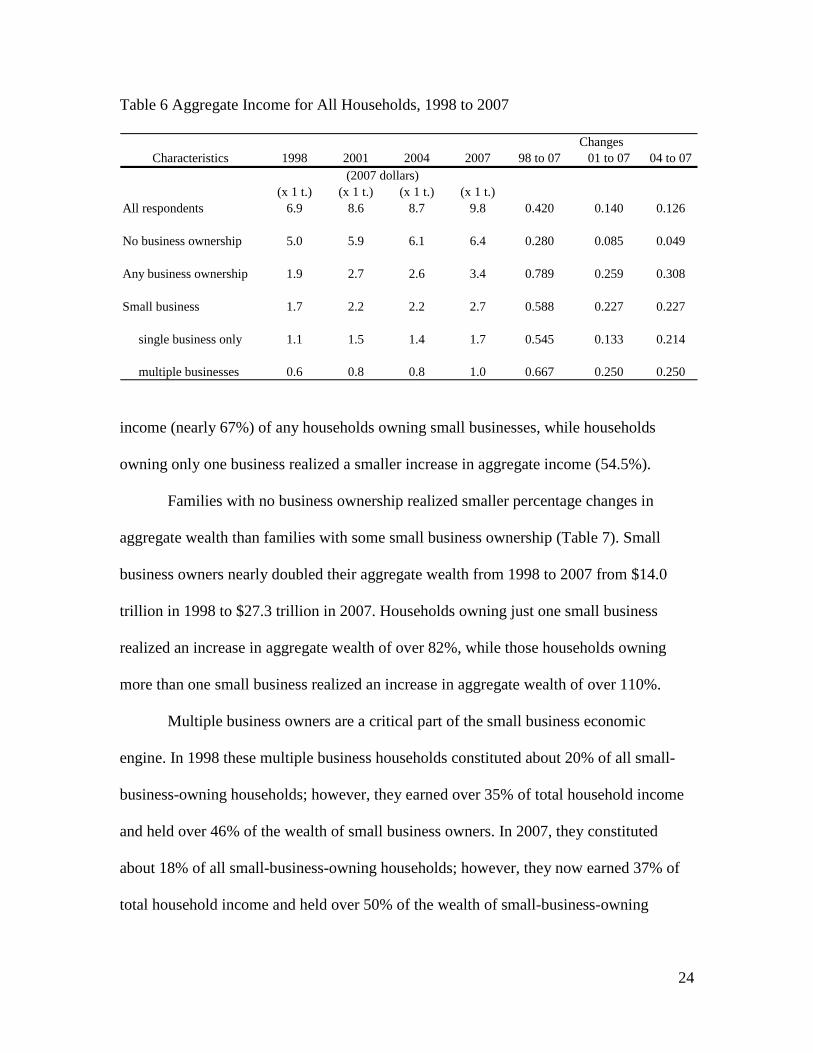
Aggregate household income increased by just over 42% for all respondents
between 1998 and 2007 (Table 6). The unit of observation is all families belonging to a
specific group in each time period. Aggregate income may increase over time either
because the group has become larger or because group members have earned more
income. Families with small business ownership realized a much higher percentage
change in aggregate income than families without any business ownership (58.8% versus
28%). Households owning multiple businesses realized the largest increase in aggregate
24
Table 6 Aggregate Income for All Households, 1998 to 2007
Characteristics 1998 2001 2004 2007 98 to 07 01 to 07 04 to 07
(x 1 t.) (x 1 t.) (x 1 t.) (x 1 t.)All respondents 6.9 8.6 8.7 9.8 0.420 0.140 0.126
No business ownership 5.0 5.9 6.1 6.4 0.280 0.085 0.049
Any business ownership 1.9 2.7 2.6 3.4 0.789 0.259 0.308
Small business 1.7 2.2 2.2 2.7 0.588 0.227 0.227
single business only 1.1 1.5 1.4 1.7 0.545 0.133 0.214
multiple businesses 0.6 0.8 0.8 1.0 0.667 0.250 0.250
Changes
(2007 dollars)
income (nearly 67%) of any households owning small businesses, while households
owning only one business realized a smaller increase in aggregate income (54.5%).
Families with no business ownership realized smaller percentage changes in
aggregate wealth than families with some small business ownership (Table 7). Small
business owners nearly doubled their aggregate wealth from 1998 to 2007 from $14.0
trillion in 1998 to $27.3 trillion in 2007. Households owning just one small business
realized an increase in aggregate wealth of over 82%, while those households owning
more than one small business realized an increase in aggregate wealth of over 110%.
Multiple business owners are a critical part of the small business economic
engine. In 1998 these multiple business households constituted about 20% of all small-
business-owning households; however, they earned over 35% of total household income
and held over 46% of the wealth of small business owners. In 2007, they constituted
about 18% of all small-business-owning households; however, they now earned 37% of
total household income and held over 50% of the wealth of small-business-owning

25
Table 7 Aggregate Wealth for All Households, 1998 to 2007
Characteristics 1998 2001 2004 2007 98 to 07 01 to 07 04 to 07
(x 1 t.) (x 1 t.) (x 1 t.) (x 1 t.)All respondents 36.5 49.8 54.2 64.7 0.773 0.299 0.194
No business ownership 19.6 25.2 28.0 30.8 0.571 0.222 0.100
Any business ownership 16.9 24.5 26.2 34.0 1.012 0.388 0.298
Small business 14.0 20.2 22.1 27.3 0.950 0.351 0.235
single business only 7.5 11.3 11.7 13.7 0.827 0.212 0.171
multiple businesses 6.5 8.9 10.3 13.7 1.108 0.539 0.330
Changes
(2007 dollars)
households. It appears that households owning multiple small businesses are becoming
more significant contributors to aggregate household income and wealth.
Multivariate Analysis
Tables 8, 9 and 10 examine the determinants of high income and high wealth for all
households from 1998 to 2007, 2001 to 2007 and 2004 to 2007, respectively. The six
models reported in these tables examine how households owning and managing small
businesses fared in relation to other households from 1998 to 2007. Households owning
small businesses have a higher probability of being high income and high wealth; a
higher probability of being in the top 50% of income and wealth; and have higher log
income and log wealth than other households (Table 8). In general, households have a
higher probability of being high income and high wealth; have a lower probability of
being in the top 50% of income and wealth; and have higher log income in 2007 than
1998. The interaction term was nearly statistically significant in just the high income

26
Table 8 Determinants of Being a High Income and High Wealth Among All Households, 1998 – 2007
Parameter Parameter Parameter Parameter Parameter ParameterCharacteristics Estimate p-value Estimate p-value Estimate p-value Estimate p-value Estimate p-value Estimate p-value
Constant -2.4823 0.0001 -8.8639 0.0001 -0.1998 0.0797 -4.8245 0.0001 10.2250 0.0001 5.2556 0.0001
Small business owner manager 0.2915 0.0116 1.5252 0.0001 0.4061 0.0016 1.3991 0.0001 0.1571 0.0067 1.2159 0.0001Year dummy, 1998 0.2468 0.0002 0.5880 0.0001 -0.1591 0.0059 -0.2432 0.0002 0.2021 0.0001 0.0849 0.1820Interaction: small business and 1998 0.3088 0.0543 0.2349 0.3396 0.2401 0.1809 0.0508 0.8129 -0.0236 0.7606 0.0437 0.8109
Age of owner manager -0.0145 0.0001 0.0415 0.0001 -0.0226 0.0001 0.0566 0.0001 -0.0047 0.0001 0.0479 0.0001Gender - man 0.8545 0.0001 0.7792 0.0010 0.9393 0.0001 0.4933 0.0001 0.3532 0.0001 0.6607 0.0001Race - minority -0.2665 0.0008 -0.6368 0.0030 -0.2325 0.0005 -0.3856 0.0001 -0.1872 0.0001 -0.4086 0.0001Education - no high school diploma -2.3248 0.0001 -2.0574 0.0001 -2.1554 0.0001 -1.5662 0.0001 -0.8971 0.0001 -1.1975 0.0001Education - high school diploma -1.4881 0.0001 -1.8023 0.0001 -1.2911 0.0001 -1.0151 0.0001 -0.5396 0.0001 -0.3802 0.0001Education - some college -0.8646 0.0001 -1.2767 0.0001 -0.8476 0.0001 -0.6798 0.0001 -0.4001 0.0001 -0.5183 0.0001Marital status - married 1.1338 0.0001 0.0879 0.6064 0.8270 0.0001 0.2807 0.0008 0.4175 0.0001 0.2186 0.0062Owns Stocks 0.7961 0.0001 1.3654 0.0001 0.8215 0.0001 1.2522 0.0001 0.3372 0.0001 1.0769 0.0001Owns Real Estate (>$50,000) 1.8253 0.0001 2.6633 0.0001 1.5846 0.0001 2.9262 0.0001 0.5798 0.0001 3.6049 0.0001McFadden R-squared 0.3288 0.3512 0.3160 0.4547 0.2791 0.4699
Logistic RegressionLog Income Log Wealth
All Households, 1998 - 2007Logistic Regression
High Income Proba bility High Wealth Proba bilityLogistic Regression
Highest 50% Income Highest 50% Wealth

27
probability equation. The positive coefficient on the interaction term indicates that
households owning small businesses in 2007 had a higher probability of being high
income than other households in 1998 and 2007. In other words, households owning
small businesses appear to have fared better than other households in increasing their
probability of being high income over this period of time. The other income and wealth
regressions would suggest that households owning small businesses in 2007 fared about
the same as other households from 1998 to 2007. In general, it appears that households
owning small businesses increased their income and wealth at the about the same rate as
other households.
A similar analysis using the data from 2001 to 2007 does not support all the
results found in 1998 to 2007 (Table 9). Households owning small businesses have a
higher probability of being high income and high wealth, a higher probability of being in
the highest 50% of income and wealth categories, and higher log income and wealth than
other households. However, households only have a higher probability of being high
wealth in 2007 than in 2001. The interaction term is not statistically significant in any of
these regressions. Therefore, these income and wealth regressions suggest that
households owning small businesses in 2007 fared about the same as other households
from 2001 to 2007.
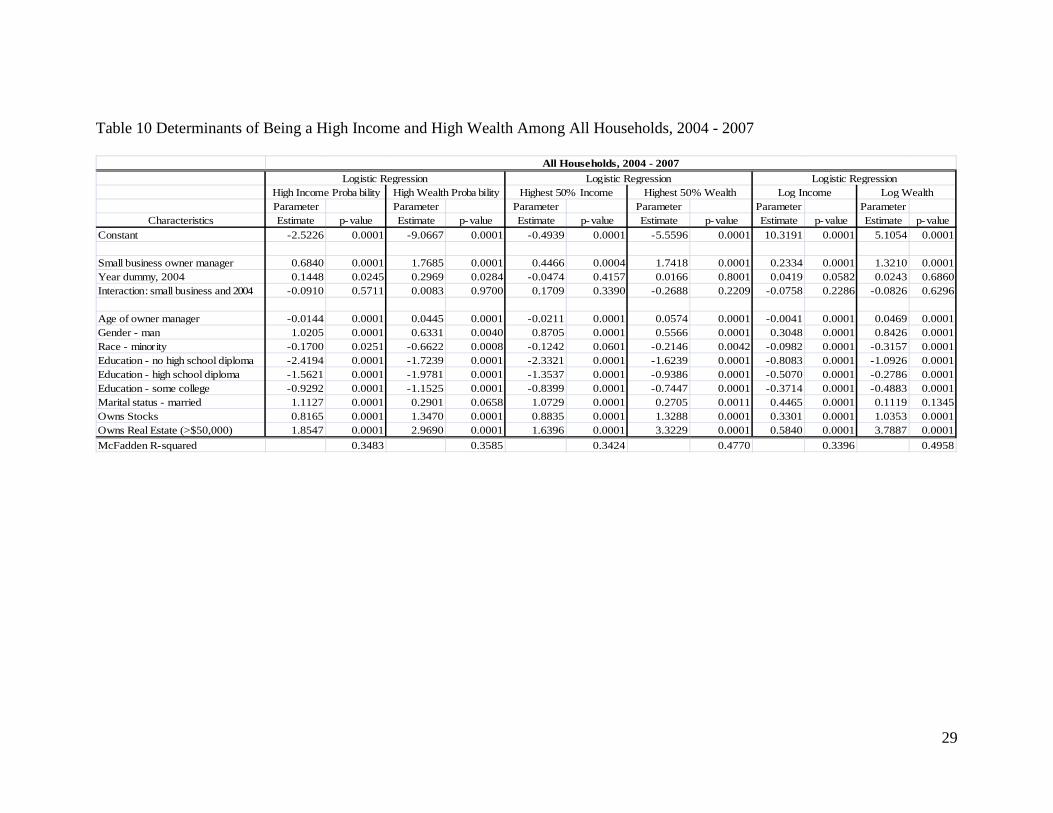
A similar analysis using the data from 2004 to 2007 generally supports the results
found in 2001 to 2007 (Table 10). Households owning small businesses have a higher
probability of being high income and high wealth, a higher probability of being in the
highest 50% of income and wealth categories, and higher log income and wealth than
other households. Households have a higher probability of being high income and wealth

28
Table 9 Determinants of Being a High Income and High Wealth Among All Households, 2001 - 2007
Parameter Parameter Parameter Parameter Parameter ParameterCharacteristics Estimate p-value Estimate p-value Estimate p-value Estimate p-value Estimate p-value Estimate p-value
Constant -2.0631 0.0001 -8.2564 0.0001 -0.3999 0.0006 -4.8031 0.0001 10.4280 0.0001 5.5671 0.0001
Small business owner manager 0.5174 0.0001 1.9317 0.0001 0.3350 0.0071 1.8451 0.0001 0.2717 0.0001 1.2704 0.0001Year dummy, 1998 0.0248 0.6968 0.3714 0.0083 -0.0293 0.6147 -0.0883 0.1758 0.0379 0.0838 -0.0508 0.4095Interaction: small business and 1998 0.0843 0.5940 -0.1318 0.5507 0.2964 0.0940 -0.4043 0.0718 -0.1142 0.0662 -0.0489 0.7794
Age of owner manager -0.0192 0.0001 0.0462 0.0001 -0.0236 0.0001 0.0539 0.0001 -0.0058 0.0001 0.0470 0.0001Gender - man 0.8689 0.0001 0.4387 0.0551 0.9811 0.0001 0.3498 0.0002 0.2988 0.0001 0.5946 0.0001Race - minority -0.2235 0.0034 -0.7752 0.0002 -0.1643 0.0144 -0.4051 0.0001 -0.1187 0.0001 -0.5087 0.0001Education - no high school diploma -2.0861 0.0001 -2.1018 0.0001 -2.2759 0.0001 -1.6886 0.0001 -0.8355 0.0001 -1.4242 0.0001Education - high school diploma -1.4426 0.0001 -1.8630 0.0001 -1.2875 0.0001 -1.0324 0.0001 -0.5011 0.0001 -0.4984 0.0001Education - some college -0.8302 0.0001 -1.2142 0.0001 -0.7871 0.0001 -0.6880 0.0001 -0.3315 0.0001 -0.5391 0.0001Marital status - married 1.0639 0.0001 0.3530 0.0361 0.8686 0.0001 0.3494 0.0001 0.3993 0.0001 0.3630 0.0001Owns Stocks 0.8065 0.0001 1.3991 0.0001 0.7722 0.0001 1.2486 0.0001 0.3631 0.0001 0.9477 0.0001Owns Real Estate (>$50,000) 1.8557 0.0001 2.0747 0.0001 1.6666 0.0001 2.9906 0.0001 0.5949 0.0001 3.5630 0.0001McFadden R-squared 0.3323 0.3606 0.3322 0.4639 0.3517 0.4874
Logistic RegressionLog Income Log Wealth
All Households, 2001 - 2007Logistic Regression
High Income Proba bility High Wealth Proba bilityLogistic Regression
Highest 50% Income Highest 50% Wealth
29
Table 10 Determinants of Being a High Income and High Wealth Among All Households, 2004 - 2007
Parameter Parameter Parameter Parameter Parameter ParameterCharacteristics Estimate p-value Estimate p-value Estimate p-value Estimate p-value Estimate p-value Estimate p-value
Constant -2.5226 0.0001 -9.0667 0.0001 -0.4939 0.0001 -5.5596 0.0001 10.3191 0.0001 5.1054 0.0001
Small business owner manager 0.6840 0.0001 1.7685 0.0001 0.4466 0.0004 1.7418 0.0001 0.2334 0.0001 1.3210 0.0001Year dummy, 2004 0.1448 0.0245 0.2969 0.0284 -0.0474 0.4157 0.0166 0.8001 0.0419 0.0582 0.0243 0.6860Interaction: small business and 2004 -0.0910 0.5711 0.0083 0.9700 0.1709 0.3390 -0.2688 0.2209 -0.0758 0.2286 -0.0826 0.6296
Age of owner manager -0.0144 0.0001 0.0445 0.0001 -0.0211 0.0001 0.0574 0.0001 -0.0041 0.0001 0.0469 0.0001Gender - man 1.0205 0.0001 0.6331 0.0040 0.8705 0.0001 0.5566 0.0001 0.3048 0.0001 0.8426 0.0001Race - minority -0.1700 0.0251 -0.6622 0.0008 -0.1242 0.0601 -0.2146 0.0042 -0.0982 0.0001 -0.3157 0.0001Education - no high school diploma -2.4194 0.0001 -1.7239 0.0001 -2.3321 0.0001 -1.6239 0.0001 -0.8083 0.0001 -1.0926 0.0001Education - high school diploma -1.5621 0.0001 -1.9781 0.0001 -1.3537 0.0001 -0.9386 0.0001 -0.5070 0.0001 -0.2786 0.0001Education - some college -0.9292 0.0001 -1.1525 0.0001 -0.8399 0.0001 -0.7447 0.0001 -0.3714 0.0001 -0.4883 0.0001Marital status - married 1.1127 0.0001 0.2901 0.0658 1.0729 0.0001 0.2705 0.0011 0.4465 0.0001 0.1119 0.1345Owns Stocks 0.8165 0.0001 1.3470 0.0001 0.8835 0.0001 1.3288 0.0001 0.3301 0.0001 1.0353 0.0001Owns Real Estate (>$50,000) 1.8547 0.0001 2.9690 0.0001 1.6396 0.0001 3.3229 0.0001 0.5840 0.0001 3.7887 0.0001McFadden R-squared 0.3483 0.3585 0.3424 0.4770 0.3396 0.4958
Logistic RegressionLog Income Log Wealth
All Households, 2004 - 2007Logistic Regression
High Income Proba bility High Wealth Proba bilityLogistic Regression
Highest 50% Income Highest 50% Wealth
30
in 2007 than in 2004. Once again, the interaction term is not statistically significant in
any of these regressions. Therefore, these income and wealth regressions suggest that
households owning small businesses in 2007 fared about the same as other households
from 2004 to 2007.
The control variables were quite interesting in this regression analysis. High
income households are headed by younger people, while higher wealth households are
headed by older people. Higher income households are more likely to be headed by men,
the owners are well educated and they are married. In addition, high income and high
wealth households are more likely to own public stock and real estate.
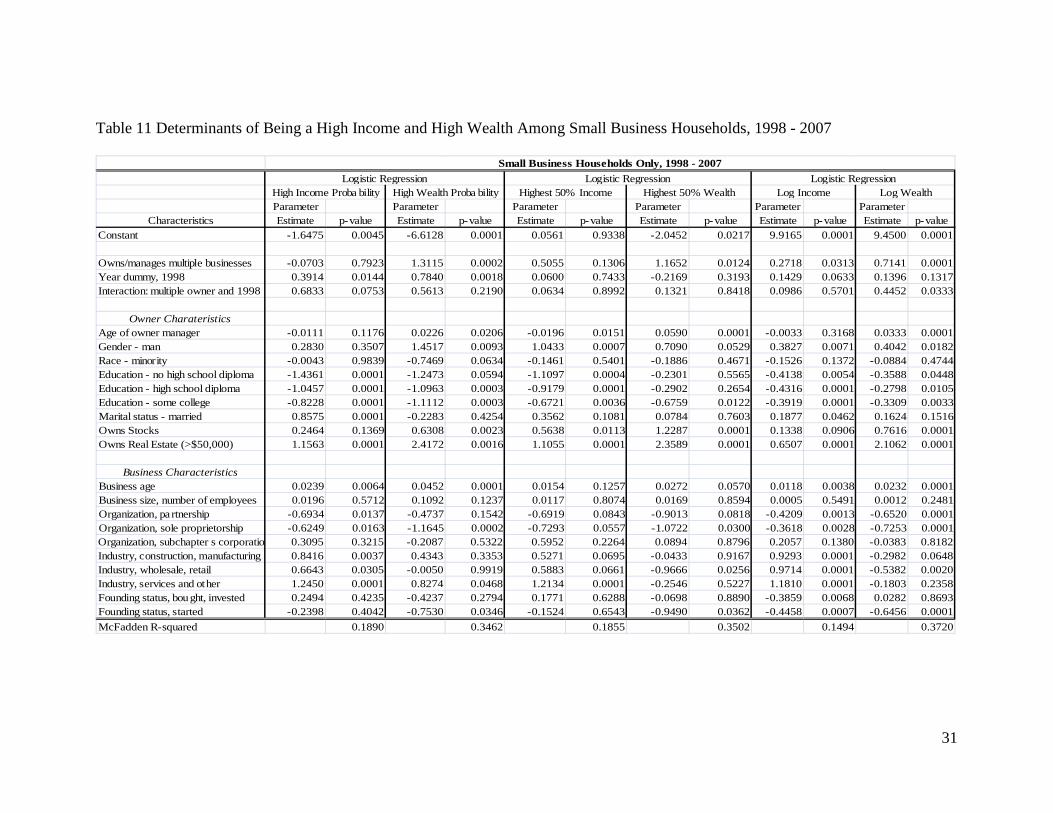
Tables 11, 12 and 13 utilize information on households with small business owners to
assess how multiple and single business owners fared from 1998 to 2007, 2001 to 2007
and 2004 to 2007, respectively. Households owning multiple businesses had a higher
probability of being high wealth, a higher probability of being in the highest 50% wealth
bracket and higher log income and wealth than other households owning small businesses
(Table 11). Households owning small businesses had a higher probability of being high
income and high wealth than other households in 2007 than in 1998. These households
owning multiple businesses held more wealth than other small businesses.
The interaction term was insignificant in all cases, except the log wealth equation.
In the log wealth equation, the positive coefficient on the interaction term indicates that
households owning multiple small businesses in 2007 had a higher probability of being
high wealth than other households owning just one small business in 1998 and 2007. In
other words, households owning multiple small businesses appear to have fared better
than other households owning just one small business in increasing their wealth over this
31
Table 11 Determinants of Being a High Income and High Wealth Among Small Business Households, 1998 - 2007
Parameter Parameter Parameter Parameter Parameter ParameterCharacteristics Estimate p-value Estimate p-value Estimate p-value Estimate p-value Estimate p-value Estimate p-value
Constant -1.6475 0.0045 -6.6128 0.0001 0.0561 0.9338 -2.0452 0.0217 9.9165 0.0001 9.4500 0.0001
Owns/manages multiple businesses -0.0703 0.7923 1.3115 0.0002 0.5055 0.1306 1.1652 0.0124 0.2718 0.0313 0.7141 0.0001Year dummy, 1998 0.3914 0.0144 0.7840 0.0018 0.0600 0.7433 -0.2169 0.3193 0.1429 0.0633 0.1396 0.1317Interaction: multiple owner and 1998 0.6833 0.0753 0.5613 0.2190 0.0634 0.8992 0.1321 0.8418 0.0986 0.5701 0.4452 0.0333
Owner CharateristicsAge of owner manager -0.0111 0.1176 0.0226 0.0206 -0.0196 0.0151 0.0590 0.0001 -0.0033 0.3168 0.0333 0.0001Gender - man 0.2830 0.3507 1.4517 0.0093 1.0433 0.0007 0.7090 0.0529 0.3827 0.0071 0.4042 0.0182Race - minority -0.0043 0.9839 -0.7469 0.0634 -0.1461 0.5401 -0.1886 0.4671 -0.1526 0.1372 -0.0884 0.4744Education - no high school diploma -1.4361 0.0001 -1.2473 0.0594 -1.1097 0.0004 -0.2301 0.5565 -0.4138 0.0054 -0.3588 0.0448Education - high school diploma -1.0457 0.0001 -1.0963 0.0003 -0.9179 0.0001 -0.2902 0.2654 -0.4316 0.0001 -0.2798 0.0105Education - some college -0.8228 0.0001 -1.1112 0.0003 -0.6721 0.0036 -0.6759 0.0122 -0.3919 0.0001 -0.3309 0.0033Marital status - married 0.8575 0.0001 -0.2283 0.4254 0.3562 0.1081 0.0784 0.7603 0.1877 0.0462 0.1624 0.1516Owns Stocks 0.2464 0.1369 0.6308 0.0023 0.5638 0.0113 1.2287 0.0001 0.1338 0.0906 0.7616 0.0001Owns Real Estate (>$50,000) 1.1563 0.0001 2.4172 0.0016 1.1055 0.0001 2.3589 0.0001 0.6507 0.0001 2.1062 0.0001
Business CharacteristicsBusiness age 0.0239 0.0064 0.0452 0.0001 0.0154 0.1257 0.0272 0.0570 0.0118 0.0038 0.0232 0.0001Business size, number of employees 0.0196 0.5712 0.1092 0.1237 0.0117 0.8074 0.0169 0.8594 0.0005 0.5491 0.0012 0.2481Organization, pa rtnership -0.6934 0.0137 -0.4737 0.1542 -0.6919 0.0843 -0.9013 0.0818 -0.4209 0.0013 -0.6520 0.0001Organization, sole proprietorship -0.6249 0.0163 -1.1645 0.0002 -0.7293 0.0557 -1.0722 0.0300 -0.3618 0.0028 -0.7253 0.0001Organization, subchapter s corporation 0.3095 0.3215 -0.2087 0.5322 0.5952 0.2264 0.0894 0.8796 0.2057 0.1380 -0.0383 0.8182Industry, construction, manufacturing 0.8416 0.0037 0.4343 0.3353 0.5271 0.0695 -0.0433 0.9167 0.9293 0.0001 -0.2982 0.0648Industry, wholesale, retail 0.6643 0.0305 -0.0050 0.9919 0.5883 0.0661 -0.9666 0.0256 0.9714 0.0001 -0.5382 0.0020Industry, services and other 1.2450 0.0001 0.8274 0.0468 1.2134 0.0001 -0.2546 0.5227 1.1810 0.0001 -0.1803 0.2358Founding status, bought, invested 0.2494 0.4235 -0.4237 0.2794 0.1771 0.6288 -0.0698 0.8890 -0.3859 0.0068 0.0282 0.8693Founding status, started -0.2398 0.4042 -0.7530 0.0346 -0.1524 0.6543 -0.9490 0.0362 -0.4458 0.0007 -0.6456 0.0001McFadden R-squared 0.1890 0.3462 0.1855 0.3502 0.1494 0.3720
Logistic RegressionLog Income Log Wealth
Small Business Households Only, 1998 - 2007Logistic Regression
High Income Proba bility High Wealth Proba bilityLogistic Regression
Highest 50% Income Highest 50% Wealth

32
period of time. The main effect term for the year dummy 1998 was significant at the 13%
level of significance. Therefore, this result should be viewed with caution.
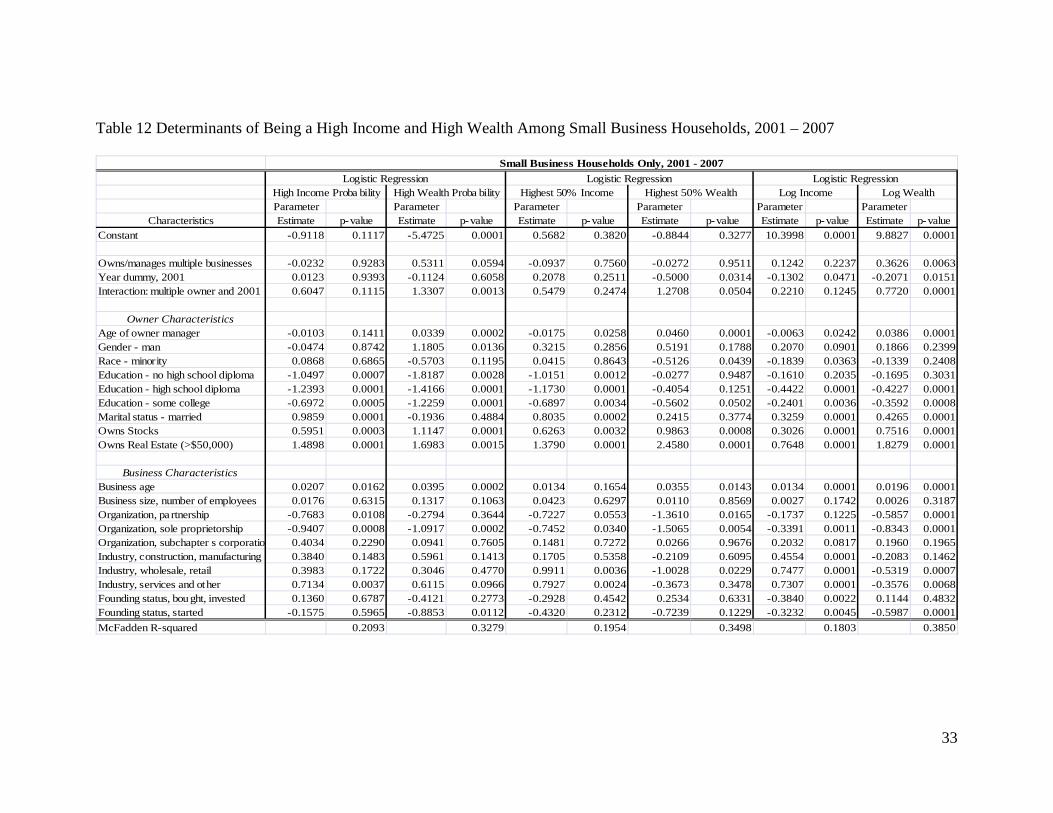
Similar results were found in analyzing the 2001 to 2007 information (Table 12).
These households owning multiple small businesses had more wealth than households
owning just one small business. Households owning small businesses had a lower
probability of being in the highest 50% wealth bracket and had lower wealth in 2007 than
in 2001. The interaction term was significant in the log wealth equation suggesting that
households owning multiple small businesses appear to have fared better than other
households owning just one small business in increasing their wealth over this period of
time.
Similar results were found in analyzing the 2004 to 2007 information (Table 13).
Households owning multiple small businesses were more likely to be high wealth, to be
in the highest 50% wealth bracket and to have more wealth than households owning just
one small business. Households owning small businesses had somewhat lower mean log
income and wealth in 2007 than in 2004. The interaction term is not statistically
significant in any of these regressions. Therefore, these income and wealth regressions
suggest that households owning multiple small businesses in 2007 fared about the same
as households owning just one small business from 2004 to 2007. Equity (fairness)
considerations are important in assessing any subset of households. Over 47% of all
income earned by households was earned by those in the top 10 %, while over 53% of all
income earned by households owning a small business was earned by those in the top
33
Table 12 Determinants of Being a High Income and High Wealth Among Small Business Households, 2001 – 2007
Parameter Parameter Parameter Parameter Parameter ParameterCharacteristics Estimate p-value Estimate p-value Estimate p-value Estimate p-value Estimate p-value Estimate p-value
Constant -0.9118 0.1117 -5.4725 0.0001 0.5682 0.3820 -0.8844 0.3277 10.3998 0.0001 9.8827 0.0001
Owns/manages multiple businesses -0.0232 0.9283 0.5311 0.0594 -0.0937 0.7560 -0.0272 0.9511 0.1242 0.2237 0.3626 0.0063Year dummy, 2001 0.0123 0.9393 -0.1124 0.6058 0.2078 0.2511 -0.5000 0.0314 -0.1302 0.0471 -0.2071 0.0151Interaction: multiple owner and 2001 0.6047 0.1115 1.3307 0.0013 0.5479 0.2474 1.2708 0.0504 0.2210 0.1245 0.7720 0.0001
Owner CharacteristicsAge of owner manager -0.0103 0.1411 0.0339 0.0002 -0.0175 0.0258 0.0460 0.0001 -0.0063 0.0242 0.0386 0.0001Gender - man -0.0474 0.8742 1.1805 0.0136 0.3215 0.2856 0.5191 0.1788 0.2070 0.0901 0.1866 0.2399Race - minority 0.0868 0.6865 -0.5703 0.1195 0.0415 0.8643 -0.5126 0.0439 -0.1839 0.0363 -0.1339 0.2408Education - no high school diploma -1.0497 0.0007 -1.8187 0.0028 -1.0151 0.0012 -0.0277 0.9487 -0.1610 0.2035 -0.1695 0.3031Education - high school diploma -1.2393 0.0001 -1.4166 0.0001 -1.1730 0.0001 -0.4054 0.1251 -0.4422 0.0001 -0.4227 0.0001Education - some college -0.6972 0.0005 -1.2259 0.0001 -0.6897 0.0034 -0.5602 0.0502 -0.2401 0.0036 -0.3592 0.0008Marital status - married 0.9859 0.0001 -0.1936 0.4884 0.8035 0.0002 0.2415 0.3774 0.3259 0.0001 0.4265 0.0001Owns Stocks 0.5951 0.0003 1.1147 0.0001 0.6263 0.0032 0.9863 0.0008 0.3026 0.0001 0.7516 0.0001Owns Real Estate (>$50,000) 1.4898 0.0001 1.6983 0.0015 1.3790 0.0001 2.4580 0.0001 0.7648 0.0001 1.8279 0.0001
Business CharacteristicsBusiness age 0.0207 0.0162 0.0395 0.0002 0.0134 0.1654 0.0355 0.0143 0.0134 0.0001 0.0196 0.0001Business size, number of employees 0.0176 0.6315 0.1317 0.1063 0.0423 0.6297 0.0110 0.8569 0.0027 0.1742 0.0026 0.3187Organization, pa rtnership -0.7683 0.0108 -0.2794 0.3644 -0.7227 0.0553 -1.3610 0.0165 -0.1737 0.1225 -0.5857 0.0001Organization, sole proprietorship -0.9407 0.0008 -1.0917 0.0002 -0.7452 0.0340 -1.5065 0.0054 -0.3391 0.0011 -0.8343 0.0001Organization, subchapter s corporation 0.4034 0.2290 0.0941 0.7605 0.1481 0.7272 0.0266 0.9676 0.2032 0.0817 0.1960 0.1965Industry, construction, manufacturing 0.3840 0.1483 0.5961 0.1413 0.1705 0.5358 -0.2109 0.6095 0.4554 0.0001 -0.2083 0.1462Industry, wholesale, retail 0.3983 0.1722 0.3046 0.4770 0.9911 0.0036 -1.0028 0.0229 0.7477 0.0001 -0.5319 0.0007Industry, services and other 0.7134 0.0037 0.6115 0.0966 0.7927 0.0024 -0.3673 0.3478 0.7307 0.0001 -0.3576 0.0068Founding status, bought, invested 0.1360 0.6787 -0.4121 0.2773 -0.2928 0.4542 0.2534 0.6331 -0.3840 0.0022 0.1144 0.4832Founding status, started -0.1575 0.5965 -0.8853 0.0112 -0.4320 0.2312 -0.7239 0.1229 -0.3232 0.0045 -0.5987 0.0001McFadden R-squared 0.2093 0.3279 0.1954 0.3498 0.1803 0.3850
Logistic RegressionLog Income Log Wealth
Small Business Households Only, 2001 - 2007Logistic Regression
High Income Proba bility High Wealth Proba bilityLogistic Regression
Highest 50% Income Highest 50% Wealth

34
Table 13 Determinants of Being a High Income and High Wealth Among Small Business Households, 2004 – 2007
Parameter Parameter Parameter Parameter Parameter ParameterCharacteristics Estimate p-value Estimate p-value Estimate p-value Estimate p-value Estimate p-value Estimate p-value
Constant -1.9361 0.0013 -6.3077 0.0001 -0.4991 0.4397 -2.3632 0.0102 10.2616 0.0001 9.3716 0.0001
Owns/manages multiple businesses 0.4849 0.1163 1.2401 0.0001 -0.2111 0.5374 1.4165 0.0175 0.0674 0.5520 0.8022 0.0001Year dummy, 2007 -0.0097 0.9521 0.0961 0.6638 0.0542 0.7630 -0.3236 0.1351 -0.1244 0.0592 -0.1630 0.0555Interaction: multiple owner and 2007 0.1092 0.7945 0.6823 0.1165 0.7419 0.1396 -0.0583 0.9395 0.2976 0.0539 0.3508 0.0785
Owner CharacteristicsAge of owner manager -0.0095 0.1773 0.0298 0.0012 -0.0214 0.0055 0.0624 0.0001 -0.0060 0.0314 0.0438 0.0001Gender - man 0.7133 0.0207 1.7371 0.0020 0.9053 0.0018 1.1208 0.0018 0.3972 0.0011 0.3516 0.0253Race - minority -0.2750 0.1868 -0.7125 0.0469 -0.5291 0.0160 -0.2646 0.2909 -0.2480 0.0037 -0.0629 0.5686Education - no high school diploma -1.3511 0.0001 -1.5888 0.0181 -1.0526 0.0011 -0.1723 0.6697 -0.3794 0.0052 -0.0221 0.8996Education - high school diploma -1.2635 0.0001 -1.4669 0.0001 -0.6265 0.0026 0.1157 0.6648 -0.3857 0.0001 -0.2700 0.0068Education - some college -0.7147 0.0005 -1.1444 0.0001 -0.4759 0.0441 -0.6270 0.0233 -0.4109 0.0001 -0.3677 0.0008Marital status - married 1.0248 0.0001 -0.0953 0.7316 0.9481 0.0001 0.0715 0.7846 0.3457 0.0001 0.3685 0.0005Owns Stocks 0.1106 0.5220 0.5743 0.0030 0.5603 0.0100 1.1332 0.0002 0.0879 0.2007 0.5445 0.0001Owns Real Estate (>$50,000) 1.3898 0.0001 2.4033 0.0006 1.1685 0.0001 2.5928 0.0001 0.6441 0.0001 2.0216 0.0001
Business CharacteristicsBusiness age 0.0230 0.0106 0.0430 0.0001 0.0149 0.1319 0.0166 0.2394 0.0163 0.0001 0.0199 0.0001Business size, number of employees 0.0111 0.7206 0.1691 0.1026 0.0475 0.6787 0.0121 0.9087 0.0029 0.1640 0.0027 0.3093Organization, pa rtnership -0.2680 0.3635 -0.4976 0.1278 -0.3008 0.4166 -1.1089 0.0760 -0.1462 0.2117 -0.4560 0.0026Organization, sole proprietorship -0.6563 0.0173 -1.1436 0.0003 -0.5170 0.1410 -1.6653 0.0058 -0.2942 0.0081 -0.8465 0.0001Organization, subchapter s corporation 0.8746 0.0113 0.4123 0.2157 1.0216 0.0320 -0.0120 0.9867 0.1899 0.1282 0.2105 0.1918Industry, construction, manufacturing 0.4086 0.1552 0.3645 0.4049 0.0438 0.8821 0.0977 0.8014 0.4561 0.0001 -0.4255 0.0053Industry, wholesale, retail 0.8100 0.0079 -0.0822 0.8585 0.5769 0.0762 -0.4195 0.3093 0.7037 0.0001 -0.5160 0.0014Industry, services and other 1.3206 0.0001 0.6944 0.0878 0.8771 0.0023 0.2960 0.4365 0.9226 0.0001 -0.3258 0.0245Founding status, bought, invested 0.1081 0.7462 -0.4384 0.2521 0.3025 0.4014 -0.1891 0.7160 -0.3991 0.0018 -0.0346 0.8344Founding status, started -0.3163 0.2942 -1.1610 0.0007 0.2390 0.4669 -1.2071 0.0096 -0.3415 0.0030 -0.6437 0.0001McFadden R-squared 0.2523 0.3685 0.2202 0.3788 0.1733 0.3962
Logistic RegressionLog Income Log Wealth
Small Business Households Only, 2004 - 2007Logistic Regression
High Income Proba bility High Wealth Proba bilityLogistic Regression
Highest 50% Income Highest 50% Wealth

35
10% (Table 14). The concentration of income in the top 10% bracket increased from
41.1% in 1998 to 47.1% in 2007 (a 14.5% increase) for all households, while the
concentration of income in the top 10% bracket increased from 49.7% to 53.3% (a 7.3%
increase) for households owning small businesses.
The wealth story is somewhat different (Table 15). The concentration of wealth in
the top 10% of households increased from 67.3% to 71.5% (a 6.3% increase), while the
concentration of wealth in the top 10% of households owning small businesses declined
from 66.3% to 64.8% (a 2.3% decrease). This suggests that firms in the lower wealth
quintiles, especially in the 90th quintile, realized more wealth accumulation than firms in
the top quintile.
In order to explore the influence of debt held in mortgages and other debt secured
by residential real estate, two additional control variables were added to the analyses in
Tables 8 through Table 13: the log of debt in mortgages secured by residential real estate
and log of debt held in other debt secured by residential real estate. Even though variables
were statistically significant factors in predicting income and wealth, the addition of these
variables did not change the most important results. See Appendix C for Tables 8.1
through Table 13.1.
Conclusions
This study is primarily concerned with changes in income and wealth of families owning
and not owning small businesses from the late 1990s to 2007. Who were the winners and
losers? This study utilizes cross-section data to assess changes in income and wealth of
all households and families owning different types of businesses from 1998 to 2007.

36
Table 14 Income Deciles for All Households and Small Business Owner/Manager Households
Decile 1998 2001 2004 2007 1998 2001 2004 200710% 0.0086 0.0094 0.0098 0.0099 0.0107 0.0117 0.0104 0.009120% 0.0209 0.0196 0.0211 0.0193 0.0235 0.0205 0.0200 0.020530% 0.0321 0.0298 0.0319 0.0289 0.0325 0.0278 0.0305 0.029140% 0.0443 0.0401 0.0424 0.0380 0.0374 0.0371 0.0377 0.035350% 0.0566 0.0517 0.0549 0.0490 0.0461 0.0493 0.0471 0.043060% 0.0719 0.0657 0.0688 0.0630 0.0591 0.0582 0.0583 0.052070% 0.0902 0.0834 0.0863 0.0800 0.0705 0.0721 0.0727 0.062080% 0.1135 0.1061 0.1099 0.1020 0.0873 0.0909 0.0969 0.085090% 0.1507 0.1429 0.1509 0.1390 0.1363 0.1424 0.1418 0.1310100% 0.4112 0.4513 0.4240 0.4710 0.4966 0.4900 0.4846 0.5330
All Households Small Business Owner Manager Households
Table 15 Net Worth Deciles for All Households and Small Business Owner/Manager Households
Decile 1998 2001 2004 2007 1998 2001 2004 200710% 0.0000 0.0000 0.0000 0.0000 0.0015 0.0028 0.0015 0.001120% 0.0007 0.0007 0.0007 0.0006 0.0058 0.0070 0.0052 0.004930% 0.0036 0.0036 0.0031 0.0027 0.0106 0.0122 0.0098 0.009340% 0.0102 0.0090 0.0083 0.0079 0.0170 0.0190 0.0164 0.013950% 0.0201 0.0173 0.0163 0.0163 0.0249 0.0277 0.0232 0.019660% 0.0329 0.0285 0.0277 0.0279 0.0343 0.0367 0.0354 0.031770% 0.0502 0.0460 0.0440 0.0439 0.0498 0.0502 0.0478 0.046580% 0.0782 0.0755 0.0731 0.0670 0.0718 0.0800 0.0725 0.076490% 0.1312 0.1309 0.1343 0.1185 0.1218 0.1456 0.1396 0.1489100% 0.6729 0.6885 0.6925 0.7152 0.6625 0.6188 0.6486 0.6477
All Households Small Business Owner Manager Households

37
While panel data would be preferred, the unit of observation is all families belonging to
a specific group in each time period. Clearly, the economic pie increased in size during
this period of time for households owning small businesses. However, the most important
questions are the following: Did households owning small businesses make more
financial gains in terms of changes in income and wealth than households not owning a
business; and did households owning multiple small businesses make more financial
gains than households owning just one small business?
Another study completed by Haynes and Ou (2006) suggests that households
owning small businesses, especially those owning only one small business, appear to
have made smaller contributions to total wealth in 2001 than in the early 1990s. This
evidence suggested that households owning only one small business seemed to be losing
the race. They were making progress in increasing income and wealth, but they were
making less progress than households not owning small businesses.
This study suggests that the story changed significantly from the late 1990s
through 2007. Households with and without small businesses have made very similar
progress in increasing their income and wealth during a time of robust business activity.
Households owning multiple small businesses appear to have accumulated wealth at
somewhat faster rates than households owning just one small business. This result would
suggest that the financial success of small business owners in one business is often
leveraged into financial success in other business ventures. If public policy is targeting
growth in gross domestic product, households owning multiple small businesses appear
to have the most potential to grow the economy.

38
The proportion of households owning and managing at least one small business
has been remarkably static over a relatively long period of time, with about 12% of
households owning and managing a small business. From 1998 to 2007 the growth in the
number of small businesses (19.4%) outpaced the growth in the number of households
(13.2%). The largest share of growth occurred in households owning and managing one
business, even though the high income and wealth growth was realized by households
owning and managing two or more small businesses. With the relatively good financial
success of households owning small businesses over the past decade, why haven’t more
small businesses been started or expanded? The period of rapid economic expansion may
have been a difficult time to start and nurture a new business and grow an existing small
business venture for several reasons:
(1) Labor costs increased. The unemployment rate remained around 4%
starting in 1998, with some movement upward to over 6% in early 2003,
and a fall back to the 4% to 4.5% range in 2006; hence, the labor supply
was tight for most of the decade (Bureau of Labor Statistics, 2005). In this
type of labor market, small business owners faced higher wages. In
addition, small business owners may have faced substantial challenges
finding and retaining high quality employees.
(2) The opportunity cost of capital increased. Financial capital remained
relatively expensive to borrow from 1998 through 2006, with rates ranging
from 9.5% in 2000 to 4% in 2003 and 2004. While financial capital
became less expensive to borrow from 2000 through 2004, rates steadily
increased from late 2004 through 2006. Perhaps most important, the value

39
of the stock market (S&P 500) increased by over 4% annually from early
1998 through 2006. Investors, particularly family and friends who may
have been willing to invest in a small business venture, had less risky
alternatives for their excess cash. In this type of financial market, small
business owners may have been facing higher costs of financing and
restricted access, especially for start-up financing.
(3) Other employment opportunities increased the opportunity cost of
prospective owners. If higher inflation-adjusted net income and wealth are
the only important criteria considered by the business owner, many of the
family members owning a business may have been better off working for
someone else. In a market with relatively low unemployment in a growing
economy, the opportunity cost of risking one’s family’s financial
resources in a small business venture increases substantially.
In the current economy, reeling from the severe disruptions in the financial
markets, unemployment rates have increased to over 10%, loosening the labor supply; the
stock market has declined by over 30% since mid-2008 loosening financial capital; and
other investment and employment opportunities for small business owners are much less
plentiful. Based on this assessment, it must be a good time to start a business because
good people can be hired and retained, money is available from traditional and
nontraditional lenders for qualified borrowers and the opportunity cost of starting a
business has declined. Perhaps it is a good time to start a new business because of the
cost advantages realized in a recessionary economy. However, astute small business

40
owners contemplating starting or expanding a business will be most concerned about the
depth of the recessionary trough, rather than whether financial capital is available.
The results have some rather interesting public policy implications. If households
owning small businesses are making similar financial progress to households not owning
a business, then small business ownership may become a less attractive employment
option because small business ownership is risky. Are additional incentives needed to
encourage small business ownership?
Recent changes in bankruptcy laws have removed part of the safety net for small
business borrowers by making it more difficult for those with credit card debt to liquidate
their assets in a Chapter 7 bankruptcy. With the emergence of more line-of-credit and
credit-card-based lending by large banks to small businesses, this change in the
bankruptcy law has had a significant impact on the strength of the safety net. Are other
revisions in the bankruptcy law needed to provide a more secure safety net for small
business owners (and their wealth)?
What might be done to improve the financial performance of households owning
a single small business? In general, households owning multiple small businesses
outperform households owning a single small business for a host of reasons, including
more experience, education and financial capital. Revising rules to allow more angel and
venture capital for these small businesses might provide more financial capital. Small
businesses are essentially relationship borrowers; hence, they may be adversely affected
by further concentration in commercial banking and less relationship lending at the local
level. Further work is needed to determine if large banks are interested in servicing small
businesses.
41
A subset of small business owners, agricultural producers (farmers), are recipients
of substantial subsidies provided by the 2008 Farm Bill and other legislation. Should
some of these subsidy programs (such as revenue guarantees, price protection and
production insurance) be extended to small businesses?
Most important, small business owners as a group realized substantial gains in
real income and wealth from 1998 to 2007, and they ran a very good race with other
households not owning small businesses. Households owning at least one small business
realized slightly lower increases in the probability of being high wealth than households
not owning a small business. This result suggests that investments in small businesses
realized lower financial returns thant investments in other assets. Even among small
business owners, it appears that more of the growth in wealth was derived from
ownership in publicly traded stocks and real estate than from the ownership of small
businesses. Given these relatively modest differences in the aggregate gains in wealth
between households with and without small businesses it should be no surprise that the
number of households owning small businesses has remained quite stable.
Further research utilizing high quality panel data is needed to compare the returns
on business and other assets and assess the modest gains in income and wealth of small-
business-owning households during this time of robust economic growth.

42
References Azicorbe, A.M., Kennickell, A.B. and Moore, K.B. (2003). Recent changes in U.S.
family finances: Evidence from the 1998 and 2001 Surveys of Consumer Finances, Federal Reserve Bulletin, January 2003, 1-32.
Bucks, B.K., Kennickell, A.B., Machs, T.L. and Moore, K.B. (2009). Changes in U.S.
family finances: Evidence from the Survey of Consumer Finances, Federal Reserve Bulletin, 2009, 1-56.
Bucks, B.K., Kennickell, A.B. and Moore, K.B. (2006). Recent changes in U.S. family
finances: Evidence from the 2001 and 2004 Surveys of Consumer Finances, Federal Reserve Bulletin, 2006, 1-38.
Haynes, G.W. (2005). Income and Wealth: How Did Households Owning Small
Businesses Fare from 1992 to 2001? United States Small Business Administration, Office of Advocacy. Monograph for the U.S. Small Business Administration.
Haynes, G.W. and Onochie, J.O. (2005). Is What's Good for the Business, Good for the
Family: A Financial Assessment, in Exploring the family-business intersection with panel data: Past, present and future. United States Association of Small Business and Entrepreneurship/SBIDA 2005 Conference, Indian Wells, CA, January.
Haynes, G.W. and Ou, C. (2006). How did households owning small businesses fare
during the largest ever peacetime expansion in the U.S. economy, United States Association of Small Business and Entrepreneurship/SBIDA 2005 Conference Proceedings, Tucson, AZ, January.
Haynes, G.W., & Avery, R. J. (1996). Family business: Can the family and the business
finances be separated? Can the family and the business finances be separated? Preliminary results. Journal of Entrepreneurial and Small Business Finance, 5(1), 61-74.
Kennickell, A.B. & Starr-McCluer, M. (1997). Changes in family finances in the U.S.:
Evidence from the Survey of Consumer Finances. Federal Reserve Bulletin, January 1997, 1-24.
Kennickell, A.B., Starr-McCluer, M. & Surette, B.J. (2000). Changes in family finances
in the U.S.: Evidence from the Survey of Consumer Finances. Federal Reserve Bulletin, January 2000, 1-29.
Lopez, R. (1986). Structural models of the farm household that allow for interdependent
utility and profit maximization decisions. In: I. Singh, L. Squire and J. Straus (eds). Agricultural household models: Extensions, applications and policy. Baltimore and London: The Johns Hopkins University Press, 306-325.

43
Wolff, E.N. (1998). Recent trends in the size distribution of household wealth, Journal of Economic Perspectives, 12(3), 131-150.
Xaio, J.J., M.J. Alhabeeb, G.S. Hong and G.W. Haynes. Risk Tolerance of Business
Owning Families, American Council on Consumer Interests, March 2000.

44
Appendix A Table 4.1 Median Income, 1998 to 2007
Characteristics 1998 2001 2004 2007 98 to 07 01 to 07 04 to 07
All respondents 42,601 46,895 47,374 47,305 0.110 0.009 -0.001
No business ownership 38,729 42,085 43,991 41,135 0.062 -0.023 -0.065
Any business ownership 71,002 92,587 84,597 90,496 0.275 -0.023 0.070
Small business 69,712 90,182 84,597 86,383 0.239 -0.042 0.021
single business only 67,130 86,575 75,573 81,241 0.210 -0.062 0.075
multiple businesses 73,584 102,207 147,763 145,000 0.971 0.419 -0.019Note: Bolded and italicized means are statistically different at the 0.05 level of significance from the 2007 means(reference group).
Proportional Changes
(2007 dollars)
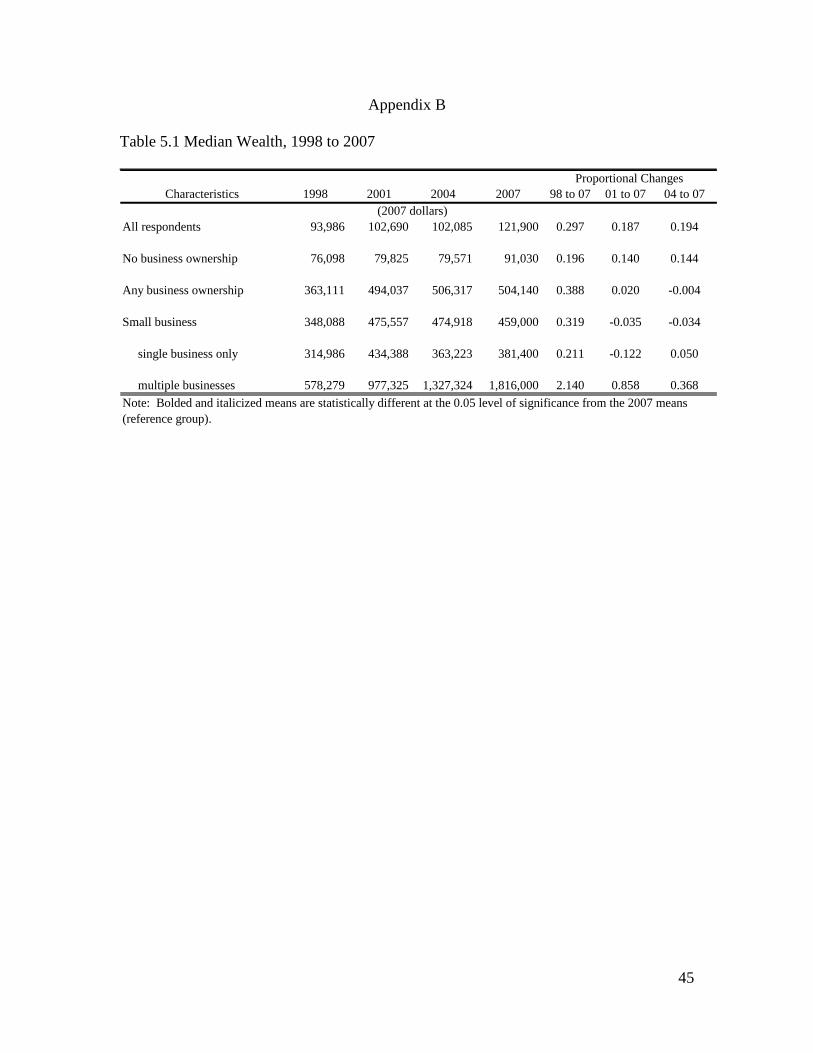
45
Appendix B
Table 5.1 Median Wealth, 1998 to 2007
Characteristics 1998 2001 2004 2007 98 to 07 01 to 07 04 to 07
All respondents 93,986 102,690 102,085 121,900 0.297 0.187 0.194
No business ownership 76,098 79,825 79,571 91,030 0.196 0.140 0.144
Any business ownership 363,111 494,037 506,317 504,140 0.388 0.020 -0.004
Small business 348,088 475,557 474,918 459,000 0.319 -0.035 -0.034
single business only 314,986 434,388 363,223 381,400 0.211 -0.122 0.050
multiple businesses 578,279 977,325 1,327,324 1,816,000 2.140 0.858 0.368Note: Bolded and italicized means are statistically different at the 0.05 level of significance from the 2007 means(reference group).
Proportional Changes
(2007 dollars)

46
Appendix C Table 8.1 Determinants of Being a High Income and High Wealth Among All Households, 1998 - 2007
Parameter Parameter Parameter Parameter Parameter ParameterCharacteristics Estimate p-value Estimate p-value Estimate p-value Estimate p-value Estimate p-value Estimate p-value
Constant -2.9197 0.0001 -8.7466 0.0001 -0.6487 0.0001 -4.4458 0.0001 10.0890 0.0001 5.2582 0.0001
Small business owner manager 0.2442 0.0378 1.5130 0.0001 0.3549 0.0066 1.4113 0.0001 0.1317 0.0224 1.1978 0.0001Year dummy, 1998 0.2062 0.0019 0.6480 0.0001 -0.2215 0.0002 -0.1859 0.0052 0.1883 0.0001 0.0880 0.1671Interaction: small business and 1998 0.2458 0.1323 0.1425 0.5706 0.1726 0.3440 0.0434 0.8395 -0.0590 0.4440 0.0086 0.9626
Age of owner manager -0.0041 0.0764 0.0400 0.0001 -0.0119 0.0001 0.0496 0.0001 -0.0018 0.0344 0.0479 0.0001Gender - man 0.8612 0.0001 0.7069 0.0034 0.9558 0.0001 0.4886 0.0001 0.3480 0.0001 0.6478 0.0001Race - minority -0.2738 0.0006 -0.7280 0.0009 -0.2365 0.0005 -0.3993 0.0001 -0.1889 0.0001 -0.4163 0.0001Education - no high school diploma -2.2495 0.0001 -1.9698 0.0001 -2.1069 0.0001 -1.6864 0.0001 -0.8672 0.0001 -1.1818 0.0001Education - high school diploma -1.4599 0.0001 -1.7416 0.0001 -1.2832 0.0001 -1.0457 0.0001 -0.5155 0.0001 -0.3659 0.0001Education - some college -0.8705 0.0001 -1.3039 0.0001 -0.8503 0.0001 -0.6937 0.0001 -0.3873 0.0001 -0.5152 0.0001Marital status - married 1.0903 0.0001 0.1068 0.5396 0.7546 0.0001 0.3861 0.0001 0.3862 0.0001 0.2233 0.0054Owns Stocks 0.8120 0.0001 1.3568 0.0001 0.8544 0.0001 1.2543 0.0001 0.3286 0.0001 1.0583 0.0001Owns Real Estate (>$50,000) 1.0828 0.0001 2.6239 0.0001 0.7890 0.0001 3.4944 0.0001 0.3402 0.0001 3.5860 0.0001Log debt in mortgages secured by 0.0740 0.0001 -0.0210 0.0976 0.0916 0.0001 -0.0796 0.0001 0.0286 0.0001 -0.0019 0.7974 residential real estateLog debt in other debt secured by 0.0688 0.0001 0.1196 0.0001 0.0623 0.0001 0.0435 0.0014 0.02952 0.0001 0.04911 0.0001 residential real estateMcFadden R-squared 0.3432 0.3739 0.3339 0.4639 0.2886 0.4708
Logistic RegressionLog Income Log Wealth
All Households, 1998 - 2007Logistic Regression
High Income Proba bility High Wealth Proba bilityLogistic Regression
Highest 50% Income Highest 50% Wealth
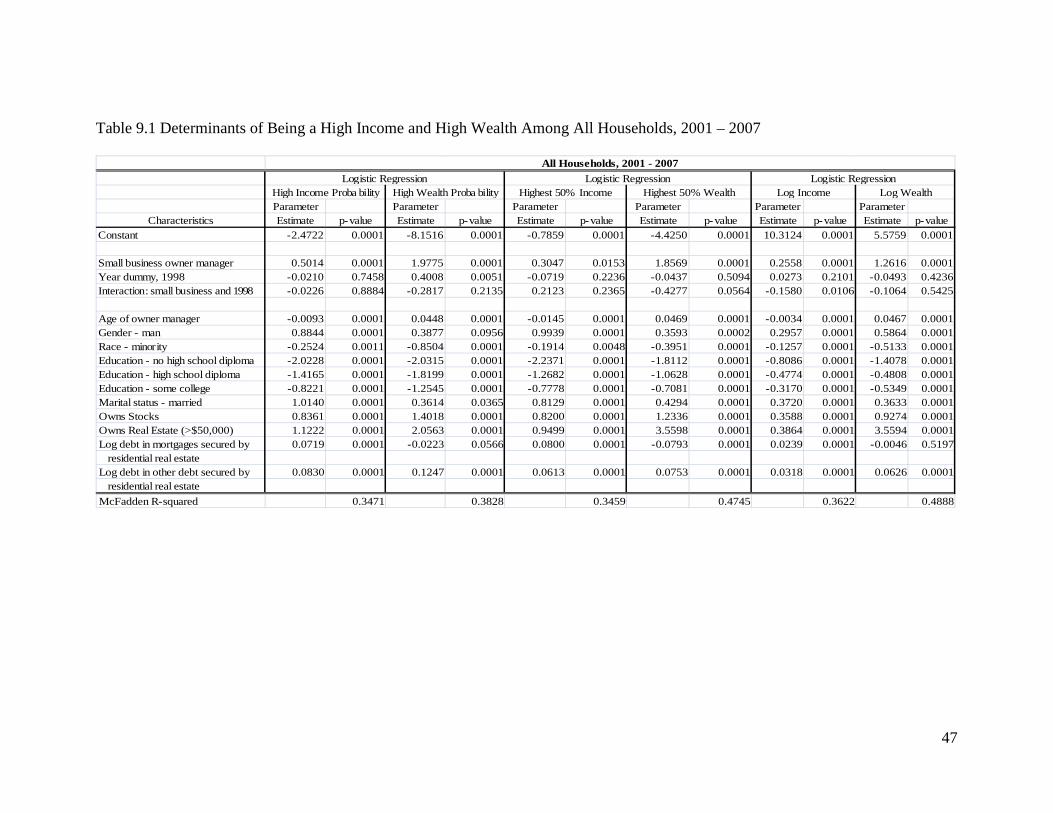
47
Table 9.1 Determinants of Being a High Income and High Wealth Among All Households, 2001 – 2007
Parameter Parameter Parameter Parameter Parameter ParameterCharacteristics Estimate p-value Estimate p-value Estimate p-value Estimate p-value Estimate p-value Estimate p-value
Constant -2.4722 0.0001 -8.1516 0.0001 -0.7859 0.0001 -4.4250 0.0001 10.3124 0.0001 5.5759 0.0001
Small business owner manager 0.5014 0.0001 1.9775 0.0001 0.3047 0.0153 1.8569 0.0001 0.2558 0.0001 1.2616 0.0001Year dummy, 1998 -0.0210 0.7458 0.4008 0.0051 -0.0719 0.2236 -0.0437 0.5094 0.0273 0.2101 -0.0493 0.4236Interaction: small business and 1998 -0.0226 0.8884 -0.2817 0.2135 0.2123 0.2365 -0.4277 0.0564 -0.1580 0.0106 -0.1064 0.5425
Age of owner manager -0.0093 0.0001 0.0448 0.0001 -0.0145 0.0001 0.0469 0.0001 -0.0034 0.0001 0.0467 0.0001Gender - man 0.8844 0.0001 0.3877 0.0956 0.9939 0.0001 0.3593 0.0002 0.2957 0.0001 0.5864 0.0001Race - minority -0.2524 0.0011 -0.8504 0.0001 -0.1914 0.0048 -0.3951 0.0001 -0.1257 0.0001 -0.5133 0.0001Education - no high school diploma -2.0228 0.0001 -2.0315 0.0001 -2.2371 0.0001 -1.8112 0.0001 -0.8086 0.0001 -1.4078 0.0001Education - high school diploma -1.4165 0.0001 -1.8199 0.0001 -1.2682 0.0001 -1.0628 0.0001 -0.4774 0.0001 -0.4808 0.0001Education - some college -0.8221 0.0001 -1.2545 0.0001 -0.7778 0.0001 -0.7081 0.0001 -0.3170 0.0001 -0.5349 0.0001Marital status - married 1.0140 0.0001 0.3614 0.0365 0.8129 0.0001 0.4294 0.0001 0.3720 0.0001 0.3633 0.0001Owns Stocks 0.8361 0.0001 1.4018 0.0001 0.8200 0.0001 1.2336 0.0001 0.3588 0.0001 0.9274 0.0001Owns Real Estate (>$50,000) 1.1222 0.0001 2.0563 0.0001 0.9499 0.0001 3.5598 0.0001 0.3864 0.0001 3.5594 0.0001Log debt in mortgages secured by 0.0719 0.0001 -0.0223 0.0566 0.0800 0.0001 -0.0793 0.0001 0.0239 0.0001 -0.0046 0.5197 residential real estateLog debt in other debt secured by 0.0830 0.0001 0.1247 0.0001 0.0613 0.0001 0.0753 0.0001 0.0318 0.0001 0.0626 0.0001 residential real estateMcFadden R-squared 0.3471 0.3828 0.3459 0.4745 0.3622 0.4888
Logistic RegressionLog Income Log Wealth
All Households, 2001 - 2007Logistic Regression
High Income Proba bility High Wealth Proba bilityLogistic Regression
Highest 50% Income Highest 50% Wealth

48
Table 10.1 Determinants of Being a High Income and High Wealth Among All Households, 2004 – 2007
Parameter Parameter Parameter Parameter Parameter ParameterCharacteristics Estimate p-value Estimate p-value Estimate p-value Estimate p-value Estimate p-value Estimate p-value
Constant -2.8709 0.0001 -8.8369 0.0001 -0.8444 0.0001 -5.1231 0.0001 10.2061 0.0001 5.1091 0.0001
Small business owner manager 0.6025 0.0001 1.6845 0.0001 0.3435 0.0064 1.7591 0.0001 0.1919 0.0001 1.2680 0.0001Year dummy, 2004 0.1189 0.0682 0.2760 0.0455 -0.0733 0.2134 0.0178 0.7888 0.0348 0.1132 0.0146 0.8079Interaction: small business and 2004 -0.1302 0.4234 -0.0123 0.9569 0.1619 0.3688 -0.3051 0.1645 -0.0961 0.1239 -0.1119 0.5132
Age of owner manager -0.0061 0.0057 0.0421 0.0001 -0.0131 0.0001 0.0505 0.0001 -0.0018 0.0092 0.0469 0.0001Gender - man 1.0409 0.0001 0.5514 0.0140 0.9000 0.0001 0.5194 0.0001 0.3060 0.0001 0.8288 0.0001Race - minority -0.1974 0.0100 -0.7340 0.0003 -0.1496 0.0250 -0.2148 0.0045 -0.1052 0.0001 -0.3255 0.0001Education - no high school diploma -2.3266 0.0001 -1.6489 0.0001 -2.2695 0.0001 -1.7472 0.0001 -0.7769 0.0001 -1.0683 0.0001Education - high school diploma -1.5275 0.0001 -1.9163 0.0001 -1.3288 0.0001 -0.9864 0.0001 -0.4812 0.0001 -0.2557 0.0004Education - some college -0.9403 0.0001 -1.2083 0.0001 -0.8427 0.0001 -0.7693 0.0001 -0.3598 0.0001 -0.4844 0.0001Marital status - married 1.0653 0.0001 0.3499 0.0314 1.0129 0.0001 0.3707 0.0001 0.4179 0.0001 0.1134 0.1312Owns Stocks 0.8365 0.0001 1.3345 0.0001 0.9256 0.0001 1.3034 0.0001 0.3260 0.0001 1.0084 0.0001Owns Real Estate (>$50,000) 1.2090 0.0001 2.9691 0.0001 0.9979 0.0001 3.8417 0.0001 0.3828 0.0001 3.7581 0.0001Log debt in mortgages secured by 0.0614 0.0001 -0.0292 0.0114 0.0691 0.0001 -0.0726 0.0001 0.0226 0.0001 -0.0012 0.8654 residential real estateLog debt in other debt secured by 0.0860 0.0001 0.1323 0.0001 0.0707 0.0001 0.0828 0.0001 0.0351 0.0001 0.0723 0.0001 residential real estateMcFadden R-squared 0.3605 0.3856 0.3533 0.4865 0.3502 0.4977
Logistic RegressionLog Income Log Wealth
All Households, 2004 - 2007Logistic Regression
High Income Proba bility High Wealth Proba bilityLogistic Regression
Highest 50% Income Highest 50% Wealth

49
Table 11.1 Determinants of Being a High Income and High Wealth Among Small Business Households, 1998 – 2007
Parameter Parameter Parameter Parameter Parameter ParameterCharacteristics Estimate p-value Estimate p-value Estimate p-value Estimate p-value Estimate p-value Estimate p-value
Constant -1.7433 0.0031 -6.5510 0.0001 -0.1080 0.8742 -1.7255 0.0574 9.8813 0.0001 9.5429 0.0001
Owns/manages multiple businesses -0.0724 0.7861 1.3907 0.0001 0.4327 0.1948 1.2678 0.0062 0.2671 0.0342 0.7287 0.0001Year dummy, 1998 0.3383 0.0374 0.7881 0.0022 -0.0057 0.9758 -0.1477 0.5068 0.1223 0.1147 0.1408 0.1300Interaction: multiple owner and 1998 0.6243 0.1077 0.3210 0.4935 0.1338 0.7902 -0.1093 0.8687 0.0664 0.7037 0.3335 0.1112
Owner CharateristicsAge of owner manager -0.0081 0.2672 0.0209 0.0435 -0.0162 0.0492 0.0565 0.0001 -0.0024 0.4892 0.0322 0.0001Gender - man 0.2749 0.3685 1.3959 0.0135 1.0611 0.0007 0.6925 0.0603 0.3733 0.0086 0.3815 0.0251Race - minority -0.0469 0.8280 -0.8793 0.0328 -0.1362 0.5722 -0.2761 0.2955 -0.1649 0.1088 -0.1311 0.2877Education - no high school diploma -1.3276 0.0001 -1.0919 0.1013 -1.0687 0.0006 -0.2037 0.6071 -0.3780 0.0111 -0.3019 0.0907Education - high school diploma -0.9940 0.0001 -0.9997 0.0012 -0.8889 0.0001 -0.2546 0.3307 -0.4079 0.0001 -0.2480 0.0230Education - some college -0.8063 0.0001 -1.0801 0.0005 -0.6639 0.0041 -0.6858 0.0114 -0.3794 0.0001 -0.3114 0.0055Marital status - married 0.8438 0.0001 -0.1789 0.5431 0.3149 0.1573 0.1296 0.6185 0.1805 0.0553 0.1745 0.1224Owns Stocks 0.2529 0.1316 0.6073 0.0041 0.5847 0.0091 1.2530 0.0001 0.1342 0.0898 0.7447 0.0001Owns Real Estate (>$50,000) 0.7633 0.0052 2.4663 0.0021 0.7570 0.0041 2.9601 0.0001 0.5286 0.0001 2.1421 0.0001Log debt in mortgages secured by 0.0324 0.0578 -0.0210 0.3402 0.0395 0.0412 -0.0750 0.0202 0.0101 0.2030 -0.0125 0.1894 residential real estateLog debt in other debt secured by 0.0684 0.0012 0.1000 0.0001 0.0259 0.3398 0.0736 0.0551 0.0248 0.0052 0.0510 0.0001 residential real estate
Business CharacteristicsBusiness age 0.0250 0.0047 0.0462 0.0001 0.0168 0.0968 0.0247 0.0879 0.0121 0.0031 0.0225 0.0001Business size, number of employees 0.0185 0.5865 0.1164 0.1332 0.0115 0.8174 0.0127 0.8736 0.0006 0.5149 0.0012 0.2413Organization, pa rtnership -0.6705 0.0181 -0.4112 0.2247 -0.6602 0.1004 -0.9698 0.0619 -0.4057 0.0019 -0.6408 0.0001Organization, sole proprietorship -0.5872 0.0258 -1.1995 0.0002 -0.6722 0.0789 -1.1489 0.0208 -0.3432 0.0046 -0.7272 0.0001Organization, subchapter s corporatio 0.2978 0.3446 -0.2613 0.4431 0.6124 0.2140 0.0194 0.9738 0.2008 0.1472 -0.0616 0.7109Industry, construction, manufacturing 0.8311 0.0044 0.3616 0.4264 0.5311 0.0677 -0.1366 0.7529 0.9223 0.0001 -0.3151 0.0500Industry, wholesale, retail 0.7025 0.0229 -0.0079 0.9874 0.6302 0.0499 -1.1247 0.0138 0.9823 0.0001 -0.5443 0.0017Industry, services and other 1.2340 0.0001 0.8265 0.0476 1.2170 0.0001 -0.3650 0.3846 1.1753 0.0001 -0.1921 0.2044Founding status, bought, invested 0.1637 0.6042 -0.4828 0.2291 0.0920 0.8041 -0.0425 0.9325 -0.4142 0.0038 0.0098 0.9545Founding status, started -0.3048 0.2954 -0.7883 0.0304 -0.2312 0.5032 -0.9446 0.0373 -0.4665 0.0004 -0.6562 0.0001McFadden R-squared 0.1993 0.3669 0.1900 0.3619 0.1523 0.3782
Logistic RegressionLog Income Log Wealth
Small Business Households Only, 1998 - 2007Logistic Regression
High Income Proba bility High Wealth Proba bilityLogistic Regression
Highest 50% Income Highest 50% Wealth

50
Table 12.1 Determinants of Being a High Income and High Wealth Among Small Business Households, 2001 – 2007
Parameter Parameter Parameter Parameter Parameter ParameterCharacteristics Estimate p-value Estimate p-value Estimate p-value Estimate p-value Estimate p-value Estimate p-value
Constant -1.0016 0.0836 -5.3718 0.0001 0.5041 0.4411 -0.7263 0.4259 10.4298 0.0001 9.9320 0.0001
Owns/manages multiple businesses -0.0539 0.8363 0.5137 0.0742 -0.1150 0.7044 -0.0183 0.9670 0.1202 0.2382 0.3539 0.0074Year dummy, 2001 -0.0837 0.6097 -0.1666 0.4563 0.1315 0.4748 -0.5105 0.0298 -0.1432 0.0303 -0.2366 0.0058Interaction: multiple owner and 2001 0.5815 0.1317 1.1608 0.0062 0.5293 0.2680 1.1408 0.0798 0.1789 0.2152 0.6894 0.0002
Owner CharacteristicsAge of owner manager -0.0055 0.4522 0.0302 0.0015 -0.0142 0.0787 0.0453 0.0001 -0.0066 0.0228 0.0385 0.0001Gender - man -0.0617 0.8378 1.1880 0.0157 0.3082 0.3085 0.5006 0.1970 0.1967 0.1069 0.1655 0.2953Race - minority 0.0701 0.7477 -0.7047 0.0595 0.0291 0.9051 -0.5822 0.0239 -0.2013 0.0220 -0.1676 0.1412Education - no high school diploma -0.9344 0.0025 -1.7572 0.0040 -0.9474 0.0024 -0.0099 0.9820 -0.1393 0.2725 -0.1220 0.4586Education - high school diploma -1.2255 0.0001 -1.3403 0.0001 -1.1666 0.0001 -0.3578 0.1769 -0.4253 0.0001 -0.3890 0.0001Education - some college -0.6819 0.0008 -1.2150 0.0001 -0.6808 0.0041 -0.5390 0.0605 -0.2303 0.0052 -0.3393 0.0015Marital status - married 0.9692 0.0001 -0.1477 0.6096 0.7817 0.0003 0.2371 0.3882 0.3281 0.0001 0.4293 0.0001Owns Stocks 0.6045 0.0003 1.1160 0.0001 0.6311 0.0031 1.0057 0.0006 0.2991 0.0001 0.7451 0.0001Owns Real Estate (>$50,000) 1.0188 0.0003 1.8869 0.0010 1.0680 0.0001 2.7340 0.0001 0.7642 0.0001 1.8019 0.0001Log debt in mortgages secured by 0.0443 0.0075 -0.0372 0.0617 0.0308 0.0989 -0.0393 0.1970 -0.0034 0.6015 -0.0040 0.6365 residential real estateLog debt in other debt secured by 0.0651 0.0043 0.0993 0.0001 0.0606 0.0460 0.0799 0.0604 0.0241 0.0021 0.0487 0.0001 residential real estate
Business CharacteristicsBusiness age 0.0214 0.0139 0.0385 0.0003 0.0135 0.1646 0.0333 0.0219 0.0130 0.0001 0.0189 0.0001Business size, number of employees 0.0180 0.6269 0.1484 0.0861 0.0420 0.6277 0.0093 0.8693 0.0028 0.1589 0.0027 0.2828Organization, pa rtnership -0.7884 0.0093 -0.2387 0.4436 -0.7289 0.0538 -1.3228 0.0197 -0.1692 0.1321 -0.5772 0.0001Organization, sole proprietorship -0.9349 0.0009 -1.1182 0.0001 -0.7306 0.0380 -1.4814 0.0062 -0.3370 0.0012 -0.8296 0.0001Organization, subchapter s corporatio 0.3338 0.3228 0.0085 0.9784 0.0925 0.8280 0.0370 0.9551 0.1825 0.1183 0.1527 0.3133Industry, construction, manufacturing 0.3268 0.2242 0.7095 0.0896 0.1399 0.6137 -0.2473 0.5603 0.4589 0.0001 -0.2044 0.1528Industry, wholesale, retail 0.3743 0.2042 0.3991 0.3666 0.9905 0.0037 -1.0321 0.0229 0.7555 0.0001 -0.5179 0.0010Industry, services and other 0.6615 0.0080 0.7476 0.0488 0.7647 0.0036 -0.4126 0.3072 0.7403 0.0001 -0.3417 0.0096Founding status, bought, invested 0.0826 0.8030 -0.4474 0.2516 -0.3472 0.3760 0.2126 0.6895 -0.3953 0.0016 0.0905 0.5775Founding status, started -0.2150 0.4755 -0.9307 0.0095 -0.4838 0.1820 -0.7615 0.1053 -0.3339 0.0033 -0.6210 0.0001McFadden R-squared 0.2201 0.3485 0.2014 0.3560 0.1830 0.3906
Logistic RegressionLog Income Log Wealth
Small Business Households Only, 2001 - 2007Logistic Regression
High Income Proba bility High Wealth Proba bilityLogistic Regression
Highest 50% Income Highest 50% Wealth
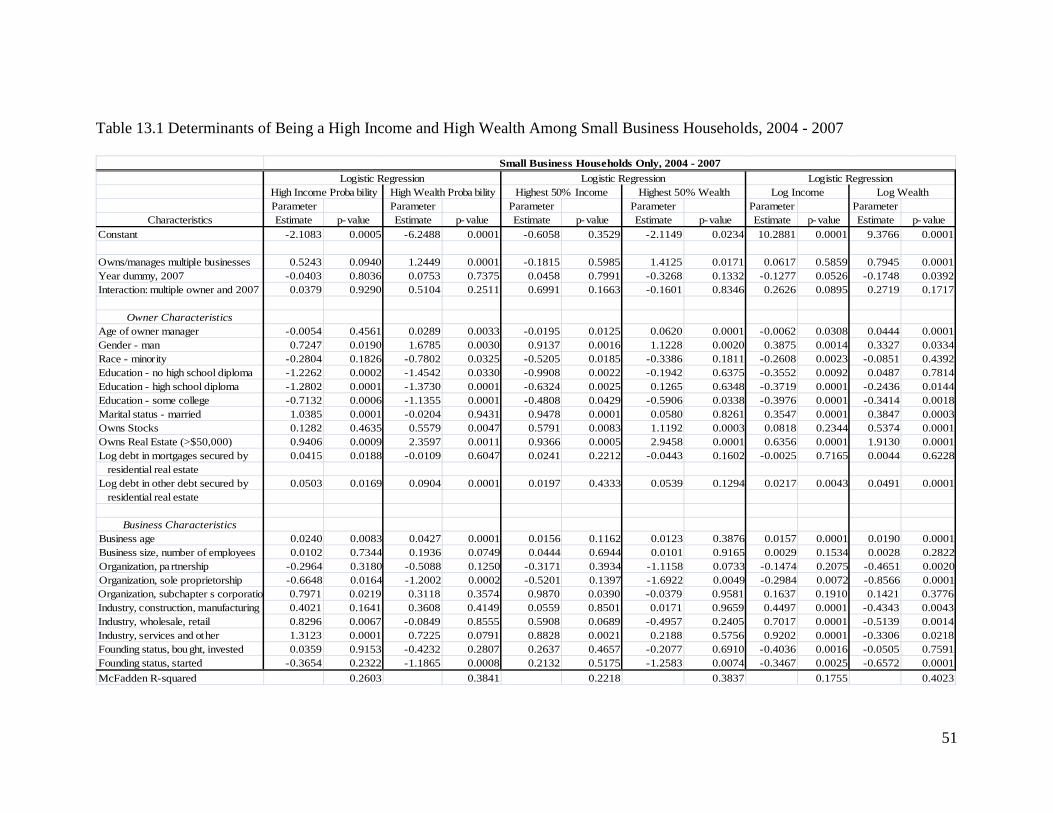
51
Table 13.1 Determinants of Being a High Income and High Wealth Among Small Business Households, 2004 - 2007
Parameter Parameter Parameter Parameter Parameter ParameterCharacteristics Estimate p-value Estimate p-value Estimate p-value Estimate p-value Estimate p-value Estimate p-value
Constant -2.1083 0.0005 -6.2488 0.0001 -0.6058 0.3529 -2.1149 0.0234 10.2881 0.0001 9.3766 0.0001
Owns/manages multiple businesses 0.5243 0.0940 1.2449 0.0001 -0.1815 0.5985 1.4125 0.0171 0.0617 0.5859 0.7945 0.0001Year dummy, 2007 -0.0403 0.8036 0.0753 0.7375 0.0458 0.7991 -0.3268 0.1332 -0.1277 0.0526 -0.1748 0.0392Interaction: multiple owner and 2007 0.0379 0.9290 0.5104 0.2511 0.6991 0.1663 -0.1601 0.8346 0.2626 0.0895 0.2719 0.1717
Owner CharacteristicsAge of owner manager -0.0054 0.4561 0.0289 0.0033 -0.0195 0.0125 0.0620 0.0001 -0.0062 0.0308 0.0444 0.0001Gender - man 0.7247 0.0190 1.6785 0.0030 0.9137 0.0016 1.1228 0.0020 0.3875 0.0014 0.3327 0.0334Race - minority -0.2804 0.1826 -0.7802 0.0325 -0.5205 0.0185 -0.3386 0.1811 -0.2608 0.0023 -0.0851 0.4392Education - no high school diploma -1.2262 0.0002 -1.4542 0.0330 -0.9908 0.0022 -0.1942 0.6375 -0.3552 0.0092 0.0487 0.7814Education - high school diploma -1.2802 0.0001 -1.3730 0.0001 -0.6324 0.0025 0.1265 0.6348 -0.3719 0.0001 -0.2436 0.0144Education - some college -0.7132 0.0006 -1.1355 0.0001 -0.4808 0.0429 -0.5906 0.0338 -0.3976 0.0001 -0.3414 0.0018Marital status - married 1.0385 0.0001 -0.0204 0.9431 0.9478 0.0001 0.0580 0.8261 0.3547 0.0001 0.3847 0.0003Owns Stocks 0.1282 0.4635 0.5579 0.0047 0.5791 0.0083 1.1192 0.0003 0.0818 0.2344 0.5374 0.0001Owns Real Estate (>$50,000) 0.9406 0.0009 2.3597 0.0011 0.9366 0.0005 2.9458 0.0001 0.6356 0.0001 1.9130 0.0001Log debt in mortgages secured by 0.0415 0.0188 -0.0109 0.6047 0.0241 0.2212 -0.0443 0.1602 -0.0025 0.7165 0.0044 0.6228 residential real estateLog debt in other debt secured by 0.0503 0.0169 0.0904 0.0001 0.0197 0.4333 0.0539 0.1294 0.0217 0.0043 0.0491 0.0001 residential real estate
Business CharacteristicsBusiness age 0.0240 0.0083 0.0427 0.0001 0.0156 0.1162 0.0123 0.3876 0.0157 0.0001 0.0190 0.0001Business size, number of employees 0.0102 0.7344 0.1936 0.0749 0.0444 0.6944 0.0101 0.9165 0.0029 0.1534 0.0028 0.2822Organization, pa rtnership -0.2964 0.3180 -0.5088 0.1250 -0.3171 0.3934 -1.1158 0.0733 -0.1474 0.2075 -0.4651 0.0020Organization, sole proprietorship -0.6648 0.0164 -1.2002 0.0002 -0.5201 0.1397 -1.6922 0.0049 -0.2984 0.0072 -0.8566 0.0001Organization, subchapter s corporation 0.7971 0.0219 0.3118 0.3574 0.9870 0.0390 -0.0379 0.9581 0.1637 0.1910 0.1421 0.3776Industry, construction, manufacturing 0.4021 0.1641 0.3608 0.4149 0.0559 0.8501 0.0171 0.9659 0.4497 0.0001 -0.4343 0.0043Industry, wholesale, retail 0.8296 0.0067 -0.0849 0.8555 0.5908 0.0689 -0.4957 0.2405 0.7017 0.0001 -0.5139 0.0014Industry, services and other 1.3123 0.0001 0.7225 0.0791 0.8828 0.0021 0.2188 0.5756 0.9202 0.0001 -0.3306 0.0218Founding status, bought, invested 0.0359 0.9153 -0.4232 0.2807 0.2637 0.4657 -0.2077 0.6910 -0.4036 0.0016 -0.0505 0.7591Founding status, started -0.3654 0.2322 -1.1865 0.0008 0.2132 0.5175 -1.2583 0.0074 -0.3467 0.0025 -0.6572 0.0001McFadden R-squared 0.2603 0.3841 0.2218 0.3837 0.1755 0.4023
Logistic RegressionLog Income Log Wealth
Small Business Households Only, 2004 - 2007Logistic Regression
High Income Proba bility High Wealth Proba bilityLogistic Regression
Highest 50% Income Highest 50% Wealth