Embed Size (px)
Citation preview

1
IndianaTeacherAppraisalandSupportSystem
ENSURINGTHATTEACHEREVALUATIONISEQUITABLE,EFFECTIVE&EFFICIENT
Indiana’sTeacherEvaluationSystem:AFour-YearAnalysis
SubmittedtotheIndianaStateBoardofEducation
HardyMurphy,Ph.D.
SandiCole,Ed.D.
February1,2017
2
ExecutiveSummary
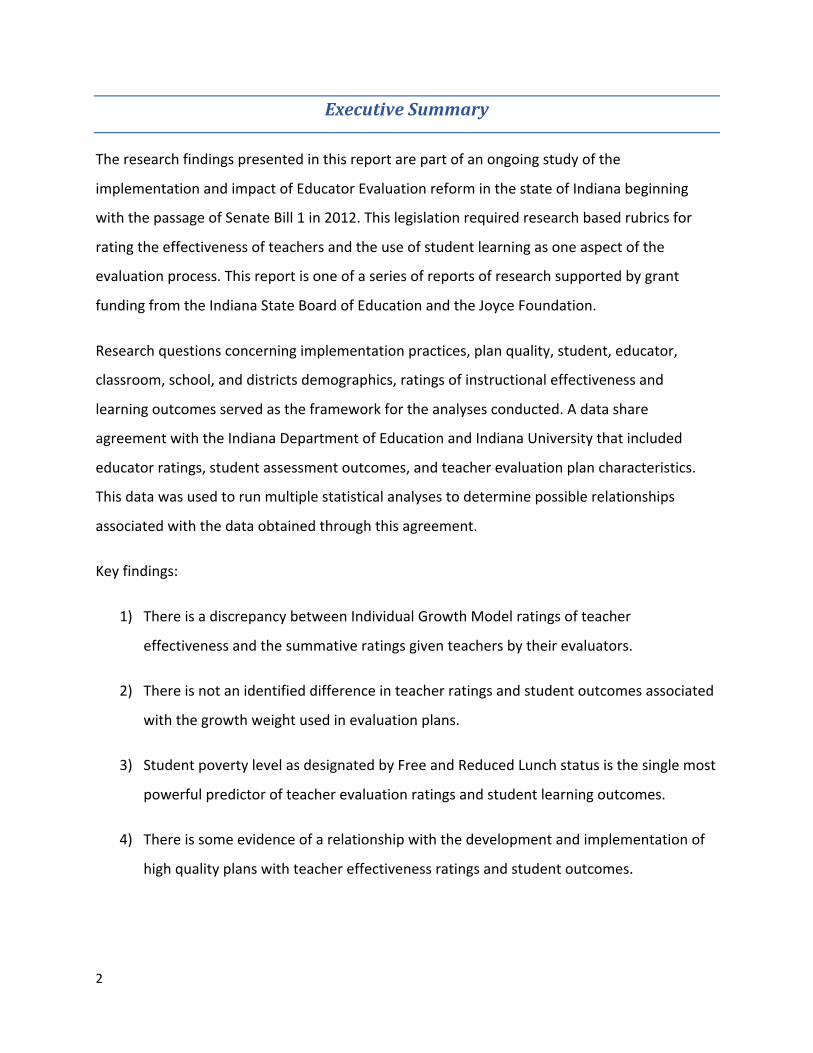
Theresearchfindingspresentedinthisreportarepartofanongoingstudyofthe
implementationandimpactofEducatorEvaluationreforminthestateofIndianabeginning
withthepassageofSenateBill1in2012.Thislegislationrequiredresearchbasedrubricsfor
ratingtheeffectivenessofteachersandtheuseofstudentlearningasoneaspectofthe
evaluationprocess.Thisreportisoneofaseriesofreportsofresearchsupportedbygrant
fundingfromtheIndianaStateBoardofEducationandtheJoyceFoundation.
Researchquestionsconcerningimplementationpractices,planquality,student,educator,
classroom,school,anddistrictsdemographics,ratingsofinstructionaleffectivenessand
learningoutcomesservedastheframeworkfortheanalysesconducted.Adatashare
agreementwiththeIndianaDepartmentofEducationandIndianaUniversitythatincluded
educatorratings,studentassessmentoutcomes,andteacherevaluationplancharacteristics.
Thisdatawasusedtorunmultiplestatisticalanalysestodeterminepossiblerelationships
associatedwiththedataobtainedthroughthisagreement.
Keyfindings:
1) ThereisadiscrepancybetweenIndividualGrowthModelratingsofteacher
effectivenessandthesummativeratingsgiventeachersbytheirevaluators.
2) Thereisnotanidentifieddifferenceinteacherratingsandstudentoutcomesassociated
withthegrowthweightusedinevaluationplans.
3) StudentpovertylevelasdesignatedbyFreeandReducedLunchstatusisthesinglemost
powerfulpredictorofteacherevaluationratingsandstudentlearningoutcomes.
4) Thereissomeevidenceofarelationshipwiththedevelopmentandimplementationof
highqualityplanswithteachereffectivenessratingsandstudentoutcomes.
3
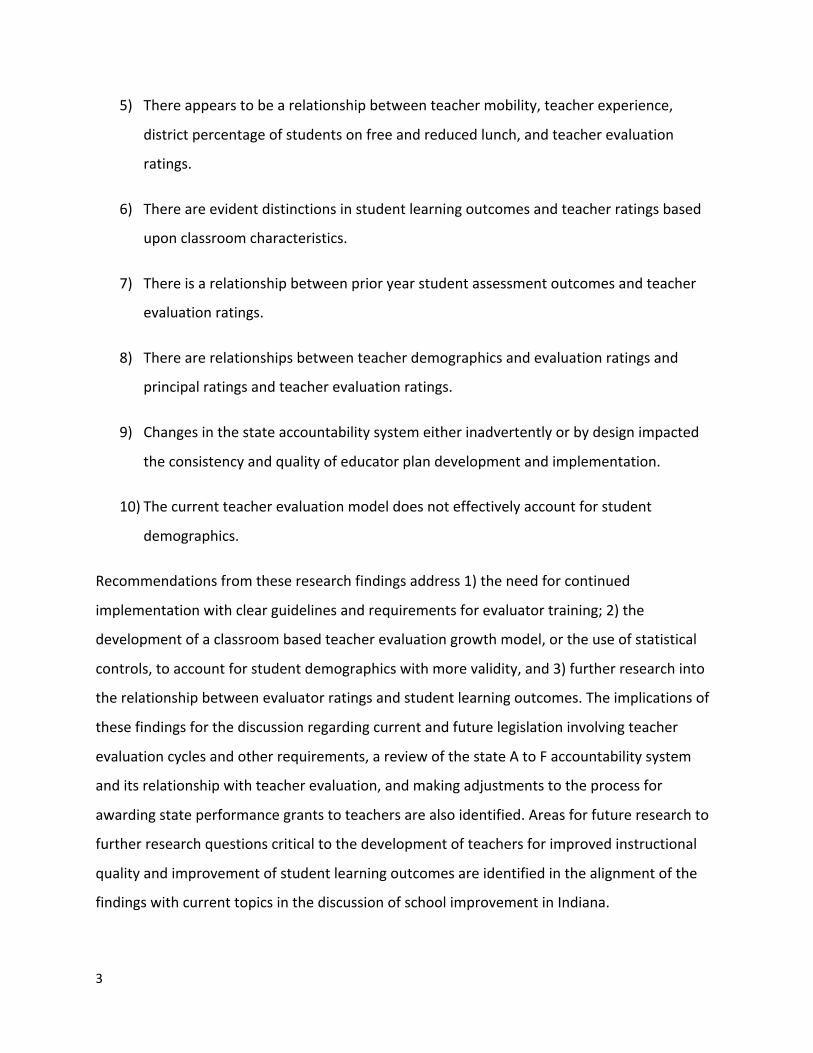
5) Thereappearstobearelationshipbetweenteachermobility,teacherexperience,
districtpercentageofstudentsonfreeandreducedlunch,andteacherevaluation
ratings.
6) Thereareevidentdistinctionsinstudentlearningoutcomesandteacherratingsbased
uponclassroomcharacteristics.
7) Thereisarelationshipbetweenprioryearstudentassessmentoutcomesandteacher
evaluationratings.
8) Therearerelationshipsbetweenteacherdemographicsandevaluationratingsand
principalratingsandteacherevaluationratings.
9) Changesinthestateaccountabilitysystemeitherinadvertentlyorbydesignimpacted
theconsistencyandqualityofeducatorplandevelopmentandimplementation.
10) Thecurrentteacherevaluationmodeldoesnoteffectivelyaccountforstudent
demographics.
Recommendationsfromtheseresearchfindingsaddress1)theneedforcontinued
implementationwithclearguidelinesandrequirementsforevaluatortraining;2)the
developmentofaclassroombasedteacherevaluationgrowthmodel,ortheuseofstatistical
controls,toaccountforstudentdemographicswithmorevalidity,and3)furtherresearchinto
therelationshipbetweenevaluatorratingsandstudentlearningoutcomes.Theimplicationsof
thesefindingsforthediscussionregardingcurrentandfuturelegislationinvolvingteacher
evaluationcyclesandotherrequirements,areviewofthestateAtoFaccountabilitysystem
anditsrelationshipwithteacherevaluation,andmakingadjustmentstotheprocessfor
awardingstateperformancegrantstoteachersarealsoidentified.Areasforfutureresearchto
furtherresearchquestionscriticaltothedevelopmentofteachersforimprovedinstructional
qualityandimprovementofstudentlearningoutcomesareidentifiedinthealignmentofthe
findingswithcurrenttopicsinthediscussionofschoolimprovementinIndiana.
4
Introduction
InJulyof2015,theIndianaStateBoardofEducation(SBOE)andtheJoyceFoundationengaged
theIndianaTeacherAppraisalSystemofSupports(INTASS)inamulti-facetedresearchanalyses
ofthechangestoeducatorevaluationrequiredbythepassageofSenateBill1in2012.This
researchincluded1)areviewofplanqualityandcompliancewiththelaw’srequirementsand
2)acomprehensiveresearchoffactorsrelatedtoeducatorevaluatorratingsandstudent
outcomes.
Thepurposeofthisreportistosharetheresultstodateofthisongoingandcomprehensive
researchoffactorsrelatedtoeducatorevaluatorratingsandstudentoutcomesinIndiana.The
reportisorganizedintosevensections:Introduction,ResearchQuestions,IndianaHistoryof
Accountability,Methods,Results,ConclusionsandRecommendations.
Changestoteacherevaluationresultinginaprocessformallystructuredaroundbestpractices
ingoalsetting,instructionalobservationandfeedbackandtheincorporationofstudent
learningoutcomesemergedintheschoolreformliteratureinthelastdecade.Research
documentationofschoolandstudentcharacteristicsandtheirrelationshiptostudent
outcomesgeneratedadatabasedframeworkforthedevelopmentoffederalandstate
accountabilitysystems.
WiththeadventofRacetotheTopanditsrequirementsandallowancesforstatewaiversin
qualifyingforcompetitivegrantfundscametheuseofeducator/teacherevaluationand
studentoutcomesintheaccountabilityframework.Theresponsetochangesintheprocessof
educatorevaluationincorporatingstudentlearningoutcomesacedsignificantchallengesinan
efforttobecomeaviablecomponentoftheschoolimprovementprocess.Howtomakethe
processequitableacrosssubjectareasandgradelevelsstressedtheconceptoffairnessand
differentialtreatmentforthoseinsubjectareasandgradelevelsthatwerepartofthestate
accountabilityassessmentsystemandthosewhowerenot.

5
Thereliabilityandvalidityofstudentoutcomemeasuresandthemetricsusedforcalculating
growthandproficiency,evaluatortrainingandinterraterreliability,andtheappropriatenessof
amultitudeofevaluationrubricsthreatenedthecredibilityofratingsthatweregiventhrough
thesenewprocesses.Linkingtheratingstocompensationheightenedadversarialrhetoricina
contentiousdebateandprecipitatedanethicsdrivencommentarythatquestionedboththe
motiveandimpactofthesenewevaluationprocessesupontheteachingandlearning
experiencesacrosstheK-12spectrum.
Educatorapprehensionanddebateinthepolicyandresearchcommunityabouttheimpactof
studentincomeontheperceptionandeffectivenessofteachersindependentofstudent
outcomesfurthercomplicatestheunderstandingofthesenewevaluationapproachesandtheir
possiblebenefit.Ongoingdialogueamongthoseinvolvedintheactualprocessofevaluation-
superintendents,principalsandteachers-thatindicatessimilarlyskepticalviewsonsomeofthe
samecriticalissuesbegsthequestionofwhethertheintentoflegislationandpolicywillbe
realizedinaprocessofimplementationwithfidelityunlessmajorconcernsareaddressed.
Similarly,aredefinitionofthefederalroleinaccountabilityrepresentedbyeveryStudent
SucceedsActincludingitsrequirementsandexpectationsforteacherevaluation,only
underscoretheimpactofchangingpolicyandguidanceatthestateleveluponinterpretation
andimplementationatthelocallevel.
Finally,thisresearchisbeingconductedoveratimeofconsiderableturbulenceintheIndiana
accountabilitysystemwithchangesinstandards,assessments,andleadershiphappeninginan
oftenerraticfashion.Inspiteoftheseissues,Indiana’sstudentshaveperformednotablybetter
onthebi-annuallyadministeredNationalAssessmentsofEducationalProgress(NAEP).In
comparisonwithperformanceofotherstates,thisimprovementsincethepassageofthe
teacherevaluationlegislationin2012hasearnedrecognitioninthestateandnationalpressin
eachoftheNAEPadministrationsoverthepastfouryears.Theresultsofthisresearchare
intendedtoshedfurtherinsightabouttheimportantrelationshipsofeducatorandstudent
demographics,districtandschoolcharacteristics,andteacherevaluationpracticeswith
6
educatorratingsandstudentlearningandtoofferasetofrecommendationsformoving
forward.
IndianaHistoryofEvaluations,StateAssessmentandAccountabilityand
impactUponResearch
Theeffectofaconstantlyshiftingaccountabilityenvironmentandrecurringproblemsinthe
state’smanagementofitsaccountabilitysystempresentedanongoingchallengeinreaching
comparabilityamongdatafilesacrossmultipleyearsconsistingofinformationfromeducators,
students,districts,schoolsandclassroomsinthestate.Datacharacteristicsandteacher
evaluationplanenvironmentdifferedineachresearchyear.
Thereweretestchangesinthreeofthefouryears.TherewererecurringproblemsinISTEP
scoring.Therewerepervasiveissueswithtimelinessofresultsandprovidingtestresultsto
schoolsforuseininstructionalplanning.Implementationofteacherevaluationplanshasbeen
inconsistentacrossthefouryearsoftheresearch.Thisinconsistencyinplandevelopmentand
implementationisdueinparttoconflictinginterpretationofpolicyandguidanceis
documentedinpreviousreportsandpolicybriefs(INTASSPlanReviewreporttoSBOE,2016).
Additionally,theholdharmlessprovisioninaccountabilitychangedtheclimateofevaluation
expectationsandconsequencesofstudentperformance.Theintroductionofnew
methodologies,e.g.,technologyandopen-endedresponsequestionsfurthercomplicatedthe
administrationofthestate’saccountabilitytest.
Changesinstatestandardsshiftedtheinstructionalemphasisinclassroomsacrossthestate,
andchangesinincentivesforeducatorperformance,e.g.,competitivegrants,contributedtoa
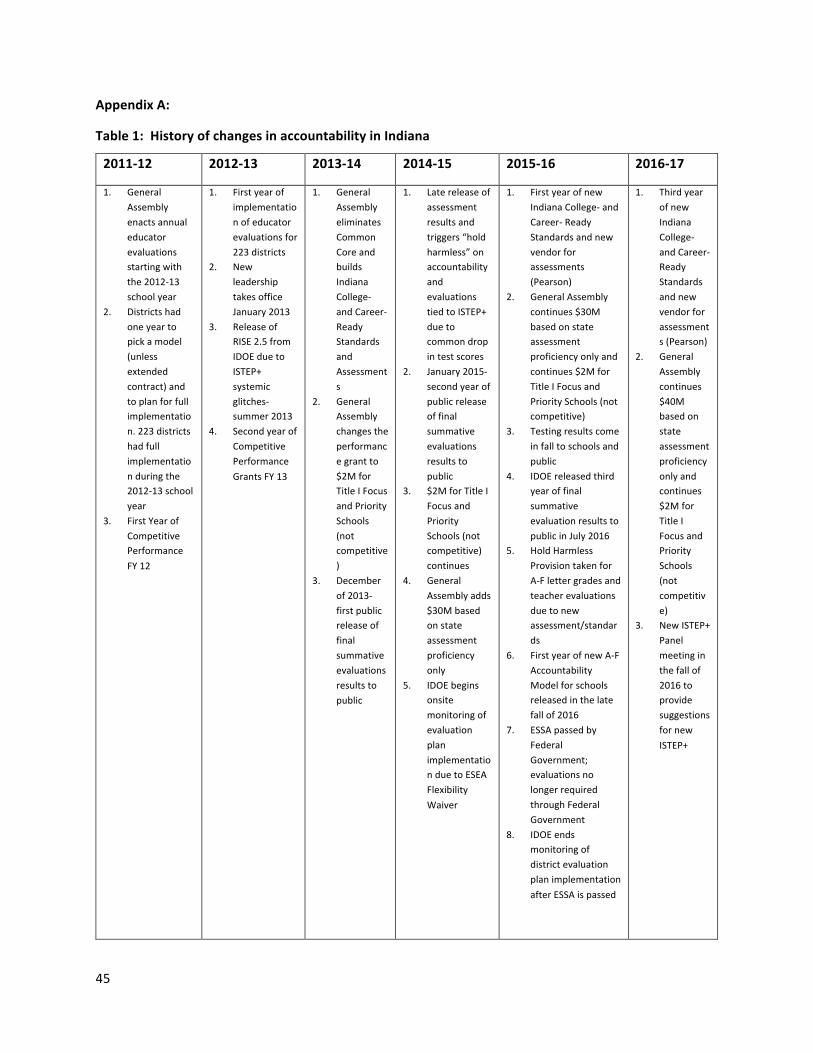
generalsenseofunfairnessintheevaluationplanexperience.Thesechangesineducator
evaluation,andstateassessmentforaccountabilityovertheyearsoftheresearchisillustrated
inAppendixA,Table1.
Additionalproblemswerepresentedasaresultofambiguityinlegislativelanguageandpolicy
practices.Thisambiguityresultedinerraticsubmissionofdatafromschoolsanddistrictsacross

7
thestateand“looseness”intheguidanceprovideddistrictsintheirmanagementand
implementationteachersevaluationcreatedadditionalchallengesinthequestionsthatcould
beresearchedinmethodologicallysoundwaysandtheidentificationofanalysesthatmet
acceptableresearchstandards.Changingstandards,differenttestsforaccountability,lessthan
stellarvendorperformance,differencesininterpretationofwhichstudentsshouldbeincluded
inaccountabilityandteacherevaluationandhowstudentswereassignedtoteachersfor
accountabilitypresentedcomparabilityproblemsinsamplesthatconfoundedmanyanalyses.
Similarly,inconsistenciesindataentryandcodingacrossyearsatthestatelevelcomplicated
filecomparability.Thepracticeofonlyrequiringsummativeratingstobereportedfrom
districtsmeantthatstudentlearningoutcomescouldonlybeanalyzedforthoseteachers
receivingIGMratingsandtherelativedifferencesinweightsfordifferentstudentlearning
measuresintheevaluationplandesignwasbeyondthemethodologyofthisstudy,because
thoselearningoutcomesarenotincludedinthedataprovidedfromdistricts.Similarly,thefact
thatsomedistrictsdidnotimplementthelearningoutcomesrequirementandothersdidnot
dosowithindividualteachers,butratherinterpretedtherequirementasbeingmetbyusingA
toFgradesattheschoollevelforallteachersmeantthatnotalldistrictscouldbetreatedinthe
samewayintheanalyses.
Theaforementionedpresentedachallengeinthedevelopmentofaresearchmethodologythat
mightyieldresultswithvaluableinsights.Althoughitisimportanttomentionthisimportant
limitationattheoutset,thefindingsofthisreportdoprovideasightinintotheimpactof
teacherevaluationinIndianathatenableusefulrecommendationsforimprovingtheteacher
evaluationprocessinIndiana.
ResearchQuestions
Toaddressmanyofthesignificantquestionsconcerningteacherevaluationandtosome
extent,schoolaccountability,asetofresearchquestionsweredevelopedthatincludedplan
qualityandcharacteristics,educatorandstudentdemographics,anddistrict,school,and
classroomprofiles.Thefollowingresearchquestionsguidedthisstudy:
8
1. Istherearelationshipbetweenevaluationplanqualityandteacherevaluationratings-
summativeand/orIGM?
2. Istherearelationshipbetweenevaluationplanqualityandstudentlearning/assessment
outcomes?
3. Istherearelationshipbetweenteacherevaluationratingsandstudentoutcomes?
4. IstherearelationshipbetweenteacherIGMratingsandSummativeratings?
5. Istherearelationshipbetweenteacher/evaluator/studentdemographicsandteacher
evaluationratings?
6. Istherearelationshipbetweenteacher/evaluator/studentdemographicsandstudent
outcomes?
7. Istherearelationshipbetweenclassroom,schoolanddistrictdemographicsandteacher
ratings?
8. Istherearelationshipbetweenclassroom,schoolordistrictdemographicsandstudent
outcomes?
Theresultsoftheanalysesconductedforthisreportattempttoanswerthesequestionsfor
teacherevaluationinthestateofIndianaandareintendedtohelpintherepackagingof
educatorevaluationasaconstructivetoolforsuccessfulteachingandlearning.Inorderforthis
tohappen,criticaldecisionsregardinglegislation,policyandguidancewillberequired.Itis
hopedthatthefindingsinthisreportwillbehelpful.
Method
Asmentionedintheintroductiontothissection,changesintheaccountabilitysystemthat
impactedthecomparabilityofstudenttestresultsandteacherevaluationoutcomesacross
yearsmadetheresultsoflongitudinalanalysesacrossyearsquestionable.Awithinyears
methodwasoptedfortoresearchquestionsconcerningrelationshipsamongthemultitudeof
9
variablesincludedintheresearchquestions.Thisallowedforthevariablerelationshipstobe
analyzedforeachyearofthedatasetandthencomparedwitheveryotheryear.Althoughnota
longitudinalanalysisperse,comparingtheresultsofeachyearallowedadeterminationof
whetherornottheresultsofanyparticularyearwereconsistentacrossyears.Further,looking
atsimilaritiesanddifferencesbetweenthosedistrictsandschoolsthatbeganimplementing
plansinresponsetothelegislationfrom2012allowedsomeinquiryoftheeffectoftimeupon
variablerelationshipsacrosstheyearsofthedatasets.
Additionally,decisionshadtomaderegardingdatatobeincludedorexcludedinorderto
accountforvariationsindataquality.Inadditiontochangesinthetestingandaccountability
environmentandalackofreplicabilityacrossyearsthatcreatedincomparabilityacrossthefiles
inthedatasets,variationsininterpretationsofguidanceandpolicyrequiredadjustmentsin
whichdatawastobeusedinananalysisorsetsofanalyses.
Adjustmentswerealsomadeinanalysismodelstoalignstudenttestresultsandthe
accountabilitysystemwithteacherevaluationrequirements,andtoaddressdemographic
differencesacrossdistrictsschoolsandclassrooms.Forinstance,theaccountabilitysystem
requiresanattendanceofatleast162daysinorderforastudenttestresulttobeincludedin
theaccountabilityresultsfordistrictsandschools.Howtoaccountforanomaliesdueto
fluctuationsattheextremesofthestudentperformancedistributionsothatanalyseswould
actuallyreflectthetruerelationshipofinstructionandstudentperformancewasfactoredin
someanalyses.Intheend,avarietyofdemographicvariables,planattributes,student
performanceresults,anddistrictcharacteristicswereanalyzedinanarrayofvariableand
modelconfigurationstoensurethatallsystematicinfluencesuponevaluationratingsand
studentoutcomeswereaccountedfor.
Thesizeofthesamplesandthelargenumberofanalysesrequiredtheuseoflevelsof
significancetoaccountforthepossibilitythatsignificancecouldactuallyoccurbecauseof
randomandchanceratherthananyvalidrelationshipbetweenthevariablesbeingresearched.
Toaccountforthisandreducethechanceofattributingsignificancewhereitdoesnotexist,
veryconservativevaluesof.01and.001wereusedtoattributesignificance.Itisimportantto
10
establishthattheresearchpresentedinthisstudyisdescriptiveandestablishesassociations
betweenthevariablesinquestionandnotcausalitybetweenandamongthequestioned
relationships.
Note:InthisreportFreeandReducedlunchwasusedtodetermineSocialEconomicStatus
(SES).
DataCollection
ThegeneraldatasetincludedfilesobtainedfromtheIndianaDepartmentofEducationthrough
aDataShareAgreementcoveringtheschool-years2012-2016.Thedatainthefilesconsistedof
student,teacher,andprincipaldemographicinformation,resultsofISTEPassessments,and
educatorevaluationratings.Forteachersintheaccountabilitygradesandsubjectareas,both
IGMandsummativeratingswereavailable.Forotherteachers,onlysummativeratingswerein
thefiles.
Noinformationinthefilesallowedfortheidentificationofanyindividualwhosedataattributes
wereincludedintheanalysesconductedtoanswerresearchquestions.Otherrelevantdata
includeddistrict,school,andclassroomcharacteristics,andlocaldistrictteacherevaluation
plansandplancomponentsorattributes.Theplanattributeswereresearchedbasedupona
ratingofplanqualitybytrainedratersusingascalederivedfromtheINTASSplandevelopment
rubric(INTASSPlanReview,2016).Planswererankedwithotherplansinthestatebasedupon
theiroverallscorefromtheplanattributeratings.Pointsassociatedwiththeserankingswere
usedtoconductanalysesofplanqualityandteacherandstudentoutcomes.
DataComposition
Foreachyear,datafromtheIDOEonstudents,teachers,anddistrictswerecombinedintoa
masterfile.ThisfileincludesdatafromtheENROLLdataset,whichincludesstudent
demographics;theADdataset,whichincludesinformationonstudenthomelessnessandhigh
ability;theESdataset,whichincludesinformationonstudentexpulsionsandsuspensions;the
ATTENDANCEdataset,whichincludesinformationonstudentattendance;theISTEP+dataset,
whichincludesinformationonthestudents’ISTEPperformance;theCPdataset,whichincludes
11
informationoncertifiedteachers’positions;theERdataset,whichincludessummativescores
forteachers;theTEACHERSdataset,whichincludesIGMratingsforteachers;theGRADUATION
RATESdataset,whichincludesgraduationratesattheschoollevel;theEXPENDITURESdataset,
whichincludesyearlyexpendituresattheschoollevel;andtheGROWTHWEIGHTSdataset,
whichincludescorporation-levelgrowthweightsappliedtoIGMratingsforthesummative
scorefordistrictswhowereusinggrowthweightsinthatyear.Theschoolanddistrict-level
datasetswerelinkedtostudentsandteachersbytheIDOECORPORATIONID,andthestudent
andteacherdatasetswerelinkedusingtheEEdataset,whichincludesalllinkagesbetween
studentsandteachersforIGMratingpurposes,alongwithinformationaboutwhetherthe
teacherisaccountableforthestudent’sISTEP+ELAperformance,Mathperformance,orboth.
DataCleaning
Beforeanalyzingthedata,thegrowthweightsappliedbydistrictstoIGMratingsweremean-
centeredbyyear.TheadjustedmediangrowthpercentilesusedtodetermineIGMratingswere
alsocalculatedby(1)findingthemediangrowthpercentileofstudentsassignedtoeach
teacher,(2)findingthestandarderrorofthegrowthpercentilesofstudentsassignedtoeach
teacher,and(3)addingthemedianfoundin(1)tothe1.25timesthestandarderrorfoundin
(2).Thisisinalignmentwiththemethodofdeterminingadjustedgrowthpercentilesoutlined
bytheIDOEfordeterminingteacherIGMratings.Thisnumberessentiallyrepresentsthe
teacher’s“bestcasescenario”fortheirstudents’growth,andissensitivetoboththegrowthof
thestudentsaswellasthevariationingrowthintheclassroom.
Fordatatobeconsideredvalidforanalysis,thedatasetscouldhavenoconflictingreportson
theschoolanddistrictIDsassociatedwithastudentand/orteacher.ForanalyseswithISTEP
scalescoresastheoutcomevariable,datasetswererequiredtohavenoconflictingreportson
district,school,orgradelevel.
Teacherswhohadjob/rolechangesorhadconflictingrecordsbetweenPeriod1and2ofa
givenyearwerealsoeliminatedfromtheanalysestoeliminateuncertaintyaboutthevalidityof
ourdata.Ateacherwasconsideredtohavechangedjobsifthecertifiedemployeerecord
indicatedachangeintheirdistrictornumberofdayscontracted.Ateacherwasconsideredto
12
haveconflictingrecordsiftheprioremploymentcode,degreecode,first-yearteacherindicator,
salary,orpercentofsalarypaidbyTitleIchanged.Whileitispossiblethatateachercouldhave
earnedaraise,completedtheirfirstyearofteaching,orearnedadegreeduringtheyear,these
teacherswereeliminatedtoremoveuncertaintyfromtheestimationoftheeffectsofthese
variablesonstudentandteacheroutcomes.
Models
Analysesmodeledtheeffectsofanumberofdifferentcombinationsofvariablesonanumber
ofdifferentoutcomes.Specifically,analysesinvestigatedtherollofstudentdemographics,
teacherdemographics,anddistrictdemographicsontwomeasuresofISTEPperformance(the
student’sscalescoreandthestudent’sgrowthpercentile)andonthreemeasuresofteacher
performance(theIGMrating,thesummativescore,andtheadjustedmediangrowth
percentilesusedtodeterminetheIGMrating).seeAppendixA,Table2.
Studentdemographics
Studentdemographicpredictorsetsincludecombinationsofsocio-economicstatus,special
educationstatus,ethnicity,EnglishLanguageLearnerstatus,attendance,grade(Middlevs.
Elementary)andcontentarea,whereappropriate.Additionalvariablesusedinselectmodels
includeanexpulsion/suspensionindicator,and/ortheISTEPgrowthpercentilefromtheprior
yearandtheISTEPscoresfromthepriortwoyears.Resultsusinghomelessnessstatusandhigh
abilitystatusarealsoavailablebutunreported.
MostanalysesusingstudentdemographicsaspredictorsalsoincludePrimaryExceptionalityas
afixedeffect,exceptwhenitsinclusioncausesthemodelstofailformathematicalreasons
beyondthescopeofthisreport.PrimaryExceptionalityisacategoricalvariablewithover
twentylevels,whichaddsexcessivecomplexitytosomeofthelogisticandmultinomialmodels.
AnalysesusingstudentdemographicstopredictISTEPScoresalsoincludestudentgradelevelas
afixedeffect.However,becausegradelevelwasnotfoundtobeasignificantfactorinISTEP
growth,itisnotincludedasafixedeffectformodelsusingISTEPGrowthorTeacherRatingsas
outcomes.
13
Educatordemographics
Teacherdemographicpredictorsetsincludeanindicatorforwhethertheyareafirst-year
teacher,experience(0-5yrs.,6-10yrs.,11-20yrs.,and21+yrs.),salary,percentofsalarypaid
byTitleIfunds,teacherethnicity,teachergender,thenumberofdaystheteacheriscontracted
towork,theaveragegradeservedbytheteacher,andwhethertheteacherisamiddleschool
(7/8grade)orelementaryschool(4/5grade)teacher.Thesevariablesareincludedinanalyses
ofteacherdemographics’relationshipswithstudentoutcomesaswellastheirrelationships
withIGMratings.
WhenanalyzingteacherdemographicsandSummativeRatings,theteachersarefurthersplit
intoananalysisofjustthosewithorwithoutanIGMrating,toinvestigatedifferencesinhow
teachers’summativeratingsdifferforteachersthatareversusarenotsubjecttoIGMrating.
Thesegroupsarealsocombinedforaviewoftheoverallrelationshipofteacherdemographics
withSummativeRatings.
Theseanalysesarealsorestrictedtoteacherswhoarenotlistedasaprincipalor
superintendentintheCertifiedPositionfile.Anadditionalanalysiswasdoneusingonly
principals,toinvestigaterelationshipsbetweenprincipaldemographicsandthesummative
ratingsreceivedbyteachersattheirschools(whomtheypresumablyevaluateaspartofthe
summativeratingprocess).Principaldemographicsincludeprincipalethnicity,principalgender,
principalexperience(0-5yrs.,6-10yrs.,11-20yrs.,and21+yrs.)-andthegradeforwhichthe
teacherbeingevaluatedisresponsible-i.e.,whethertheteacherbeingevaluatedisamiddle
school(7/8grade)vs.elementaryschool(4/5grade)teacher.Lastly,weincludetheprincipal’s
summativeratingashighlyeffective,effective,improvementnecessary,ineffective,ornot
applicable(notevaluated).
Districtdemographics
Themostfrequentlyincludedvariableusedtoassesstheeffectofdistrictdemographicsisthe
mean-centeredgrowthweightappliedbythedistrictindeterminingsummativeratings.District
14
weightongrowthisincludedinallanalysesofstudentdemographicsonstudentandteacher
outcomes,teacherdemographicsonteacheroutcomes,principaldemographicsonsummative
ratings,anddistrictdemographicsonstudentandteacheroutcomes.Districtweightongrowth
isalsoincludedinthespecialanalysesoffourthandfifthgradeintactclassrooms.Otherdistrict
demographicsincludedonlywhenspecificallyfocusingontheeffectofdistrictdemographicson
studentandteacheroutcomesare:districtaverageISTEPscore,districtaverageISTEPgrowth
percent,districtgraduationrate,districtexpendituresonstudents,districtpercentageof
studentsonfreeandreduced-pricelunch(FRL),andwhetherthestudentorteacherisin
elementary(4/5grade)ormiddle(7/8grade)school.
Modelspecifications(SeeAppendixA,Table2)
Avarietyofmodelswereemployedintheanalyses.Mostmodelsuseoneobservationper
student(forstudentdemographicpredictors)orteacher(forteacherdemographicpredictors),
butwhenanalyzingtheeffectofstudentdemographicsonteacheroutcomes,aseconddataset
wasconstructedthataggregatesthestudentdataattheteacherlevel.Forexample,onesetof
specificationsincludestheindividualdemographicsofeachstudentinpredictingteacher
ratings(whileaccountingforteachereffectsnestedwithinschooleffects),whileanotherlooks
atthepercentagesofstudentsassignedtoateacherthatareonFRL,areinspecialeducation,
areEnglishlanguagelearners,areminorityethnicities,etc.,inpredictingteacherratings.We
callthesemodelsusingpercentagesratherthanindividualobservations“aggregate”models.
Formodelsusingstudentdemographicsaspredictors,thereareeightspecificationsemployed.
• Fullmodelincludesallvaliddata,andisageneralizedlinearmixedmodelthatincludes
schooleffectsnestedwithindistricteffects.Furthermore,studentsmusthaveattended
schoolaminimumof162days,exceptintheaggregatemodels.
• Elemvs.Middlefiltersthefullmodeltoincludeonlystudentsin4th,5th,7th,and8th
grades.Since6thgradeisconsideredelementaryinsomedistrictsandmiddleschoolin
others,6thgradersarenotincludedinthisspecification.
15
• Middle68%ofStatefiltersthefullmodeltoincludeonlystudentswhoseISTEPscores
(forISTEPscoresasoutcome)orISTEPgrowthpercent(forallotheroutcomes)werein
themiddle68%ofthestateISTEPscoresorgrowthpercents,respectively.
• Middle68%ofState+Elemvs.Middleincludesfiltersonthefullmodeldescribedin
bothoftheaforementionedspecifications.
• Middle68%ofDistrictfiltersthefullmodeltoincludeonlystudentswhoseISTEPscores
(forISTEPscoresasoutcome)orISTEPgrowthpercent(forallotheroutcomes)werein
themiddle68%oftheirdistrict’sISTEPscoresorgrowthpercents,respectively.This
meansthatstudentsinparticularlyweakorstrongdistrictsthatwerenotincludedinthe
middle2/3ofthestatebutwhorepresentthe“average”studentwithintheirdistrictare
includedinthismodel,resultinginawidervarietyofISTEPperformanceandalooser
definitionofthe“averagestudent”inIndiana.
• Middle68%ofDistrict+Elemvs.Middleincludesfiltersonthefullmodeldescribedin
bothoftheaforementionedspecifications.
• ELAAccountablefilterstheaggregatedatasetpreviouslydescribedtoincludeonlythe
effectsofstudentdemographicsonIGMratingsforteacherswhoareaccountablefor
theELAperformanceofthosestudents,andincludethemeanISTEPgrowthandscores
oftheirstudents.
• MATHAccountablefilterstheaggregatedatasetpreviouslydescribedtoincludeonlythe
effectsofstudentdemographicsonIGMratingsforteacherswhoareaccountablefor
themathperformanceofthosestudents,andincludethemeanISTEPgrowthandscores
oftheirstudents.
Formodelsusingteacherdemographicsaspredictors,therearetenspecificationsemployed.
Forteacherdemographics’effectonstudentoutcomes:

16
• ELAmodellooksattheeffectofteacherdemographicsonlyonstudentELA
performance.
• ELA+Elemvs.MiddlefilterstheELAmodeltoincludeonlystudentsin4th,5th,7th,and
8thgrades.
• ELA+PriorYear(s)PerformanceaddsvariablestotheELAmodelforpriorISTEP
performanceinELA.FortheISTEPscoreoutcome,thisincludestheprioryearaswellas
thetwoyears’priorscore.FortheISTEPgrowthoutcome,thisincludesthepriorISTEP
growthinELA.
• MATHmodellooksattheeffectofteacherdemographicsonlyonstudentELA
performance.
• MATH+Elemvs.MiddlefilterstheELAmodeltoincludeonlystudentsin4th,5th,7th,
and8thgrades.
• MATH+PriorYear(s)PerformanceaddsvariablestotheELAmodelforpriorISTEP
performanceinELA.FortheISTEPscoreoutcome,thisincludestheprioryearaswellas
thetwoyears’priorscore.FortheISTEPgrowthoutcome,thisincludesthepriorISTEP
growthinELA.
Forteacherdemographics’effectonteacherratings:
• Fullmodelisthesameaspreviouslydescribed.
• Elemvs.Middleisthesameaspreviouslydescribed.
• ELAAccountableisthesameaspreviouslydescribed.
• MATHAccountableisthesameaspreviouslydescribed.
Forprincipaldemographics’effectonteachersummativeratings:
17
• Fullmodelisthesameaspreviouslydescribed.
• Elemvs.Middleisthesameaspreviouslydescribed.
Formodelsusingdistrictdemographicsaspredictors,therearefourspecificationsemployed.
• Fullmodelisthesameaspreviouslydescribed,exceptitincludesteachereffectsnested
withinschooleffects.Schools’datamaybecorrelatedduetomembershiptoadistrict;
teachers’datamaybecorrelatedduetomembershiptoaschool;andstudents’data
mightbecorrelatedduetomembershiptoateacher.
• Elemvs.Middleisthesameaspreviouslydescribed,exceptitincludesteachereffects
nestedwithinschooleffects.
• Middle68%ofStateisthesameaspreviouslydescribed,exceptitincludesteacher
effectsnestedwithinschooleffects.
• Middle68%ofDistrictisthesameaspreviouslydescribed,exceptitincludesteacher
effectsnestedwithinschooleffects.
Formodelsfocusedonlyonfourth/fifthgradeintactclassrooms,therearethreespecifications
employed.
• 4th/5thGradeOnly+NoSpecialEdTeachers+MathandELAAccountableincludesonly
teachersandstudentsinfourthgradeclassroomswheretheteacherisaccountablefor
boththestudent’smathandELAaccountable.Thedatasetisfurtherfilteredtoinclude
onlystudentswhoarelinkedtoonlyoneteacher.Furthermore,theteachermustbe
linkedtoeither15-27students(onesetofresults)or20-32students(alternatesetof
results).TheseteachersmustnotbeidentifiedasspecialeducationteachersintheCP
file.Restrictionsalsorequirethestudentstohaveattendedatleast162days,and
teachereffectsarenestedwithinschooleffectswithnoeffectfordistrict.
18
• +ELAGrowthfiltersthepreviousmodeltoincludeonlystudentdataattachedtoanELA
score.Inotherwords,ateachercanbelistedintheEEfileasaccountableforastudent’s
ELAandMATHperformance,butthestudenthasonlyoneortheotherperformance
recordedintheISTEP+file.Fortheaggregatedatasets,prioryear(s)ELAISTEPscores
andgrowtharealsoincluded.
• +MathGrowthfiltersthepreviousmodeltoincludeonlystudentdataattachedtoa
MATHscore.Fortheaggregatedatasets,prioryear(s)MathISTEPscoresandgrowthare
alsoincluded.
FormodelsinvestigatingdemographicsandISTEPscores,thescoreswereconsideredtobe
continuous,andalinearmodelwasassumed.FormodelsinvestigatingdemographicsandISTEP
growth,thescoreswerealsoconsideredtobecontinuous,andalinearmodelwasassumed.A
modelwithoutcomesboundedbetween0and100wasalsoconsidered,buttheunbounded
modelresultedinamuchlowerAkaikeInformationCriterion(AIC),whichsuggeststhatlower
valuesdemonstratebetter,moreparsimoniousmodels.Formodelsinvestigatingtheeffectof
demographicsontheAdjustedGrowthPercentsusedtodetermineIGMratings,theadjusted
growthpercentswereconsideredtobecontinuous,andalinearmodelwasassumed.For
modelsinvestigatingdemographicsandIGMratings,amultinomialmodelwasassumed,with
anordinalrelationshipbetweenratingsof1,2,3,and4.Teacherswitharatingof0,indicating
theIGMratingwasnotapplicable,werenotincludedintheanalyses.Formodelsinvestigating
demographicsandsummativeratings,alogisticsmodelwasassumed,groupingtheteachers
rated1-3togetherandcomparingthemtoteachersrateda4.Thiswasdonebecauseofthe
verylowpercentageofteachersrateda1(lessthan1%)ora2(lessthan3%).
PlanQuality/AttributeInvestigation
Planquality,definedashowmanyoftheplanattributesspecifiedintheINTASSplanevaluation
rubricwerepresentinaparticularplan,andplanattributes,groupingofmajorratingscale
componentsbysub-category,wereanalyzedasanadditionalpredictorofstudentandteacher

19
outcomes.Thedatasetincludesindicatorsforthepresenceof37planattributesin223district’s
plansforhowteacherswillbeevaluated.
Formodelsusingtheplanattributesaspredictors,fourmodelspecificationswereemployed.
• Fullmodelisthesameasoriginallydescribed.
• Elemvs.Middleisthesameasoriginallydescribed.
• Middle68%ofStateisthesameasoriginallydescribed.
• Middle68%ofDistrictisthesameasoriginallydescribed.
The37attributeswereanalyzedatthreelevels.
• Totalsusethetotalscoreoutof37attributesastheonlypredictor.
• HighLevelusesthetotalscoreforeachcategory1.0through12.0aspredictors.
• Mid-Levelusesthetotalscoreforeachsubcategory(e.g.,4.1,4.2,4.3,etc.)as
predictors.
Eachanalysiswasperformedonthreesetsofdistricts.
• AllDistrictsincludeall223districtswhoseplanswereinvestigated
• EarlyAdoptersincludesonlythedistrictswhoputplansineffectin2012
• LaterAdoptersincludeonlythedistrictswhoputplansineffectafter2012
Foralllevelsanadditionalvariablewasincludedintheanalysisoftheplanattributes’effectson
ISTEPGrowththatindicatedwhetherornotthedistricthadbeenidentifiedasoneofthesix
“highlyeffective”districts.Thisvariablewasaddedtoresearchinsomedegreetheimpactof
implementationwithfidelityasthesedistrictsdistinguishedthemselvesintheIDOEmonitoring

20
processandwererecommendedbyIDOEstafffortheirimplementationofhighqualityplans
withfidelityandwererecognizedbytheSBOEfortheirefforts.
StatisticalSignificance
Forasinglemodel,analphaof1%(p<0.01)wasusedtoidentifyfindingsthatwereonly
marginallysignificant,versusanalphaof0.01%(p<0.001)forthosethatwerehighly
significant.Theseshouldbecontrastedwithconventionalmeasuresof0.1formarginally
significantresults,and0.05forhighlysignificant.Thethresholdwasloweredtoaccountforthe
largesamplesizewithinthedataset,whichhasatendencytodeflatethep-valuesthat
determinestatisticalsignificance.Moreover,multiplemodelswererunforeachoutcome
measured.Furtherdefinitionswereadoptedtodefinestrong,medium,andweaksupportfor
thestatisticalfindingsthatwerebasedupontheconsistencyofstatisticalsignificanceacrossall
models.
StatisticallyMeaningful
Themultiplemodelsandanalysesoftenprovidedawidearrayoffindingsthatdifferedin
significanceandinrelationshipstothevariablesbeinganalyzed.
Thefollowingscalewasusedtolabelvariablesignificanceacrosstheanalysesconducted:
None:Significantinnoneofthespecifications*years
Weak:Significantin25%orlessofthespecifications*years
Medium:Significantin75%orlessofthespecification*years
Strong:Significantinover75%ofthespecifications*years
Results
21
Relationshipbetweenstudentdemographics,studentoutcomesandteacherevaluation
ratings.
1. FreeandReducedlunchhasastrongnegativerelationshipwith:
a. StudentISTEPgrowthscores
b. GrowthpercentileusedforIGM
c. IGMratingsforteachers
d. Summativeratingsforallteachers
2. Ethnicity(Black,Hispanic,Multiracial)hasastrongnegativerelationshipwith:
a. ISTEPscores
3. Ethnicity(BlackandHispanic)hasastrongnegativerelationshipwith
a. GrowthpercentileusedforIGM
4. Ethnicity(Black)hasamediumnegativerelationshipwith:
a. ISTEPgrowth
b. IGMratings
5. Ethnicity(Hispanic)hasamediumnegativerelationshipwith:
a. IGMratings
b. Summativeratings
6. Ethnicity(Hispanic)hasaweaknegativerelationshipwith:
a. StudentISTEPgrowthscores

22
7. SpecialEducationhasamediumnegativerelationshipwith:
a. Summativeratings
8. SpecialEducationhasaweaknegativerelationshipwith:
a. StudentISTEPgrowthscores
9. SpecialEducationhasastrongnegativerelationshipto:
a. ISTEPscores
10. LimitedEnglishproficienthasastrongnegativerelationshipwith:
a. ISTEPscores
11. LimitedEnglishproficienthasamediumpositiverelationshipwith:
a. ISTEPgrowth
b. GrowthpercentilesusedforIGMratings
12. FluentEnglishproficienthasastrongpositiverelationshipwith:
a. ISTEPscores
b. ISTEPgrowth
13. FluentEnglishproficienthasamediumpositiverelationshipwith:
a. IGMteacherratings
b. GrowthpercentileusedforIGMratings
14. Studentethnicityiscorrelatedwithproficiencybuttheresultsweakenwhenwelookat
growth.Computinggrowthisn’tassensitivetostudentethnicity.
23
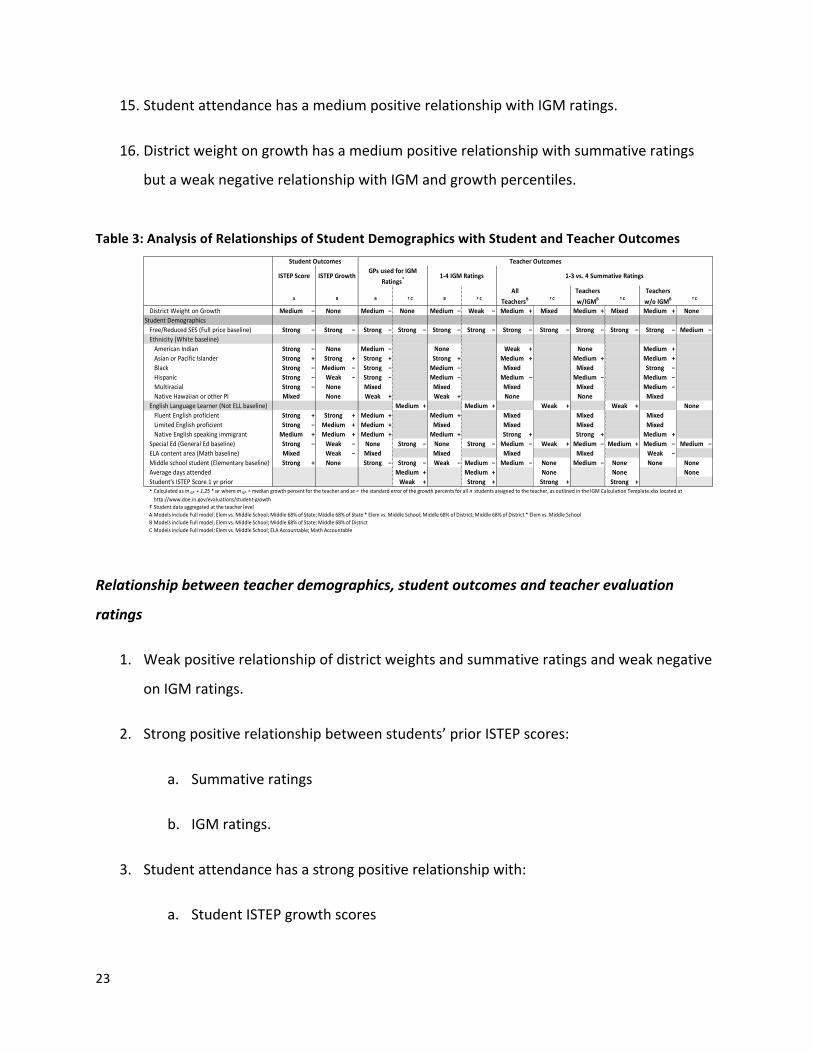
15. StudentattendancehasamediumpositiverelationshipwithIGMratings.
16. Districtweightongrowthhasamediumpositiverelationshipwithsummativeratings
butaweaknegativerelationshipwithIGMandgrowthpercentiles.
Table3:AnalysisofRelationshipsofStudentDemographicswithStudentandTeacherOutcomes
Relationshipbetweenteacherdemographics,studentoutcomesandteacherevaluation
ratings
1. Weakpositiverelationshipofdistrictweightsandsummativeratingsandweaknegative
onIGMratings.
2. Strongpositiverelationshipbetweenstudents’priorISTEPscores:
a. Summativeratings
b. IGMratings.
3. Studentattendancehasastrongpositiverelationshipwith:
a. StudentISTEPgrowthscores
DistrictWeightonGrowth Medium − None Medium − None Medium − Weak − Medium + Mixed Medium + Mixed Medium + NoneStudentDemographicsFree/ReducedSES(Fullpricebaseline) Strong − Strong − Strong − Strong − Strong − Strong − Strong − Strong − Strong − Strong − Strong − Medium −Ethnicity(Whitebaseline)AmericanIndian Strong − None Medium − None Weak + None Medium +AsianorPacificIslander Strong + Strong + Strong + Strong + Medium + Medium + Medium +Black Strong − Medium − Strong − Medium − Mixed Mixed Strong −Hispanic Strong − Weak − Strong − Medium − Medium − Medium − Medium −Multiracial Strong − None Mixed Mixed Mixed Mixed Medium −NativeHawaiianorotherPI Mixed None Weak + Weak + None None Mixed
EnglishLanguageLearner(NotELLbaseline) Medium + Medium + Weak + Weak + NoneFluentEnglishproficient Strong + Strong + Medium + Medium + Mixed Mixed MixedLimitedEnglishproficient Strong − Medium + Medium + Mixed Mixed Mixed MixedNativeEnglishspeakingimmigrant Medium + Medium + Medium + Medium + Strong + Strong + Medium +
SpecialEd(GeneralEdbaseline) Strong − Weak − None Strong − None Strong − Medium − Weak + Medium − Medium + Medium − Medium −ELAcontentarea(Mathbaseline) Mixed Weak − Mixed Mixed Mixed Mixed Weak −Middleschoolstudent(Elementarybaseline) Strong + None Strong − Strong − Weak − Medium − Medium − None Medium − None None NoneAveragedaysattended Medium + Medium + None None NoneStudent'sISTEPScore1yrprior Weak + Strong + Strong + Strong +*
† StudentdataaggregatedattheteacherlevelA ModelsincludeFullmodel;Elemvs.MiddleSchool;Middle68%ofState;Middle68%ofState*Elemvs.MiddleSchool;Middle68%ofDistrict;Middle68%ofDistrict*Elemvs.MiddleSchoolB ModelsincludeFullmodel;Elemvs.MiddleSchool;Middle68%ofState;Middle68%ofDistrictC ModelsincludeFullmodel;Elemvs.MiddleSchool;ELAAccountable;MathAccountable
†C
1-3vs.4SummativeRatings
TeacherOutcomes
CalculatedasmGP +1.25*se wheremGP =mediangrowthpercentfortheteacherandse= thestandarderrorofthegrowthpercentsforalln studentsassignedtotheteacher,asoutlinedintheIGMCalculationTemplate.xlsxlocatedathttp://www.doe.in.gov/evaluations/student-growth
AllTeachersB †C
Teachersw/IGMB †C
Teachersw/oIGMBB
GPsusedforIGMRatings*
†C B
1-4IGMRatings
†CA
ISTEPScore
B
ISTEPGrowth
StudentOutcomes
24
4. Studentattendancehasamediumpositiverelationshipwith:
a. IGMratings
b. GrowthpercentilesusedforIGMratings
5. Studentattendancehasaweakpositiverelationshipwith:
a. Summativeratings
6. Salaryhasamediumpositiverelationshipwith:
a. StudentISTEPgrowthscores
7. Salaryhasastrongpositiverelationshipwith:
a. IGMratings
8. Salaryhasaweakpositiverelationshipwith:
a. Summativeratings
9. Firstyearteachinghasastrongpositiverelationshipwith:
a. Summativeratings
10. Firstyearteachinghasmediumpositiverelationshipwith:
a. IGMratings
11. Teachers6-10yearsand11-20yearshaveastrongpositiverelationshipwith:
a. Summativeratings
12. Teachers21+yearshaveamediumnegativerelationshipwith:
a. StudentISTEPgrowthscores
25
b. GrowthpercentilesusedforIGMratings
c. IGMratings
13. Teachers21+yearshaveamediumpositiverelationshipwith:
a. Summativeratings
14. Maleteachershaveweaknegativerelationshipwith:
a. ISTEPgrowth
15. Maleteachershavemediumnegativerelationshipwith:
a. GrowthpercentileswithIGM
b. IGMratings
16. Maleteachershaveastrongnegativerelationshipwith:
a. Summativeratings
17. Middleschoolteachershaveastrongnegativerelationshipwith:
a. ISTEPscores
18. Middleschoolteachershaveamediumnegativerelationshipwith:
a. GrowthpercentilesforIGM
19. Middleschoolteachershaveaweaknegativerelationshipwith:
a. IGMratings
Table4:AnalysisofRelationshipofTeacherDemographicswithStudentandTeacherOutcomes
26
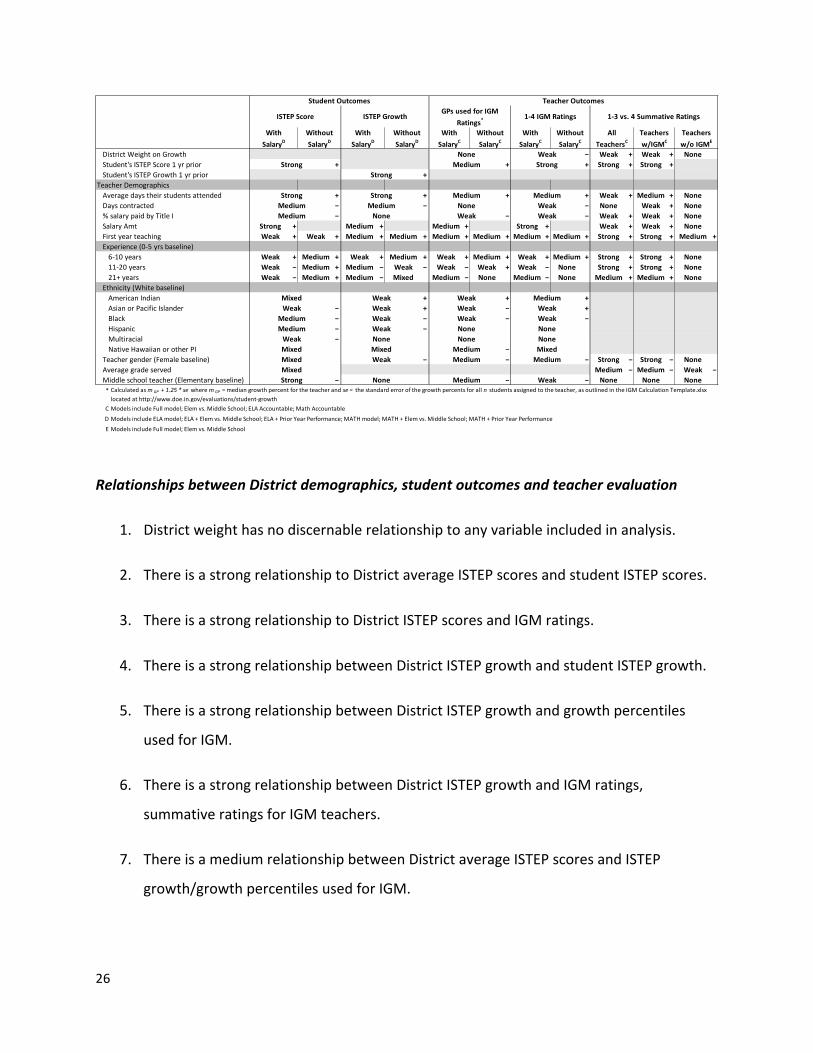
RelationshipsbetweenDistrictdemographics,studentoutcomesandteacherevaluation
1. Districtweighthasnodiscernablerelationshiptoanyvariableincludedinanalysis.
2. ThereisastrongrelationshiptoDistrictaverageISTEPscoresandstudentISTEPscores.
3. ThereisastrongrelationshiptoDistrictISTEPscoresandIGMratings.
4. ThereisastrongrelationshipbetweenDistrictISTEPgrowthandstudentISTEPgrowth.
5. ThereisastrongrelationshipbetweenDistrictISTEPgrowthandgrowthpercentiles
usedforIGM.
6. ThereisastrongrelationshipbetweenDistrictISTEPgrowthandIGMratings,
summativeratingsforIGMteachers.
7. ThereisamediumrelationshipbetweenDistrictaverageISTEPscoresandISTEP
growth/growthpercentilesusedforIGM.
DistrictWeightonGrowth − Weak + Weak + NoneStudent'sISTEPScore1yrprior + + + Strong + Strong +Student'sISTEPGrowth1yrprior +
TeacherDemographicsAveragedaystheirstudentsattended + + + + Weak + Medium + NoneDayscontracted − − − None Weak + None%salarypaidbyTitleI − − − Weak + Weak + NoneSalaryAmt Strong + Medium + Medium + Strong + Weak + Weak + NoneFirstyearteaching Weak + Weak + Medium + Medium + Medium + Medium + Medium + Medium + Strong + Strong + Medium +Experience(0-5yrsbaseline)6-10years Weak + Medium + Weak + Medium + Weak + Medium + Weak + Medium + Strong + Strong + None11-20years Weak − Medium + Medium − Weak − Weak − Weak + Weak − None Strong + Strong + None21+years Weak − Medium + Medium − Mixed Medium − None Medium − None Medium + Medium + None
Ethnicity(Whitebaseline)AmericanIndian + + +AsianorPacificIslander − + − +Black − − − −Hispanic − −Multiracial −NativeHawaiianorotherPI −
Teachergender(Femalebaseline) − − − Strong − Strong − NoneAveragegradeserved Medium − Medium − Weak −Middleschoolteacher(Elementarybaseline) − − − None None None*
C ModelsincludeFullmodel;Elemvs.MiddleSchool;ELAAccountable;MathAccountableD ModelsincludeELAmodel;ELA+Elemvs.MiddleSchool;ELA+PriorYearPerformance;MATHmodel;MATH+Elemvs.MiddleSchool;MATH+PriorYearPerformanceE ModelsincludeFullmodel;Elemvs.MiddleSchool
CalculatedasmGP +1.25*se wheremGP =mediangrowthpercentfortheteacherandse= thestandarderrorofthegrowthpercentsforalln studentsassignedtotheteacher,asoutlinedintheIGMCalculationTemplate.xlsxlocatedathttp://www.doe.in.gov/evaluations/student-growth
WeakNone
Medium
MediumNone
Weak
MediumMixedNoneNoneWeakWeak
Medium
WeakWeak
Medium
StrongWeak
Medium
MediumMediumNoneNoneWeakWeakWeak
Strong
Strong
StrongMediumNone
WeakWeakWeakWeakNoneMixedWeak
None
1-4IGMRatings
WithoutSalaryC
TeacherOutcomes
1-3vs.4SummativeRatings
AllTeachersC
Teachersw/IGMC
Teachersw/oIGME
Strong
Strong
WithSalaryD
WithSalaryD
ISTEPScore ISTEPGrowth
WithoutSalaryD
StudentOutcomes
WithoutSalaryD
WithSalaryC
WithoutSalaryC
GPsusedforIGMRatings*
WithSalaryC
WeakMixedMixedMixed
MixedWeak
MediumMedium
MediumMedium

27
8. ThereisamediumrelationshipbetweenDistrictpercentFRLandIGM
ratings/summativeratings.
9. ThereisarelationshipbetweenstudentprioryearISTEPscoresandgrowthpercentiles
usedforIGM,IGMratings,andsummativeratings.
Table5:AnalysisofRelationshipsofDistrictDemographicswithStudentandTeacherOutcomes
RelationshipsbetweenPrincipalcharacteristics,studentoutcomesandteacherevaluation
ratings
1. Thereisaweakpositiverelationshipwithdistrictweightandgrowthandteacher
summativeratings.
2. Thereisastrongnegativerelationshipbetweenprincipalswhoareratedeffectiveand
teachers’summativeratings(Principalsratedeffectiveratetheirteacherslowerthan
principalsratedHE).
3. Thereisamediumnegativerelationshipbetweenprincipalsratedimprovement
necessaryandteachers’summativeratings.(PrincipalsratedNeedsImprovementrate
theirteacherslowerthanprincipalsratedHE)
DistrictDemographicsDistrictweightongrowth(2013-2016) None None None None Mixed Mixed NoneDistrictaverageISTEPScore Strong + Medium − Medium − Strong − Mixed Mixed Weak +DistrictaverageISTEPGrowth Weak − Strong + Strong + Strong + Strong + Strong + NoneDistrictgraduationrate(2012-2015) Weak − None None None Weak + None NoneDistrictexpendituresperstudents(2012-2015) None None Weak + None None None NoneDistrict%ageofstudentsonFRL Weak + Weak + Weak − Medium − Medium − Medium − Medium −Totalenrollment Medium + Weak + Medium − Medium − Weak −PrioryearISTEPscores Strong + Strong + Strong + Strong +Middleschoolstudent/teacher(Elementarybaseline) None None Weak − None Medium − Strong − Medium +*
B ModelsincludeFullmodel;Elemvs.MiddleSchool;Middle68%ofState;Middle68%ofDistrictB-alt ModelsincludeFullmodel;Elemvs.MiddleSchool;Middle68%ofState;Middle68%ofDistrictwithalternatecontrols
CalculatedasmGP +1.25*se wheremGP =mediangrowthpercentfortheteacherandse= thestandarderrorofthegrowthpercentsforalln studentsassignedtotheteacher,asoutlinedintheIGMCalculationTemplate.xlsxlocatedathttp://www.doe.in.gov/evaluations/student-growth
ISTEPScore
B
ISTEPGrowth
B
GPsusedforIGMRatings*
B-alt
1-4IGMRatings
B-alt
1-3vs.4SummativeRatings
AllTeachersB-alt
Teachersw/IGMB-alt
Teachersw/oIGMB-alt
StudentOutcomes TeacherOutcomes
28
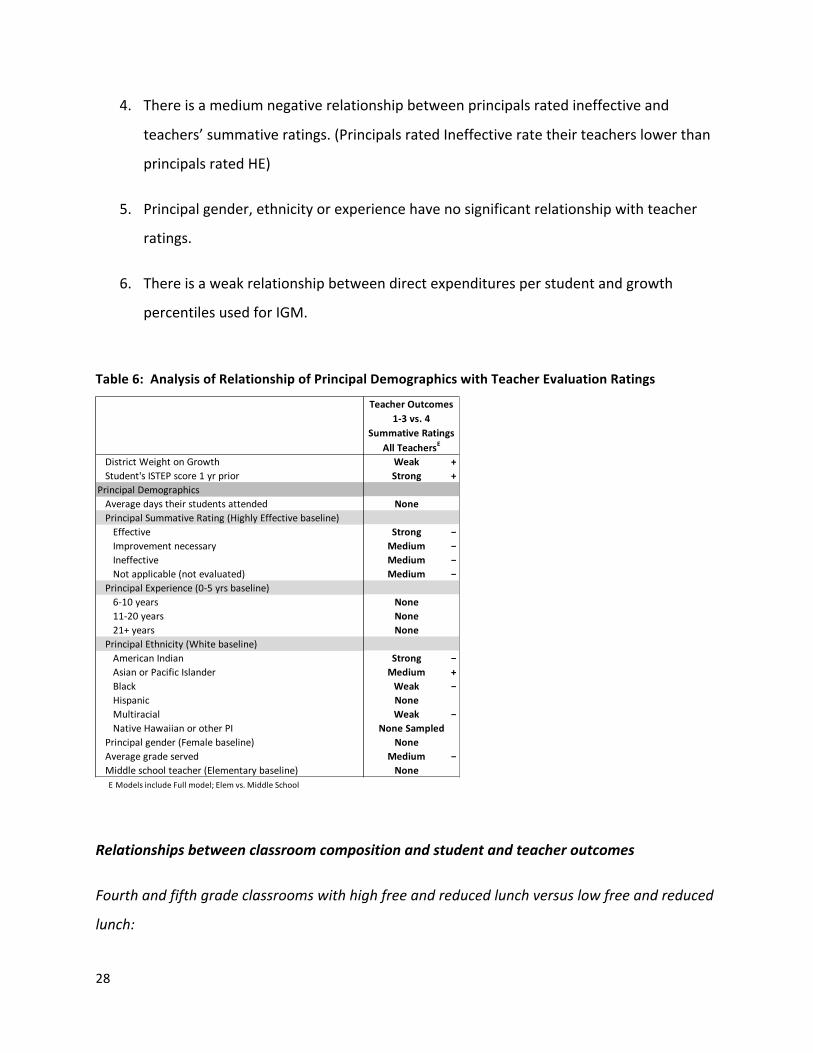
4. Thereisamediumnegativerelationshipbetweenprincipalsratedineffectiveand
teachers’summativeratings.(PrincipalsratedIneffectiveratetheirteacherslowerthan
principalsratedHE)
5. Principalgender,ethnicityorexperiencehavenosignificantrelationshipwithteacher
ratings.
6. Thereisaweakrelationshipbetweendirectexpendituresperstudentandgrowth
percentilesusedforIGM.
Table6:AnalysisofRelationshipofPrincipalDemographicswithTeacherEvaluationRatings
Relationshipsbetweenclassroomcompositionandstudentandteacheroutcomes
Fourthandfifthgradeclassroomswithhighfreeandreducedlunchversuslowfreeandreduced
lunch:
DistrictWeightonGrowth Weak +Student'sISTEPscore1yrprior Strong +
PrincipalDemographicsAveragedaystheirstudentsattended NonePrincipalSummativeRating(HighlyEffectivebaseline)Effective Strong −Improvementnecessary Medium −Ineffective Medium −Notapplicable(notevaluated) Medium −
PrincipalExperience(0-5yrsbaseline)6-10years None11-20years None21+years None
PrincipalEthnicity(Whitebaseline)AmericanIndian Strong −AsianorPacificIslander Medium +Black Weak −Hispanic NoneMultiracial Weak −NativeHawaiianorotherPI
Principalgender(Femalebaseline) NoneAveragegradeserved Medium −Middleschoolteacher(Elementarybaseline) NoneE ModelsincludeFullmodel;Elemvs.MiddleSchool
TeacherOutcomes1-3vs.4
SummativeRatingsAllTeachersE
NoneSampled

29
1. Thereisastrongrelationshipwiththeproportionofstudentsonfreeandreducedlunch
inaclassroomandstudentandteacheroutcomes.
2. Teachersinclassroomswithhigherpercentagesofstudentonfreeandreducedlunch,
teachersareratedlesswellonIGMandsummativeratings.
3. TeacherIGMandsummativeratingsarelowerinclassroomswithhigherpercentagesof
studentsonfreeandreducedlunch.
Fourthandfifthgradeclassroomsfreeandreducedlunchdistributiondecilecomparisons
1. Thereare“break”pointsinclassroomcompositionwhereidentifiabledifferencesin
studentperformanceandteacherratingsareassociatedwithpercentagesofstudents
onfreeandreducedlunch.
2. Usingdeciledistinctionsofclassroomsby%offreeandreducedlunch:
a. Decilecomparisonsshowdistinctdifferencesbetweenclassroomsbasedon
percentofstudentsonfreeandreducedlunch.Inmostmodelsthereisapoint
increasingFRLnolongermattered.Typically,aroundthe7thdecileor65%.
3. IntheFigureAbelowyoucanseeadeclineinaverageIGMratingastheproportionof
studentsonfreeandreducedlunchincreasesinteachers’classrooms.Statistical
comparisonsdetectsignificantimpactsimmediatelyuponchangingdecilesinseveral
models.Thisisnotaspronouncedinallmodels.Sometimesthesecondandthirddeciles
areaboutthesameasthefirst.(Inthisanalysesof“like”classrooms,thenarrowerand
conservativesplitofdecileswaschoseninanefforttowardscaution.)Thatistosaythat
classroomsintheseconddecile(18%-28.5%FRL)havestatisticallylowerIGMscores
thanclassroomsinthefirstdecile(0%-18%).Similarly,wefindthatclassroomswith
65%ormoreofstudentsonfreeandreducedlunchshownostatisticallysignificant
differencesbetweenoneanother.Thissuggeststheremaybeimmediatedetectable
effectsonIGMscoresarisingfromlowSESchildren’spresenceinaclassroom,butthe
effectofadditionallowSESstudentstapersoffastheproportiongrows.(SeeAppendix
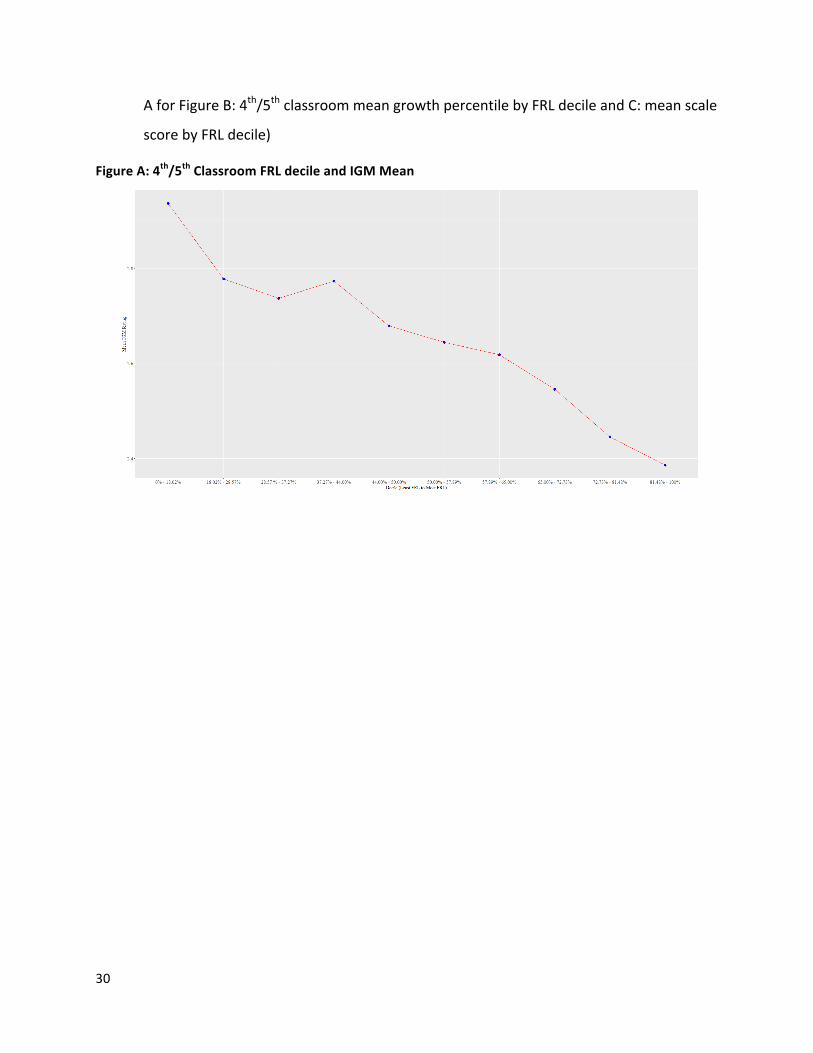
30
AforFigureB:4th/5thclassroommeangrowthpercentilebyFRLdecileandC:meanscale
scorebyFRLdecile)
FigureA:4th/5thClassroomFRLdecileandIGMMean
31
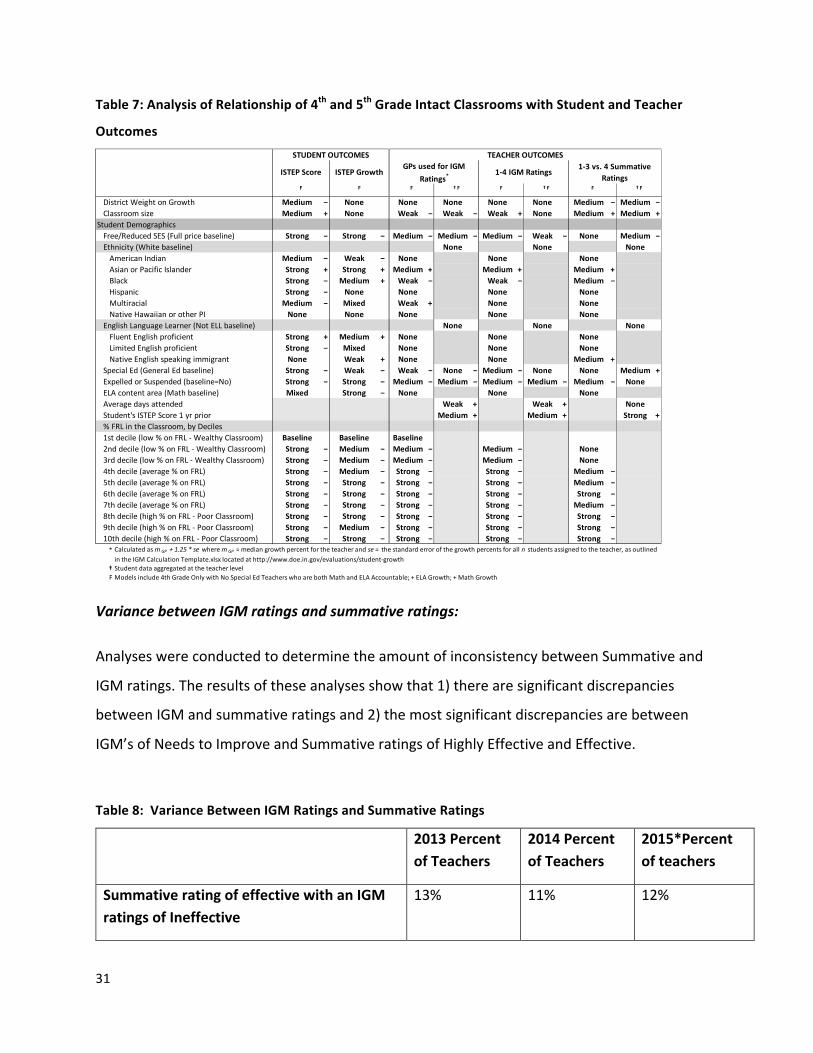
Table7:AnalysisofRelationshipof4thand5thGradeIntactClassroomswithStudentandTeacher
Outcomes
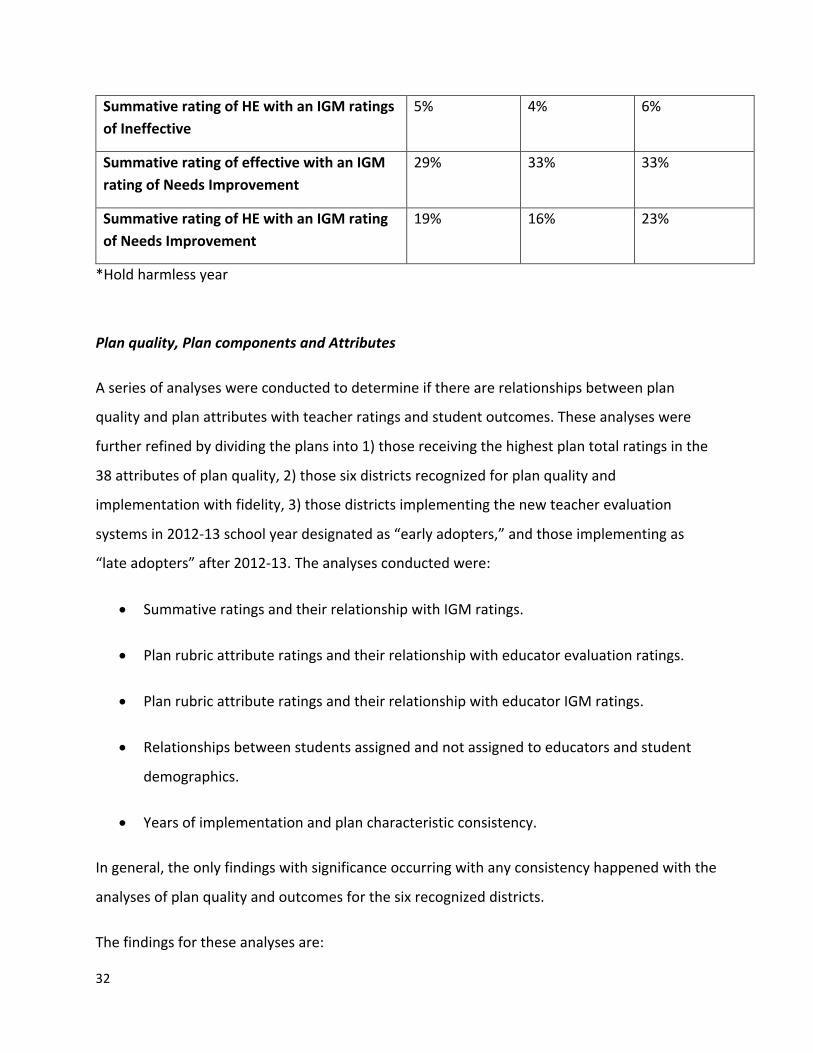
VariancebetweenIGMratingsandsummativeratings:
AnalyseswereconductedtodeterminetheamountofinconsistencybetweenSummativeand
IGMratings.Theresultsoftheseanalysesshowthat1)therearesignificantdiscrepancies
betweenIGMandsummativeratingsand2)themostsignificantdiscrepanciesarebetween
IGM’sofNeedstoImproveandSummativeratingsofHighlyEffectiveandEffective.
Table8:VarianceBetweenIGMRatingsandSummativeRatings
2013PercentofTeachers
2014PercentofTeachers
2015*Percentofteachers
SummativeratingofeffectivewithanIGMratingsofIneffective
13% 11% 12%
DistrictWeightonGrowth Medium − None None None None None Medium − Medium −Classroomsize Medium + None Weak − Weak − Weak + None Medium + Medium +
StudentDemographicsFree/ReducedSES(Fullpricebaseline) Strong − Strong − Medium − Medium − Medium − Weak − None Medium −Ethnicity(Whitebaseline) None None NoneAmericanIndian Medium − Weak − None None NoneAsianorPacificIslander Strong + Strong + Medium + Medium + Medium +Black Strong − Medium + Weak − Weak − Medium −Hispanic Strong − None None None NoneMultiracial Medium − Mixed Weak + None NoneNativeHawaiianorotherPI None None None None None
EnglishLanguageLearner(NotELLbaseline) None None NoneFluentEnglishproficient Strong + Medium + None None NoneLimitedEnglishproficient Strong − Mixed None None NoneNativeEnglishspeakingimmigrant None Weak + None None Medium +
SpecialEd(GeneralEdbaseline) Strong − Weak − Weak − None − Medium − None None Medium +ExpelledorSuspended(baseline=No) Strong − Strong − Medium − Medium − Medium − Medium − Medium − NoneELAcontentarea(Mathbaseline) Mixed Strong − None None NoneAveragedaysattended Weak + Weak + NoneStudent'sISTEPScore1yrprior Medium + Medium + Strong +%FRLintheClassroom,byDeciles1stdecile(low%onFRL-WealthyClassroom) Baseline Baseline Baseline2nddecile(low%onFRL-WealthyClassroom) Strong − Medium − Medium − Medium − None3rddecile(low%onFRL-WealthyClassroom) Strong − Medium − Medium − Medium − None4thdecile(average%onFRL) Strong − Medium − Strong − Strong − Medium −5thdecile(average%onFRL) Strong − Strong − Strong − Strong − Medium −6thdecile(average%onFRL) Strong − Strong − Strong − Strong − Strong −7thdecile(average%onFRL) Strong − Strong − Strong − Strong − Medium −8thdecile(high%onFRL-PoorClassroom) Strong − Strong − Strong − Strong − Strong −9thdecile(high%onFRL-PoorClassroom) Strong − Medium − Strong − Strong − Strong −10thdecile(high%onFRL-PoorClassroom) Strong − Strong − Strong − Strong − Strong −*
† StudentdataaggregatedattheteacherlevelF Modelsinclude4thGradeOnlywithNoSpecialEdTeacherswhoarebothMathandELAAccountable;+ELAGrowth;+MathGrowth
CalculatedasmGP +1.25*se wheremGP =mediangrowthpercentfortheteacherandse= thestandarderrorofthegrowthpercentsforalln studentsassignedtotheteacher,asoutlinedintheIGMCalculationTemplate.xlsxlocatedathttp://www.doe.in.gov/evaluations/student-growth
ISTEPGrowth
F
ISTEPScore
F
1-3vs.4SummativeRatings
F †F
STUDENTOUTCOMES TEACHEROUTCOMESGPsusedforIGM
Ratings*†FF F †F
1-4IGMRatings
32
SummativeratingofHEwithanIGMratingsofIneffective
5% 4% 6%
SummativeratingofeffectivewithanIGMratingofNeedsImprovement
29% 33% 33%
SummativeratingofHEwithanIGMratingofNeedsImprovement
19% 16% 23%
*Holdharmlessyear
Planquality,PlancomponentsandAttributes
Aseriesofanalyseswereconductedtodetermineiftherearerelationshipsbetweenplan
qualityandplanattributeswithteacherratingsandstudentoutcomes.Theseanalyseswere
furtherrefinedbydividingtheplansinto1)thosereceivingthehighestplantotalratingsinthe
38attributesofplanquality,2)thosesixdistrictsrecognizedforplanqualityand
implementationwithfidelity,3)thosedistrictsimplementingthenewteacherevaluation
systemsin2012-13schoolyeardesignatedas“earlyadopters,”andthoseimplementingas
“lateadopters”after2012-13.Theanalysesconductedwere:
• SummativeratingsandtheirrelationshipwithIGMratings.
• Planrubricattributeratingsandtheirrelationshipwitheducatorevaluationratings.
• PlanrubricattributeratingsandtheirrelationshipwitheducatorIGMratings.
• Relationshipsbetweenstudentsassignedandnotassignedtoeducatorsandstudent
demographics.
• Yearsofimplementationandplancharacteristicconsistency.
Ingeneral,theonlyfindingswithsignificanceoccurringwithanyconsistencyhappenedwiththe
analysesofplanqualityandoutcomesforthesixrecognizeddistricts.
Thefindingsfortheseanalysesare:
33
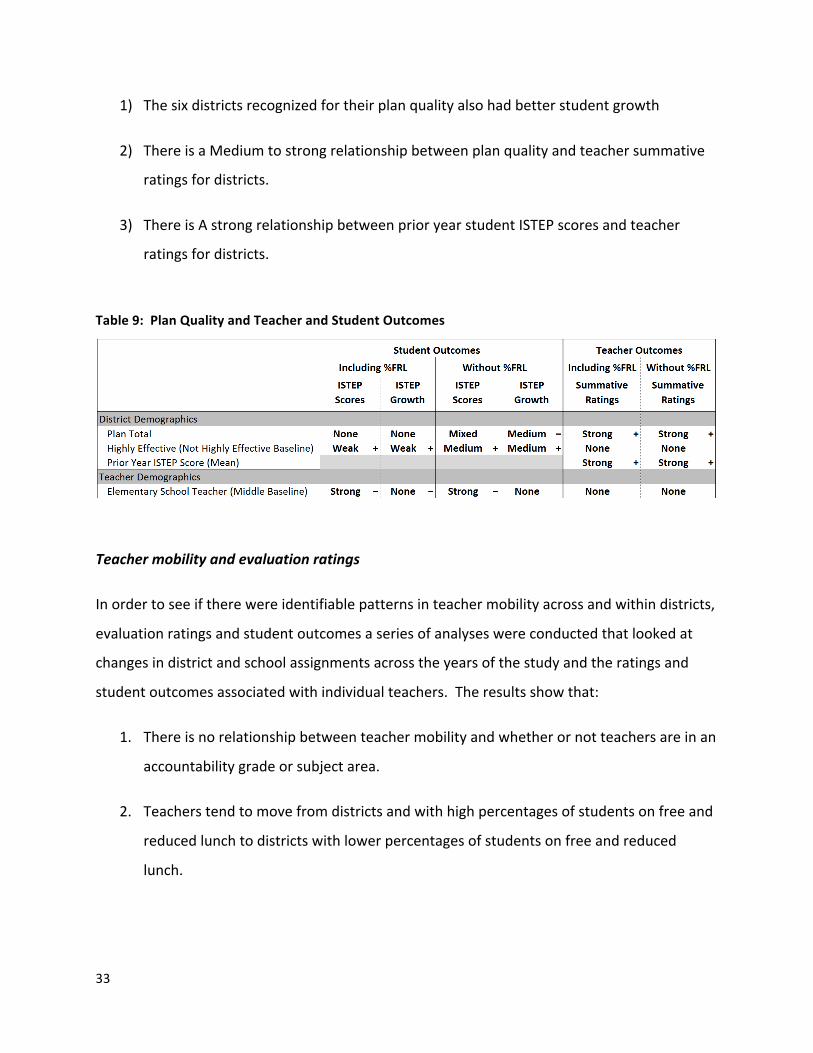
1) Thesixdistrictsrecognizedfortheirplanqualityalsohadbetterstudentgrowth
2) ThereisaMediumtostrongrelationshipbetweenplanqualityandteachersummative
ratingsfordistricts.
3) ThereisAstrongrelationshipbetweenprioryearstudentISTEPscoresandteacher
ratingsfordistricts.
Table9:PlanQualityandTeacherandStudentOutcomes
Teachermobilityandevaluationratings
Inordertoseeiftherewereidentifiablepatternsinteachermobilityacrossandwithindistricts,
evaluationratingsandstudentoutcomesaseriesofanalyseswereconductedthatlookedat
changesindistrictandschoolassignmentsacrosstheyearsofthestudyandtheratingsand
studentoutcomesassociatedwithindividualteachers.Theresultsshowthat:
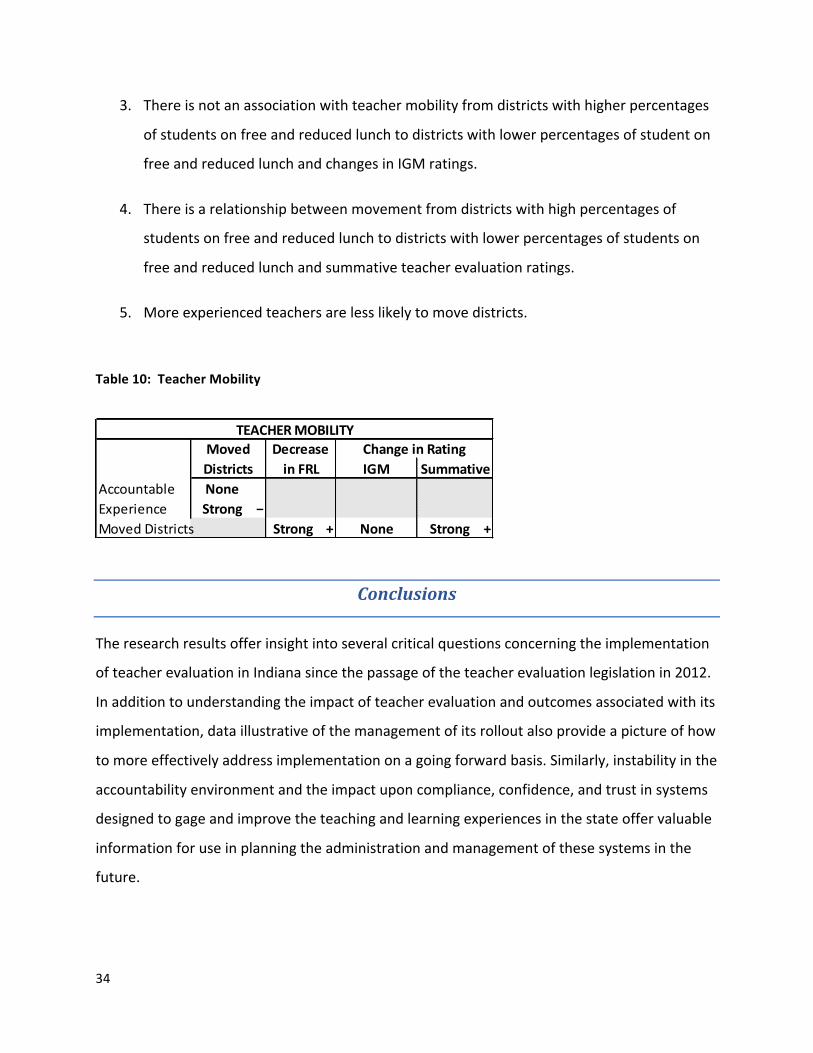
1. Thereisnorelationshipbetweenteachermobilityandwhetherornotteachersareinan
accountabilitygradeorsubjectarea.
2. Teacherstendtomovefromdistrictsandwithhighpercentagesofstudentsonfreeand
reducedlunchtodistrictswithlowerpercentagesofstudentsonfreeandreduced
lunch.
34
3. Thereisnotanassociationwithteachermobilityfromdistrictswithhigherpercentages
ofstudentsonfreeandreducedlunchtodistrictswithlowerpercentagesofstudenton
freeandreducedlunchandchangesinIGMratings.
4. Thereisarelationshipbetweenmovementfromdistrictswithhighpercentagesof
studentsonfreeandreducedlunchtodistrictswithlowerpercentagesofstudentson
freeandreducedlunchandsummativeteacherevaluationratings.
5. Moreexperiencedteachersarelesslikelytomovedistricts.
Table10:TeacherMobility
Conclusions
Theresearchresultsofferinsightintoseveralcriticalquestionsconcerningtheimplementation
ofteacherevaluationinIndianasincethepassageoftheteacherevaluationlegislationin2012.
Inadditiontounderstandingtheimpactofteacherevaluationandoutcomesassociatedwithits
implementation,dataillustrativeofthemanagementofitsrolloutalsoprovideapictureofhow
tomoreeffectivelyaddressimplementationonagoingforwardbasis.Similarly,instabilityinthe
accountabilityenvironmentandtheimpactuponcompliance,confidence,andtrustinsystems
designedtogageandimprovetheteachingandlearningexperiencesinthestateoffervaluable
informationforuseinplanningtheadministrationandmanagementofthesesystemsinthe
future.
IGMAccountable NoneExperience Strong −MovedDistricts Strong + None Strong +
TEACHERMOBILITYMovedDistricts
DecreaseinFRL
ChangeinRatingSummative

35
ThedebateaboutaccountabilityatthenationallevelwasalsoexperiencedinIndianathrough
theAtoFgradingsystemforschools.Theapprehensivereactiontoaccountabilitybecame
furtheraggravatedwithalossofcredibilityduetopervasiveandongoingproblemswiththe
administrationandmanagementofthetestadministrationprocessforthestateassessment,
latereportingoftestscores,errorsinscoring,inaccuratebudgetingoffundstargetedforatrisk
students,andambiguouslanguageinlegislation,guidanceandpolicy.Thisledtoinconsistent
implementationofteacherevaluationfromthemomentthatthe2012legislationbecamelaw.
Theenduringinstabilityofthisenvironmentsuggeststhatwehaveyettoseewhata
consistentlyimplemented,highqualityteacherevaluationprocesswillyieldintheformof
instructionaleffectivenessandstudentoutcomes.
Researchingteacherevaluationalsosurfacedissuesconcerningdataintegrityandfile
compositionthatmadecomparativeanalysesacrossyearsdifficultevenwithinthesameschool
corporation.Further,considerablelatitudeintheinterpretationofpolicyandguidanceseverely
limitedqualitycomparisonsacrossschoolcorporations.Theprocessofassigningstudentsto
teachersisanexampleworthmentioning.Districtsaregiventheresponsibilitytoassign
studentstoteachersforaccountabilityandforteacherevaluation.However,thelatitudethat
districtshaveinthisprocessallowsstudentstobeassignedtoeveryteacherintheschoolinan
efforttocreateequalityintheevaluationexperienceanduniversalresponsibility.Likewise,
somedistrictsuseAtoFgradesastheirquantitativemeasureandassignthisastheonly
studentlearningoutcomeforateacher.Additionally,thedatafilesshowedthatmanystudents
werenotassignedtoanyteacherandtheirlearningoutcomeswerenotassignedtoany
teacher.Thereappearstobenoreadilyavailableexplanationtoevaluatethesepractices.
PercentFRL(%FRL)andplanattributes(PA)aretwoveryimportantvariablescentraltothe
questionsoftheresearch.ThestrongestrelationshipsappeartohappenwhenFRL%isnot
accountedfor.However,evenwhenFRL%isincludedintheanalyses,relationshipsappear
acrossthesixdistrictswithhighplanqualityandfidelityofimplementation.Whenthefirst
modelwasrun(themodelwithout%FRL),planattributeswereasignificantpredictorof
outcomes.Afteradding%FRLtothemodelthesignificanceofPAissometimesweakenedor
36
disappears.However,forthesixdistrictsratedmosthighlyinplandevelopmentand
implementationthereisstillaconditionalrelationshipbetweenplanattributesandoutcomes
forstudentsandteachers.Seeingapositiverelationshipbetweenthesixdistrictsidentified
throughtheIDOEmonitoringprocessforplanqualityandlaterrecognizedthroughaprocess
thatincludedassessmentofimplementationandtechnicalassistanceisencouragingbecause
thestudentandteacheroutcomesvalidatetheeffortsfordevelopingandimplementinghigh
qualityteacherevaluationexperiencesinschooldistricts.Additionally,althoughconsistent
significanceforsubcategoriesofplanattributesisnotapparentinthecurrentanalysesitmay
bebecausethecollectiveratherthantheindividualinfluenceoftheattributesiswhatweseeas
evidentintheanalysesandresultsofplanqualityandoutcomes.
TheresearchfindingsconcerningarelationshipbetweenIGMandSummativeratingsshowsthe
impactofevaluatorjudgmentupontheevaluationprocessandvalidatesthetensionbetween
theratingofteachersreceivingIGMratingsandthosewhodonot.Italsovalidatesconcerns
aboutdifferencesintheprocessbetweenthetwotypesofteachers.Thefactthatsignificantly
moreteachersareratedasineffectiveorneedstoimprovewiththeirIGMratingsthantheir
summativeratingsraisesthequestionoftherelationshipbetweenevaluatortraining,
instructionaleffectivenessandthevalidityandreliabilityofevaluatorratings,studentgrowth
measuresandtheinstructionalrubricsbeingused.
Thefindingthatthesinglemostrelevantpredictorofteacherevaluationratingsandstudent
outcomesisstudentfreeandreducedlunchstatuspointstowardthenecessityforsome
accountingofthisinfluencebeingincludedintheteacherevaluationratingprocess.Similarly,
thefactthatclassroommakeuphasasignificantrelationshipwithevaluationratingsis
importantandrequiresadjustmentinthewaythatratingsareassigned.Whilequalityof
instructionshouldbetheguidingfactorindeterminingateacher’sevaluation,itwouldappear
asthoughteacherevaluationsare,atleastinpart,unfairlybaseduponthedemographic
compositionoftheirclassrooms.
WhiletheimpactofStudentEconomicStatus(SES)onstudentoutcomesmaybedifficultto
eliminate,wecanatleastdoabetterjobofaccountingforitinevaluatingtheeffectivenessof
37
teachers.Inthisresearchundertakingaprocedurefordoingsowasillustratedusingtheactual
researchdata.AsetofanalyseswereconductedbydividingallIndianafourthandfifthgrade
classroomsintodecilesbasedupontheirproportionsofstudentsonfreeandreducedlunch.
Precisedecilesvaryfromyeartoyearandbytheoutcomeinquestion,butthefirstdecile
consistsofclassroomswithroughly0%to17%ofstudentsonfreeandreducedlunch,andthe
lastdecileisroughly83%to100%ofstudentsonfreeandreducedlunch.Dividingclassroomsin
thisfashionallowsforanapproximatelyequalnumberofclassroomswithineachdecile.One
suchrepresentationofthesedecilecomparisonswasshowninFigureAthatillustratedthe
relationshipbetweenclassroomFRLcompositionandIGMscoresfor2016.Thismethodology
approximatescomparisonsoflikeclassroomsandanevaluationofteacherperformancewith
theirpeers.Ofcourse,this,likeothermethodologiesinvolvingstaticmodeling,thereare
limitationsthatwillhavetobeovercome.
However,wearguefromapolicyperspectivethatitisworththetimeandefforttoexplore
resolutionofanylimitationsofmethodinordertobetteraddressthenegativebiasofstudent
SESonteacherevaluation,inordertogetanaccuratereadoninstructionaleffectiveness.Itcan
alsohelptoaddress,inpart,concernsthatwearenotcomparinglikeclassroomsintherating
ofstudentlearningoutcomes.
Themethodologydescribedheresuggeststhatonewaytoaccomplishitwouldbetoevaluate
teachersinclassroomswithsimilarproportionsoflowSESstudents.Tothisend,itdoesnot
matterwhetherthefifthandsixthdecilesarestatisticallyequivalentordifferent,itonly
mattersthatclassroomswithinthedecilearesimilarwithregardtotheirSEScomposition.
Otherbreakpointssuchasquintilesorquartilescouldbeused,butdecilesdoasatisfactoryjob
oflimitingtherangeoflowSESproportionswhilemaintainingreasonablenumbersof
classroomsforcomparison.Likewise,theresultsanalyzingstudentraceandethnicity,language
status,andtoalesserextentdisabilitystatussuggestsimilarwithinclassroominteractionsare
happeningthatmakethepresentgrowthmodelappeartobelessvalidwithincreasing
diversity.

38
ThefindingthatteacherratingsarealsoexplainedbypriorstudentISTEPperformanceisalso
worthcommentingon.Teachershavingstudentsexperiencingpriorassessmentsuccess
realizinghigherevaluationsthanteacherswithclassroomshavinghigherpercentagesof
studentsonfreeandreducedlunchunderscoresthepolicyandphilosophicaldilemmaofhow
toaddresstheimpactoftrackingandclusteringofstudents.Fromalocalpolicyperspectivein
theteacherevaluationprocess,addressingtrackingisworthdeliberationinanefforttoensure
afairandvalidratingofteachereffectivenessandreducetheimpactofdisadvantagingor
advantagingsometeachersoverothersintheevaluationprocess.
Thesefindingssuggestthatsomethingotherthanthecurrentgrowthmodelbasedupon
studenttostudentcohortsisneeded.Asmentionedabove,comparinglikeclassroomsmuchin
thewaythatstudentcohortsarecomparedinthecurrentgrowthmodelisoneoptionworth
considering.Anotheroptionwouldbetousestatisticalcontrolstoaccountfortheeffectoffree
andreducedlunchuponevaluationratings.Itistroublingtothinkthatstatisticallyaccounting
forstudentdifferencesisakintoacceptinglessthanequitablestudentoutcomesbasedupon
raceandethnicity.However,thefactthatteachersleavingdistrictsandschoolswithhigh
percentagesofstudentsonfreeandreducedlunchreceivehighersummativeandIGMratings
suggeststhatsomethingotherthanteacherdifferencesandinstructionalcapabilityisatplay.
Itmaybethatteacherpreparationprogramshaveapartintheadequatepreparationof
teachersforclassroomdiversity.Thefactthatteacherswithmoreeducationandqualifications
seemtohavebetterstudentoutcomes,offersreasonforsupportingcontinueddevelopmentof
teachersintherecruitmentandretentionprocess.Policyandguidanceatadifferentlevelof
theteacherpreparationprocessincludingpost-secondaryimplicationsareimportant.
Evaluatorandteachercharacteristicssignificantlyrelatedtoratingsandoutcomesalsoshed
lightontheprocessandofferareasforadditionalinquiry.Determiningwhyteacherswithmore
thantwentyyearsofexperienceappeartohavenegativestudentoutcomeindicators,even
thoughteacherexperienceissignificantlyandpositivelyrelatedtoevaluationratingsis
important.Similarly,theinteractionbetweenevaluatorandteacherexperienceandteacher
ratingsbegsthequestionofratingvalidity.WhyprincipalsmakeupthedifferenceinIGM

39
ratingswithhighersummativeratingsisyetanothercriticalquestionthatunderscoresthis
point.Resolvingthesediscrepancieswillgoalong-waystowardestablishingcredibilityinthe
teacherevaluationprocess.
Similarly,althoughnotafocusofthisresearch,thefactthatstudentcharacteristicsexplain
morevariancethaneitherschoolordistrictdifferenceshasimplicationsforthestate
accountabilitysystemanditslettergradeformat.TheanalyseswouldsuggestthattheAtoF
systemisinrealitygrading/labelingstudentsratherthantheinstructionalprocessesinthe
respectiveschoolsanddistrictcorporations.Theimplicationsforschooltakeoverandteacher
incentiverewardsareobvious.
Underscoringtheseissuesarethefindingsregardingteachermobility,experience,andratings.
Thefactthatinexperiencedteachersseemtomovetodistrictswithlowerpercentagesof
studentsonfreeandreducedlunchisanimportantindicatorofhow,ifnothandledcorrectly,
teacherevaluationcanexacerbatetheproblemofteacherretention.Thefactthatteacher
ratingsimprovewithoutacorrespondingincreaseinteacherIGMratingssuggeststhatthereis
aflawinthesystemthatneedstobeaddressed.However,thefactthatmoreexperienced
teachersareratedmorehighlywouldappeartooffersupportforteachermentoringwith
experience.Makingthesefindingsevenmorecomplicatedaretheresultsthatshowsome
relationshipbetweenprincipalandteacherevaluationratings.
Itappearsthatthereislittleevidencethatplanweightisrelatedtoeitherteacherratingsor
studentoutcomes.However,becauseonlystudentoutcomeratingsforteachersreceivingIGM
ratingsisavailable,therelationshipofotherstudentoutcomemeasuresintheevaluation
processmakesdeterminationoflearningweightanelusiveundertaking.Compoundingthe
problemisthelackofteacherawarenessconcerningplancomponents.Teacherawarenessof
theevaluationprocessisnotsomethingthatismonitoredwhenlookingatdistrictplansfor
compliance.PreviousworkinthisareaofIndiana’steacherevaluationsystemhasshownthat
thereisasignificantlackofawarenessonthepartofteachersofevaluationplanprocesses,
components,andcriteria.Becauseofthis,theimpactofaparticularweightisdifficulttosiftout
fromthosefactorshavinganinfluenceuponindividualmotivationandcollectiveeffort.Yet,the
40
IndianaexperienceofcontinuousandsignificantimprovementinNAEPresultsduringtheyears
sincetheimplementationofevaluationreforminthestatesuggeststhatattheveryleastthe
presenceofweightinevaluationandotherreformcomponentshavenotworkedtothe
detrimentofinstructionalimprovementandstudentlearning.
Notwithstandingthedifferencesevidentinimplementationandpractice,changesineducator
evaluationanditsroleinaccountabilityrepresentathemethatwillcontinuetobeapartofthe
schooleffectivenessdiscussion.Inadditiontoresolvingthequestionsconcerningthevalidity
andreliabilityoftheratings,thequestionofhowtomaketheprocesssupportiveandhelpful
foreducatorsseemstobeathemethatresonateswithallinvolved.Makingthistransitionwill
requiresomethingmorethanaresolutionofthemetricsassociatedwiththeprocessand
involvearepackagingofthemessagetooneofsupportforteacherandstudentsuccess.
Additionally,theresolutionofdisparatepoliticalview-pointsintheeducationalreform
environmentwillbenecessarytochangethetoneofconflictingopinionsregardingitspurpose
andthestrategiesofferedassolutions.
Managementcompetencewillbeanecessarycomponentfortheimplementationofthelarge
scaleaspectsofaccountabilityandteacherevaluationincludingholdingthevendors
responsiblefortestdevelopmentandscoringaccountable.Intheend,allinvolvedinthis
processwillhavetoundertakethedevelopmentandarticulationofanewmessageofefficiency
andsupportforeducatorsbackedupwithpolicyandeffectivemonitoringandassistanceatthe
national,stateandlocallevelsinordertocreateconsensusandsupportforthisnewparadigm
ineducatorevaluation.
Recommendations
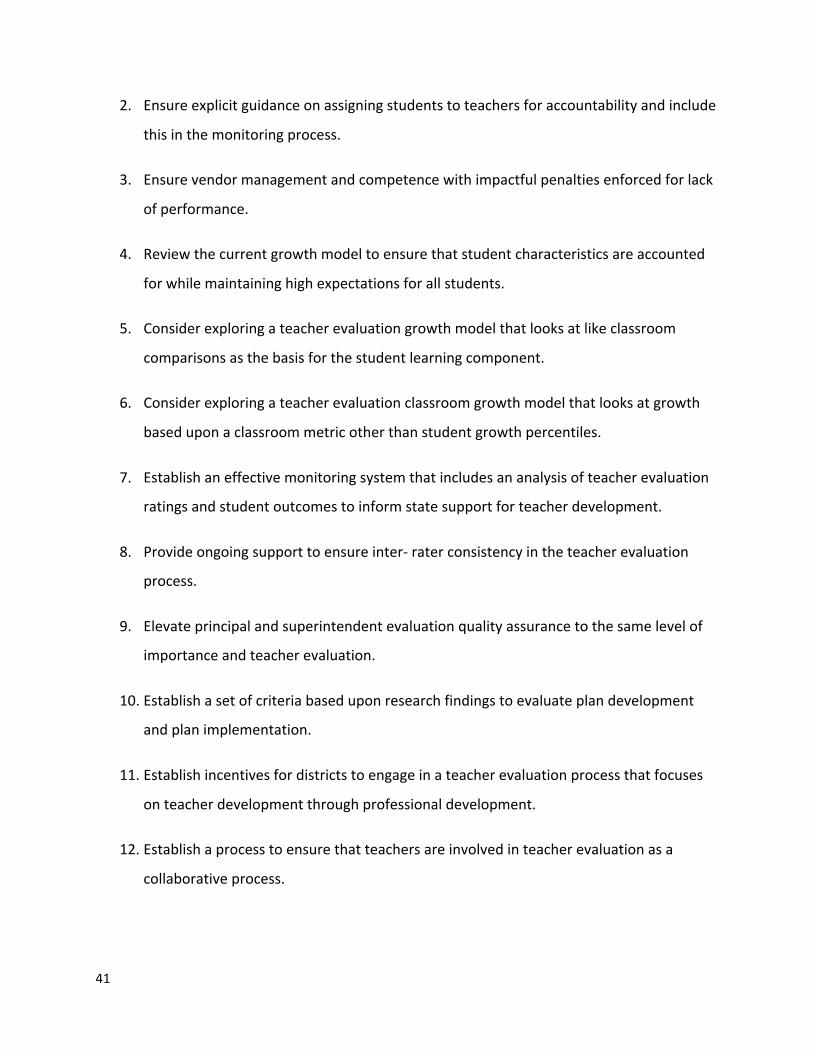
Thefollowingarerecommendationsbaseduponthefindingsfromthisreport:
1. Ensuredataintegrityandfilecompositioninorderforresearchenablinginformed
decisionmakingonpolicyandguidancetobevalidandeffective.
41
2. Ensureexplicitguidanceonassigningstudentstoteachersforaccountabilityandinclude
thisinthemonitoringprocess.
3. Ensurevendormanagementandcompetencewithimpactfulpenaltiesenforcedforlack
ofperformance.
4. Reviewthecurrentgrowthmodeltoensurethatstudentcharacteristicsareaccounted
forwhilemaintaininghighexpectationsforallstudents.
5. Considerexploringateacherevaluationgrowthmodelthatlooksatlikeclassroom
comparisonsasthebasisforthestudentlearningcomponent.
6. Considerexploringateacherevaluationclassroomgrowthmodelthatlooksatgrowth
baseduponaclassroommetricotherthanstudentgrowthpercentiles.
7. Establishaneffectivemonitoringsystemthatincludesananalysisofteacherevaluation
ratingsandstudentoutcomestoinformstatesupportforteacherdevelopment.
8. Provideongoingsupporttoensureinter-raterconsistencyintheteacherevaluation
process.
9. Elevateprincipalandsuperintendentevaluationqualityassurancetothesamelevelof
importanceandteacherevaluation.
10. Establishasetofcriteriabaseduponresearchfindingstoevaluateplandevelopment
andplanimplementation.
11. Establishincentivesfordistrictstoengageinateacherevaluationprocessthatfocuses
onteacherdevelopmentthroughprofessionaldevelopment.
12. Establishaprocesstoensurethatteachersareinvolvedinteacherevaluationasa
collaborativeprocess.

42
13. Considerestablishingstateprovidedincentivesforteacherstoacceptteaching
assignmentsindistrictsandclassroomswithhighpercentagesofstudentsonfreeand
reducedlunch.
14. Providestatesupportforprofessionaldevelopmentinculturallyresponsiveinstruction.
15. Providefundsfordistrictstoengageinastatesupportedpilotprojecttoreviseand
improvetheteacherevaluationprocess.
FutureResearch
Todate,theINTASSteamhasexploredtherelationshipbetweendistrictgrowthweightand
studentperformance,districtgrowthweightandIGMscores,discrepanciesbetweenIGM
scoresandsummativeratings,theimpactofstudentSESonstudentoutcomesandIGMscores,
comparisonsbetweendistrictswithhighfidelityplanimplementationtothosewithout,and
more.Extensivescopeanddeptharerepresentedinthemodelsconstructedforthisreport
yieldingfindingsthatcaninformbothresearchandpolicyonagoingforwardbasis.Theresults
todateareinformative,butmanyquestionsremainincludingareliableinvestigationintoplan
componentsandoutcomesforstudentsandteachers.Aresomeaspectsofplandevelopment
andimplementationbeinganimportantquestionthathasimplicationsforpolicyandpracticeA
furtherexplorationintotheprecisenatureoftherelationshipbetweenstudentFRLstatusand
outcomescouldalsoyieldbeneficialinformationaswemoveforwardwitheducatorevaluation.
SuchadditionalmodelsmightincludeexploringwhetherornotlowSESstatus
disproportionatelyaffectscertaintypesofteachersandstudents,orwhetherFRLexhibits
patternswithinschoolsreceivingdifferentlevelsfunding.
Thusfar,agreatdealofemphasishasbeenputondeterminingwhichfactorsotherthan
studentSESuniquelyexplainvarianceinstudentoutcomes,IGMscores,andotheroutcomesof
interest.TheserelationshipsareoftennotasstrongwhenweincludeFRLasanexplanatory
43
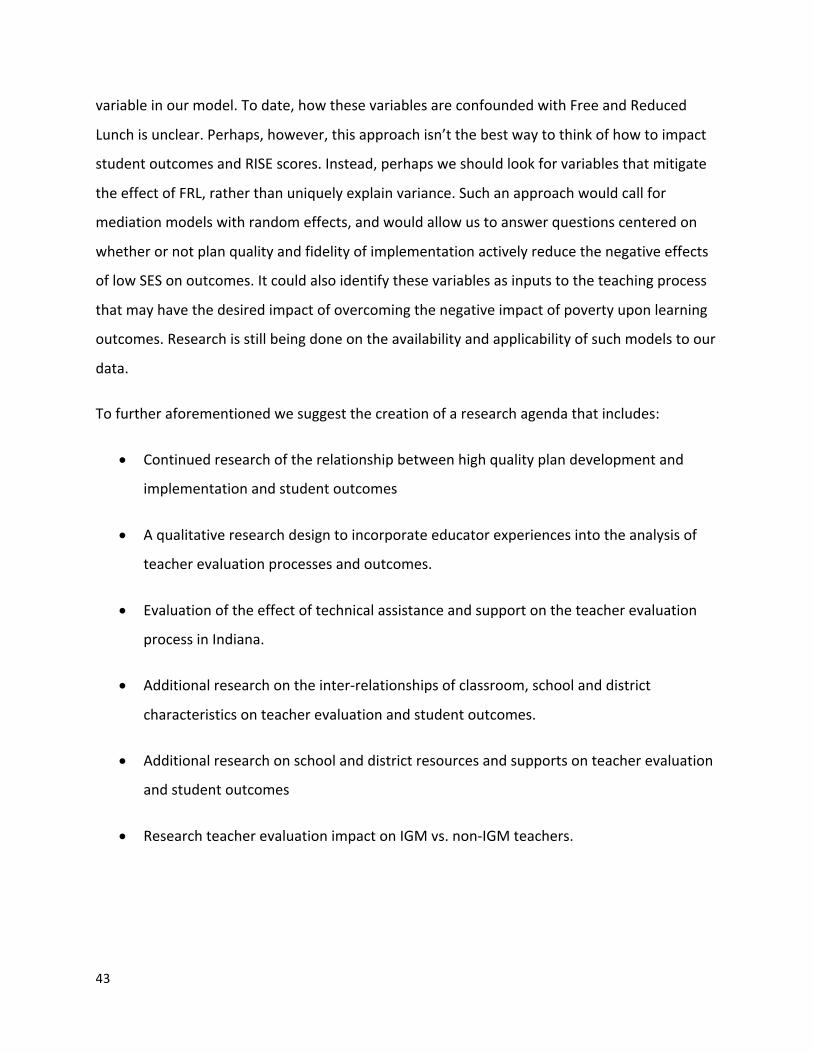
variableinourmodel.Todate,howthesevariablesareconfoundedwithFreeandReduced
Lunchisunclear.Perhaps,however,thisapproachisn’tthebestwaytothinkofhowtoimpact
studentoutcomesandRISEscores.Instead,perhapsweshouldlookforvariablesthatmitigate
theeffectofFRL,ratherthanuniquelyexplainvariance.Suchanapproachwouldcallfor
mediationmodelswithrandomeffects,andwouldallowustoanswerquestionscenteredon
whetherornotplanqualityandfidelityofimplementationactivelyreducethenegativeeffects
oflowSESonoutcomes.Itcouldalsoidentifythesevariablesasinputstotheteachingprocess
thatmayhavethedesiredimpactofovercomingthenegativeimpactofpovertyuponlearning
outcomes.Researchisstillbeingdoneontheavailabilityandapplicabilityofsuchmodelstoour
data.
Tofurtheraforementionedwesuggestthecreationofaresearchagendathatincludes:
• Continuedresearchoftherelationshipbetweenhighqualityplandevelopmentand
implementationandstudentoutcomes
• Aqualitativeresearchdesigntoincorporateeducatorexperiencesintotheanalysisof
teacherevaluationprocessesandoutcomes.
• Evaluationoftheeffectoftechnicalassistanceandsupportontheteacherevaluation
processinIndiana.
• Additionalresearchontheinter-relationshipsofclassroom,schoolanddistrict
characteristicsonteacherevaluationandstudentoutcomes.
• Additionalresearchonschoolanddistrictresourcesandsupportsonteacherevaluation
andstudentoutcomes
• ResearchteacherevaluationimpactonIGMvs.non-IGMteachers.
44
ResearchTeam
• HannahBolte,StatisticalConsultant/Lecturer,IUDepartmentofStatistics
• MichaelFrisby,StatisticalConsultant,IUDepartmentofStatistics
• DemetreesL.Hutchins,ManagementAnalyst,IUPUISchoolofEducation
• GaryRPike,Professor,HigherEducation&StudentAffairs
• SarahPies,ResearchAssociate,INTASSProject,IndianaUniversity
• HardyMurphy,ClinicalFacultyIUPUI,Co-DirectorINTASS
• SandiCole,DirectorCenteronEducationandLifelongLearningIUB,Co-DirectorINTASS
SpecialAcknowledgement:TheresearchteamacknowledgesHammadRahman,Data
ManagementSpecialist,IndianaDepartmentofEducation,fortheimportantcontributions
madetothisresearch.
45
AppendixA:
Table1:HistoryofchangesinaccountabilityinIndiana
2011-12 2012-13 2013-14 2014-15 2015-16 2016-17
1. GeneralAssemblyenactsannualeducatorevaluationsstartingwiththe2012-13schoolyear
2. Districtshadoneyeartopickamodel(unlessextendedcontract)andtoplanforfullimplementation.223districtshadfullimplementationduringthe2012-13schoolyear
3. FirstYearofCompetitivePerformanceFY12
1. Firstyearofimplementationofeducatorevaluationsfor223districts
2. NewleadershiptakesofficeJanuary2013
3. ReleaseofRISE2.5fromIDOEduetoISTEP+systemicglitches-summer2013
4. SecondyearofCompetitivePerformanceGrantsFY13
1. GeneralAssemblyeliminatesCommonCoreandbuildsIndianaCollege-andCareer-ReadyStandardsandAssessments
2. GeneralAssemblychangestheperformancegrantto$2MforTitleIFocusandPrioritySchools(notcompetitive)
3. Decemberof2013-firstpublicreleaseoffinalsummativeevaluationsresultstopublic
1. Latereleaseofassessmentresultsandtriggers“holdharmless”onaccountabilityandevaluationstiedtoISTEP+duetocommondropintestscores
2. January2015-secondyearofpublicreleaseoffinalsummativeevaluationsresultstopublic
3. $2MforTitleIFocusandPrioritySchools(notcompetitive)continues
4. GeneralAssemblyadds$30Mbasedonstateassessmentproficiencyonly
5. IDOEbeginsonsitemonitoringofevaluationplanimplementationduetoESEAFlexibilityWaiver
1. FirstyearofnewIndianaCollege-andCareer-ReadyStandardsandnewvendorforassessments(Pearson)
2. GeneralAssemblycontinues$30Mbasedonstateassessmentproficiencyonlyandcontinues$2MforTitleIFocusandPrioritySchools(notcompetitive)
3. Testingresultscomeinfalltoschoolsandpublic
4. IDOEreleasedthirdyearoffinalsummativeevaluationresultstopublicinJuly2016
5. HoldHarmlessProvisiontakenforA-Flettergradesandteacherevaluationsduetonewassessment/standards
6. FirstyearofnewA-FAccountabilityModelforschoolsreleasedinthelatefallof2016
7. ESSApassedbyFederalGovernment;evaluationsnolongerrequiredthroughFederalGovernment
8. IDOEendsmonitoringofdistrictevaluationplanimplementationafterESSAispassed
1. ThirdyearofnewIndianaCollege-andCareer-ReadyStandardsandnewvendorforassessments(Pearson)
2. GeneralAssemblycontinues$40Mbasedonstateassessmentproficiencyonlyandcontinues$2MforTitleIFocusandPrioritySchools(notcompetitive)
3. NewISTEP+Panelmeetinginthefallof2016toprovidesuggestionsfornewISTEP+

46
Table2:Modeldescriptions
FigureB:4th/5thClassroomMeanGrowthPercentilebyFRLDecile
MODELSUSINGSTUDENTANDDISTRICTDEMOGRAPHICSASPREDICTORS FullModel Elemvs.Middle
Middle68%ofState
Middle68%State+Elemvs.Middle
Middle68%ofDistrict
Middle68%District+Elemvs.Middle ELAAccountable MATHAccountable
FILTERS
Student_attended_at_least_162_daysNoforaggregatesYesforallothers
NoforaggregatesYesforallothers Yes Yes Yes Yes No No
No_conflicting_records_on_district Yes Yes Yes Yes Yes Yes Yes YesNo_conflicting_records_on_school Yes Yes Yes Yes Yes Yes Yes YesNo_conflicting_records_on_grade Yes Yes Yes Yes Yes Yes No NoGrades_4/5_and_7/8_only No Yes No Yes No Yes No NoPerformance_in_Middle_68% No No State State District District No No
CONTROLSPrimary_exceptionality_effects Yes Yes Yes Yes Yes Yes No No
Grade_effectsYesforISTEPScoreNoforallothers
YesforISTEPScoreNoforallothers
YesforISTEPScoreNoforallothers
YesYesforISTEPScoreNoforallothers
Yes No No
District_effects Yes Yes Yes Yes Yes Yes Yes YesNested_school_effects Yes Yes Yes Yes Yes Yes Yes Yes
ALTERNATECONTROLSFORDISTRICTEFFECTSONTEACHEROUTCOMESPrimary_exceptionality_effects No No No No
Grade_effectsYesforISTEPScoreNoforallothers
YesforISTEPScoreNoforallothers
YesforISTEPScoreNoforallothers
YesforISTEPScoreNoforallothers
District_effects No No No NoSchool_effects Yes Yes Yes YesNested_teacher_effects Yes Yes Yes Yes
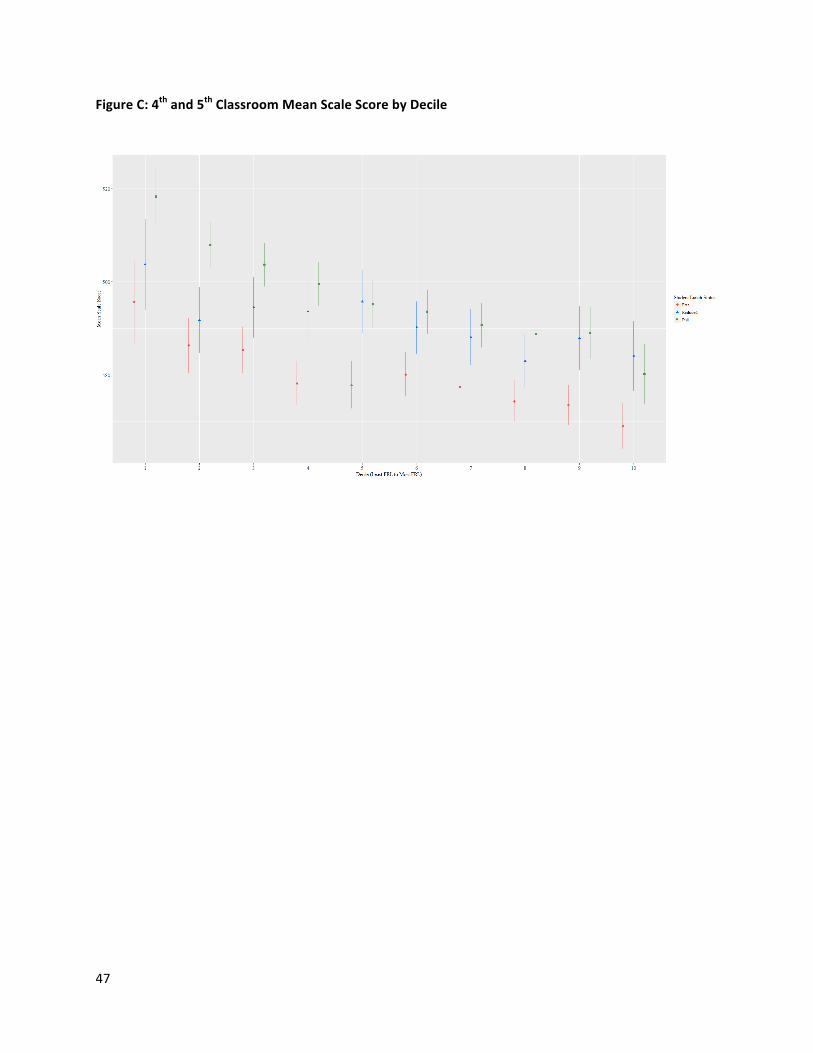
47
FigureC:4thand5thClassroomMeanScaleScorebyDecile