Embed Size (px)
Citation preview

Washington State Pregnancy and Induced Abortion Statistics 2005 July, 2007 For more information contact: Center for Health Statistics PO Box 47814 Olympia, WA 98504-7814 360 236-4321 Fax 360 753-4135 Mary C. Selecky Secretary of Health
Center for Health Statistics, Pregnancy & Induced Abortion Statistics report staff: Joe Campo, Manager, (Research Services) (360) 236-4321 Phyllis Reed, (Research Investigator) – Abortions (360) 236-4324 Patricia Starzyk, (Research Investigator) - Births (360) 236-4323 John Sabel, (IT Specialist), Research Services (360) 236-4332 (Design Consultation) Office of Health Promotion Acknowledgements: We gratefully acknowledge the contributions of the many individuals who participate in the reporting of birth, fetal death, and abortion data. Their contributions are essential to the very important public health indicators contained in this report. Jude VanBuren, DrPH, MPH, RN, RS Assistant Secretary Epidemiology, Health Statistics & Public Health Laboratories Teresa Jennings, MPA State Registrar and Director Center for Health Statistics
Washington Pregnancy and Induced Abortion Statistics, 2005
Table of Contents Introduction.................................................................................................3
Why are data on Induced Abortions and Pregnancy rates important? ..............................3 Data Reporting Issues ................................................................................3
Source of Pregnancy and Induced Abortion Data .............................................................4 Additional Services.....................................................................................5 Washington State Counties .......................................................................6 Overview......................................................................................................6
Change Over Time.............................................................................................................6 Trend Table 1. Induced Abortions, Live Births, and Abortion Ratios, Washington State Residents, 1983-
20051 ...............................................................................................................................................7 Trend Table 2. Pregnancy Statistics1, Washington State Residents, 1983-2005...........................................8 Trend Table 3. Teenage Pregnancy Rates1 by Age Group, Washington State Residents, 1980-2005 .........9
Recent County Trends..............................................................................10 Trend Table 4. Induced Abortion Rates1 by County of Residence, Washington State, 1999-2005..............11 Trend Table 5. Induced Abortion Rates1 with Ranks by County, Washington State Residents, 2001-2005 12 Figure 1. General Fertility Rates1, Washington State Residents Compared to National, 1981-2005............13 Figure 2. Washington State General Fertility Rates by County of Residence 2003 -2005 ............................13
Statistics Tables........................................................................................17 Table 1. Pregnancy Outcomes of Residents by Woman’s Age, 2005..........................................................17 Table 2. Age-Specific Rates1 and Abortion Ratios of Residents, 2005 ........................................................17 Table 3. Induced Abortions of Residents by Selected Indicators, 2005 .......................................................18 Table 4. Induced Abortions of Residents by Woman's Age and Weeks of Gestation, 2005 ........................19 Table 5. Previous Live Births of Women Having Abortions by Age, Washington State Residents, 2005 ....20 Table 6. Previous Induced Abortions of Women Having Abortions by, Age Washington State Residents,
2005 ..............................................................................................................................................20 Table 7. Induced Abortions by Woman's Age and Place of Occurrence or Residence, 2005......................21 Table 8. Induced Abortions Occurring Within Washington State by Selected Indicators, 2005 ...................22 Table 9. Induced Abortions Occurring Within State by Type of Procedure and Weeks of Gestation, 2005.23 Table 10. Induced Abortions with Complications Occurring Within State by Type of Procedure and Weeks
of Gestation, 2005 .........................................................................................................................23 Table 11. Induced Abortions with Secondary Management Occurring Within State by Type, 2005 ............24 Table 12. Induced Abortions with Secondary Management Occurring Within State by Type of Secondary
Management and Weeks of Gestation, 2005 ................................................................................24 Table 13. Induced Abortions with Complications Occurring Within State by Type of Complication and
Weeks of Gestation, 2005 .............................................................................................................25 Table 14. Induced Abortions with Complications Occurring Within State by Type of Complication and
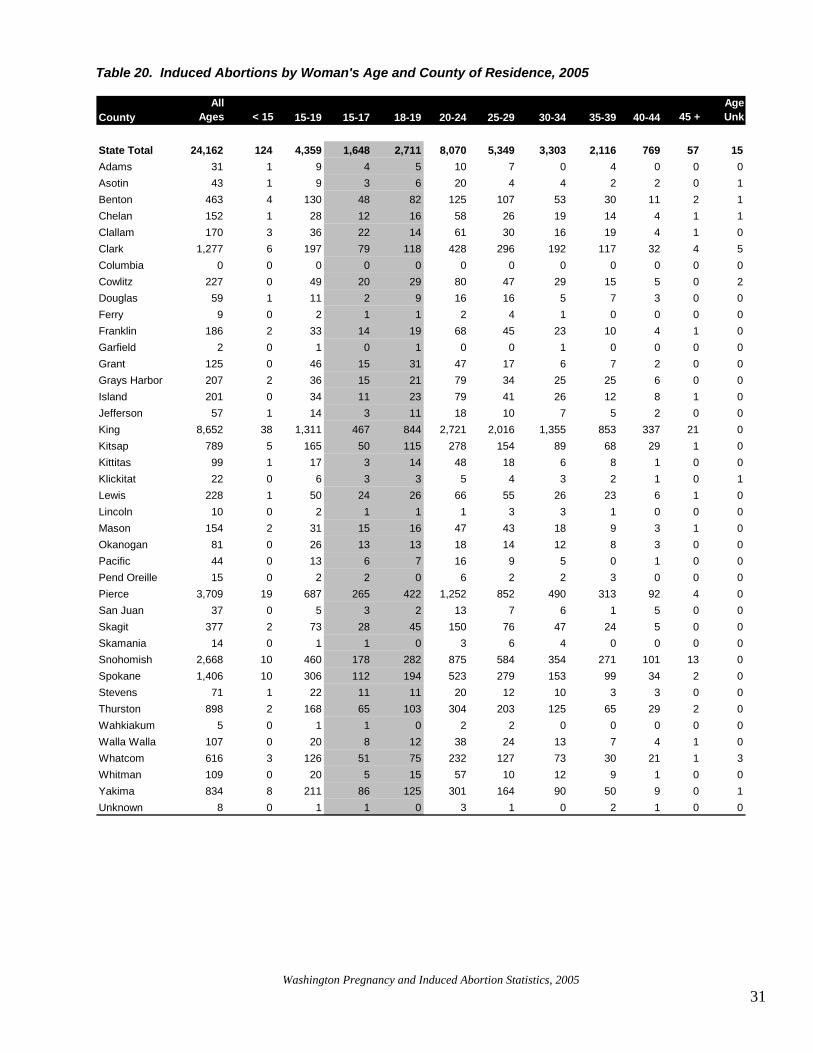
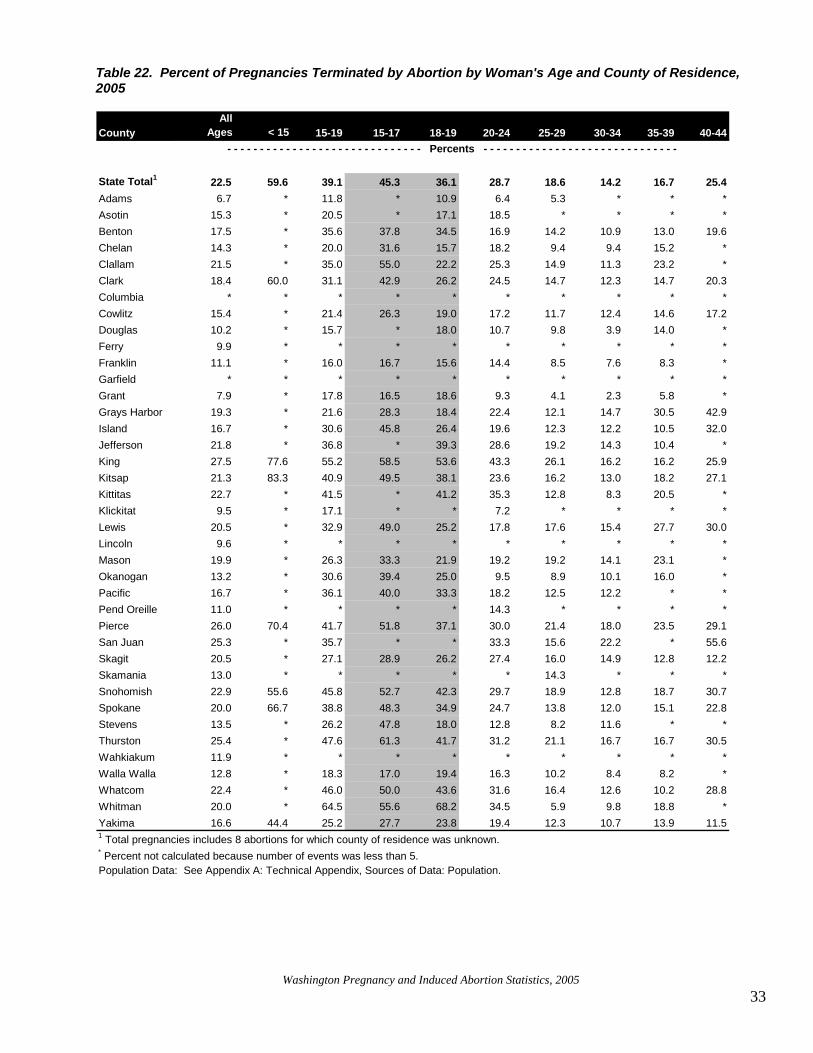
Secondary Management Procedure, 2005....................................................................................25 Table 15. Birth and Abortion Indicators1 by County of Residence, 2005......................................................26 Table 16. Total Pregnancies1 by Woman's Age and County of Residence, 2005........................................27 Table 17. Age-specific Pregnancy Rates1 by County of Residence, 2005 ...................................................28 Table 18. Live Births by Woman's Age and County of Residence, 2005 .....................................................29 Table 19. Age-specific Live Birth Rates1 by County of Residence, 2005 .....................................................30 Table 20. Induced Abortions by Woman's Age and County of Residence, 2005 .........................................31 Table 21. Age-specific Abortion Rates1 by County of Residence, 2005.......................................................32 Table 22. Percent of Pregnancies Terminated by Abortion by Woman's Age and County of Residence,
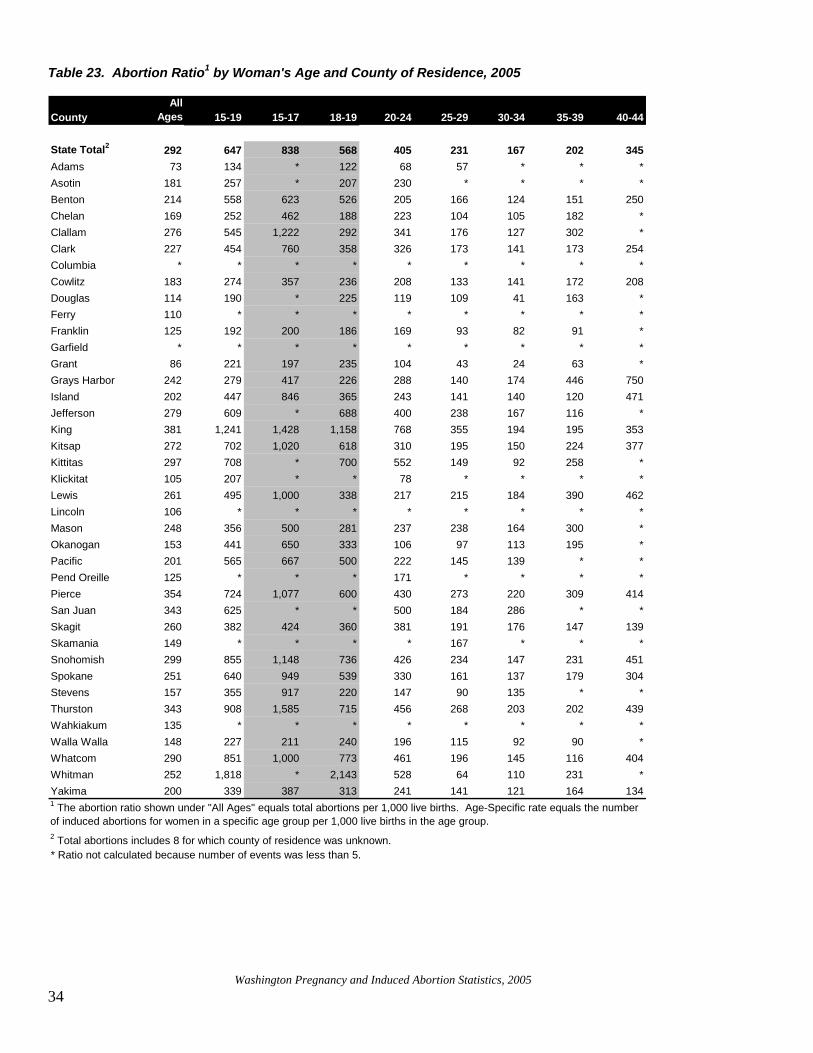
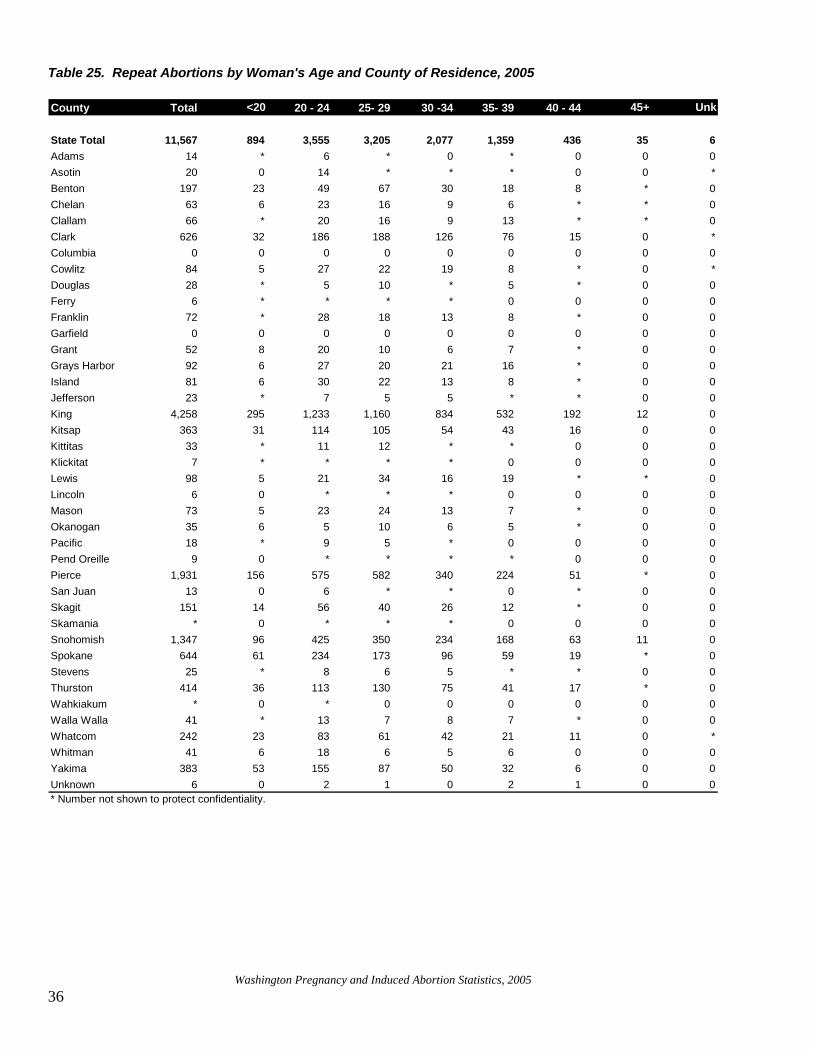
2005 ..............................................................................................................................................33 Table 23. Abortion Ratio1 by Woman's Age and County of Residence, 2005 ..............................................34 Table 24. Abortions in Second Trimester or Later1 by Woman's Age and County of Residence, 2005 .......35 Table 25. Repeat Abortions by Woman's Age and County of Residence, 2005 ..........................................36 Table 26. Out of State Residents by Washington State County of Occurrence, 2005. .................................37 Table 26a. Induced Abortion of Washington State Residents by Place of Occurrence in, 2005..................38 Table 27. Fetal Deaths by Woman's Age and County of Residence, 2005..................................................39 Table 28. Female Population by Age and County of Residence, 2005 ........................................................40
Appendix A: Technical Appendix ...........................................................43 How to Use Pregnancy and Abortion Data ......................................................................43
Why Read this Section?........................................................................................................................... 43 Issues in Using the Data .......................................................................................................................... 43 Residence vs. Occurrence....................................................................................................................... 43
Abortions Occurring in Washington & Abortions of Washington Residents During 2005..............................44 Numbers vs. Rates................................................................................................................................... 44 Standards for Comparison of Rates......................................................................................................... 45 Unknowns ................................................................................................................................................ 46 Small Numbers......................................................................................................................................... 47 Data Quality ............................................................................................................................................. 47

Washington Pregnancy and Induced Abortion Statistics, 2005
Confidentiality...........................................................................................................................................49 Sources of Data............................................................................................................... 50
Collection Year .........................................................................................................................................50 Population ................................................................................................................................................50
Demographics ................................................................................................................. 50 Age...........................................................................................................................................................50 Race .........................................................................................................................................................50 Hispanic Origin .........................................................................................................................................51
Abortion Complications and Secondary Management .................................................... 52 Adjusted Abortion and Pregnancy Rates, 1992-1995..................................................... 53 Definitions........................................................................................................................ 54 Induced Abortion Procedures:......................................................................................... 55
Appendix B: Sample Certificates and Forms ........................................61 Birth Filing Form .............................................................................................................. 61 Certificate of Fetal Death................................................................................................. 63 Report of Induced Termination of Pregnancy ................................................................. 65

Washington Pregnancy and Induced Abortion Statistics, 2005
Introduction


Washington Pregnancy and Induced Abortion Statistics, 2005
3
Introduction Washington State Pregnancy and Induced Abortion Statistics, 2005, published by the Center for Health Statistics of the Washington State Department of Health, contains tables on pregnancies—the sum of births, induced abortions, and fetal deaths—and more detailed information about induced abortions for calendar year 2005. Why are data on Pregnancy rates important? Pregnancy data collected by the Department of Health help address issues related to family planning, maternal and child health, and access to health care.
Since 1993, the Department of Health has been engaged in changing policy and programs in support of reducing unintended pregnancies. Unintended pregnancy refers to pregnancies that are unwanted or mistimed at the time of conception. When pregnancies occur without planning or intent, there is less opportunity to prepare for an optimal outcome. Unintended pregnancy is a risk factor for late or inadequate prenatal care, exposure of the fetus to harmful substances, low birth weight and neonatal death. Unintended pregnancy is also associated with other negative social outcomes such as reduced education and career attainment of the parents, welfare dependency, divorce and domestic violence. The Healthy People 20101 goal is to increase to at least 70% the proportion of pregnancies that are intended and to reduce the pregnancy rate to 43 per 1000 women aged 15-17. The data in this report help evaluate prevention programs and help monitor progress toward these national goals. While Washington has not yet met the HP 2010 goal for intended pregnancy, we have met the HP2010 adolescent pregnancy goal. In 2005, the pregnancy rate was 27.6 per 1000 women 15-17 years old. This is a 53% decrease in the teen pregnancy rate from the high of 59.0 pregnancies per 1000 teens 15-17 in 1989. Moreover, only four Washington counties had teen pregnancy rates in 2003-2005 above the HP2010 goal. Why are data on Abortion rates important? Induced abortion data help planners decide if safe and adequate care is being provided to women obtaining abortions in Washington State and may indicate a need for family planning services and sexual education. 1 U.S. Department of Health and Human Services. Healthy People 2010. 2nd ed. With Understanding and Improving Health and Objectives for Improving Health. 2 vols. Washington, DC: U.S. Government Printing Office, November 2000.

Washington Pregnancy and Induced Abortion Statistics, 2005
4
The abortion rate has also continued to decline from a high of 27 per 1000 women in 1989. In 2005, the rate was 18.5 per 1000 women of reproductive age (15-44 yrs.). The adolescent abortion rate has also declined from 30.0 per 1000 women 15-17 years old in 1989 to 12.5 per 1000 women 15-17 years old in 2005. Data Reporting Issues Source of Pregnancy and Induced Abortion Data Data used to prepare this report come from Reports of Induced Termination of Pregnancy, Certificates of Live Birth, and Certificates of Fetal Death. The forms for these reports and certificates are provided by the Washington State Department of Health. The following table describes who completes the forms and where they are filed:
Filing of Washington State Pregnancy-Related Forms Form Completed by Initially Filed with Abortion Service Provider State Dept. of Health Live Birth Hospital or Birth
Attendant State Dept. of Health
Fetal Death Hospital or Birth Attendant
Local Health Jurisdiction
For each induced abortion performed in Washington State, specified non-identified information about the patient, the procedure performed, and the medical complications must be reported to the Department of Health by the attending physician, hospital, or medical facility within one month of the abortion as required by Washington Administrative Code (WAC 246-490-100). This WAC is based on the statutory authority vested in the Secretary of the Department of Health to collect and utilize health-related data to promote and assess the quality and accessibility of health care throughout the state (RCWs 43.70.040 and 43.70.050). In addition, information about abortions performed in other states and in Canada for women who are residents of Washington State is obtained through voluntary cooperative arrangements between vital records offices in most states and Canadian provinces. Similarly, RCW 70.58 governs the registration and reporting of vital statistics and requires births and fetal deaths to be reported within a timely manner. Birth and fetal death certificates are designed to gather information that meets federal reporting requirements of the National Center for Health Statistics. A formal interstate exchange agreement governs the mutual
Washington Pregnancy and Induced Abortion Statistics, 2005
5
exchange of information on births and fetal deaths between states and Canadian Provinces/Territories, so that events occurring to Washington residents elsewhere are also reported to this state. Since 1992, hospitals or birth attendants have used the Electronic Birth Certificate (EBC) system to send birth records directly to the Department of Health instead of to registrars of local health jurisdictions. However, on January 1, 2003, hospitals and birth attendants began using the Birth Record Realtime Registration (BR3) system, a web-based reporting system that allows almost instantaneous registration of births directly to the Center for Health Statistics at the Department of Health. Data collected under the BR3 for calendar year 2005 are reported in the 2005 Vital Statistics Annual Summary. Additional Services Additional tabulations of birth and fetal death data can be found in the publication, Washington State Vital Statistics, published annually by the Center for Health Statistics. Birth and fetal death data are available on the Center’s CD-ROMs: Vital Registration System Annual Statistical Files, Washington State. The CD-ROMs contain data in ASCII format, detailed technical documentation, and annual summary tables of births, deaths, and fetal deaths for 1980-2005. To order a copy of a CD-ROM, call (360) 236-4327. All of the 1997-2005 tables for this report are available on the Internet, along with copies of this introduction, the overview and the appendices. To access this information, go to the DOH web page at www.doh.wa.gov, click on:
Health Data Vital Statistics Abortion/Pregnancy Rates Data Tables
The Center also works with data users on a variety of levels: 1) to help users formulate requests so they get the data they need; 2) to provide technical consultation about how to use or interpret data; 3) to perform special analyses to address a specific problem or need; and 4) to help users access raw data files. For more information, please call Joe Campo, Research Manager, Center for Health Statistics, at (360) 236-4321.

Washington Pregnancy and Induced Abortion Statistics, 2005
6
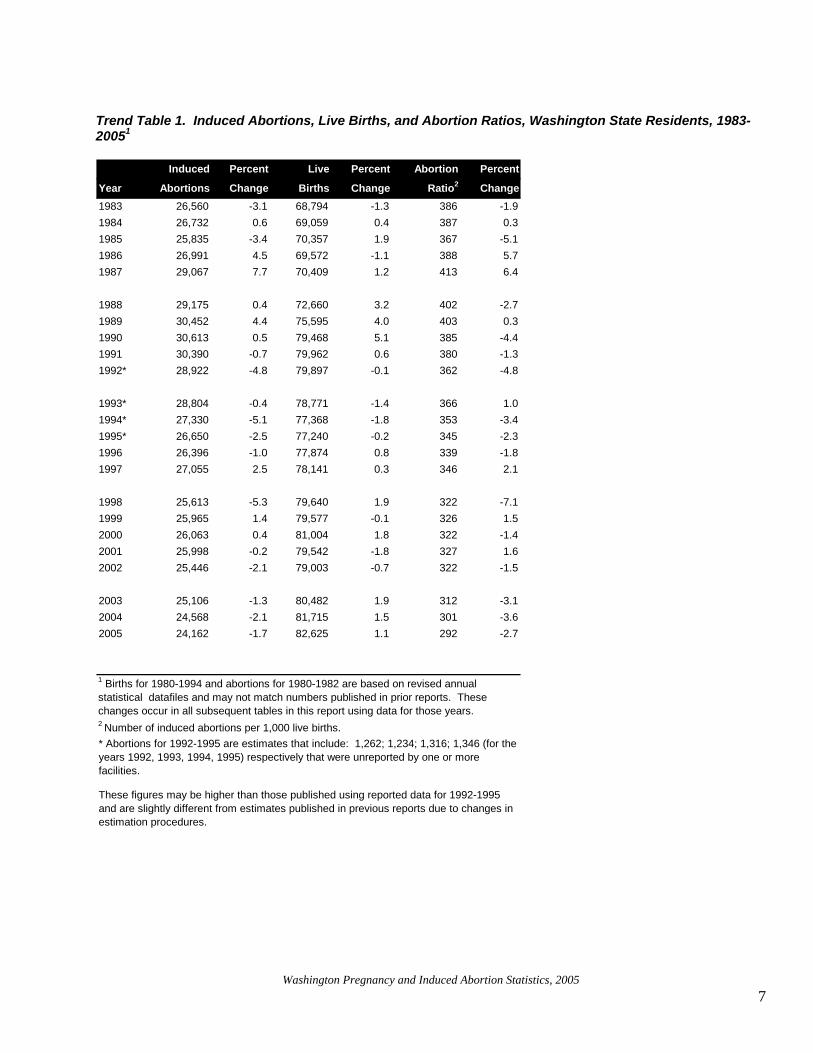
Washington State Counties Overview The above map of Washington State counties is provided to help users identify the location of counties discussed in this report. Change Over Time Data for the two major components of pregnancy—births and induced abortions—are shown in Tables 1-3 for the past 20 years. Since the 1970s, when abortions were first reported, the number rose through the early 1980s, declined slightly, rose to a high of over 30,000 in 1991, and then declined for several years. In 2005, 24,162 abortions were reported for residents of the state, down by about 1.7% from 2004, when 24,568 abortions were reported for residents of the state. Reported abortions in 2004 decreased from the 25,106 abortions reported in 2003. Abortions for 1992 through 1995 shown in Tables 1 and 2 are estimates that reflect the addition of between 1,200 and 1,350 previously unreported abortions each year; these estimates differ from official counts in annual reports for prior years.
Washington Pregnancy and Induced Abortion Statistics, 2005
7
Trend Table 1. Induced Abortions, Live Births, and Abortion Ratios, Washington State Residents, 1983-20051
Induced Percent Live Percent Abortion Percent
Year Abortions Change Births Change Ratio2 Change1983 26,560 -3.1 68,794 -1.3 386 -1.91984 26,732 0.6 69,059 0.4 387 0.31985 25,835 -3.4 70,357 1.9 367 -5.11986 26,991 4.5 69,572 -1.1 388 5.71987 29,067 7.7 70,409 1.2 413 6.4 1988 29,175 0.4 72,660 3.2 402 -2.71989 30,452 4.4 75,595 4.0 403 0.31990 30,613 0.5 79,468 5.1 385 -4.41991 30,390 -0.7 79,962 0.6 380 -1.31992* 28,922 -4.8 79,897 -0.1 362 -4.8 1993* 28,804 -0.4 78,771 -1.4 366 1.01994* 27,330 -5.1 77,368 -1.8 353 -3.41995* 26,650 -2.5 77,240 -0.2 345 -2.31996 26,396 -1.0 77,874 0.8 339 -1.81997 27,055 2.5 78,141 0.3 346 2.1 1998 25,613 -5.3 79,640 1.9 322 -7.11999 25,965 1.4 79,577 -0.1 326 1.52000 26,063 0.4 81,004 1.8 322 -1.42001 25,998 -0.2 79,542 -1.8 327 1.62002 25,446 -2.1 79,003 -0.7 322 -1.5 2003 25,106 -1.3 80,482 1.9 312 -3.12004 24,568 -2.1 81,715 1.5 301 -3.62005 24,162 -1.7 82,625 1.1 292 -2.7
These figures may be higher than those published using reported data for 1992-1995 and are slightly different from estimates published in previous reports due to changes in estimation procedures.
1 Births for 1980-1994 and abortions for 1980-1982 are based on revised annual statistical datafiles and may not match numbers published in prior reports. These changes occur in all subsequent tables in this report using data for those years.
2 Number of induced abortions per 1,000 live births.* Abortions for 1992-1995 are estimates that include: 1,262; 1,234; 1,316; 1,346 (for the years 1992, 1993, 1994, 1995) respectively that were unreported by one or more facilities.
Washington Pregnancy and Induced Abortion Statistics, 2005
8
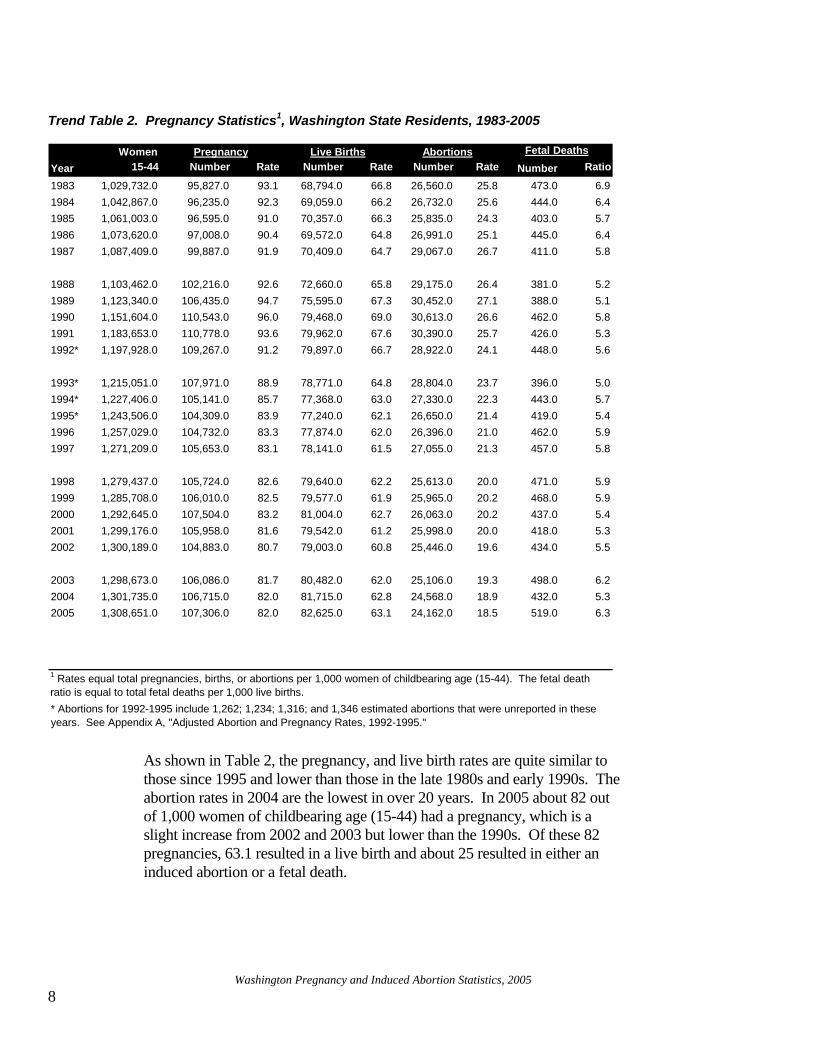
Trend Table 2. Pregnancy Statistics1, Washington State Residents, 1983-2005
Women Pregnancy Live Births Abortions Fetal DeathsYear 15-44 Number Rate Number Rate Number Rate Number Ratio
1983 1,029,732.0 95,827.0 93.1 68,794.0 66.8 26,560.0 25.8 473.0 6.91984 1,042,867.0 96,235.0 92.3 69,059.0 66.2 26,732.0 25.6 444.0 6.41985 1,061,003.0 96,595.0 91.0 70,357.0 66.3 25,835.0 24.3 403.0 5.71986 1,073,620.0 97,008.0 90.4 69,572.0 64.8 26,991.0 25.1 445.0 6.41987 1,087,409.0 99,887.0 91.9 70,409.0 64.7 29,067.0 26.7 411.0 5.8 1988 1,103,462.0 102,216.0 92.6 72,660.0 65.8 29,175.0 26.4 381.0 5.21989 1,123,340.0 106,435.0 94.7 75,595.0 67.3 30,452.0 27.1 388.0 5.11990 1,151,604.0 110,543.0 96.0 79,468.0 69.0 30,613.0 26.6 462.0 5.81991 1,183,653.0 110,778.0 93.6 79,962.0 67.6 30,390.0 25.7 426.0 5.31992* 1,197,928.0 109,267.0 91.2 79,897.0 66.7 28,922.0 24.1 448.0 5.6 1993* 1,215,051.0 107,971.0 88.9 78,771.0 64.8 28,804.0 23.7 396.0 5.01994* 1,227,406.0 105,141.0 85.7 77,368.0 63.0 27,330.0 22.3 443.0 5.71995* 1,243,506.0 104,309.0 83.9 77,240.0 62.1 26,650.0 21.4 419.0 5.41996 1,257,029.0 104,732.0 83.3 77,874.0 62.0 26,396.0 21.0 462.0 5.91997 1,271,209.0 105,653.0 83.1 78,141.0 61.5 27,055.0 21.3 457.0 5.8 1998 1,279,437.0 105,724.0 82.6 79,640.0 62.2 25,613.0 20.0 471.0 5.91999 1,285,708.0 106,010.0 82.5 79,577.0 61.9 25,965.0 20.2 468.0 5.92000 1,292,645.0 107,504.0 83.2 81,004.0 62.7 26,063.0 20.2 437.0 5.42001 1,299,176.0 105,958.0 81.6 79,542.0 61.2 25,998.0 20.0 418.0 5.32002 1,300,189.0 104,883.0 80.7 79,003.0 60.8 25,446.0 19.6 434.0 5.5 2003 1,298,673.0 106,086.0 81.7 80,482.0 62.0 25,106.0 19.3 498.0 6.22004 1,301,735.0 106,715.0 82.0 81,715.0 62.8 24,568.0 18.9 432.0 5.32005 1,308,651.0 107,306.0 82.0 82,625.0 63.1 24,162.0 18.5 519.0 6.3
1 Rates equal total pregnancies, births, or abortions per 1,000 women of childbearing age (15-44). The fetal death ratio is equal to total fetal deaths per 1,000 live births. * Abortions for 1992-1995 include 1,262; 1,234; 1,316; and 1,346 estimated abortions that were unreported in these years. See Appendix A, "Adjusted Abortion and Pregnancy Rates, 1992-1995."
As shown in Table 2, the pregnancy, and live birth rates are quite similar to those since 1995 and lower than those in the late 1980s and early 1990s. The abortion rates in 2004 are the lowest in over 20 years. In 2005 about 82 out of 1,000 women of childbearing age (15-44) had a pregnancy, which is a slight increase from 2002 and 2003 but lower than the 1990s. Of these 82 pregnancies, 63.1 resulted in a live birth and about 25 resulted in either an induced abortion or a fetal death.

Washington Pregnancy and Induced Abortion Statistics, 2005
9
Trend Table 3. Teenage Pregnancy Rates1 by Age Group, Washington State Residents, 1980-2005 Age 15-19 Age 15-17 Age 18-19 Pregnancy Birth Abortion Pregnancy Birth Abortion Pregnancy Birth AbortionYear Rate Rate Rate Rate Rate Rate Rate Rate Rate1980 95.4 46.7 48.3 60.2 24.8 35.1 144.8 77.3 66.91981 94.1 47.0 46.6 59.4 25.7 33.4 142.0 76.6 64.81982 88.6 45.2 43.1 56.2 24.7 31.3 132.1 72.7 59.01983 87.3 44.6 42.3 54.1 24.0 30.0 131.9 72.4 58.91984 85.6 44.1 41.2 52.7 23.1 29.4 132.6 74.1 58.1 1985 84.7 44.3 40.0 52.9 24.6 28.0 133.4 74.6 58.41986 84.9 43.9 40.7 53.1 24.2 28.8 135.8 75.5 59.61987 87.9 44.5 43.2 55.8 25.2 30.4 137.3 74.1 62.71988 90.3 46.7 43.3 56.5 26.5 29.8 137.8 75.1 62.31989 96.0 50.0 45.7 59.0 28.7 30.0 143.2 77.1 65.6 1990 95.2 53.4 41.3 57.9 29.8 27.8 145.0 85.1 59.41991 93.8 54.1 39.4 57.2 31.0 26.0 147.1 87.8 58.91992* 91.8 54.3 37.0 58.1 32.9 25.0 143.9 87.5 55.71993* 89.7 53.4 36.0 56.0 30.9 24.8 143.6 89.4 53.71994* 83.4 50.8 32.3 52.9 29.6 23.2 132.4 84.9 47.1 1995* 80.5 49.9 30.2 50.5 28.8 21.4 129.9 84.7 44.71996 76.7 47.1 29.3 46.9 26.6 20.2 126.2 81.2 44.51997 74.5 44.7 29.6 45.7 25.3 20.2 122.0 76.6 45.01998 71.2 44.0 26.9 42.6 24.0 18.4 116.8 75.8 40.41999 66.5 40.7 25.5 38.0 21.6 16.1 109.6 69.5 39.6 2000 64.3 39.1 25.0 36.3 20.4 15.7 107.0 67.6 39.02001 59.6 35.6 23.8 32.9 17.7 15.1 100.3 62.8 37.12002 55.9 33.0 22.7 30.9 16.8 14.0 93.8 57.7 35.82003 53.2 31.5 21.5 28.8 15.3 13.3 90.2 55.9 34.02004 51.7 31.2 20.4 28.5 15.5 12.9 86.3 54.4 31.72005 50.8 30.7 19.9 27.6 14.9 12.5 85.9 54.5 31.0
* Abortion and pregnancy rates for 1992-1995 include 173, 173, 185, and 188 estimated abortions that were unreported in these years. See Appendix A, "Adjusted Abortion and Pregnancy Rates, 1992-1995."
1 Rates per 1,000 women in age group.
The 2005 pregnancy rate for teenagers continues at record low rates, now at 50.8 pregnancies per 1,000 women aged 15 to 19. Teenagers from 15 to 17 years old had 27.6 pregnancies per 1,000, while those aged 18 to 19 had 85.9 per 1,000, both rates being the lowest recorded since 1980.

Washington Pregnancy and Induced Abortion Statistics, 2005
10
Recent County Trends In using Table 4 and Table 5, it is important to recall that rates can mask substantial differences in the numbers on which the rates are based (See Appendix A discussion on Rates). Counties, which may have the same rate, could have widely disparate actual numbers of abortions. Additionally, small counties may have extremely small numbers, which could vary widely from year to year. Therefore, it is very important to consider both the rate and the number before making policy decisions or designing programs. Table 5: Induced Abortion Rates with Ranks by County, Washington State Residents, 1999-2005 ranks the 39 counties in the state of Washington by their standing of the total number of induced abortions per 1000 women of child-bearing age, 15-44. King and Pierce County have had the highest abortion rates of any counties in the state over the last five years. Snohomish, Thurston, and Yakima counties usually rank in the top ten, while the position of most other counties varies over time.

Washington Pregnancy and Induced Abortion Statistics, 2005
11
Trend Table 4. Induced Abortion Rates1 by County of Residence, Washington State, 1999-2005 County 1999 2000 2001 2002 2003 2004 2005State Total 20.2 20.2 20.0 19.6 19.3 18.9 18.5Adams 8.7 11.0 10.6 9.5 10.5 10.5 9.5Asotin 9.6 10.4 11.3 10.5 13.9 11.8 10.8Benton 14.6 14.8 14.2 14.8 16.0 13.7 14.5Chelan 13.4 10.7 14.4 12.1 11.7 14.1 11.7Clallam 14.8 16.0 16.6 15.7 15.8 14.0 16.5Clark 17.4 16.7 18.4 17.0 16.2 15.4 15.6Columbia 16.3 8.6 11.5 13.2 8.9 * *Cowlitz 12.9 15.0 16.3 14.6 14.6 12.6 12.5Douglas 8.9 9.0 9.7 6.6 9.0 9.3 8.8Ferry 12.0 9.1 9.2 12.4 11.0 5.6 7.2Franklin 16.5 15.6 13.2 15.9 20.3 15.5 15.3Garfield * * * * * * *Grant 10.6 9.6 11.3 11.0 10.7 10.0 8.2Grays Harbor 16.5 18.5 17.2 17.3 19.0 18.5 16.3Island 14.4 17.0 15.6 16.2 15.2 15.0 14.3Jefferson 18.6 21.3 19.0 17.7 17.4 14.2 14.6King 25.1 24.8 23.7 23.2 23.2 22.4 21.5Kitsap 19.0 17.3 19.4 19.0 17.5 17.6 16.7Kittitas 17.2 15.3 16.8 13.4 13.1 15.4 11.2Klickitat 12.5 10.7 12.5 7.8 10.2 6.5 6.5Lewis 16.9 14.8 16.9 16.9 16.2 15.7 17.7Lincoln 8.7 10.4 7.0 9.5 7.9 8.5 6.2Mason 16.7 19.5 17.2 21.8 19.2 19.5 17.9Okanagan 12.4 13.5 12.5 14.5 13.8 12.9 11.5Pacific 14.0 15.7 12.8 14.6 13.3 16.3 14.4Pend Oreille 10.0 13.9 13.0 13.7 9.9 4.0 7.4Pierce 24.6 24.7 24.8 24.1 23.3 22.8 22.9San Juan 21.4 22.8 12.5 14.9 15.4 20.5 17.1Skagit 16.9 16.0 13.3 11.4 15.3 15.6 17.9Skamania 6.2 10.1 8.1 5.2 8.4 6.2 7.2Snohomish 19.2 19.7 20.5 19.8 18.8 19.6 19.0Spokane 15.2 16.0 17.5 17.2 15.2 16.2 15.4Stevens 6.8 6.8 8.7 10.1 8.2 9.1 9.8Thurston 20.6 21.3 20.4 21.3 20.9 19.1 19.3Wahkiakum * 14.7 * * * * 8.6Walla Walla 14.1 11.5 10.4 11.1 8.8 12.3 9.5Whatcom 16.1 17.0 13.0 10.8 15.9 14.6 15.4Whitman 11.3 10.8 11.1 12.2 9.9 13.6 9.0Yakima 17.6 16.6 17.1 18.0 18.1 16.6 18.31 Total number of induced abortions per 1,000 women of childbearing age (15-44). * Rate not calculated because number of abortions was less than 5.Population Data: See Appendix A: Technical Appendix, Sources of Data: Population.

Washington Pregnancy and Induced Abortion Statistics, 2005
12
Trend Table 5. Induced Abortion Rates1 with Ranks by County, Washington State Residents, 2001-2005
2001 2002 2003 2004 2005Rank County Rate County Rate County Rate County Rate County Rate1 Pierce 24.8 Pierce 24.1 Pierce 23.3 Pierce 22.8 Pierce 22.92 King 23.7 King 23.2 King 23.2 King 22.4 King 21.53 Snohomish 20.5 Mason 21.8 Thurston 20.9 San Juan 20.5 Thurston 19.34 Thurston 20.4 Thurston 21.3 Franklin 20.3 Snohomish 19.6 Snohomish 19.05 Kitsap 19.4 Snohomish 19.8 Mason 19.2 Mason 19.5 Yakima 18.36 Jefferson 19.0 Kitsap 19.0 Grays Harbor 19.0 Thurston 19.1 Skagit 17.97 Clark 18.4 Yakima 18.0 Snohomish 18.8 Grays Harbor 18.5 Mason 17.98 Spokane 17.5 Jefferson 17.7 Yakima 18.1 Kitsap 17.6 Lewis 17.79 Mason 17.2 Grays Harbor 17.3 Kitsap 17.5 Yakima 16.6 San Juan 17.110 Grays Harbor 17.2 Spokane 17.2 Jefferson 17.4 Pacific 16.3 Kitsap 16.7
11 Yakima 17.1 Clark 17.0 Lewis 16.2 Spokane 16.2 Clallam 16.512 Lewis 16.9 Lewis 16.9 Clark 16.2 Lewis 15.7 Grays Harbor 16.313 Kittitas 16.8 Island 16.2 Benton 16.0 Skagit 15.6 Clark 15.614 Clallam 16.6 Franklin 15.9 Whatcom 15.9 Franklin 15.5 Spokane 15.415 Cowlitz 16.3 Clallam 15.7 Clallam 15.8 Kittitas 15.4 Whatcom 15.416 Island 15.6 San Juan 14.9 San Juan 15.4 Clark 15.4 Franklin 15.317 Chelan 14.4 Benton 14.8 Skagit 15.3 Island 15.0 Jefferson 14.618 Benton 14.2 Cowlitz 14.6 Island 15.2 Whatcom 14.6 Benton 14.519 Skagit 13.3 Pacific 14.6 Spokane 15.2 Jefferson 14.2 Pacific 14.420 Franklin 13.2 Okanogan 14.5 Cowlitz 14.6 Chelan 14.1 Island 14.3
21 Pend Oreille 13.0 Pend Oreille 13.7 Asotin 13.9 Clallam 14.0 Cowlitz 12.522 Whatcom 13.0 Kittitas 13.4 Okanogan 13.8 Benton 13.7 Chelan 11.723 Pacific 12.8 Columbia 13.2 Pacific 13.3 Whitman 13.6 Okanogan 11.524 Okanogan 12.5 Ferry 12.4 Kittitas 13.1 Okanogan 12.9 Kittitas 11.225 San Juan 12.5 Whitman 12.2 Chelan 11.7 Cowlitz 12.6 Asotin 10.826 Klickitat 12.5 Chelan 12.1 Ferry 11.0 Walla Walla 12.3 Stevens 9.827 Columbia 11.5 Skagit 11.4 Grant 10.7 Asotin 11.8 Walla Walla 9.528 Asotin 11.3 Walla Walla 11.1 Adams 10.5 Adams 10.5 Adams 9.529 Grant 11.3 Grant 11.0 Klickitat 10.2 Grant 10.0 Whitman 9.030 Whitman 11.1 Whatcom 10.8 Pend Oreille 9.9 Douglas 9.3 Douglas 8.8
31 Adams 10.6 Asotin 10.5 Whitman 9.9 Stevens 9.1 Wahkiakum 8.632 Walla Walla 10.4 Stevens 10.1 Douglas 9.0 Lincoln 8.5 Grant 8.233 Douglas 9.7 Adams 9.5 Columbia 8.9 Klickitat 6.5 Pend Oreille 7.434 Ferry 9.2 Lincoln 9.5 Walla Walla 8.8 Skamania 6.2 Skamania 7.235 Stevens 8.7 Klickitat 7.8 Skamania 8.4 Ferry 5.6 Ferry 7.236 Skamania 8.1 Douglas 6.6 Stevens 8.2 Pend Oreille 4.0 Klickitat 6.537 Lincoln 7.0 Skamania 5.2 Lincoln 7.9 Columbia * Lincoln 6.238 Garfield * Garfield * Garfield * Garfield * Columbia *39 Wahkiakum * Wahkiakum * Wahkiakum * Wahkiakum * Garfield *1Total number of induced abortions per 1,000 women of childbearing age (15-44). *Rate not calculated because number of abortions was less than 5.

Washington Pregnancy and Induced Abortion Statistics, 2005
13
Figure 1. General Fertility Rates1, Washington State Residents Compared to National, 1981-2005
56
58
60
62
64
66
68
70
72
1981
1983
1985
1987
1989
1991
1993
1995
1997
1999
2001
2003
2005
Rat
e1
WA US
1 Total Live Births per 1,000 Women age 15 – 44. Figure 2. Washington State General Fertility Rates by County of Residence 2003 -2005


Washington Pregnancy and Induced Abortion Statistics, 2005
Statistics 2005


Washington Pregnancy and Induced Abortion Statistics, 2005
17
Statistics Tables Table 1. Pregnancy Outcomes of Residents by Woman’s Age, 2005
Total Age Pregnancies Number Percent1 Number Percent1 Number Percent1
State Total 107,306 82,625 77.0 24,162 22.5 519 0.5Under 15 208 84 40.4 124 59.6 0 0.015-19 11,160 6,739 60.4 4,359 39.1 62 0.6
15-17 3,640 1,966 54.0 1,648 45.3 26 0.718-19 7,520 4,773 63.5 2,711 36.1 36 0.5
20-24 28,082 19,911 70.9 8,070 28.7 101 0.425-29 28,682 23,198 80.9 5,349 18.6 135 0.530-34 23,214 19,797 85.3 3,303 14.2 114 0.535-39 12,670 10,490 82.8 2,116 16.7 64 0.540-44 3,027 2,232 73.7 769 25.4 26 0.945 and Over 205 145 70.7 57 27.8 3 1.5Unknown 58 29 50.0 15 25.9 14 24.1
Live Births Abortions Fetal Deaths
1 Percents are the number of live births, abortions, or fetal deaths out of total pregnancies for specific age group. Table 2. Age-Specific Rates1 and Abortion Ratios of Residents, 2005
Female Pregnancy Birth Abortion AbortionAge Population Rate Rate Rate Ratio2
All Ages3 1,308,651 82.0 63.1 18.5 292.4Under 15 215,155 1.0 0.4 0.6 1476.215-19 219,516 50.8 30.7 19.9 646.8 15-17 131,994 27.6 14.9 12.5 838.3 18-19 87,522 85.9 54.5 31.0 568.020-24 217,931 128.9 91.4 37.0 405.325-29 200,430 143.1 115.7 26.7 230.630-34 206,329 112.5 95.9 16.0 166.835-39 220,548 57.4 47.6 9.6 201.740-44 243,897 12.4 9.2 3.2 344.545 and Over 246,902 0.8 0.6 0.2 393.11 Age-Specific rates equal the number of pregnancies, births, or abortions occurring to women in a specific age group per 1,000 female population in that age group. For "Under 15" and "45 and over" the denominators for the age-specific rates are limited to the female populations aged 10-14 and 45-49, respectively.2 The abortion ratio equals the number of abortions per 1,000 live births.3 For the category, "All Ages", rates equal total pregnancies, births, or abortions per 1,000 women aged 15-44 (child-bearing ages).Population Data: See Appendix A: Technical Appendix, Sources of data: Population.

Washington Pregnancy and Induced Abortion Statistics, 2005
18
Table 3. Induced Abortions of Residents by Selected Indicators, 2005
Age Number Percent1 Weeks of Gestation Number Percent1
State Total 24,162 100.0 State Total 24,162 100.0Under 15 124 0.5 1-4 355 1.515-19 4,359 18.0 5-8 14,682 60.8 15-17 1,648 6.8 9 2,266 9.4 18-19 2,711 11.2 10 1,669 6.920-24 8,070 33.4 11 1,294 5.425-29 5,349 22.1 12 896 3.730-34 3,303 13.7 13-15 1,386 5.735-39 2,116 8.8 16-19 986 4.140-44 769 3.2 20 and Over 574 2.445 and Over 57 0.2 Unknown 54 0.2Unknown 15 0.1
Previous Abortions Number Percent1 Previous Live Births Number Percent1
State Total 24,162 100.0 State Total 24,162 100.00 12,547 51.9 0 11,046 45.71 6,406 26.5 1 5,952 24.62 2,862 11.8 2 4,488 18.63 1,258 5.2 3 1,791 7.44 570 2.4 4 582 2.4Over 4 471 1.9 Over 4 280 1.2Unknown 48 0.2 Unknown 23 0.1
Previous Pregnancies Number Percent1 Race Number3
State Total 24,162 100.0 State Total 24,1620 6,827 28.3 White 11,5031 4,806 19.9 Black 1,2322 4,012 16.6 Native American 3503 3,093 12.8 Asian 1,3124 2,197 9.1 Multiple Races 428Over 4 3,172 13.1 Other 111Unknown 55 0.2 Unknown 9,226
Hispanic Origin4 1,353
A. Age of Woman B. Weeks of Gestation2
C. Previous Abortions D. Previous Live Births
3 Due to the large number of unknowns, percent by race is not calculated.4 Hispanic Origin is considered an ethnicity not a race. Abortions for women of Hispanic Origin are also counted under the woman's race.
E. Previous Pregnancies F. Race and Hispanic Ethnicity
1 Detail may not add to 100% due to rounding.2 Weeks of gestation are estimated by the physician and may differ from weeks calculated from last known menses.

Washington Pregnancy and Induced Abortion Statistics, 2005
19
Table 4. Induced Abortions of Residents by Woman's Age and Weeks of Gestation, 2005
Age Total # % # % # % # % # % # %
State Total 24,162 15,037 62.2 6,125 25.3 1,386 5.7 986 4.1 574 2.4 54 0.2Under 15 124 51 41.1 45 36.3 13 10.5 10 8.1 5 4.0 0 *15-19 4,359 2,370 54.4 1,325 30.4 317 7.3 213 4.9 124 2.8 10 0.2
15-17 1,648 827 50.2 549 33.3 123 7.5 102 6.2 43 2.6 4 *18-19 2,711 1,543 56.9 776 28.6 194 7.2 111 4.1 81 3.0 6 0.2
20-24 8,070 4,873 60.4 2,175 27.0 469 5.8 346 4.3 192 2.4 15 0.225-29 5,349 3,463 64.7 1,280 23.9 279 5.2 196 3.7 121 2.3 10 0.230-34 3,303 2,233 67.6 733 22.2 158 4.8 108 3.3 64 1.9 7 0.235-39 2,116 1,455 68.8 411 19.4 110 5.2 83 3.9 51 2.4 6 0.340-44 769 537 69.8 151 19.6 36 4.7 24 3.1 15 2.0 6 0.845 and Over 57 45 78.9 4 * 2 * 5 8.8 1 * 0 *Unknown 15 10 66.7 1 * 2 * 1 * 1 * 0 *1 Percents are row-wise percentages which show the proportion of abortions terminated at each gestational age.* Percent not calculated because number of events was less than 5.
Weeks of Gestation1
Under 9 9-12 13-15 16-19 20 + Unknown

Washington Pregnancy and Induced Abortion Statistics, 2005
20
Table 5. Previous Live Births of Women Having Abortions by Age, Washington State Residents, 2005
Age 0 1 2 3 4 Over 4 Unknown
State Total 24,162 11,046 5,952 4,488 1,791 582 280 23Under 15 124 121 3 0 0 0 0 015-19 4,359 3,615 644 82 13 0 0 5 15 - 17 1,648 1,490 149 3 2 0 0 4 18 - 19 2,711 2,125 495 79 11 0 0 120 - 24 8,070 4,317 2,355 1,094 252 36 10 625 - 29 5,349 1,727 1,495 1,318 562 170 72 530 - 34 3,303 763 800 1,006 478 170 83 335 - 39 2,116 370 485 688 349 145 77 240 - 44 769 127 151 283 121 53 32 245 and Over 57 2 12 15 14 8 6 0Unknown 15 4 7 2 2 0 0 0
Previous Live Births Total Abortions
Table 6. Previous Induced Abortions of Women Having Abortions by, Age Washington State Residents, 2005
Age Total 0 1 2 3 4 Over 4 Unknown
State Total 24,162 12,547 6,406 2,862 1,258 570 471 48Under 15 124 121 3 0 0 0 0 015-19 4,359 3,462 707 140 31 11 2 6 15 - 17 1,648 1,410 201 29 3 1 0 4 18 - 19 2,711 2,052 506 111 28 10 2 220 - 24 8,070 4,505 2,211 833 314 120 77 1025 - 29 5,349 2,137 1,593 860 420 182 150 730 - 34 3,303 1,218 977 538 276 142 144 835 - 39 2,116 748 676 353 174 81 75 940 - 44 769 326 218 125 39 33 21 745 and Over 57 21 18 11 3 1 2 1Unknown 15 9 3 2 1 0 0 0
Previous Induced Abortions

Washington Pregnancy and Induced Abortion Statistics, 2005
21
Table 7. Induced Abortions by Woman's Age and Place of Occurrence or Residence, 2005
Age
State Total 24,162 16,460 7,694 8Under 15 124 77 47 015-19 4,359 3,019 1,339 1 15 - 17 1,648 1,113 534 1 18 - 19 2,711 1,906 805 020 - 24 8,070 5,437 2,630 325 - 29 5,349 3,685 1,663 130 - 34 3,303 2,273 1,030 035 - 39 2,116 1,419 695 240 - 44 769 514 254 145 and Over 57 32 25 0Unknown 15 4 11 0
Age
State Total 24,108 16,460 7,639 9Under 15 132 77 55 015-19 4,404 3,019 1,384 1 15 - 17 1,650 1,113 536 1 18 - 19 2,754 1,906 848 020 - 24 8,055 5,437 2,615 325 - 29 5,294 3,685 1,607 230 - 34 3,277 2,273 1,004 035 - 39 2,106 1,419 685 240 - 44 775 514 260 145 and Over 58 32 26 0Unknown 7 4 3 0
A. Abortions of State Residents by Place of Occurrence
B. Occurrences by Place of Residence
Total Inside Home County Outside Home County Residence Unknown
Total County ResidentOut-of-County
Resident Residence Unknown

Washington Pregnancy and Induced Abortion Statistics, 2005
22
Table 8. Induced Abortions Occurring Within Washington State by Selected Indicators, 2005
State or Country Number Percent Type of Complication Number Percent
State Total 24,108 100.0 Complications Total1 263 1.1Washington 22,901 95.0 Retained Products 159 0.7Idaho 591 2.5 Failed Abortion 26 0.1Alaska 234 1.0 Hemorrhage > 500 cc 7 0.0Oregon 218 0.9 Infection 15 0.1California 22 0.1 Cervical Laceration 9 0.0Montana 17 0.1 Uterine Perforation 3 0.0Canada 67 0.3 Other Complications2 36 0.1Other States or Countries 56 0.2 Multiple Complications3
8 0
Unknown 2 0.0 Unknown if Complications 6 0.0No Complications 23,839 98.9
Type of Facility Number Percent
State Total 24,108 100.0Hospital 317 1.3Nonhospital 23,791 98.7
Type of Procedure Number Percent Type of Procedure Number Percent
State Total 24,108 100.0 Sec. Mgmt. Total1 261 1.1Suction Curettage 17,770 73.7 Resuction 221 0.9Dilation & Evacuation (D&E) 2,309 9.6 Hospitalization 27 0.1Medical (nonsurgical) 3969 16.5 Laparoscopy 0 0.0Intrauterine Instillation 26 0.1 Transfusion 0 0.0Sharp Curettage 14 0.1 Laparotomy 1 0.0Hysterotomy/Hysterectomy 1 0.0 Multiple Management
.0
212 0.0
Other Procedures1 16 0.1 Unknown if Sec. Mgmt. 6 0.0Unknown 3 0.0 No Secondary Mgmt. 23,841 98.9
2 Includes 6 patients with hospitalization and resuction.
A. State or Country of Residence D. Complications
B. Type of Facility
1 The total number of patients with complications was 263; total complications was 272. 2 Other complications include: 5 clots, 6 bleeding, 1 PAS, 2 endometritis, 2 hematometria, 1 ectopic.3 Includes: 8 retained products, 5 hemotometria, 2 infections.
1 The total number of patients receiving secondary management care was 261; total number of secondary care procedures was 276.
Note: Percents may not add to 100% due to rounding.
1 Other procedures includes: 9 labor inductions, 3 laminaria, 2 prostin injections, 2 other injections.
C. Operative Procedure E. Secondary Management
Washington Pregnancy and Induced Abortion Statistics, 2005
23
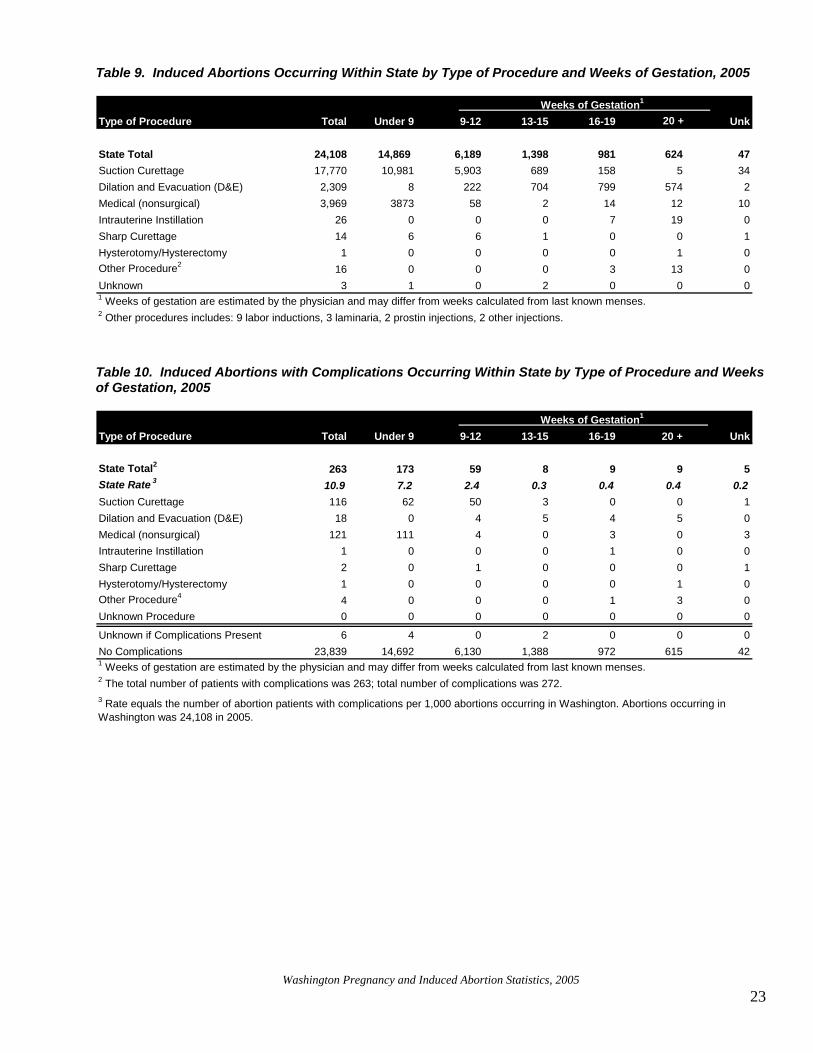
Table 9. Induced Abortions Occurring Within State by Type of Procedure and Weeks of Gestation, 2005
Type of Procedure Total Under 9 9-12 13-15 16-19 20 + Unk
State Total 24,108 14,869 6,189 1,398 981 624 47Suction Curettage 17,770 10,981 5,903 689 158 5 34Dilation and Evacuation (D&E) 2,309 8 222 704 799 574 2Medical (nonsurgical) 3,969 3873 58 2 14 12 10Intrauterine Instillation 26 0 0 0 7 19 0Sharp Curettage 14 6 6 1 0 0 1Hysterotomy/Hysterectomy 1 0 0 0 0 1 0Other Procedure2 16 0 0 0 3 13 0Unknown 3 1 0 2 0 0 01 Weeks of gestation are estimated by the physician and may differ from weeks calculated from last known menses.2 Other procedures includes: 9 labor inductions, 3 laminaria, 2 prostin injections, 2 other injections.
Weeks of Gestation1
Table 10. Induced Abortions with Complications Occurring Within State by Type of Procedure and Weeks of Gestation, 2005
Type of Procedure Total Under 9 9-12 13-15 16-19 20 + Unk
State Total2 263 173 59 8 9 9 5State Rate 3 10.9 7.2 2.4 0.3 0.4 0.4 0.2Suction Curettage 116 62 50 3 0 0 1Dilation and Evacuation (D&E) 18 0 4 5 4 5 0Medical (nonsurgical) 121 111 4 0 3 0 3Intrauterine Instillation 1 0 0 0 1 0 0Sharp Curettage 2 0 1 0 0 0 1Hysterotomy/Hysterectomy 1 0 0 0 0 1 0Other Procedure4 4 0 0 0 1 3 0Unknown Procedure 0 0 0 0 0 0 0
Unknown if Complications Present 6 4 0 2 0 0 0No Complications 23,839 14,692 6,130 1,388 972 615 421 Weeks of gestation are estimated by the physician and may differ from weeks calculated from last known menses.2 The total number of patients with complications was 263; total number of complications was 272.
Weeks of Gestation1
3 Rate equals the number of abortion patients with complications per 1,000 abortions occurring in Washington. Abortions occurring in Washington was 24,108 in 2005.

Washington Pregnancy and Induced Abortion Statistics, 2005
24
Table 11. Induced Abortions with Secondary Management Occurring Within State by Type, 2005
Type of Procedure Total Under 9 9-12 13-15 16-19 20 + Unk
State Total2 261 165 54 6 11 19 6State Rate 3 10.8 6.8 2.2 0.2 0.5 0.8 0.2Suction Curettage 105 56 46 2 0 0 1Dilation and Evacuation (D&E) 16 1 3 4 2 5 1Medical (nonsurgical) 123 107 4 0 5 4 3Intrauterine Instillation 8 0 0 0 3 5 0Sharp Curettage 3 1 1 0 0 0 1Hysterotomy/Hysterectomy 1 0 0 0 0 1 0Other Procedure 5 0 0 0 1 4 0Unknown Procedure 0 0 0 0 0 0 0
Unknown if Sec. Mgmt. 6 3 1 2 0 0 0No Secondary Management 23,841 14,701 6,134 1,390 970 605 41Footnotes: See bottom of page.
Weeks of Gestation1
Table 12. Induced Abortions with Secondary Management Occurring Within State by Type of Secondary Management and Weeks of Gestation, 2005 Weeks of Gestation1
Type of Management Care Total Under 9 9-12 13-15 16-19 20 + Unk
State Total2 261 165 54 6 11 19 6State Rate 3 10.8 6.8 2.2 0.2 0.5 0.8 0.2Resuction 221 152 49 5 5 5 5Hospitalization 27 5 3 1 6 12 0Laparoscopy 0 0 0 0 0 0 0Transfusion 0 0 0 0 0 0 0Laparotomy 1 0 0 0 0 1 0Multiple Management4 12 8 2 0 0 1 1
Unknown if Sec. Mgmt. 6 3 1 2 0 0 0No Secondary Management 23,841 14,701 6,134 1,390 970 605 411 Weeks of gestation are estimated by the physician and may differ from weeks calculated from last known menses.
3 Rate equals the number of abortion patients with complications per 1,000 abortions occurring in Washington. Abortions occurring in Washington was 24,108 in 2005.
2 The total number of patients receiving secondary management care was 261; total number of secondary care procedures was 276.

Washington Pregnancy and Induced Abortion Statistics, 2005
25
Table 13. Induced Abortions with Complications Occurring Within State by Type of Complication and Weeks of Gestation, 2005
Type of Complication Total Under 9 9-12 13-15 16-19 20 + Unk
Patients w/Complic.2 263 173 59 8 9 9 5State Rate 3 10.9 7.2 2.4 0.3 0.4 0.4 0.2Retained Products 159 109 36 2 5 4 3Failed Abortion 26 25 1 0 0 0 0Hemorrhage > 500 cc 7 1 2 0 1 3 0Infection 3 0 2 1 0 0 0Cervical Laceration 15 10 3 1 1 0 0Uterine Perforation 9 4 3 2 0 0 0Other Complications4 36 17 11 2 2 2 2Multiple Complications5
8 7 1 0 0 0 0
Unknown if Complications Present 6 4 0 2 0 0 0No Complications 23,839 14,692 6,130 1,388 972 615 42Footnotes: See bottom of page.
Weeks of Gestation1
Table 14. Induced Abortions with Complications Occurring Within State by Type of Complication and Secondary Management Procedure, 2005
Type of Complication Total ResectionHospital-
ization TransfusionLaparo-
scopyLapa-
rotomyMultipleMgmt.6 None Unk
State Total 24,108 221 27 0 0 1 12 23,841 6Patients w/Complic. 2 263 221 12 0 0 1 10 19 0Retained Products 159 157 0 0 0 0 0 2 0Failed Abortion 26 25 0 0 0 0 0 1 0Hemorrhage > 500 cc 7 0 4 0 0 1 2 0Infection 3 1 0 0 0 0 2 0Cervical Laceration 15 10 2 0 0 0 1 2 0Uterine Perforation 9 4 0 0 0 0 0 5Other Complications4 36 20 5 0 0 0 2 9 0Multiple Complications
00
0
5 8 4 1 0 0 0 3 0Unknown if Complications 6 0 0 0 0 0 0 1No Complications 23,839 0 15 0 0 0 2 23,821 11 Weeks of gestation are estimated by the physician and may differ from weeks calculated from last known menses.2 The total number of patients with complications was 263; total complications was 272. 3 Rate equals the number of abortion patients with complications per 1,000 abortions occurring in Washington.4 Other complications include: 5 clots, 6 bleeding, 1 PAS, 2 endometritis, 2 hematometria, 1 ectopic.5Includes: 8 retained products, 5 hemotometria, 2 infections.6 Includes 6 patients with hospitalization and resection.
Secondary Management Procedure
05
Washington Pregnancy and Induced Abortion Statistics, 2005
26
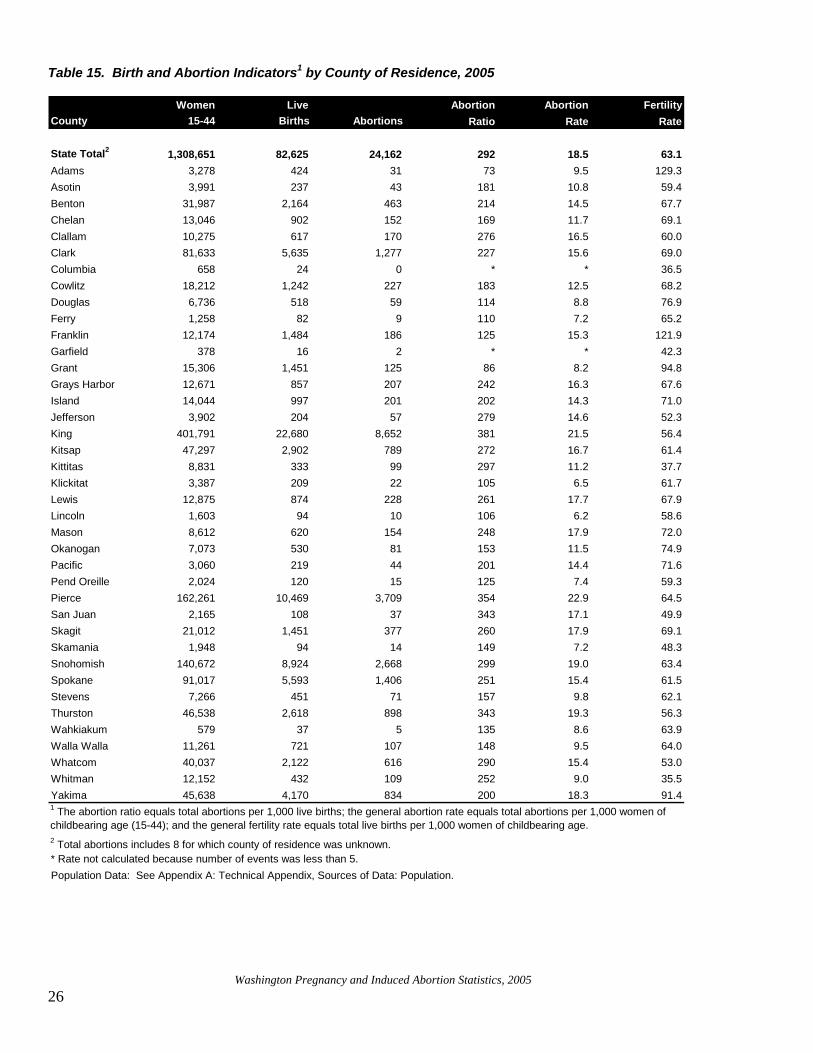
Table 15. Birth and Abortion Indicators1 by County of Residence, 2005
Women Live Abortion Abortion FertilityCounty 15-44 Births Abortions Ratio Rate Rate
State Total2 1,308,651 82,625 24,162 292 18.5 63.1Adams 3,278 424 31 73 9.5 129.3Asotin 3,991 237 43 181 10.8 59.4Benton 31,987 2,164 463 214 14.5 67.7Chelan 13,046 902 152 169 11.7 69.1Clallam 10,275 617 170 276 16.5 60.0Clark 81,633 5,635 1,277 227 15.6 69.0Columbia 658 24 0 * * 36.5Cowlitz 18,212 1,242 227 183 12.5 68.2Douglas 6,736 518 59 114 8.8 76.9Ferry 1,258 82 9 110 7.2 65.2Franklin 12,174 1,484 186 125 15.3 121.9Garfield 378 16 2 * * 42.3Grant 15,306 1,451 125 86 8.2 94.8Grays Harbor 12,671 857 207 242 16.3 67.6Island 14,044 997 201 202 14.3 71.0Jefferson 3,902 204 57 279 14.6 52.3King 401,791 22,680 8,652 381 21.5 56.4Kitsap 47,297 2,902 789 272 16.7 61.4Kittitas 8,831 333 99 297 11.2 37.7Klickitat 3,387 209 22 105 6.5 61.7Lewis 12,875 874 228 261 17.7 67.9Lincoln 1,603 94 10 106 6.2 58.6Mason 8,612 620 154 248 17.9 72.0Okanogan 7,073 530 81 153 11.5 74.9Pacific 3,060 219 44 201 14.4 71.6Pend Oreille 2,024 120 15 125 7.4 59.3Pierce 162,261 10,469 3,709 354 22.9 64.5San Juan 2,165 108 37 343 17.1 49.9Skagit 21,012 1,451 377 260 17.9 69.1Skamania 1,948 94 14 149 7.2 48.3Snohomish 140,672 8,924 2,668 299 19.0 63.4Spokane 91,017 5,593 1,406 251 15.4 61.5Stevens 7,266 451 71 157 9.8 62.1Thurston 46,538 2,618 898 343 19.3 56.3Wahkiakum 579 37 5 135 8.6 63.9Walla Walla 11,261 721 107 148 9.5 64.0Whatcom 40,037 2,122 616 290 15.4 53.0Whitman 12,152 432 109 252 9.0 35.5Yakima 45,638 4,170 834 200 18.3 91.4
Population Data: See Appendix A: Technical Appendix, Sources of Data: Population.
1 The abortion ratio equals total abortions per 1,000 live births; the general abortion rate equals total abortions per 1,000 women of childbearing age (15-44); and the general fertility rate equals total live births per 1,000 women of childbearing age.2 Total abortions includes 8 for which county of residence was unknown.* Rate not calculated because number of events was less than 5.
Washington Pregnancy and Induced Abortion Statistics, 2005
27
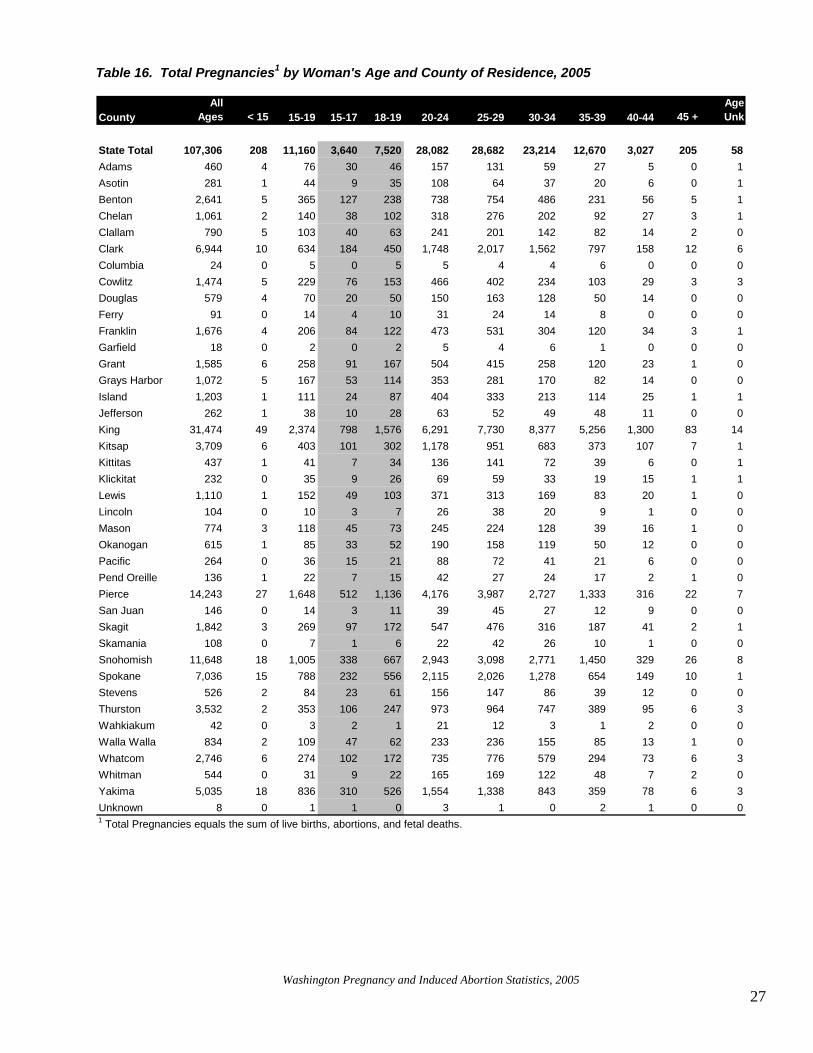
Table 16. Total Pregnancies1 by Woman's Age and County of Residence, 2005
CountyAll
Ages < 15 15-19 15-17 18-19 20-24 25-29 30-34 35-39 40-44 45 +AgeUnk
State Total 107,306 208 11,160 3,640 7,520 28,082 28,682 23,214 12,670 3,027 205 58Adams 460 4 76 30 46 157 131 59 27 5 0 1Asotin 281 1 44 9 35 108 64 37 20 6 0 1Benton 2,641 5 365 127 238 738 754 486 231 56 5 1Chelan 1,061 2 140 38 102 318 276 202 92 27 3 1Clallam 790 5 103 40 63 241 201 142 82 14 2 0Clark 6,944 10 634 184 450 1,748 2,017 1,562 797 158 12 6Columbia 24 0 5 0 5 5 4 4 6 0 0 0Cowlitz 1,474 5 229 76 153 466 402 234 103 29 3 3Douglas 579 4 70 20 50 150 163 128 50 14 0 0Ferry 91 0 14 4 10 31 24 14 8 0 0 0Franklin 1,676 4 206 84 122 473 531 304 120 34 3 1Garfield 18 0 2 0 2 5 4 6 1 0 0 0Grant 1,585 6 258 91 167 504 415 258 120 23 1 0Grays Harbor 1,072 5 167 53 114 353 281 170 82 14 0 0Island 1,203 1 111 24 87 404 333 213 114 25 1 1Jefferson 262 1 38 10 28 63 52 49 48 11 0 0King 31,474 49 2,374 798 1,576 6,291 7,730 8,377 5,256 1,300 83 14Kitsap 3,709 6 403 101 302 1,178 951 683 373 107 7 1Kittitas 437 1 41 7 34 136 141 72 39 6 0 1Klickitat 232 0 35 9 26 69 59 33 19 15 1 1Lewis 1,110 1 152 49 103 371 313 169 83 20 1 0Lincoln 104 0 10 3 7 26 38 20 9 1 0 0Mason 774 3 118 45 73 245 224 128 39 16 1 0Okanogan 615 1 85 33 52 190 158 119 50 12 0 0Pacific 264 0 36 15 21 88 72 41 21 6 0 0Pend Oreille 136 1 22 7 15 42 27 24 17 2 1 0Pierce 14,243 27 1,648 512 1,136 4,176 3,987 2,727 1,333 316 22 7San Juan 146 0 14 3 11 39 45 27 12 9 0 0Skagit 1,842 3 269 97 172 547 476 316 187 41 2 1Skamania 108 0 7 1 6 22 42 26 10 1 0 0Snohomish 11,648 18 1,005 338 667 2,943 3,098 2,771 1,450 329 26 8Spokane 7,036 15 788 232 556 2,115 2,026 1,278 654 149 10 1Stevens 526 2 84 23 61 156 147 86 39 12 0 0Thurston 3,532 2 353 106 247 973 964 747 389 95 6 3Wahkiakum 42 0 3 2 1 21 12 3 1 2 0 0Walla Walla 834 2 109 47 62 233 236 155 85 13 1 0Whatcom 2,746 6 274 102 172 735 776 579 294 73 6 3Whitman 544 0 31 9 22 165 169 122 48 7 2 0Yakima 5,035 18 836 310 526 1,554 1,338 843 359 78 6 3Unknown 8 0 1 1 0 3 1 0 2 1 0 01 Total Pregnancies equals the sum of live births, abortions, and fetal deaths.
Washington Pregnancy and Induced Abortion Statistics, 2005
28
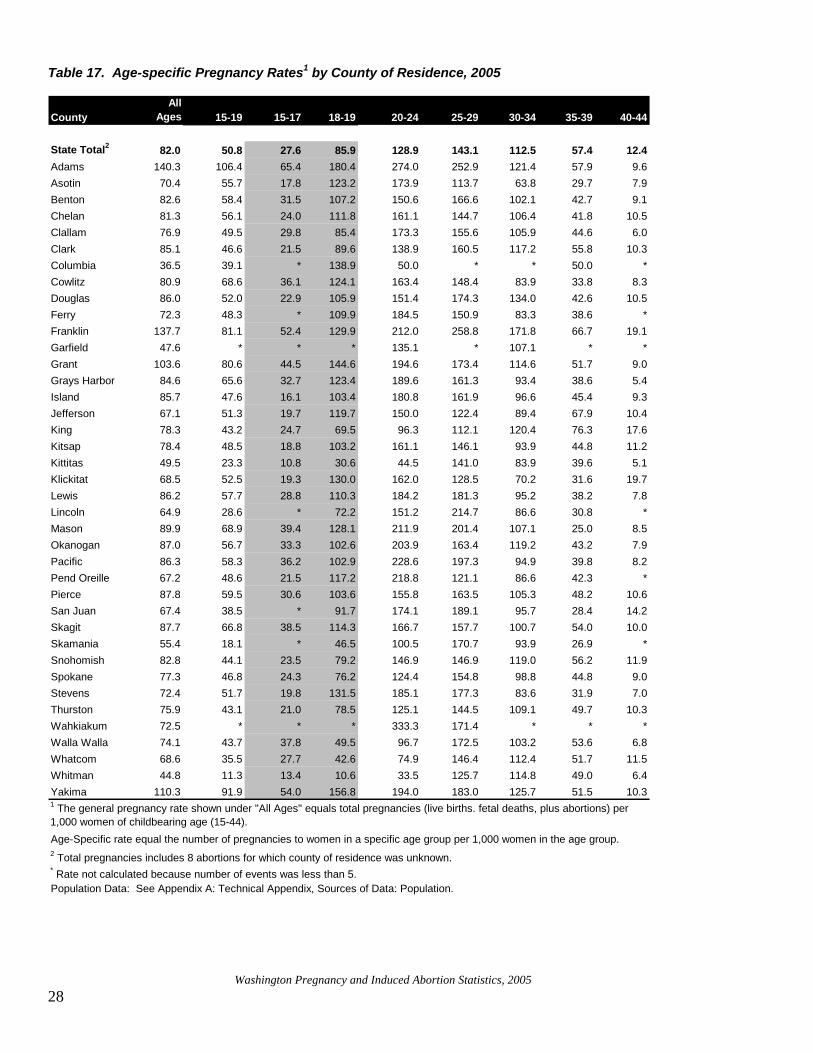
Table 17. Age-specific Pregnancy Rates1 by County of Residence, 2005
CountyAll
Ages 15-19 15-17 18-19 20-24 25-29 30-34 35-39 40-44
State Total2 82.0 50.8 27.6 85.9 128.9 143.1 112.5 57.4 12.4Adams 140.3 106.4 65.4 180.4 274.0 252.9 121.4 57.9 9.6Asotin 70.4 55.7 17.8 123.2 173.9 113.7 63.8 29.7 7.9Benton 82.6 58.4 31.5 107.2 150.6 166.6 102.1 42.7 9.1Chelan 81.3 56.1 24.0 111.8 161.1 144.7 106.4 41.8 10.5Clallam 76.9 49.5 29.8 85.4 173.3 155.6 105.9 44.6 6.0Clark 85.1 46.6 21.5 89.6 138.9 160.5 117.2 55.8 10.3Columbia 36.5 39.1 * 138.9 50.0 * * 50.0 *Cowlitz 80.9 68.6 36.1 124.1 163.4 148.4 83.9 33.8 8.3Douglas 86.0 52.0 22.9 105.9 151.4 174.3 134.0 42.6 10.5Ferry 72.3 48.3 * 109.9 184.5 150.9 83.3 38.6 *Franklin 137.7 81.1 52.4 129.9 212.0 258.8 171.8 66.7 19.1Garfield 47.6 * * * 135.1 * 107.1 * *Grant 103.6 80.6 44.5 144.6 194.6 173.4 114.6 51.7 9.0Grays Harbor 84.6 65.6 32.7 123.4 189.6 161.3 93.4 38.6 5.4Island 85.7 47.6 16.1 103.4 180.8 161.9 96.6 45.4 9.3Jefferson 67.1 51.3 19.7 119.7 150.0 122.4 89.4 67.9 10.4King 78.3 43.2 24.7 69.5 96.3 112.1 120.4 76.3 17.6Kitsap 78.4 48.5 18.8 103.2 161.1 146.1 93.9 44.8 11.2Kittitas 49.5 23.3 10.8 30.6 44.5 141.0 83.9 39.6 5.1Klickitat 68.5 52.5 19.3 130.0 162.0 128.5 70.2 31.6 19.7Lewis 86.2 57.7 28.8 110.3 184.2 181.3 95.2 38.2 7.8Lincoln 64.9 28.6 * 72.2 151.2 214.7 86.6 30.8 *Mason 89.9 68.9 39.4 128.1 211.9 201.4 107.1 25.0 8.5Okanogan 87.0 56.7 33.3 102.6 203.9 163.4 119.2 43.2 7.9Pacific 86.3 58.3 36.2 102.9 228.6 197.3 94.9 39.8 8.2Pend Oreille 67.2 48.6 21.5 117.2 218.8 121.1 86.6 42.3 *Pierce 87.8 59.5 30.6 103.6 155.8 163.5 105.3 48.2 10.6San Juan 67.4 38.5 * 91.7 174.1 189.1 95.7 28.4 14.2Skagit 87.7 66.8 38.5 114.3 166.7 157.7 100.7 54.0 10.0Skamania 55.4 18.1 * 46.5 100.5 170.7 93.9 26.9 *Snohomish 82.8 44.1 23.5 79.2 146.9 146.9 119.0 56.2 11.9Spokane 77.3 46.8 24.3 76.2 124.4 154.8 98.8 44.8 9.0Stevens 72.4 51.7 19.8 131.5 185.1 177.3 83.6 31.9 7.0Thurston 75.9 43.1 21.0 78.5 125.1 144.5 109.1 49.7 10.3Wahkiakum 72.5 * * * 333.3 171.4 * * *Walla Walla 74.1 43.7 37.8 49.5 96.7 172.5 103.2 53.6 6.8Whatcom 68.6 35.5 27.7 42.6 74.9 146.4 112.4 51.7 11.5Whitman 44.8 11.3 13.4 10.6 33.5 125.7 114.8 49.0 6.4Yakima 110.3 91.9 54.0 156.8 194.0 183.0 125.7 51.5 10.3
* Rate not calculated because number of events was less than 5.Population Data: See Appendix A: Technical Appendix, Sources of Data: Population.
1 The general pregnancy rate shown under "All Ages" equals total pregnancies (live births. fetal deaths, plus abortions) per 1,000 women of childbearing age (15-44).Age-Specific rate equal the number of pregnancies to women in a specific age group per 1,000 women in the age group.2 Total pregnancies includes 8 abortions for which county of residence was unknown.
Washington Pregnancy and Induced Abortion Statistics, 2005
29
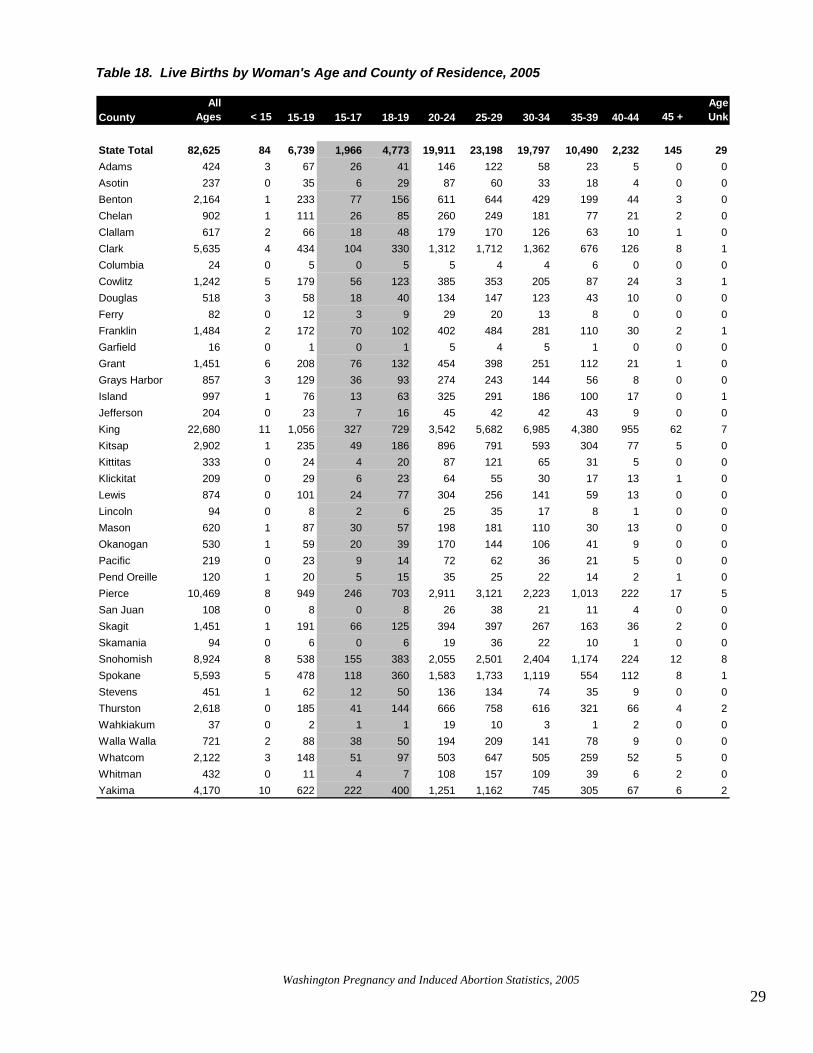
Table 18. Live Births by Woman's Age and County of Residence, 2005
CountyAll
Ages < 15 15-19 15-17 18-19 20-24 25-29 30-34 35-39 40-44 45 +AgeUnk
State Total 82,625 84 6,739 1,966 4,773 19,911 23,198 19,797 10,490 2,232 145 29Adams 424 3 67 26 41 146 122 58 23 5 0 0Asotin 237 0 35 6 29 87 60 33 18 4 0 0Benton 2,164 1 233 77 156 611 644 429 199 44 3 0Chelan 902 1 111 26 85 260 249 181 77 21 2 0Clallam 617 2 66 18 48 179 170 126 63 10 1 0Clark 5,635 4 434 104 330 1,312 1,712 1,362 676 126 8 1Columbia 24 0 5 0 5 5 4 4 6 0 0 0Cowlitz 1,242 5 179 56 123 385 353 205 87 24 3 1Douglas 518 3 58 18 40 134 147 123 43 10 0 0Ferry 82 0 12 3 9 29 20 13 8 0 0 0Franklin 1,484 2 172 70 102 402 484 281 110 30 2 1Garfield 16 0 1 0 1 5 4 5 1 0 0 0Grant 1,451 6 208 76 132 454 398 251 112 21 1 0Grays Harbor 857 3 129 36 93 274 243 144 56 8 0 0Island 997 1 76 13 63 325 291 186 100 17 0 1Jefferson 204 0 23 7 16 45 42 42 43 9 0 0King 22,680 11 1,056 327 729 3,542 5,682 6,985 4,380 955 62 7Kitsap 2,902 1 235 49 186 896 791 593 304 77 5 0Kittitas 333 0 24 4 20 87 121 65 31 5 0 0Klickitat 209 0 29 6 23 64 55 30 17 13 1 0Lewis 874 0 101 24 77 304 256 141 59 13 0 0Lincoln 94 0 8 2 6 25 35 17 8 1 0 0Mason 620 1 87 30 57 198 181 110 30 13 0 0Okanogan 530 1 59 20 39 170 144 106 41 9 0 0Pacific 219 0 23 9 14 72 62 36 21 5 0 0Pend Oreille 120 1 20 5 15 35 25 22 14 2 1 0Pierce 10,469 8 949 246 703 2,911 3,121 2,223 1,013 222 17 5San Juan 108 0 8 0 8 26 38 21 11 4 0 0Skagit 1,451 1 191 66 125 394 397 267 163 36 2 0Skamania 94 0 6 0 6 19 36 22 10 1 0 0Snohomish 8,924 8 538 155 383 2,055 2,501 2,404 1,174 224 12 8Spokane 5,593 5 478 118 360 1,583 1,733 1,119 554 112 8 1Stevens 451 1 62 12 50 136 134 74 35 9 0 0Thurston 2,618 0 185 41 144 666 758 616 321 66 4 2Wahkiakum 37 0 2 1 1 19 10 3 1 2 0Walla Walla 721 2 88 38 50 194 209 141 78 9 0 0Whatcom 2,122 3 148 51 97 503 647 505 259 52 5 0Whitman 432 0 11 4 7 108 157 109 39 6 2 0Yakima 4,170 10 622 222 400 1,251 1,162 745 305 67 6 2
0
Washington Pregnancy and Induced Abortion Statistics, 2005
30
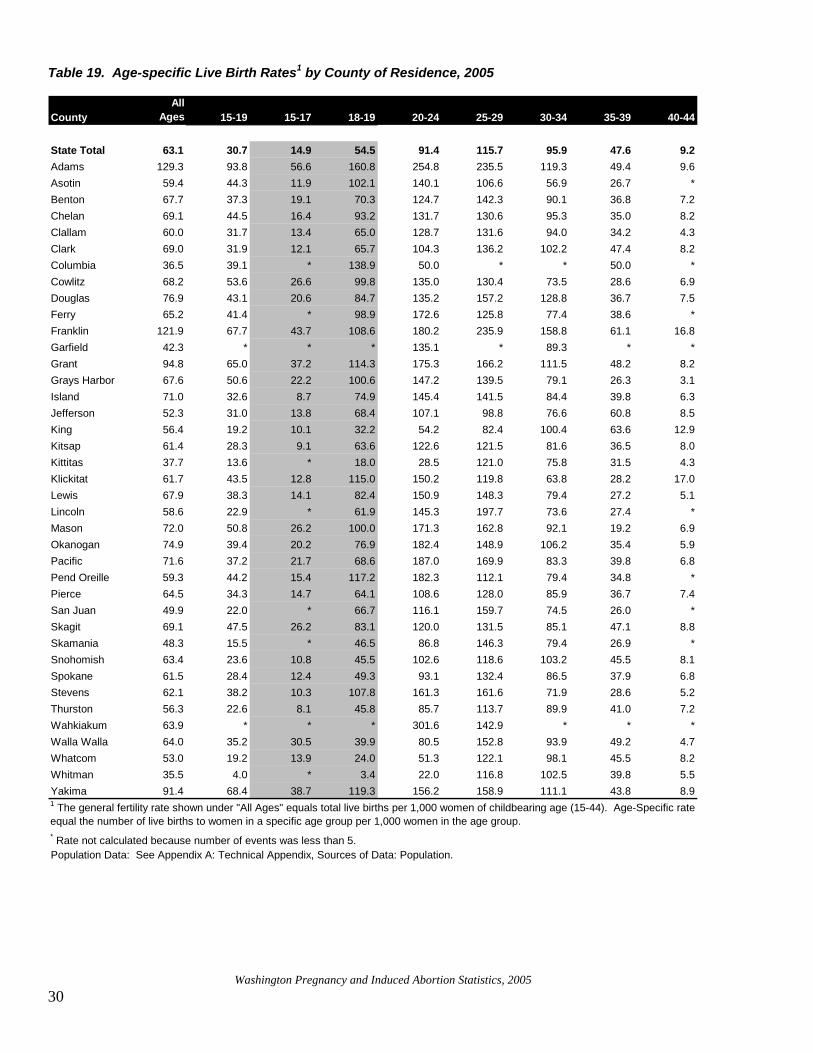
Table 19. Age-specific Live Birth Rates1 by County of Residence, 2005
CountyAll
Ages 15-19 15-17 18-19 20-24 25-29 30-34 35-39 40-44
State Total 63.1 30.7 14.9 54.5 91.4 115.7 95.9 47.6 9.2Adams 129.3 93.8 56.6 160.8 254.8 235.5 119.3 49.4 9.6Asotin 59.4 44.3 11.9 102.1 140.1 106.6 56.9 26.7 *Benton 67.7 37.3 19.1 70.3 124.7 142.3 90.1 36.8 7.2Chelan 69.1 44.5 16.4 93.2 131.7 130.6 95.3 35.0 8.2Clallam 60.0 31.7 13.4 65.0 128.7 131.6 94.0 34.2 4.3Clark 69.0 31.9 12.1 65.7 104.3 136.2 102.2 47.4 8.2Columbia 36.5 39.1 * 138.9 50.0 * * 50.0 *Cowlitz 68.2 53.6 26.6 99.8 135.0 130.4 73.5 28.6 6.9Douglas 76.9 43.1 20.6 84.7 135.2 157.2 128.8 36.7 7.5Ferry 65.2 41.4 * 98.9 172.6 125.8 77.4 38.6 *Franklin 121.9 67.7 43.7 108.6 180.2 235.9 158.8 61.1 16.8Garfield 42.3 * * * 135.1 * 89.3 * *Grant 94.8 65.0 37.2 114.3 175.3 166.2 111.5 48.2 8.2Grays Harbor 67.6 50.6 22.2 100.6 147.2 139.5 79.1 26.3 3.1Island 71.0 32.6 8.7 74.9 145.4 141.5 84.4 39.8 6.3Jefferson 52.3 31.0 13.8 68.4 107.1 98.8 76.6 60.8 8.5King 56.4 19.2 10.1 32.2 54.2 82.4 100.4 63.6 12.9Kitsap 61.4 28.3 9.1 63.6 122.6 121.5 81.6 36.5 8.0Kittitas 37.7 13.6 * 18.0 28.5 121.0 75.8 31.5 4.3Klickitat 61.7 43.5 12.8 115.0 150.2 119.8 63.8 28.2 17.0Lewis 67.9 38.3 14.1 82.4 150.9 148.3 79.4 27.2 5.1Lincoln 58.6 22.9 * 61.9 145.3 197.7 73.6 27.4 *Mason 72.0 50.8 26.2 100.0 171.3 162.8 92.1 19.2 6.9Okanogan 74.9 39.4 20.2 76.9 182.4 148.9 106.2 35.4 5.9Pacific 71.6 37.2 21.7 68.6 187.0 169.9 83.3 39.8 6.8Pend Oreille 59.3 44.2 15.4 117.2 182.3 112.1 79.4 34.8 *Pierce 64.5 34.3 14.7 64.1 108.6 128.0 85.9 36.7 7.4San Juan 49.9 22.0 * 66.7 116.1 159.7 74.5 26.0 *Skagit 69.1 47.5 26.2 83.1 120.0 131.5 85.1 47.1 8.8Skamania 48.3 15.5 * 46.5 86.8 146.3 79.4 26.9 *Snohomish 63.4 23.6 10.8 45.5 102.6 118.6 103.2 45.5 8.1Spokane 61.5 28.4 12.4 49.3 93.1 132.4 86.5 37.9 6.8Stevens 62.1 38.2 10.3 107.8 161.3 161.6 71.9 28.6 5.2Thurston 56.3 22.6 8.1 45.8 85.7 113.7 89.9 41.0 7.2Wahkiakum 63.9 * * * 301.6 142.9 * * *Walla Walla 64.0 35.2 30.5 39.9 80.5 152.8 93.9 49.2 4.7Whatcom 53.0 19.2 13.9 24.0 51.3 122.1 98.1 45.5 8.2Whitman 35.5 4.0 * 3.4 22.0 116.8 102.5 39.8 5.5Yakima 91.4 68.4 38.7 119.3 156.2 158.9 111.1 43.8 8.91 The general fertility rate shown under "All Ages" equals total live births per 1,000 women of childbearing age (15-44). Age-Specific rate equal the number of live births to women in a specific age group per 1,000 women in the age group.* Rate not calculated because number of events was less than 5.Population Data: See Appendix A: Technical Appendix, Sources of Data: Population.
Washington Pregnancy and Induced Abortion Statistics, 2005
31
Table 20. Induced Abortions by Woman's Age and County of Residence, 2005
CountyAll
Ages < 15 15-19 15-17 18-19 20-24 25-29 30-34 35-39 40-44 45 +AgeUnk
State Total 24,162 124 4,359 1,648 2,711 8,070 5,349 3,303 2,116 769 57 15Adams 31 1 9 4 5 10 7 0 4 0 0Asotin 43 1 9 3 6 20 4 4 2 2 0 1Benton 463 4 130 48 82 125 107 53 30 11 2 1Chelan 152 1 28 12 16 58 26 19 14 4 1 1Clallam 170 3 36 22 14 61 30 16 19 4 1 0Clark 1,277 6 197 79 118 428 296 192 117 32 4 5Columbia 0 0 0 0 0 0 0 0 0 0 0 0Cowlitz 227 0 49 20 29 80 47 29 15 5 0Douglas 59 1 11 2 9 16 16 5 7 3 0 0Ferry 9 0 2 1 1 2 4 1 0 0 0 0Franklin 186 2 33 14 19 68 45 23 10 4 1 0Garfield 2 0 1 0 1 0 0 1 0 0 0 0Grant 125 0 46 15 31 47 17 6 7 2 0 0Grays Harbor 207 2 36 15 21 79 34 25 25 6 0 0Island 201 0 34 11 23 79 41 26 12 8 1 0Jefferson 57 1 14 3 11 18 10 7 5 2 0 0King 8,652 38 1,311 467 844 2,721 2,016 1,355 853 337 21 0Kitsap 789 5 165 50 115 278 154 89 68 29 1 0Kittitas 99 1 17 3 14 48 18 6 8 1 0 0Klickitat 22 0 6 3 3 5 4 3 2 1 0 1Lewis 228 1 50 24 26 66 55 26 23 6 1 0Lincoln 10 0 2 1 1 1 3 3 1 0 0 0Mason 154 2 31 15 16 47 43 18 9 3 1Okanogan 81 0 26 13 13 18 14 12 8 3 0 0Pacific 44 0 13 6 7 16 9 5 0 1 0 0Pend Oreille 15 0 2 2 0 6 2 2 3 0 0 0Pierce 3,709 19 687 265 422 1,252 852 490 313 92 4 0San Juan 37 0 5 3 2 13 7 6 1 5 0 0Skagit 377 2 73 28 45 150 76 47 24 5 0 0Skamania 14 0 1 1 0 3 6 4 0 0 0 0Snohomish 2,668 10 460 178 282 875 584 354 271 101 13 0Spokane 1,406 10 306 112 194 523 279 153 99 34 2 0Stevens 71 1 22 11 11 20 12 10 3 3 0 0Thurston 898 2 168 65 103 304 203 125 65 29 2 0Wahkiakum 5 0 1 1 0 2 2 0 0 0 0 0Walla Walla 107 0 20 8 12 38 24 13 7 4 1 0Whatcom 616 3 126 51 75 232 127 73 30 21 1 3Whitman 109 0 20 5 15 57 10 12 9 1 0 0Yakima 834 8 211 86 125 301 164 90 50 9 0 1Unknown 8 0 1 1 0 3 1 0 2 1 0 0
0
2
0

Washington Pregnancy and Induced Abortion Statistics, 2005
32
Table 21. Age-specific Abortion Rates1 by County of Residence, 2005
CountyAll
Ages 15-19 15-17 18-19 20-24 25-29 30-34 35-39 40-44
State Total2 18.5 19.9 12.5 31.0 37.0 26.7 16.0 9.6 3.2Adams 9.5 12.6 * 19.6 17.5 13.5 * * *Asotin 10.8 11.4 * 21.1 32.2 * * * *Benton 14.5 20.8 11.9 36.9 25.5 23.6 11.1 5.6 1.8Chelan 11.7 11.2 7.6 17.5 29.4 13.6 10.0 6.4 *Clallam 16.5 17.3 16.4 19.0 43.9 23.2 11.9 10.3 *Clark 15.6 14.5 9.2 23.5 34.0 23.6 14.4 8.2 2.1Columbia * * * * * * * * *Cowlitz 12.5 14.7 9.5 23.5 28.1 17.4 10.4 4.9 1.4Douglas 8.8 8.2 * 19.1 16.1 17.1 5.2 6.0 *Ferry 7.2 * * * * * * * *Franklin 15.3 13.0 8.7 20.2 30.5 21.9 13.0 5.6 *Garfield * * * * * * * * *Grant 8.2 14.4 7.3 26.8 18.1 7.1 2.7 3.0 *Grays Harbor 16.3 14.1 9.2 22.7 42.4 19.5 13.7 11.8 2.3Island 14.3 14.6 7.4 27.3 35.3 19.9 11.8 4.8 3.0Jefferson 14.6 18.9 * 47.0 42.9 23.5 12.8 7.1 *King 21.5 23.9 14.5 37.2 41.6 29.2 19.5 12.4 4.6Kitsap 16.7 19.9 9.3 39.3 38.0 23.7 12.2 8.2 3.0Kittitas 11.2 9.7 * 12.6 15.7 18.0 7.0 8.1 *Klickitat 6.5 9.0 * * 11.7 * * * *Lewis 17.7 19.0 14.1 27.8 32.8 31.9 14.6 10.6 2.4Lincoln 6.2 * * * * * * * *Mason 17.9 18.1 13.1 28.1 40.7 38.7 15.1 5.8 *Okanogan 11.5 17.3 13.1 25.6 19.3 14.5 12.0 6.9 *Pacific 14.4 21.0 14.5 34.3 41.6 24.7 11.6 * *Pend Oreille 7.4 * * * 31.3 * * * *Pierce 22.9 24.8 15.8 38.5 46.7 34.9 18.9 11.3 3.1San Juan 17.1 13.7 * * 58.0 29.4 21.3 * 7.9Skagit 17.9 18.1 11.1 29.9 45.7 25.2 15.0 6.9 1.2Skamania 7.2 * * * * 24.4 * * *Snohomish 19.0 20.2 12.4 33.5 43.7 27.7 15.2 10.5 3.7Spokane 15.4 18.2 11.8 26.6 30.8 21.3 11.8 6.8 2.1Stevens 9.8 13.5 9.5 23.7 23.7 14.5 9.7 * *Thurston 19.3 20.5 12.9 32.8 39.1 30.4 18.2 8.3 3.1Wahkiakum 8.6 * * * * * * * *Walla Walla 9.5 8.0 6.4 9.6 15.8 17.5 8.7 4.4 *Whatcom 15.4 16.3 13.9 18.6 23.7 24.0 14.2 5.3 3.3Whitman 9.0 7.3 7.4 7.2 11.6 7.4 11.3 9.2 *Yakima 18.3 23.2 15.0 37.3 37.6 22.4 13.4 7.2 1.2
Population Data: See Appendix A: Technical Appendix, Sources of Data: Population.
1 The general abortion rate shown under "All Ages" equals abortions per 1,000 women of childbearing age (15-44). Age-Specific rate equal the number of abortions to women in a specific age group per 1,000 women in the age group.2 Total abortions includes 8 abortions for which county of residence was unknown.* Rate not calculated because number of events was less than 5.
Washington Pregnancy and Induced Abortion Statistics, 2005
33
Table 22. Percent of Pregnancies Terminated by Abortion by Woman's Age and County of Residence, 2005
CountyAll
Ages < 15 15-19 15-17 18-19 20-24 25-29 30-34 35-39 40-44- - - - - - - - - - - - - - - - - - - - - - - - - - - - - - Percents - - - - - - - - - - - - - - - - - - - - - - - - - - - - - -
State Total1 22.5 59.6 39.1 45.3 36.1 28.7 18.6 14.2 16.7 25.4Adams 6.7 * 11.8 * 10.9 6.4 5.3 * * *Asotin 15.3 * 20.5 * 17.1 18.5 * * * *Benton 17.5 * 35.6 37.8 34.5 16.9 14.2 10.9 13.0 19.6Chelan 14.3 * 20.0 31.6 15.7 18.2 9.4 9.4 15.2 *Clallam 21.5 * 35.0 55.0 22.2 25.3 14.9 11.3 23.2 *Clark 18.4 60.0 31.1 42.9 26.2 24.5 14.7 12.3 14.7 20.3Columbia * * * * * * * * * *Cowlitz 15.4 * 21.4 26.3 19.0 17.2 11.7 12.4 14.6 17.2Douglas 10.2 * 15.7 * 18.0 10.7 9.8 3.9 14.0 *Ferry 9.9 * * * * * * * * *Franklin 11.1 * 16.0 16.7 15.6 14.4 8.5 7.6 8.3 *Garfield * * * * * * * * *Grant 7.9 * 17.8 16.5 18.6 9.3 4.1 2.3 5.8 *Grays Harbor 19.3 * 21.6 28.3 18.4 22.4 12.1 14.7 30.5 42.9Island 16.7 * 30.6 45.8 26.4 19.6 12.3 12.2 10.5 32.0Jefferson 21.8 * 36.8 * 39.3 28.6 19.2 14.3 10.4 *King 27.5 77.6 55.2 58.5 53.6 43.3 26.1 16.2 16.2 25.9Kitsap 21.3 83.3 40.9 49.5 38.1 23.6 16.2 13.0 18.2 27.1Kittitas 22.7 * 41.5 * 41.2 35.3 12.8 8.3 20.5 *Klickitat 9.5 * 17.1 * * 7.2 * * * *Lewis 20.5 * 32.9 49.0 25.2 17.8 17.6 15.4 27.7 30.0Lincoln 9.6 * * * * * * * * *Mason 19.9 * 26.3 33.3 21.9 19.2 19.2 14.1 23.1 *Okanogan 13.2 * 30.6 39.4 25.0 9.5 8.9 10.1 16.0 *Pacific 16.7 * 36.1 40.0 33.3 18.2 12.5 12.2 * *Pend Oreille 11.0 * * * * 14.3 * * * *Pierce 26.0 70.4 41.7 51.8 37.1 30.0 21.4 18.0 23.5 29.1San Juan 25.3 * 35.7 * * 33.3 15.6 22.2 * 55.6Skagit 20.5 * 27.1 28.9 26.2 27.4 16.0 14.9 12.8 12.2Skamania 13.0 * * * * * 14.3 * * *Snohomish 22.9 55.6 45.8 52.7 42.3 29.7 18.9 12.8 18.7 30.7Spokane 20.0 66.7 38.8 48.3 34.9 24.7 13.8 12.0 15.1 22.8Stevens 13.5 * 26.2 47.8 18.0 12.8 8.2 11.6 * *Thurston 25.4 * 47.6 61.3 41.7 31.2 21.1 16.7 16.7 30.5Wahkiakum 11.9 * * * * * * * * *Walla Walla 12.8 * 18.3 17.0 19.4 16.3 10.2 8.4 8.2 *Whatcom 22.4 * 46.0 50.0 43.6 31.6 16.4 12.6 10.2 28.8Whitman 20.0 * 64.5 55.6 68.2 34.5 5.9 9.8 18.8 *Yakima 16.6 44.4 25.2 27.7 23.8 19.4 12.3 10.7 13.9 11.51 Total pregnancies includes 8 abortions for which county of residence was unknown.* Percent not calculated because number of events was less than 5.Population Data: See Appendix A: Technical Appendix, Sources of Data: Population.
*
Washington Pregnancy and Induced Abortion Statistics, 2005
34
Table 23. Abortion Ratio1 by Woman's Age and County of Residence, 2005
CountyAll
Ages 15-19 15-17 18-19 20-24 25-29 30-34 35-39 40-44
State Total2 292 647 838 568 405 231 167 202 345Adams 73 134 * 122 68 57 * * *Asotin 181 257 * 207 230 * * * *Benton 214 558 623 526 205 166 124 151 250Chelan 169 252 462 188 223 104 105 182 *Clallam 276 545 1,222 292 341 176 127 302 *Clark 227 454 760 358 326 173 141 173 254Columbia * * * * * * * * *Cowlitz 183 274 357 236 208 133 141 172 208Douglas 114 190 * 225 119 109 41 163 *Ferry 110 * * * * * * * *Franklin 125 192 200 186 169 93 82 91 *Garfield * * * * * * * * *Grant 86 221 197 235 104 43 24 63 *Grays Harbor 242 279 417 226 288 140 174 446 750Island 202 447 846 365 243 141 140 120 471Jefferson 279 609 * 688 400 238 167 116 *King 381 1,241 1,428 1,158 768 355 194 195 353Kitsap 272 702 1,020 618 310 195 150 224 377Kittitas 297 708 * 700 552 149 92 258 *Klickitat 105 207 * * 78 * * * *Lewis 261 495 1,000 338 217 215 184 390 462Lincoln 106 * * * * * * * *Mason 248 356 500 281 237 238 164 300 *Okanogan 153 441 650 333 106 97 113 195 *Pacific 201 565 667 500 222 145 139 * *Pend Oreille 125 * * * 171 * * * *Pierce 354 724 1,077 600 430 273 220 309 414San Juan 343 625 * * 500 184 286 * *Skagit 260 382 424 360 381 191 176 147 139Skamania 149 * * * * 167 * * *Snohomish 299 855 1,148 736 426 234 147 231 451Spokane 251 640 949 539 330 161 137 179 304Stevens 157 355 917 220 147 90 135 * *Thurston 343 908 1,585 715 456 268 203 202 439Wahkiakum 135 * * * * * * * *Walla Walla 148 227 211 240 196 115 92 90 *Whatcom 290 851 1,000 773 461 196 145 116 404Whitman 252 1,818 * 2,143 528 64 110 231 *Yakima 200 339 387 313 241 141 121 164 1341 The abortion ratio shown under "All Ages" equals total abortions per 1,000 live births. Age-Specific rate equals the number of induced abortions for women in a specific age group per 1,000 live births in the age group.2 Total abortions includes 8 for which county of residence was unknown.* Ratio not calculated because number of events was less than 5.

Washington Pregnancy and Induced Abortion Statistics, 2005
35
Table 24. Abortions in Second Trimester or Later1 by Woman's Age and County of Residence, 2005 County Total <15 15-19 15-17 18-19 20-24 25-29 30-34 35-39 40-44
State Total 2,946 28 654 268 386 1,007 596 330 244 75Adams 2 0 1 1 0 0 1 0 0 0Asotin 8 0 1 0 1 5 0 0 0 1Benton 47 1 12 4 8 15 11 2 5 1Chelan 26 0 3 1 2 18 0 2 3 0Clallam 26 0 5 4 1 9 5 2 4 0Clark 185 3 37 17 20 63 48 17 15Columbia 0 0 0 0 0 0 0 0 0 0Cowlitz 33 0 9 5 4 8 7 5 3 1Douglas 10 0 4 2 2 2 4 0 0 0Ferry 1 0 0 0 0 0 1 0 0 0Franklin 22 0 2 2 0 10 5 4 1 0Garfield 0 0 0 0 0 0 0 0 0 0Grant 19 0 9 4 5 6 2 1 1 0Grays Harbor 38 0 5 3 2 15 7 5 5 1Island 30 0 10 5 5 13 2 2 1 2Jefferson 8 0 5 1 4 3 0 0 0 0King 951 9 191 68 123 313 188 121 85 40Kitsap 106 0 26 11 15 40 14 12 9Kittitas 7 1 2 0 2 2 1 0 1 0Klickitat 1 0 0 0 0 0 1 0 0 0Lewis 37 0 9 5 4 8 9 4 4 3Lincoln 2 0 0 0 0 0 0 2 0 0Mason 25 2 5 3 2 7 3 3 4 0Okanogan 13 0 4 2 2 5 3 1 0 0Pacific 9 0 4 3 1 1 3 1 0 0Pend Oreille 2 0 0 0 0 0 1 0 1 0Pierce 488 4 101 43 58 180 107 53 33 9San Juan 3 0 1 1 0 0 1 0 1 0Skagit 34 0 9 4 5 15 7 2 1 0Skamania 1 0 0 0 0 0 1 0 0 0Snohomish 323 2 72 29 43 93 74 35 40 6Spokane 153 2 34 12 22 55 31 18 10 3Stevens 12 0 3 1 2 0 6 2 1 0Thurston 125 0 34 12 22 49 21 16 5 0Wahkiakum 0 0 0 0 0 0 0 0 0 0Walla Walla 13 0 2 0 2 6 2 1 2 0Whatcom 42 2 10 5 5 13 9 7 1 0Whitman 9 0 4 2 2 4 1 0 0 0Yakima 134 2 39 17 22 49 20 12 8Unknown 1 0 1 1 0 0 0 0 0 01 Includes abortions occurring at 13 or more weeks of gestation.
0
5
3
Washington Pregnancy and Induced Abortion Statistics, 2005
36
Table 25. Repeat Abortions by Woman's Age and County of Residence, 2005 County Total <20 20 - 24 25- 29 30 -34 35- 39 40 - 44 45+ Unk
State Total 11,567 894 3,555 3,205 2,077 1,359 436 35 6Adams 14 * 6 * 0 * 0 0Asotin 20 0 14 * * * 0 0 *Benton 197 23 49 67 30 18 8 * 0Chelan 63 6 23 16 9 6 * * 0Clallam 66 * 20 16 9 13 * * 0Clark 626 32 186 188 126 76 15 0 *Columbia 0 0 0 0 0 0 0 0 0Cowlitz 84 5 27 22 19 8 * 0 *Douglas 28 * 5 10 * 5 * 0 0Ferry 6 * * * * 0 0 0 0Franklin 72 * 28 18 13 8 * 0 0Garfield 0 0 0 0 0 0 0 0 0Grant 52 8 20 10 6 7 * 0 0Grays Harbor 92 6 27 20 21 16 * 0 0Island 81 6 30 22 13 8 * 0 0Jefferson 23 * 7 5 5 * * 0 0King 4,258 295 1,233 1,160 834 532 192 12 0Kitsap 363 31 114 105 54 43 16 0 0Kittitas 33 * 11 12 * * 0 0 0Klickitat 7 * * * * 0 0 0 0Lewis 98 5 21 34 16 19 * * 0Lincoln 6 0 * * * 0 0 0 0Mason 73 5 23 24 13 7 * 0 0Okanogan 35 6 5 10 6 5 * 0 0Pacific 18 * 9 5 * 0 0 0 0Pend Oreille 9 0 * * * * 0 0 0Pierce 1,931 156 575 582 340 224 51 * 0San Juan 13 0 6 * * 0 * 0 0Skagit 151 14 56 40 26 12 * 0 0Skamania * 0 * * * 0 0 0 0Snohomish 1,347 96 425 350 234 168 63 11 0Spokane 644 61 234 173 96 59 19 * 0Stevens 25 * 8 6 5 * * 0 0Thurston 414 36 113 130 75 41 17 * 0Wahkiakum * 0 * 0 0 0 0 0 0Walla Walla 41 * 13 7 8 7 * 0 0Whatcom 242 23 83 61 42 21 11 0 *Whitman 41 6 18 6 5 6 0 0Yakima 383 53 155 87 50 32 6 0 0Unknown 6 0 2 1 0 2 1 0 0* Number not shown to protect confidentiality.
0
0

Washington Pregnancy and Induced Abortion Statistics, 2005
37
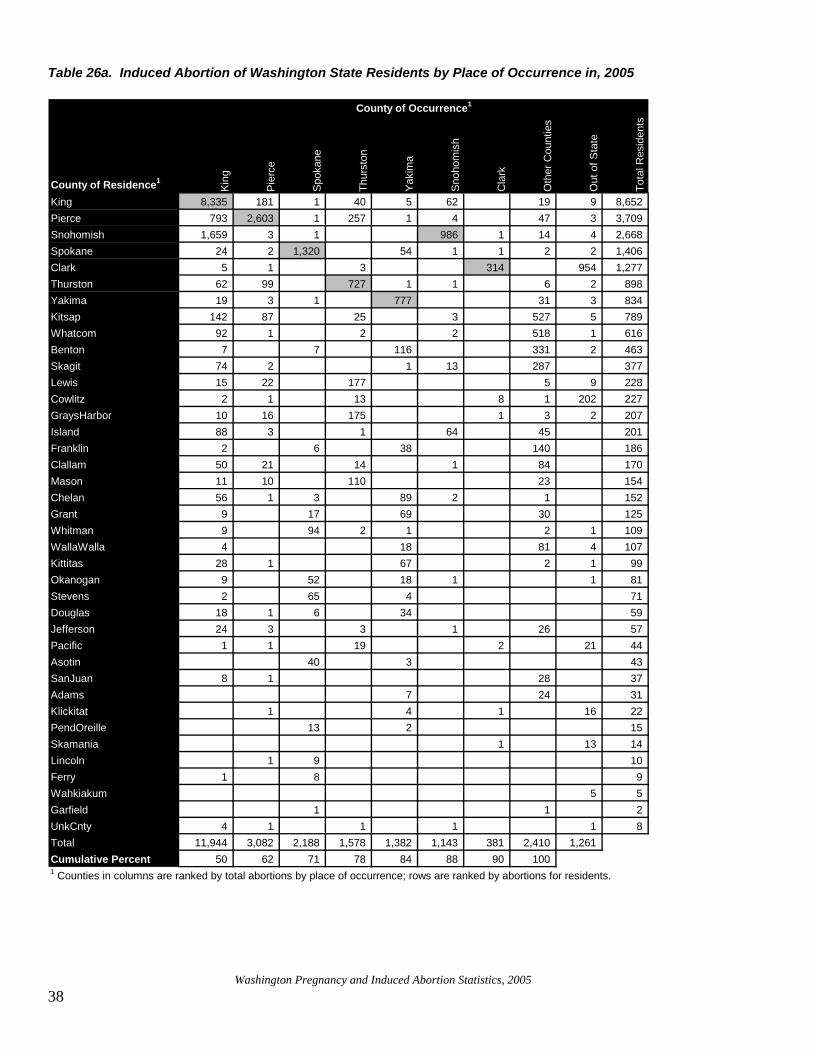
Residence and Occurrence: While this subject is covered in more detail in Appendix A, the reader may wish to refer to the chart below to help navigate the data shown in Table 26 and Table 26a to determine how to interpret residence data (where you live) vs. occurrence data (where a procedure occurred). Residents are defined as those persons who live in the state of Washington. Residents, who have had an abortion procedure, are counted whether the procedure occurred inside or outside of Washington State. Non-residents, those persons who live outside of the state of Washington, are included in these data only if they had an abortion procedure within Washington State in the current year. The following table, Abortions Occurring in Washington and Abortions of Washington Residents in 2005, shows the relationship between residence and occurrence. The number of Washington State residents who had abortions in 2005 (either in the state, or outside of the state) is 24,162 women. This number, 24,162, is used in the majority of the tables in this report. (Note that the Washington State residents who had abortions outside of the state was a relatively small number, 1,261 women. Counting the number of abortions performed in Washington State (occurrence) would include women (1,207) whose residence at the time was in other states or Canada. That total, all occurrences in Washington State, was 24,108. The total of all abortions in 2005 (all combinations of residence and occurrence) is 25,369.
In-State Resident 22,901 1,261 24,162Out-of-State Resident 1,207 * 1,207Total 24,108 1,261 25,369
Abortions by Resident Location Occurrence In State Occurrence Out of State Total Abortions
Table 26 shows induced abortions for Out of State Residents by Washington State County of Occurrence in 2005. That is, women from outside the United States (primarily from Canada), and two women whose residence is unknown, by the county where the procedure took place. This total is 1,207 women. Table 26. Out of State Residents by Washington State County of Occurrence, 2005.
Kin
g
Pie
rce
Spo
kane
Thur
ston
Yak
ima
Sno
hom
ish
Cla
rk
Oth
er C
ount
ies
Out
of S
tate
Tota
lout-of-state 307 16 542 8 73 1 52 132 1,131 non-U.S. 72 1 1 74 Unknown 2 2
1,207
County of Occurrence
Total for Out-of State Resident Table 26a, shows induced abortions of women by their county of residence (down the left hand side of chart) and where the abortions took place (occurrence) across the top of the chart. Please note that shaded cells of the chart denote when the county of residence and the county of occurrence are the same. The table includes abortions for counties in which less than 5 abortions occurred or in counties where there was only one abortion provider, such as Benton, Kitsap, and Grant, Jefferson, and Whatcom counties. The part of the table which shows occurrence excludes counties where no abortions occurred: Adams, Asotin, Chelan, Clallam, Columbia, Cowlitz, Douglas, Ferry, Franklin, Garfield, Grays Harbor, Island, Jefferson, Kittitas, Klickitat, Lincoln, Mason, Okanogan, Pacific, Pend Oreille, San Juan, Skagit, Skamania, Stevens, Wahkiakum, Walla Walla, and Whitman.
Washington Pregnancy and Induced Abortion Statistics, 2005
38
Table 26a. Induced Abortion of Washington State Residents by Place of Occurrence in, 2005
County of Residence1
Kin
g
Pie
rce
Spo
kane
Thur
ston
Yak
ima
Sno
hom
ish
Cla
rk
Oth
er C
ount
ies
Out
of S
tate
Tota
l Res
iden
ts
King 8,335 181 1 40 5 62 19 9 8,652 Pierce 793 2,603 1 257 1 4 47 3 3,709 Snohomish 1,659 3 1 986 1 14 4 2,668 Spokane 24 2 1,320 54 1 1 2 2 1,406 Clark 5 1 3 314 954 1,277 Thurston 62 99 727 1 1 6 2 898 Yakima 19 3 1 777 31 3 834 Kitsap 142 87 25 3 527 5 789 Whatcom 92 1 2 2 518 1 616 Benton 7 7 116 331 2 463 Skagit 74 2 1 13 287 377 Lewis 15 22 177 5 9 228 Cowlitz 2 1 13 8 1 202 227 GraysHarbor 10 16 175 1 3 2 207 Island 88 3 1 64 45 201 Franklin 2 6 38 140 186 Clallam 50 21 14 1 84 170 Mason 11 10 110 23 154 Chelan 56 1 3 89 2 1 152 Grant 9 17 69 30 125 Whitman 9 94 2 1 2 1 109 WallaWalla 4 18 81 4 107 Kittitas 28 1 67 2 1 99 Okanogan 9 52 18 1 1 81 Stevens 2 65 4 71 Douglas 18 1 6 34 59 Jefferson 24 3 3 1 26 57 Pacific 1 1 19 2 21 44 Asotin 40 3 43 SanJuan 8 1 28 37 Adams 7 24 31 Klickitat 1 4 1 16 22 PendOreille 13 2 15 Skamania 1 13 14 Lincoln 1 9 10 Ferry 1 8 9 Wahkiakum 5 5 Garfield 1 1 2 UnkCnty 4 1 1 1 1 8 Total 11,944 3,082 2,188 1,578 1,382 1,143 381 2,410 1,261 Cumulative Percent 50 62 71 78 84 88 90 100
County of Occurrence1
1 Counties in columns are ranked by total abortions by place of occurrence; rows are ranked by abortions for residents.

Washington Pregnancy and Induced Abortion Statistics, 2005
39
Table 27. Fetal Deaths by Woman's Age and County of Residence, 2005
CountyAll
Ages < 15 15-19 15-17 18-19 20-24 25-29 30-34 35-39 40-44 45 +AgeUnk
State Total 519 0 62 26 36 101 135 114 64 26 3 14Adams 5 0 0 0 0 1 2 1 0 0 0 1Asotin 1 0 0 0 0 1 0 0 0 0 0 0Benton 14 0 2 2 0 2 3 4 2 1 0 0Chelan 7 0 1 0 1 0 1 2 1 2 0 0Clallam 3 0 1 0 1 1 1 0 0 0 0 0Clark 32 0 3 1 2 8 9 8 4 0 0 0Columbia 0 0 0 0 0 0 0 0 0 0 0 0Cowlitz 5 0 1 0 1 1 2 0 1 0 0 0Douglas 2 0 1 0 1 0 0 0 0 1 0 0Ferry 0 0 0 0 0 0 0 0 0 0 0 0Franklin 6 0 1 0 1 3 2 0 0 0 0 0Garfield 0 0 0 0 0 0 0 0 0 0 0 0Grant 9 0 4 0 4 3 0 1 1 0 0 0Grays Harbor 8 0 2 2 0 0 4 1 1 0 0 0Island 5 0 1 0 1 0 1 1 2 0 0 0Jefferson 1 0 1 0 1 0 0 0 0 0 0 0King 142 0 7 4 3 28 32 37 23 8 0 7Kitsap 18 0 3 2 1 4 6 1 1 1 1 1Kittitas 5 0 0 0 0 1 2 1 0 0 0 1Klickitat 1 0 0 0 0 0 0 0 0 1 0 0Lewis 8 0 1 1 0 1 2 2 1 1 0 0Lincoln 0 0 0 0 0 0 0 0 0 0 0 0Mason 0 0 0 0 0 0 0 0 0 0 0 0Okanogan 4 0 0 0 0 2 0 1 1 0 0 0Pacific 1 0 0 0 0 0 1 0 0 0 0 0Pend Oreille 1 0 0 0 0 1 0 0 0 0 0 0Pierce 65 0 12 1 11 13 14 14 7 2 1 2San Juan 1 0 1 0 1 0 0 0 0 0 0 0Skagit 14 0 5 3 2 3 3 2 0 0 0 1Skamania 0 0 0 0 0 0 0 0 0 0 0 0Snohomish 56 0 7 5 2 13 13 13 5 4 1 0Spokane 37 0 4 2 2 9 14 6 1 3 0 0Stevens 4 0 0 0 0 0 1 2 1 0 0 0Thurston 16 0 0 0 0 3 3 6 3 0 0 1Wahkiakum 0 0 0 0 0 0 0 0 0 0 0 0Walla Walla 6 0 1 1 0 1 3 1 0 0 0 0Whatcom 8 0 0 0 0 0 2 1 5 0 0 0Whitman 3 0 0 0 0 0 2 1 0 0 0 0Yakima 31 0 3 2 1 2 12 8 4 2 0 0
Table 28. Female Population by Age and County of Residence, 2005 County 15-44 10-14 15-19 15-17 18-19 20-24 25-29 30-34 35-39 40-44 45-49
State Total 1,308,651 215,155 219,516 131,994 87,522 217,931 200,430 206,329 220,548 243,897 246,902Adams 3,278 702 714 459 255 573 518 486 466 521 546Asotin 3,991 664 790 506 284 621 563 580 673 764 791Benton 31,987 6,374 6,251 4,031 2,220 4,901 4,526 4,760 5,404 6,145 6,201Chelan 13,046 2,622 2,497 1,585 912 1,974 1,907 1,899 2,202 2,567 2,614Clallam 10,275 2,065 2,080 1,342 738 1,391 1,292 1,341 1,840 2,331 2,667Clark 81,633 14,859 13,600 8,576 5,024 12,584 12,566 13,328 14,276 15,279 15,552Columbia 658 139 128 92 36 100 80 87 120 143 156Cowlitz 18,212 3,459 3,340 2,107 1,233 2,852 2,708 2,788 3,046 3,478 3,650Douglas 6,736 1,352 1,347 875 472 991 935 955 1,173 1,335 1,313Ferry 1,258 265 290 199 91 168 159 168 207 266 311Franklin 12,174 2,517 2,541 1,602 939 2,231 2,052 1,769 1,800 1,781 1,847Garfield 378 87 97 68 29 37 38 56 69 81 111Grant 15,306 3,313 3,200 2,045 1155 2,590 2,394 2,252 2,322 2,548 2,491Grays Harbor 12,671 2,437 2,547 1,623 924 1,862 1,742 1,820 2,127 2,573 2,637Island 14,044 2,608 2,333 1,492 841 2,235 2,057 2,204 2,513 2,702 2,908Jefferson 3,902 788 741 507 234 420 425 548 707 1,061 1,297King 401,791 53,533 54,929 32,261 22,668 65,361 68,976 69,583 68,886 74,056 74,435Kitsap 47,297 8,739 8,308 5,382 2,926 7,311 6,509 7,270 8,319 9,580 10,047Kittitas 8,831 1000 1,761 651 1,110 3,057 1000 858 985 1,170 1,182Klickitat 3,387 782 667 467 200 426 459 470 602 763 847Lewis 12,875 2,614 2,634 1,700 934 2,014 1,726 1,776 2,173 2,552 2,705Lincoln 1,603 351 350 253 97 172 177 231 292 381 400Mason 8,612 1,713 1,713 1,143 570 1,156 1,112 1,195 1,559 1,877 1,963Okanogan 7,073 1,582 1,499 992 507 932 967 998 1,157 1,520 1,563Pacific 3,060 692 618 414 204 385 365 432 527 733 841Pend Oreille 2,024 494 453 325 128 192 223 277 402 477 513Pierce 162,261 27,695 27,691 16,722 10,969 26,807 24,384 25,890 27,631 29,858 28,394San Juan 2,165 474 364 244 120 224 238 282 423 634 789Skagit 21,012 3,959 4,025 2,520 1,505 3,282 3,019 3,137 3,460 4,089 4,318Skamania 1,948 378 386 257 129 219 246 277 372 448 487Snohomish 140,672 24,232 22,795 14,377 8,418 20,037 21,085 23,292 25,811 27,652 26,432Spokane 91,017 15,250 16,824 9,528 7,296 16,996 13,091 12,930 14,608 16,568 17,193Stevens 7,266 1,659 1,624 1,160 464 843 829 1,029 1,224 1,717 1,830Thurston 46,538 7,592 8,197 5,052 3,145 7,775 6,669 6,850 7,832 9,215 9,899Wahkiakum 579 132 124 95 29 63 70 85 117 120 148Walla Walla 11,261 1,874 2,497 1,245 1,252 2,410 1,368 1,502 1,586 1,898 1,924Whatcom 40,037 5,887 7,719 3,680 4,039 9,808 5,300 5,150 5,688 6,372 7,253Whitman 12,152 990 2,749 674 2,075 4,920 1,344 1,063 980 1,096 1,056Yakima 45,638 9,283 9,096 5,742 3,354 8,010 7,313 6,708 6,966 7,545 7,592Population Data: See Appendix A: Technical Appendix, Sources of Data: Population.
Washington Pregnancy and Induced Abortion Statistics, 2005
40

Appendices
Washington Pregnancy and Induced Abortion Statistics, 2005


Appendix A: Technical Appendix How to Use Pregnancy and Abortion Data Why Read this Section? Washington State Pregnancy and Induced Abortion Statistics presents commonly used pregnancy and abortion data. These data not only have a variety of uses, but also a variety of users ranging from the beginner to the sophisticated analyst. This section is intended primarily to help those who do not entirely understand how to use pregnancy and abortion data or are not aware of data limitations. Reading this section may help beginning users to avoid drawing incorrect conclusions from the data. For other users, this section may serve as a review. Issues in Using the Data ‘Pregnancy’ is the sum of abortions, live births, and fetal deaths reported to the state. This figure underestimates the actual number of pregnancies because fetal deaths are required to be reported to the state only for gestational ages of 20 weeks or more. Thus, early fetal deaths (commonly called ‘miscarriages’) are not included in the total. ‘Abortion’ refers to the induced termination of a pregnancy. Residence vs. Occurrence What's the difference between residence and occurrence? In trying to locate topics of interest in this report, users may notice that data are tabulated in two ways: 1) by residence (where the person lived); or 2) by occurrence (where the event occurred). For example, a woman who lived in Olympia (Thurston County) but had an abortion in Seattle (King County) would be counted in Thurston County on a residence table and in King County on an occurrence table. The Center for Health Statistics actually registers only those events occurring in Washington State. However, thanks to an interstate exchange agreement pertaining to birth and fetal death certificates, we receive data on Washington residents from other states and Canada. Thus we have complete knowledge of Washington State resident births and fetal deaths. Although no such formal agreement exists for abortion reports, most states and Canada have agreed to exchange abortion reports as well. Some users may be tempted to add residence and occurrence figures together to get a total for any area, but this would not be correct. There is a great deal of overlap between these two categories, as many residents of a county also have the abortion, birth or fetal death in the same county. Other users try to subtract residence and occurrence data to figure out how many residents have abortions, births or fetal death outside of their county, but this is also
Washington Pregnancy and Induced Abortion Statistics, 2005
43
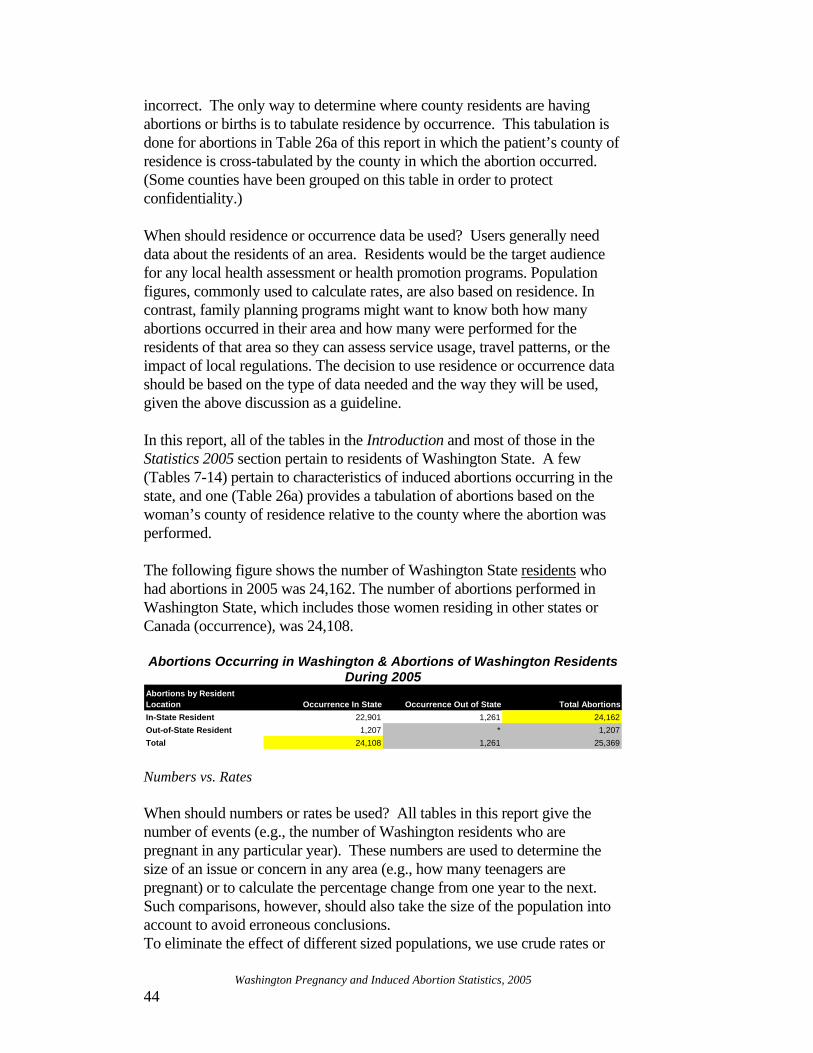
incorrect. The only way to determine where county residents are having abortions or births is to tabulate residence by occurrence. This tabulation is done for abortions in Table 26a of this report in which the patient’s county of residence is cross-tabulated by the county in which the abortion occurred. (Some counties have been grouped on this table in order to protect confidentiality.) When should residence or occurrence data be used? Users generally need data about the residents of an area. Residents would be the target audience for any local health assessment or health promotion programs. Population figures, commonly used to calculate rates, are also based on residence. In contrast, family planning programs might want to know both how many abortions occurred in their area and how many were performed for the residents of that area so they can assess service usage, travel patterns, or the impact of local regulations. The decision to use residence or occurrence data should be based on the type of data needed and the way they will be used, given the above discussion as a guideline. In this report, all of the tables in the Introduction and most of those in the Statistics 2005 section pertain to residents of Washington State. A few (Tables 7-14) pertain to characteristics of induced abortions occurring in the state, and one (Table 26a) provides a tabulation of abortions based on the woman’s county of residence relative to the county where the abortion was performed. The following figure shows the number of Washington State residents who had abortions in 2005 was 24,162. The number of abortions performed in Washington State, which includes those women residing in other states or Canada (occurrence), was 24,108. Abortions Occurring in Washington & Abortions of Washington Residents
During 2005
In-State Resident 22,901 1,261 24,162Out-of-State Resident 1,207 * 1,207Total 24,108 1,261 25,369
Abortions by Resident Location Occurrence In State Occurrence Out of State Total Abortions
Numbers vs. Rates When should numbers or rates be used? All tables in this report give the number of events (e.g., the number of Washington residents who are pregnant in any particular year). These numbers are used to determine the size of an issue or concern in any area (e.g., how many teenagers are pregnant) or to calculate the percentage change from one year to the next. Such comparisons, however, should also take the size of the population into account to avoid erroneous conclusions. To eliminate the effect of different sized populations, we use crude rates or
Washington Pregnancy and Induced Abortion Statistics, 2005
44
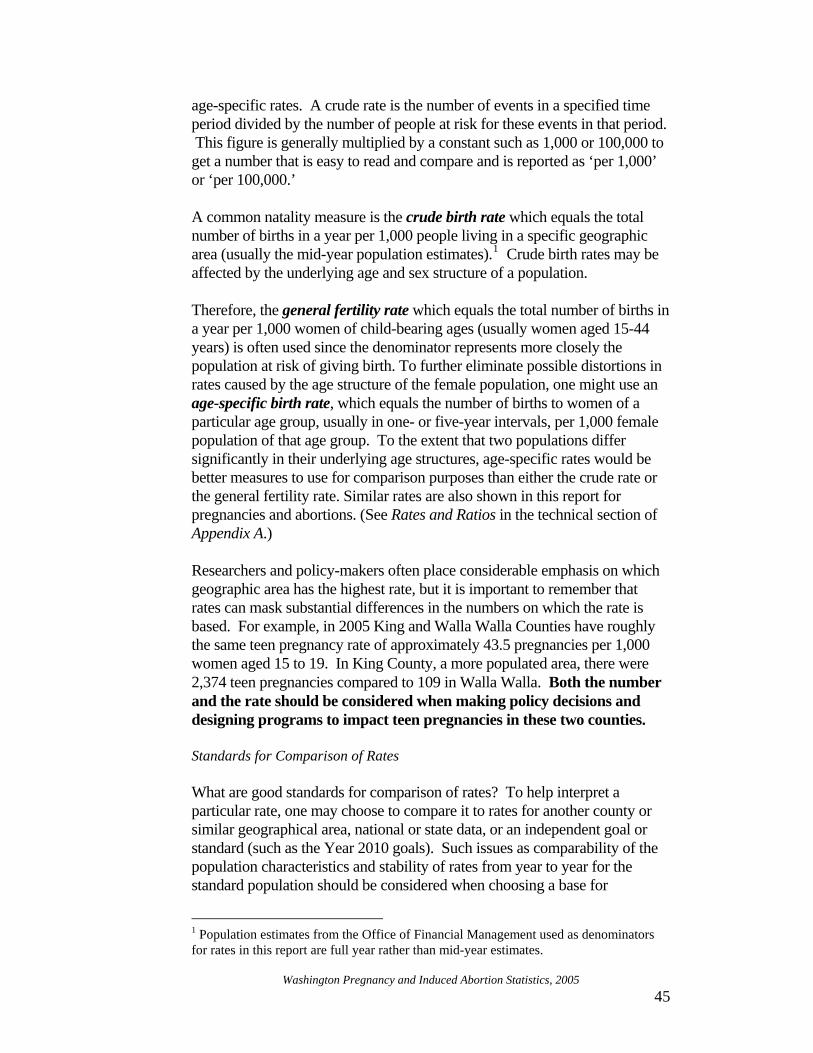
age-specific rates. A crude rate is the number of events in a specified time period divided by the number of people at risk for these events in that period. This figure is generally multiplied by a constant such as 1,000 or 100,000 to get a number that is easy to read and compare and is reported as ‘per 1,000’ or ‘per 100,000.’ A common natality measure is the crude birth rate which equals the total number of births in a year per 1,000 people living in a specific geographic area (usually the mid-year population estimates).1 Crude birth rates may be affected by the underlying age and sex structure of a population. Therefore, the general fertility rate which equals the total number of births in a year per 1,000 women of child-bearing ages (usually women aged 15-44 years) is often used since the denominator represents more closely the population at risk of giving birth. To further eliminate possible distortions in rates caused by the age structure of the female population, one might use an age-specific birth rate, which equals the number of births to women of a particular age group, usually in one- or five-year intervals, per 1,000 female population of that age group. To the extent that two populations differ significantly in their underlying age structures, age-specific rates would be better measures to use for comparison purposes than either the crude rate or the general fertility rate. Similar rates are also shown in this report for pregnancies and abortions. (See Rates and Ratios in the technical section of Appendix A.) Researchers and policy-makers often place considerable emphasis on which geographic area has the highest rate, but it is important to remember that rates can mask substantial differences in the numbers on which the rate is based. For example, in 2005 King and Walla Walla Counties have roughly the same teen pregnancy rate of approximately 43.5 pregnancies per 1,000 women aged 15 to 19. In King County, a more populated area, there were 2,374 teen pregnancies compared to 109 in Walla Walla. Both the number and the rate should be considered when making policy decisions and designing programs to impact teen pregnancies in these two counties. Standards for Comparison of Rates What are good standards for comparison of rates? To help interpret a particular rate, one may choose to compare it to rates for another county or similar geographical area, national or state data, or an independent goal or standard (such as the Year 2010 goals). Such issues as comparability of the population characteristics and stability of rates from year to year for the standard population should be considered when choosing a base for
1 Population estimates from the Office of Financial Management used as denominators for rates in this report are full year rather than mid-year estimates.
Washington Pregnancy and Induced Abortion Statistics, 2005
45

comparison. No matter what source for comparison is chosen, users should always find out how the rates were calculated to see if the same methods and definitions were used. Otherwise, the rates are not truly comparable and may lead to incorrect conclusions. Some questions to ask might be: Are the rates crude or age-specific? Are they for the same time period? Is the definition of what constitutes an event the same? Is the completeness of reporting events similar? Are the denominators taken from the same or similar data sources? Unknowns Most pregnancy and abortion data are not 100% complete. Sometimes when information is either not collected or cannot be collected at all the item is reported as unknown. When the number of unknowns for a particular characteristic (e.g., race) is large, it can affect rates or percentage distributions based on that characteristic. For example, in 2005, the mother’s race was unknown for a fairly small proportion of births (about 1.1%) but for induced abortions race was unknown for a sizable proportion (38.2%). How should unknowns be handled in calculating percentages? If we include unknowns in the total, the percent in any category is smaller than it would be if we subtract unknowns from the total. For example, in the case of abortions performed in 2005, the percent of women classified as black is about 5.1 % if unknowns are included in the total, but the percentage is about 8.2 % if unknowns are excluded from the total. In deciding which method offers a “truer” representation of the population as a whole, one needs to consider whether the cases with an unknown characteristic are similar to or different from those cases in which the characteristic is known. If it appears likely that the cases with the unknown characteristic are similar to those with the known values, then “unknowns” should be excluded from the total and percentages should be based on the “known” population. To the extent that this assumption seems unlikely, then other methods could be invoked to distribute the cases with unknown values. Assumptions about the probable characteristics of the population with a given unknown attribute could be based on: 1) greater familiarity with local situations by persons in the county or city health community or 2) more in-depth analysis of the source of unknowns in the reporting system. For example, if only a few hospitals or medical facilities fail to report a particular variable (as is the case with the reporting of race by abortion providers) one might examine information about the population served by those particular facilities or about those living in the nearby community and draw an incorrect conclusion from the data.
Washington Pregnancy and Induced Abortion Statistics, 2005
46

Small Numbers How should small numbers be handled? If the state collects all births, fetal deaths, and abortions in a year, then aren't the pregnancy and abortion rates exactly as calculated? It is certainly true that pregnancy and abortion statistics are not based on samples of the population, as many research data are. We do know the actual number of births, fetal deaths, and abortions (assuming complete reporting of events), so we can calculate an exact pregnancy or abortion rate for any one year. However, the data may still be affected by random fluctuations in the number of events between successive measurements (e.g., for different years). The effect of such random fluctuations on birth, pregnancy, and abortion rates is proportionately larger when the number of events is small. For example, one more teenage pregnancy has a larger numerical impact in an area with 10 teenage pregnancies than it does in an area with 1,000 teenage pregnancies. Because of these random fluctuations, the rates based on small numbers may not be as reliable as those based on larger numbers in the sense that they may have limited predictive value. Specifically, knowing one year's rate in such instances may not allow one to reliably anticipate the rate for another year. This instability makes it difficult to use the rates for program planning or assessment purposes. In fact, considerable caution should be used in interpreting any data where the number of events is small. While there are no hard and fast rules as to when numbers are too small for rates to be stable predictors of what's happening, DOH has published a protocol on small numbers.2 To increase the stability of the rate, one can combine several years of data (as long as there is no strong temporal trend in rates) or one can group several counties in the same geographic area or with similar population characteristics. Data Quality How does data quality affect the use of the data? Conclusions and health policy decisions are only as good as the data that go into making them. Pregnancy and abortion data quality has three major components: completeness, validity, and timeliness. Are the data complete, i.e., do we have a record for each event? Although WAC 246-490-100 requires that each hospital or facility that performs induced abortions report them to the Department of Health, there are some reasons to believe that some may not do so, but the number of unreported procedures is unclear. Some indication of the completeness of current reporting can be observed from a periodic national survey conducted by the Alan Guttmacher Institute 2 Assessment Operations Group, Washington State Department of Health. Guidelines for Working With Small Numbers. Nov. 2000. Available from URL: <http://www.doh.wa.gov/Data/guidelines/SmallNumbers.htm>.
Washington Pregnancy and Induced Abortion Statistics, 2005
47
(AGI) in which they compare the reported number of abortions in Washington State to the number of abortions which were reported to the Institute. In 2000, the most recent year for which the Guttmacher survey was performed, 26,200 abortions were reported to AGI as occurring in Washington State, which compares with 25,692 (occurrences) reported to the Department of Health, Center for Health Statistics, a difference of 2%.3 Registration of births is currently more than 99% complete, according to National Center for Health Statistics (NCHS) studies. Registration completeness may be slightly lower for births occurring outside of a hospital. A small number of birth certificates are filed after the data files are prepared and thus are not included in the data presented in this report. In addition to determining the completeness of a reporting system, researchers are often concerned with the degree to which people report what is actually happening. This characteristic of data is called its validity. Studies of validity of reporting systems like the birth certificate system usually look for an independent source of the information and determine the consistency with data contained in the reporting system. To improve data quality, abortion providers are queried if the information obtained on their reporting forms is incomplete, inconsistent, or falls outside expected ranges. Tables are sent back to each provider annually for a review of the completeness and accuracy of information reported for their facility. Birth and Fetal Death certificates are also edited for accuracy, internal consistency, and appropriate range of values (e.g., mother's age should normally be 8-59, so warning flags occur if ages less than 14 or greater than 49 are entered into the electronic birth system). A factor that affects the completeness of the data is the number of unknowns among responses. Sometimes providers do not complete all items on a birth certificate or abortion reporting form. The information may be overlooked or refused by the informant, or the informant may not have been asked for the data. As discussed above, unknowns are a particular problem for race on abortion forms. Preliminary investigation of this reporting problem revealed that several large abortion clinics contribute to most of the unknowns since they do not report race for any of their clients. Discussions with a committee in 1997 established to review the contents of the abortion reporting form revealed several reasons that women are not asked to state their race or ethnicity. The two main reasons cited were: the potential for misrepresenting women of color and the perceived discomfort of clients when asked their race
Washington Pregnancy and Induced Abortion Statistics, 2005
48
3 L.B. Finer and S.K. Henshaw, “Abortion Incidence and Services in the United States, 2000,” Perspectives on Sexual and Reproductive Health, Alan Guttmacher Institute, Vol. 35, no. 1, January/February 2003.
or ethnicity before receiving medical services. (See “Sources of Data: Race” in Appendix A for further discussion of problems with individual items on the birth certificate and the abortion reporting form). Finally, are pregnancy data timely, i.e., are births, abortions, and fetal deaths reported early enough so that the data are available when needed to be most useful for planning and program assessment purposes? There is often a tradeoff between timeliness and accuracy. For example, if abortion reports and birth certificates are filed quickly, there may not be enough time for complications related to the abortion procedure or the delivery to become evident. Indeed, abortion providers are asked to wait four weeks before submitting reports to the state to have time to include any complications that may have occurred in that interval. Despite the potential benefits of waiting, the main thrust - particularly for birth certificates - is to streamline the reporting process and to gather and report information as close to the event as possible. This has been accomplished by the Center for Health Statistics primarily by the development of the Electronic Birth Certificate System. Confidentiality How do we ensure confidentiality of the data? All of the data in this report are presented in aggregate form, which means that individuals cannot be identified from the data. However, it is important for potential data users to be aware of confidentiality issues related to the data. First, such personal information as a patient’s name or address is not asked for on the Report of Induced Termination of Pregnancy. The Washington Administrative Code (WAC 246-490-110) stipulates that information from the abortion reporting system cannot be disclosed in such a way that any individual, provider, or facility is identified. The medical and health information about births and fetal deaths is considered confidential and can be used for statistical purposes only (RCW 70.58.055). Hence, such confidential medical information may not be linked to any identifying information except for research projects approved by the Human Research Review Board of the Department of Social and Health Services and the Department of Health. (The Birth and Fetal Death Certificates, and the Report of Induced Termination of Pregnancy are shown in Appendix B.) It is the responsibility of all data users to treat these data in such a way as to respect and protect the privacy of individuals who have allowed information about their personal lives to be used for the good of the public. To ensure continued reporting of important demographic, medical, and health information, data must be handled in a way that ensures the privacy of individuals as required by law.
Washington Pregnancy and Induced Abortion Statistics, 2005
49
Sources of Data Collection Year Data for this report are compiled from abortion reports received by August, 2006 and from birth and fetal death certificates received by April, 2006. (See Appendix B for samples of certificates and forms.) Population Population estimates for 2005 are from the Office of Financial Management, Forecasting Division, “Intercensal and Postcensal Estimates of Population by Age and Sex, State of Washington: 1981-2005, Washington State,” August 2006. Demographics Age For abortions, the woman’s age is based on her reported age. For births and fetal deaths, the woman’s age is computed from mother’s date of birth and the date of delivery or the date of the fetal death beginning in 1989. Before that, mother’s age was based on reported age since mother’s date of birth was not recorded on the birth or fetal death certificate until 1989. A comparison of mothers’ age distributions before and after the change showed that ages calculated from birth dates are consistent with ages determined by asking the mother to report her age and that there is no substantial increase in missing data as a result of asking for her date of birth. Race Race on abortion, birth, and fetal death forms follow the U.S. Census:
The concept of race as used by the Census Bureau reflects self-identification by people according to the race or races with which they most closely identify. The categories are socio-political constructs and should not be interpreted as being scientific or anthropological in nature. Furthermore, the race categories include both racial and national-origin groups.4
For abortion reports, race is to be determined by patient’s self-identification and placed into one of the Bureau of the Census race categories: White, Black, American Indian or Native Alaskan, Asian/Pacific Islander, or Other. If more than one racial category is checked or reported under “Other,” the person’s racial background is
Washington Pregnancy and Induced Abortion Statistics, 2005
50
4 U.S. Census Bureau, 2000 Census of Population and Housing, Demographic Profile: Technical Documentation, p5-15:2002.

classified as “Multiple Races” in the reporting system, and the specific racial categories are recorded in the database. Race data on abortion reports continues to be so incomplete that the data cannot be used to study racial patterns in use of abortion services. In 2005, as Table 3F shows 9,226 of the 24,162 abortion reports (38.2%) were submitted by abortion providers with the patient’s race shown as blank or unknown. This number is down slightly from 45.5% blank or unknown in 2000. In previous years, birth and fetal death certificates use open-ended categories for reporting race, and multiple racial entries were stored on the database. When more than one racial category is reported, mother’s race was classified according to decision rules set by the National Center for Health Statistics (NCHS): If more than one race was listed and one was Hawaiian, then Hawaiian was selected. For other races, the first race listed was selected. Prior to 1990, the first non-white race listed was selected (unless Hawaiian was listed somewhere in the item). In 2003, the birth and fetal death certificates were revised. The race data are now collected by a series of check boxes which allow parents to report more than one race. Hispanic Origin ‘Origin’ as used by the Census Bureau refers to "the ancestry, nationality group, lineage, or country of birth of the person or the person's parents or ancestors before their arrival in the United States." Persons of Hispanic origin have their origins in a Hispanic or Spanish-speaking country such as Mexico, Cuba, or Puerto Rico, or the Spanish-speaking countries of Central or South America. Persons of Hispanic origin may be of any race. Prior to 1985, Hispanic data on abortion reporting forms were provided by a racial category of “Spanish Origin or Descent”. Hispanic origin was added as an ethnic category and collected as a separate item (in addition to race) in 1985. However, this item only asks, ‘Is patient of HISPANIC ethnic origin? - Yes’. A ‘No’ box (meaning not Hispanic) was not provided on the form. Thus, blanks (which are found on 98% of the forms) may mean either ‘Not Hispanic’ or ‘Origin Unknown’, making the data difficult, if not impossible, to interpret. For birth and fetal death certificates, Hispanic origin was added as an ethnic category and collected as a separate item (in addition to race) in 1988. For the first year of data collection (1988), some hospitals did not include the ethnicity item on the worksheet used to collect birth data. For this reason, Hispanic ethnicity data are less complete for 1988 than they are for later years. Rates calculated using these 1988 data will be lower
Washington Pregnancy and Induced Abortion Statistics, 2005
51

than rates for other years because of this underreporting and should thus not be used to study changes in Hispanic birth rates. Prior to 1988, Hispanic data on birth and fetal death certificates were provided by a racial category of "Mexican/Chicano" or "Mexican American". Data based on Hispanic origin from those years are not comparable with data collected in 1988 or thereafter and should not be used for trend analysis or year-to-year comparisons. Abortion Complications and Secondary Management The abortion reporting form provides pre-coded categories for complications related to the abortion procedure. Abortion complications are likely to be under-reported because follow-up care may be administered after abortion reports are filed or by a second facility or physician. Also, because Washington’s reporting form asks specifically about complications of the abortion procedure, complications attributed to something other than the procedure (such as pre-existing conditions) are not necessarily reported. For these reasons, complication totals and rates presented in this report should be interpreted as a low estimate of complications and used with caution. Changes to the abortion reporting form may have affected the reporting of complications over time. Before 1990, the form had a separate check box for retained products, which is the most common type of complication reported. In 1990, retained products were removed as a separate check box item for consistency with the National Abortion Federation (NAF), the private national organization promoting standards of care. Many facilities still provide this information by checking the box for ‘Other’ complications and then writing in ‘Retained Products.’ These write-in responses are used to tabulate data on retained products. The absence of an explicit category for retained products, however, is believed to cause under-reporting of this complication. Since retained products was removed as a category on the abortion reporting form, the number of abortions with ‘retained products’ noted as a complication decreased from 1989 to 1996. However, as a result of work by the committee that was formed to review the abortion reporting system (see the introduction for details), there was an increase in the reporting of complications beginning in 1997. This is reflected in the ‘retained products’ category which increased to 56 in 1997 and was 159 in 2005. “Secondary Management,” was added to Washington’s abortion reporting form in 1990 to provide data on the treatment of abortion complications. The categories were “resuction or other secondary procedure”,
Washington Pregnancy and Induced Abortion Statistics, 2005
52

“hospitalization”, “ transfusion”, “laparotomy”, “laparoscopy”, and “none”. This information probably under estimates the amount of secondary care since abortion patients may receive such care after the abortion report is completed or at facilities other than the one where the primary abortion procedure was performed. Adjusted Abortion and Pregnancy Rates, 1992-1995 One abortion facility failed to report abortions as required under Washington Administrative Code for four years (1992-1995). Due to the estimated size of the facility’s caseload (about 1,350 abortions per year, or 4% of the state total), a method was devised to impute the missing records. Two characteristics—woman’s age and place of residence—were assigned based on the characteristics of women who received abortions at this facility in 1991 and 1996, the years immediately preceding and following the years of non-reporting. Straight-line interpolation was used for categories formed by single year of age and place of residence.5 The residence categories included individual counties; other states or countries; and relevant cities and remainders of respective counties. A small number of abortion reporting forms were actually submitted by this facility in 1992-1995 (i.e., n = 82, 114, 42, and 17, respectively). Since the reported records contain information about such variables as gestational age and primary procedure, these records were kept in the datafile and used in place of selected imputed records that had been matched based on woman’s age and place of residence.6 For two reported cases in 1992 and one reported case in 1994, the county of residence did not match any of the imputed records; these reported cases were retained in the database. As a result, the number of records added to the database equals (A) the number of imputed cases minus (B) the number of reported cases plus (C) the unmatched records, as shown in the following table.
5 The facility performed 1,336 in 1991 and 1,369 in 1996 and estimated that they had performed between 1,275 and 1,350 each year in between. Several regression equations and interpolation methods using different years of data were examined; straight-line interpolation between 1991 and 1996 produced estimates most consistent with these parameters. 6 The criteria for matching records required: (a) an exact match on the county or large city of residence and (b) an exact or approximate match by age with priority given to exact matches, matches within an age group or with the nearest age, in that order.
Washington Pregnancy and Induced Abortion Statistics, 2005
53
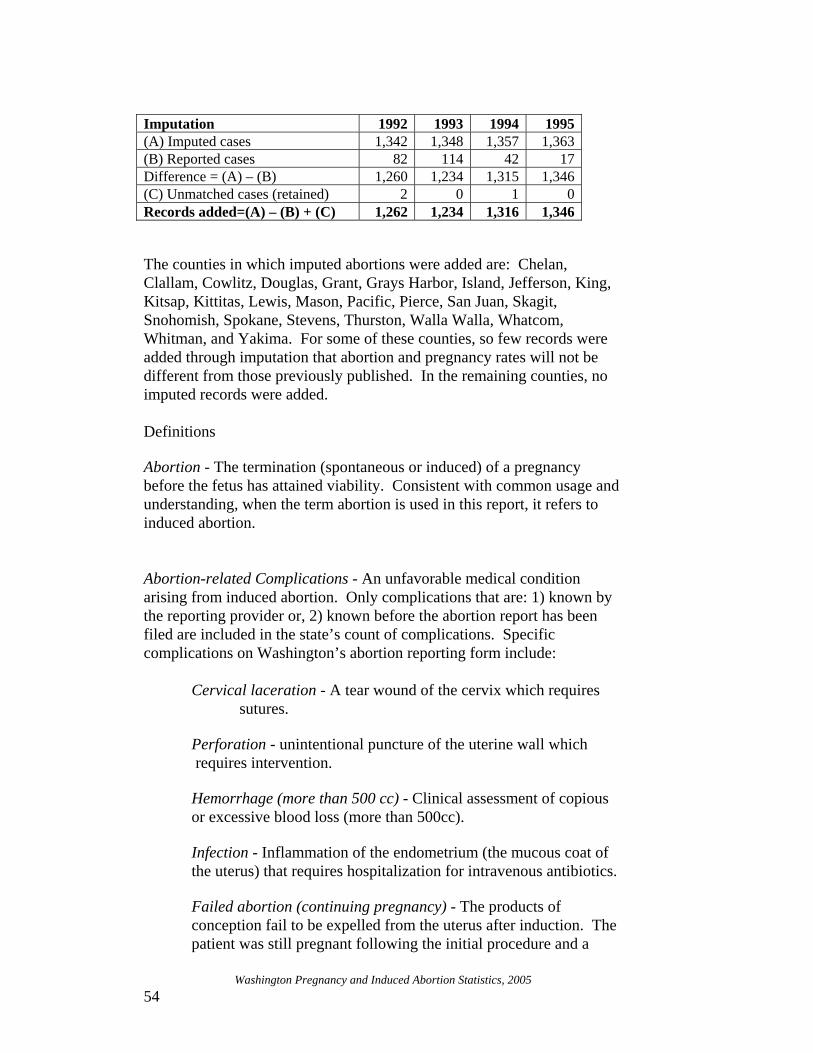
Imputation 1992 1993 1994 1995 (A) Imputed cases 1,342 1,348 1,357 1,363 (B) Reported cases 82 114 42 17 Difference = (A) – (B) 1,260 1,234 1,315 1,346 (C) Unmatched cases (retained) 2 0 1 0 Records added=(A) – (B) + (C) 1,262 1,234 1,316 1,346 The counties in which imputed abortions were added are: Chelan, Clallam, Cowlitz, Douglas, Grant, Grays Harbor, Island, Jefferson, King, Kitsap, Kittitas, Lewis, Mason, Pacific, Pierce, San Juan, Skagit, Snohomish, Spokane, Stevens, Thurston, Walla Walla, Whatcom, Whitman, and Yakima. For some of these counties, so few records were added through imputation that abortion and pregnancy rates will not be different from those previously published. In the remaining counties, no imputed records were added. Definitions Abortion - The termination (spontaneous or induced) of a pregnancy before the fetus has attained viability. Consistent with common usage and understanding, when the term abortion is used in this report, it refers to induced abortion. Abortion-related Complications - An unfavorable medical condition arising from induced abortion. Only complications that are: 1) known by the reporting provider or, 2) known before the abortion report has been filed are included in the state’s count of complications. Specific complications on Washington’s abortion reporting form include:
Cervical laceration - A tear wound of the cervix which requires sutures.
Perforation - unintentional puncture of the uterine wall which requires intervention.
Hemorrhage (more than 500 cc) - Clinical assessment of copious or excessive blood loss (more than 500cc).
Infection - Inflammation of the endometrium (the mucous coat of the uterus) that requires hospitalization for intravenous antibiotics.
Failed abortion (continuing pregnancy) - The products of conception fail to be expelled from the uterus after induction. The patient was still pregnant following the initial procedure and a
Washington Pregnancy and Induced Abortion Statistics, 2005
54
second procedure is required to terminate the pregnancy. Death -The patient died as a result of complications of the procedure.
Retained products - A portion of the products of conception was not expelled from the uterus after induction. A second procedure is required to prevent further medical complications. (Not the same as a Failed Abortion (continuing pregnancy); see above).
Other (specify)- Occurrence of any other complication, such as peritonitis or drug reaction.
Fetal Death - Death prior to the complete expulsion or extraction from its mother of a product of human conception, irrespective of the duration of pregnancy. The death is indicated by the fact that after such expulsion or extraction, the fetus does not breathe or show any other evidence of life such as beating of the heart, pulsation of the umbilical cord, or definite movement of voluntary muscles. Reporting of fetal deaths to the state is required only when the gestational period is twenty weeks or more. Gestational Period - Number of weeks elapsed between the first day of the last menstrual period and date of delivery or date of pregnancy termination. The term gestational period is interchangeable with weeks of gestation, gestational age, and duration of pregnancy. This report uses the physician’s estimate of gestational age. Induced Abortion - The purposeful interruption of pregnancy, irrespective of the duration of pregnancy, with the intention other than to produce a live born infant or to remove a dead fetus, the result of which is not a live birth. Procedures for false pregnancy, ectopic pregnancy, and missed abortion (dead ovum retained in uterus in intended pregnancy) are not included in the definition. The term is used in this report interchangeably with induced termination of pregnancy, induced termination, and abortion. Induced Abortion Procedures: Dilation and Evacuation (D&E) - Involves opening the cervix (dilation) and using primarily sharp techniques, but also suction and other instrumentation such as forceps for evacuation. (Dilation is performed by means of laminaria tents (sterile dried seaweed) until the cervical opening is large enough to allow removal of the uterine contents by means of a
Washington Pregnancy and Induced Abortion Statistics, 2005
55
sponge forceps or some other specially designed instrument. Hysterotomy /Hysterectomy - Hysterotomy involves surgical entry into the uterus, as in a Cesarean section, that removes a fetus that is too immature to survive, even with extraordinary life support measures. Hysterotomy is usually performed only if other abortion procedures fail. Hysterectomy is a procedure in which the uterus is removed either with the fetus inside or after the fetus has been removed. It is usually performed only when a pathological condition of the uterus, such as fibroid tumors, warrants its removal or when a woman desires sterilization. Intra-Uterine Instillation (Saline or Prostaglandin) - Involves either withdrawing a portion of amniotic fluid from the uterine cavity by a needle inserted through the abdominal wall and replacing this fluid with a concentrated salt solution (known as saline instillation, saline abortion, or saline amniotic fluid exchange) or injecting a prostaglandin-- a substance with hormone-like activity--into the uterine cavity through a needle inserted through the abdominal wall (known as intra-uterine prostaglandin instillation). The saline instillation process induces labor, which results in the expulsion of the usually dead fetus approximately 24 to 48 hours later. The interval between prostaglandin injection and expulsion tends to be shorter than in a saline abortion. Medical (Nonsurgical)- Involves the administration of a medication or medications to induce an abortion. Medications (e.g., methotrexate, mifepristone, misoprostol, etc.) are used most frequently early in the first trimester of pregnancy. However, some medications (e.g., prostaglandin suppositories, injectable prostaglandins, etc.) may also be administered during the second trimester of pregnancy to induce abortion. Medications may be administered orally, by injection or intra-vaginally. Sharp Curettage (D&C) – Involves dilation of the cervix as in suction, although usually to a larger diameter. The fetal and placental tissues are then scraped out with a curette, which resembles a small spoon. Also, surgical D&C or surgical curettage. Suction Curettage – The cervical canal is dilated by the successive insertion of instruments of increasing diameter called dilators. When the opening is large enough, a flexible tube (cannula) is inserted into the uterine cavity and the fetal and placental tissues are then suctioned out by an electric vacuum pump. Also, vacuum aspiration, suction D&C, or early uterine evacuation. Other(specify)- All other procedures not included in the preceding categories should be shown as “Other” and the procedure used should be
Washington Pregnancy and Induced Abortion Statistics, 2005
56

described after “specify.” This category includes procedures using a combination of agents, such as laminaria and prostaglandin, urea and prostaglandin, prostaglandin and oxytocin, or prostaglandin and saline. Induced Abortion Management - Medical care consequent and secondary to the primary abortion procedure. The specific types of management care listed on Washington’s abortion reporting form are:
Resuction or other secondary procedure - Resuction of the uterus to remove remaining fetal tissue. (Note that providers are instructed to check this management category only for cases where a resuction or other secondary procedure was required for removal of retained products or failed abortion and performed following initial discharge of patient.)
Hospitalization - Hospitalization became necessary following the termination as a result of complications or for any other reason.
Transfusion - Transfusion of whole blood or plasma.
Laparotomy - A surgical incision through the abdominal wall as part of an examination.
Laparoscopy - Examination of the abdominal cavity by the introduction of a laparoscope through a small abdominal incision.
Live Birth - The complete expulsion or extraction from its mother of a product of human conception, irrespective of the duration of pregnancy, which, after such expulsion or extraction, breathes, or shows any other evidence of life such as beating of the heart, pulsation of the umbilical cord, or definite movement of voluntary muscles, whether or not the umbilical cord has been cut or the placenta is attached. Maternal Death - Death attributed to complications of pregnancy, childbirth, or the puerperium (ICD-10, O00-O99); includes abortion-related death. The death must occur within six weeks of the live birth or abortion to be considered a maternal death. Occurrence Data - Data allocated by place where the event occurred, regardless of the person's place of residence. Provider - Facility where induced abortions are performed. Facilities performing induced abortions may be clinics, doctors’ offices, or hospitals.
Washington Pregnancy and Induced Abortion Statistics, 2005
57

Residence Data - Data allocated by place of residence of the child's mother (births, fetal deaths), or by place of residence of the patient (abortions), regardless of where the event occurred. Spontaneous Abortion - An unintended interruption of pregnancy, the result of which is a fetal death of any gestational age. Other terms used: miscarriage, miscarried pregnancy. Trimester - The duration of human pregnancy, approximately 266 days, divided by 3, resulting in three equal time periods equaling 88.67 days, or 12.67 weeks, or approximately three months, each. As a useful rule-of-thumb, gestation weeks 1 through 12 are considered the first trimester of pregnancy; weeks 13 through 24, the second trimester; and over 24 weeks, the third trimester.
Washington Pregnancy and Induced Abortion Statistics, 2005
58

Washington Pregnancy and Induced Abortion Statistics, 2005
59
Rates and Ratios Rounding - Rates are rounded to the nearest tenth. When the rate or percent is less than one-tenth, the entry is 0. Rates and Ratios Used in this Report - Rates and ratios are calculated by dividing the number of events of concern by the population at risk (or a related population) and multiplying by a standard constant (i.e., 1,000 or 10,000).
GeneralAbortionRate TotalAbortionsWomenofChildbearingAge
x=−( )
,15 44
1 000
GeneralFertilityRate TotalLiveBirthsWomenofChildbearingAge
x=−( )
,15 44
1 000
PregnancyRate LiveBirths Abortions FetalDeathsWomenofChildbearingAge
x=+ +
−# ( )
( ),
15 441 000
Age SpecificAbrtnRate AbortionsforSpecificAgeGroupWomenofSameAgeGroup
x− =#
#,1 000
Age SpecificBirthRate LiveBirthsforSpecificAgeGroupWomenofSameAgeGroup
x− =#
#,1 000
AbortionRatio AbortionsLiveBirths
x=##
,1 000
GeneralComplicationRate ComplicationCasesAbortionsPerformedinWA
x=#
#,1 000
FetalDeathRate FetalDeathsTotalLiveBirths TotalFetalDeaths
x=+
# ,1 000
FetalDeathRatio FetalDeathsTotalLiveBirths
x=# ,1 000
MaternalDeathRate MaternalDeathsTotalLiveBirths
x=# ,10 000


Washington Pregnancy and Induced Abortion Statistics, 2005
61
Appendix B: Sample Certificates and Forms Birth Filing Form

Washington Pregnancy and Induced Abortion Statistics, 2005
62

Washington Pregnancy and Induced Abortion Statistics, 2005
63
Certificate of Fetal Death
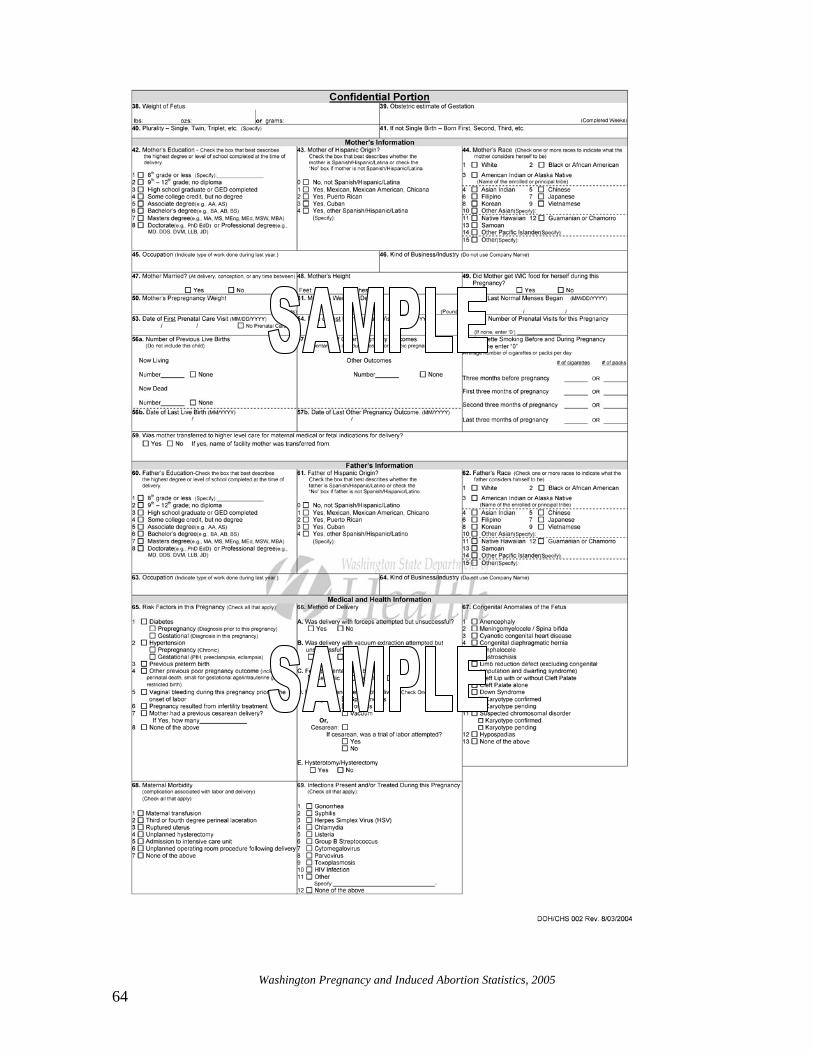
Washington Pregnancy and Induced Abortion Statistics, 2005
64

Washington Pregnancy and Induced Abortion Statistics, 2005
65
Report of Induced Termination of Pregnancy

Washington Pregnancy and Induced Abortion Statistics, 2005
66
Continuation of the Report of Induced Termination of Pregnancy