Embed Size (px)
Citation preview

Computer-Aided Civil and Infrastructure Engineering 16(6) (2001) 431–443
INDUSTRIAL APPLICATION
The Role of Computer Models inFull-Scale Bridge Laboratory Tests
D. G. Linzell *
Department of Civil and Environmental Engineering, The Pennsylvania State University,231L Sackett Building, University Park, Pennsylvania 16801, USA
Abstract: The role of computer modeling in an extensiveseries of curved steel bridge laboratory tests recently com-pleted at the Federal Highway Administration’s (FHWA)Turner-Fairbank Highway Research Center (TFHRC) isdiscussed. Computer models were involved extensivelythroughout the process, from design of the testing frame toanalysis of data that were produced. Predicted results froma series of finite-element models are compared with datarecorded from nine tests that occurred during construc-tion. Results from the tests and from finite-element anal-yses are also compared against those produced using theV-load method, a simplified curved bridge analysis tool.The use of computer-generated Monte Carlo simulations tohelp reduce and analyze data generated during the con-struction tests is also discussed.
1 INTRODUCTION
Computer modeling continues to play an important rolein the experimental study of bridges and other struc-tures. Comprehensive computer models help not only withdesigning the frame, fixtures, and components involved inthe experiments but also with instrumentation placement,test planning, and data reduction and analysis. The impor-tance of accurate computer modeling is magnified whenbridge components or systems are tested at full scale.Comprehensive computer modeling was an essential part
of a series of full-scale curved steel bridge experimentalinvestigations performed at the Federal Highway Adminis-tration’s (FHWA) Turner-Fairbank Highway Research Cen-ter (TFHRC) in McLean, Virginia. The tests were used toinvestigate the behavior of curved steel plate girder bridgesduring construction and under loads causing predominantly
*E-mail: [email protected].
flexural behavior. Results from the models provided confi-dence to the research team that desired behavior occurredand that pertinent data were collected and reduced.A number of design iterations were performed before
a final experimental bridge system was selected, fabri-cated, constructed, and tested. After the iterations werecompleted, a simply supported three-girder structure wasselected (Figure 1).A series of tests was performed as this structure was
being constructed. They examined various subassemblies ofthe final three-girder system elastically under self-weight.Figure 2 indicates that a total of nine tests of six differentframing plans were completed.This article provides an overview of finite-element mod-
els that were constructed to help with the design and con-struction testing phases. Comparisons between data fromthe construction tests and finite-element predictions are pre-sented and discussed. Additional examinations of analyticalresults from the finite-element models and from hand cal-culations using the V-load method are also shown. Finally,a series of computer-based Monte Carlo simulations, whichwere used to study the influences of instrument variabilityon data produced from the tests, are discussed.
2 PREVIOUS RESEARCH
A large number of computer and experimental studies ofcurved bridge behavior have been completed since the late1960s. During this period, the advantages of construct-ing steel bridges using curved beams became more appar-ent, and a subsequent need for design specifications arose.Relevant publications from this time period will be summa-rized. Detailed discussions of curved steel bridge researchare given by Zureick et al.,30 Zureick and Naqib,29 andLinzell.19
© 2001 Computer-Aided Civil and Infrastructure Engineering. Published by Blackwell Publishers, 350 Main Street, Malden, MA 02148, USA,and 108 Cowley Road, Oxford OX4 1JF, UK.

432 D. G. Linzell
Fig. 1. Final experimental structure plan showing girder strain gauge instrumentation.
Fig. 2. Erection study framing plans.
To date, two specifications have been developed for thedesign of curved steel bridges: (1) the AASHTO GuideSpecifications for Horizontally Curved Bridges1 in theUnited States and (2) the Hanshin Expressway PublicCorporation’s Guidelines for the Design of HorizontallyCurved Girder Bridges15 in Japan. Organized developmentof the AASHTO Guide Specifications began with the Con-sortium of University Research Teams (CURT) Project inthe late 1960s. The Hanshin Guidelines were compiledfrom Japanese research completed in the late 1970s andearly 1980s. Both specifications incorporated a numberof scale-model system tests and medium-scale componenttests to investigate the behavior of curved steel bridgesunder static loads. Computer analyses were performedconcurrently with many of these tests to help validate
analytical results and to provide a mechanism for futurestudies of curved steel bridge behavior.Culver and Christiano9 performed static tests on a one-
thirtieth scale model of a two-span continuous-curvedI-girder bridge. Strains and deformations were comparedwith predictions from a computer program that usedthe flexibility method and influence coefficients deriveddirectly from curved beam governing differential equationsto obtain a solution.Brennan4,5 performed an extensive series of curved steel
bridge analytical and experimental studies. Work centeredon development of a three-dimensional (3D) computerprogram and on a series of experimental studies of a scale-model curved bridge. Comparisons between experimen-tal and computer-generated influence lines, moments, anddeflections for each curved girder were made. Further eval-uation of the computer program was accomplished throughcomparisons with test results produced by Brennan et al.,7
Brennan,6 and Brennan and Mandel.8
Mozer et al.21 examined the behavior of a pair of curvedsteel plate girders under high bending, high shear, and com-bined high bending and shear forces through eight statictests of a scale-model curved steel bridge. The structurewas designed so that transverse stiffener and radial cross-frame locations could be varied. Results were comparedwith predictions from computer analyses that treated thesystem as a grid.

The role of computer models in full-scale bridge laboratory tests 433
Fukumoto and Nishida12 tested six simply supportedcurved I-beams and used data to validate a computerprogram for analyzing elastic and inelastic curved girderlarge deformation behavior. The beams had varying crosssections, span lengths, and radii of curvature and weretested under three-point bending. The program used trans-fer matrices along with the Runge-Kutta method to estimatedeflections and ultimate strengths.Yoo and Carbine27 investigated the capacities of single
rolled curved I-sections with differing cross sections andradii of curvature. Experimentally generated bifurcationloads from three-point tests were compared with computer-generated results.Shanmugam et al.24 and Thevendran et al.25 compared
finite-element results with experimental data from a seriesof isolated curved I-beam tests. Behavior of welded versesrolled curved beams was studied. The finite-element modelswere constructed using the ABAQUS finite-element analy-sis package and incorporated geometric nonlinearities andresidual stress effects.Static curved steel box-girder studies that involved test-
ing and computer analyses included work by Fam andTurskstra,10 which examined simply supported single-cellcurved box girders under point and line loads. Experi-mental results were compared with data generated fromfinite-element analyses. Sennah and Kennedy23 exam-ined shear distributions in curved composite cellular box-girder bridges through extensive parametric studies usingABAQUS. Computer models were benchmarked againsttests of four one-twelfth scale-model three-cell box-girderbridges. Composite box-girder behavior was examined byArizumi et al.3 using tests of a single simply supportedspecimen. Results were compared with predictions from acomputer program using the finite-strip method.While extensive effort has been dedicated to under-
standing the behavior of in-service curved steel bridges,little experimental or analytical research has been pro-duced that focuses on their behavior during construction.Construction tests completed for the CSBRP attempted toaddress this research need. One extensive study of a curvedI-girder bridge during construction was recently completedin the United States and reported on by Galambos et al.,13
Pulver,22 and Hajjar and Boyer.14 Strains and deformationswere recorded during construction (e.g., girder placement,concrete placement, etc.) of a two-span continuous horizon-tally curved and superelevated composite I-girder structure.Field results were compared with values produced from twocurved bridge computer analysis programs and their accu-racy assessed.
3 EXPERIMENTAL BRIDGE DESIGN
Design of the experimental bridge was strongly influencedby the primary goal of loading full-scale curved I-girder
specimens to their full inelastic capacity while imposingrealistic in situ boundary conditions.28 Previously, manyof the laboratory tests were conducted on either medium-scale isolated girders with unrealistic boundary conditionsor on small-scale curved bridge systems where similitudecould not be properly maintained for all relevant variables.Several configurations were investigated during the designphase of the experimental structure. The challenge associ-ated with the design was to ensure linear elastic behaviorof the portion of the structure outside any specimens thatwere tested (termed the testing frame) while inducing plas-tic deformations in each of the specimens. Initially, it wasanticipated that a single full-scale girder could be used toexamine flexural behavior. However, bracing of a single-girder system that would provide desired loads and bound-ary conditions to the specimens proved to be impractical.Twin-girder systems were investigated next. These systemsalso were abandoned because the interior girder would liftup and not remain elastic as load shifted from the exteriorgirder during plastification of the test specimen.The structure selected for testing is shown in Figure 1.
The three-girder system was designed so that under flexuralloads the midspan portion G3 failed, while the remainderof the structure remained elastic, which permitted place-ment of plate girder specimens with differing geometricand material properties at this location. Girder spans alongthe arc were between 26.2 m for G1 and 28.6 m for G3with radii of curvature between 58.3 and 63.6 m. Girderdimensions were between 121.9 × 0.8 cm and 121.9 × 1.3cm for the webs and between 40.6 × 1.7 cm and 61.0 ×5.7 cm for the flanges.Figure 1 indicates that extra lines of cross-frames were
placed between G1 and G2 in the final structure. Thesecross-frames were used to stiffen and stabilize these twogirders and to provide a load-distribution path that placedthe highest forces at midspan of G3. To achieve this load-distribution path, cross-frames were constructed using five413-MPa tubular steel members arranged in a K, as shownin Figure 3.
Fig. 3. Typical cross-frame elevation.
434 D. G. Linzell
Girders were supported with radially oriented abutmentsconsisting of steel W-sections and channels tied to thestrong floor with DYWIDAG bars. These abutments ele-vated the system to a height of approximately 2 m off thelaboratory floor. A combination of spherical bearings andTeflon pads were used to minimize frictional forces andallow translation and rotation in any direction except down-ward at the abutments for G1 and G3. G2’s movement wasrestrained using guided bearings at both ends and a tangen-tial support frame at its west end, as shown in Figure 1.The guided bearings prevented radial translation, and thetangential frame, consisting of W-sections and pinned toG2 at its neutral axis, helped stabilize the system. Differen-tial radial displacement between adjacent girders was min-imized through the use of lower lateral bracing mounteddiagonally between adjacent girders in the exterior cross-frame bays.The preliminary finite-element analyses of this structure
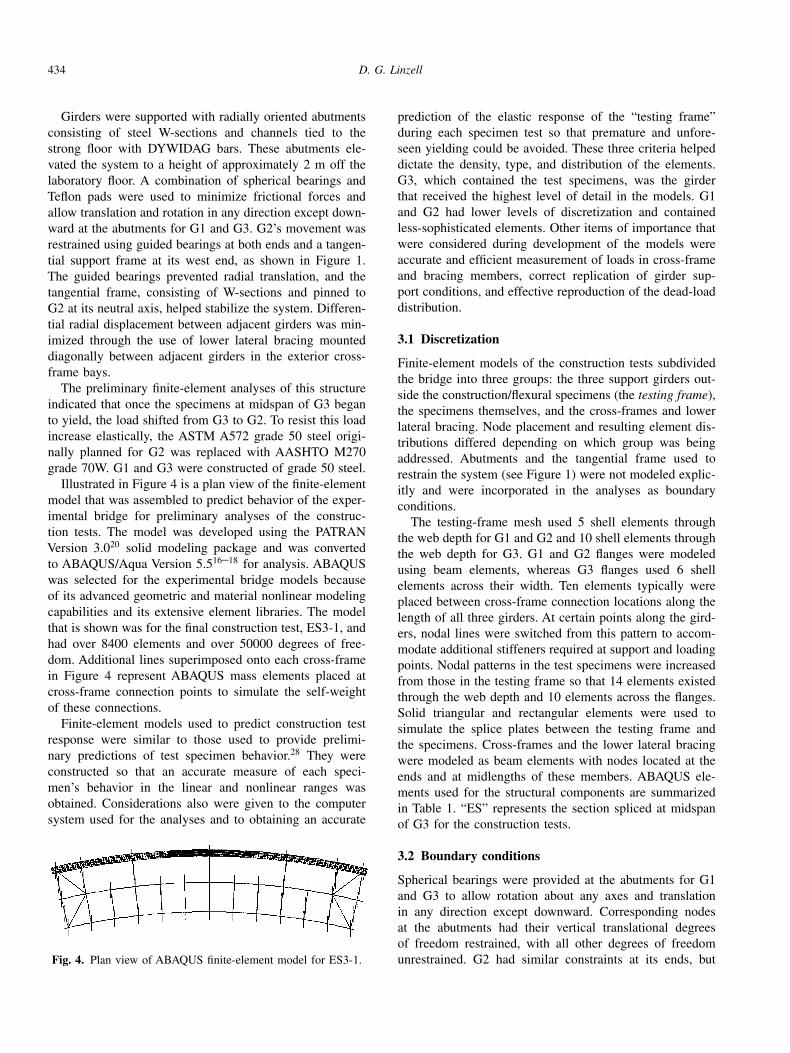
indicated that once the specimens at midspan of G3 beganto yield, the load shifted from G3 to G2. To resist this loadincrease elastically, the ASTM A572 grade 50 steel origi-nally planned for G2 was replaced with AASHTO M270grade 70W. G1 and G3 were constructed of grade 50 steel.Illustrated in Figure 4 is a plan view of the finite-element
model that was assembled to predict behavior of the exper-imental bridge for preliminary analyses of the construc-tion tests. The model was developed using the PATRANVersion 3.020 solid modeling package and was convertedto ABAQUS/Aqua Version 5.516–18 for analysis. ABAQUSwas selected for the experimental bridge models becauseof its advanced geometric and material nonlinear modelingcapabilities and its extensive element libraries. The modelthat is shown was for the final construction test, ES3-1, andhad over 8400 elements and over 50000 degrees of free-dom. Additional lines superimposed onto each cross-framein Figure 4 represent ABAQUS mass elements placed atcross-frame connection points to simulate the self-weightof these connections.Finite-element models used to predict construction test
response were similar to those used to provide prelimi-nary predictions of test specimen behavior.28 They wereconstructed so that an accurate measure of each speci-men’s behavior in the linear and nonlinear ranges wasobtained. Considerations also were given to the computersystem used for the analyses and to obtaining an accurate
Fig. 4. Plan view of ABAQUS finite-element model for ES3-1.
prediction of the elastic response of the “testing frame”during each specimen test so that premature and unfore-seen yielding could be avoided. These three criteria helpeddictate the density, type, and distribution of the elements.G3, which contained the test specimens, was the girderthat received the highest level of detail in the models. G1and G2 had lower levels of discretization and containedless-sophisticated elements. Other items of importance thatwere considered during development of the models wereaccurate and efficient measurement of loads in cross-frameand bracing members, correct replication of girder sup-port conditions, and effective reproduction of the dead-loaddistribution.
3.1 Discretization
Finite-element models of the construction tests subdividedthe bridge into three groups: the three support girders out-side the construction/flexural specimens (the testing frame),the specimens themselves, and the cross-frames and lowerlateral bracing. Node placement and resulting element dis-tributions differed depending on which group was beingaddressed. Abutments and the tangential frame used torestrain the system (see Figure 1) were not modeled explic-itly and were incorporated in the analyses as boundaryconditions.The testing-frame mesh used 5 shell elements through
the web depth for G1 and G2 and 10 shell elements throughthe web depth for G3. G1 and G2 flanges were modeledusing beam elements, whereas G3 flanges used 6 shellelements across their width. Ten elements typically wereplaced between cross-frame connection locations along thelength of all three girders. At certain points along the gird-ers, nodal lines were switched from this pattern to accom-modate additional stiffeners required at support and loadingpoints. Nodal patterns in the test specimens were increasedfrom those in the testing frame so that 14 elements existedthrough the web depth and 10 elements across the flanges.Solid triangular and rectangular elements were used tosimulate the splice plates between the testing frame andthe specimens. Cross-frames and the lower lateral bracingwere modeled as beam elements with nodes located at theends and at midlengths of these members. ABAQUS ele-ments used for the structural components are summarizedin Table 1. “ES” represents the section spliced at midspanof G3 for the construction tests.
3.2 Boundary conditions
Spherical bearings were provided at the abutments for G1and G3 to allow rotation about any axes and translationin any direction except downward. Corresponding nodesat the abutments had their vertical translational degreesof freedom restrained, with all other degrees of freedomunrestrained. G2 had similar constraints at its ends, but

The role of computer models in full-scale bridge laboratory tests 435
Table 1ABAQUS element summary
ABAQUSLocation Structural component element type
G1, G2, G3, ES Web S4RG1, G2 Flanges B31G3, ES Flanges S4RG1, G2 Stiffeners B31G3, ES Stiffeners S4RG1–G2, G2–G3 Cross-frame members PIPE32G1–G2, G2–G3 Lower lateral bracing B32G3, ES Splice plates C3D6, C3D8
radial translation also was prevented using guided bear-ings. ABAQUS GAPUNI unidirectional gap elements, withlengths equal to bearing shim pack heights, were imple-mented at each girder abutment support to account for fric-tional forces that could be induced into the system shoulda Teflon pad unexpectedly stick. The support frame at thewest end of G2 was connected to the girder web using a pinplaced within a vertically aligned slotted hole. This theoret-ically prevented any movement in the tangential directionwhile allowing the remaining translations and rotations tooccur. The analytical model mimicked this restraint. Inter-mediate shoring points used during the construction testswere accounted for by restraining corresponding nodes atthe bottom flanges of G1, G2, and G3.
3.3 Geometric and materials properties
Geometric information for the analyses differed dependingon the type of ABAQUS element used to represent eachstructural component. Finite-element simulations of theconstruction tests were performed initially using nominaldimensions from the design plans. The models were thenreanalyzed with actual dimensions calculated as averagesof measurements taken during construction. In general,measured dimensions were slightly larger than nominaldimensions.Materials properties used in the ABAQUS model were
taken initially from nominal values specified in the designplans. Modifications to these values were made based onresults from manufacturer certification reports and fromcoupon tests that were performed.
3.4 Loading conditions
Loads for the construction test finite-element models con-sisted of self-weights of the bridge components. To accountfor member weights, steel densities were entered and wereset equal to the standard value for rolled steel, namely,77 kN/m3. Additional mass elements were required at eachcross-frame member connection due to the large number ofgusset plates used at these connections (see Figure 3).
4 TESTING
4.1 Instrumentation
Construction tests were divided into three groups: ES1series tests, ES2 series tests, and ES3 series tests. Theyexamined the behavior of the framing plans in Figure 2as shoring was sequentially removed and replaced. ES1series tests involved shoring removal and replacement frombeneath G1, ES2 tests from beneath G1 and G2, and ES3-1from beneath all three girders.Data were recorded during shoring removal and replace-
ment. A large number of instruments was required toprovide accurate measure of behavior during both the con-struction tests and the flexural tests that followed. Finite-element analyses were an important part of instrumentselection and placement. Types, locations, and densities ofinstruments were determined using results from computeranalyses performed during the design phase.Instruments for the construction and flexural tests con-
sisted of
• Load cells and instrumented studs to measure supportreactions and applied loads
• Vibrating wire and resistance strain gauges to measurestrains developed during construction and testing
• Displacement and rotation transducers (LVDTs, poten-tiometers, and tiltmeters) to measure deformations devel-oped at select cross sections during construction andtesting
• Targets for laser and total station systems to measureglobal deformations experienced during construction andtesting
A large percentage of this instrumentation was affixed toG3 and the cross-frames between G2 and G3. G3 containedspecimens examined during the flexural tests, and therefore,a number of data points were required near midspan totrack each specimen’s elastic and inelastic behavior. Cross-frame members between G2 and G3 were instrumented toensure that they remained elastic and to provide internalforce measurements for any necessary free-body diagrams.Instruments required for the flexural tests were placed
onto the structure during construction and helped recorddata during the construction tests. Load cells were posi-tioned at girder support points and at abutments and inter-mediate shoring locations. Strain gauges were affixed to thegirders, cross-frames, and lower lateral bracing. Figure 1details locations for girder strain-gauged sections for theconstruction tests and shows gauge positions at midspan ofG3. Deformation transducers were placed at midspan andat the supports of each girder. Laser and total station sys-tems were used to track global deformations and acquiredtargets on the girder top and bottom flanges.Since instruments required for the flexural tests were
used for the construction tests, the quantity of instrumenta-

436 D. G. Linzell
tion available for acquisition increased as components wereadded to the structure. Over 1050 data points were recordedduring each testing step for ES3-1.
4.2 Testing procedure
The construction tests were performed to
• Provide insight into curved steel bridge behavior duringconstruction
• Establish confidence in the finite-element models• Help coordinate methods for identifying and storing datagenerated during testing
The tests followed a standard procedure. Each began withthe system shored to its “no load” position. This positiontheoretically represented a shored condition in which alldead-load strains and deformations had been removed. Itwas established for each test using a combination of field-measured girder camber information and results from pre-liminary analyses. Information from the analyses and thecamber data was used to obtain reasonable “no load” posi-tions in the laboratory using abutment and shoring loadcells and midspan potentiometers. A large number of itera-tions typically were required to establish an acceptable “noload” position.Once an acceptable “no load” position was established
for each test, a series of shoring removal steps was usedto lower the girder(s). Once the girder(s) were lowered,shoring was sequentially replaced to return the system toits initial “no load” position. The first three tests, ES1-1 toES1-3, involved G1 and G2 with cross-frames 1L and 1Rin place (see Figure 2). Shoring was removed and replacedsequentially from beneath G1 for each of the tests whileG2 remained shored. ES1-4 and ES2-1 studied G1 and G2with cross-frames 1L, 7, and 1R in place. ES1-4 examinedthis system as shoring was removed and replaced sequen-tially from beneath G1. ES2-1 studied the system as shoringwas removed sequentially from beneath G1, followed bysequential shoring removal from beneath G2. Once themaximum predicted elastic deformation had been reached,shoring was replaced beneath both girders. ES1-5 exam-ined a framing plan that involved cross-frames 1L, 1R, 2L,and 2R as shoring was removed from beneath G1. ES1-6involved cross-frames 1L, 1R, 2L, 2R, 4L, and 4R. ES2-2was the second test that studied behavior as shoring wasremoved and replaced from beneath both G1 and G2. Thesystem that was tested involved the lower lateral bracingand cross-frames 1L, 2L, 4L, 6L, 4R, 2R, and 1R. ES3-1was the single test in which shoring supports were removedand replaced sequentially from beneath three girders. Thir-teen cross-frames were in place between G1 and G2 andseven between G2 and G3. The system began in its “noload” position, and shoring was removed sequentially frombeneath all three girders. A series of investigations of eachgirder using a single midspan shore was performed after
the system had been lowered. G3 was raised and lowered inequal load increments followed by similar examinations ofG2 and G1. At the completion of these single-girder inves-tigations, the three-girder system was returned to its “noload” position.
5 EXPERIMENTAL ANDANALYTICAL COMPARISONS
5.1 Construction test data andfinite-element analyses
Accuracy of finite-element models in the elastic range wasassessed through detailed comparisons with experimentalresults for five of the construction tests: ES1-4, ES1-6,ES2-1, ES2-2, and ES3-1. The single (ES1-4, ES1-6) andtwin-girder (ES2-1, ES2-2) tests were selected because theywere judged to best represent actual twin-girder configura-tions that could be constructed in the field. The three-girdertest was selected because it was similar to the framing planused to perform the flexural tests. The shoring removalsequence followed during the tests was replicated in thefinite-element models by removing corresponding nodalrestraints.Analytical and experimental support reactions, vertical
displacements, and girder and cross-frame internal strainsand forces were compared at various points during the tests.Although all the construction tests were elastic, compar-isons that were performed provided a level of confidence inthe finite-element models that was previously unavailable.In addition, they helped assess the need for the replace-ment, relocation, or addition of instrumentation prior to ini-tiation of the flexural tests.The first test that was examined experimentally and ana-
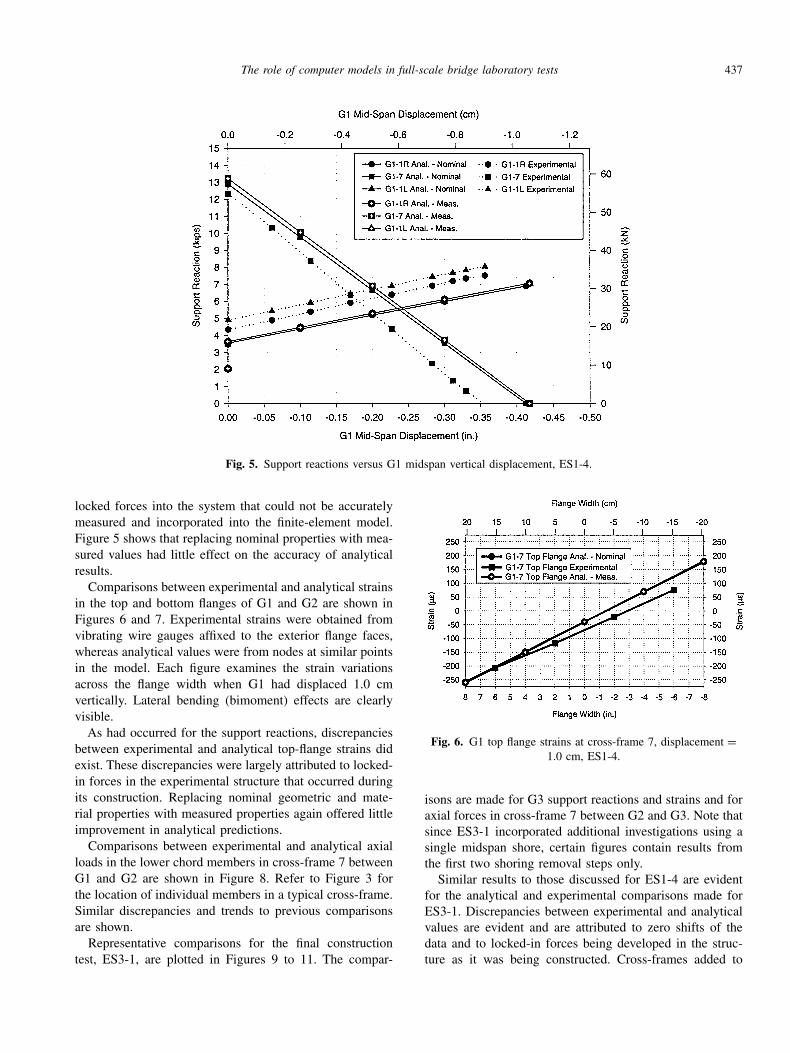
lytically was ES1-4. A support reaction versus midspan dis-placement plot for G1 is shown in Figure 5. The figureshows the variation in reactions at cross-frames 1L, 1R, and7 as G1 was lowered. The shoring support at cross-frame7 was used to lower G1 to its final deformed shape. Dif-ferences between experimental and analytical support reac-tions approached 6.5 kN, and displacements differed by0.13 cm.Explanations for discrepancies observed in Figure 5 are
as follows. Zero shifts of experimental readings, whichresulted from heating of the instruments and data acqui-sition system circuitry, occurred during establishment ofthe initial “no load” position. These shifts occurred forall the construction tests. In addition to the zero shifts,changes to the experimental structure, which could not bequantified, occurred during fabrication. When the girderswere fabricated, G2 was incorrectly cambered and washeated and recurved to the correct camber. The heating andrecambering made transverse stiffeners out of plumb andcaused fit-up problems for the cross-frames, which, in turn,
The role of computer models in full-scale bridge laboratory tests 437
Fig. 5. Support reactions versus G1 midspan vertical displacement, ES1-4.
locked forces into the system that could not be accuratelymeasured and incorporated into the finite-element model.Figure 5 shows that replacing nominal properties with mea-sured values had little effect on the accuracy of analyticalresults.Comparisons between experimental and analytical strains
in the top and bottom flanges of G1 and G2 are shown inFigures 6 and 7. Experimental strains were obtained fromvibrating wire gauges affixed to the exterior flange faces,whereas analytical values were from nodes at similar pointsin the model. Each figure examines the strain variationsacross the flange width when G1 had displaced 1.0 cmvertically. Lateral bending (bimoment) effects are clearlyvisible.As had occurred for the support reactions, discrepancies
between experimental and analytical top-flange strains didexist. These discrepancies were largely attributed to locked-in forces in the experimental structure that occurred duringits construction. Replacing nominal geometric and mate-rial properties with measured properties again offered littleimprovement in analytical predictions.Comparisons between experimental and analytical axial
loads in the lower chord members in cross-frame 7 betweenG1 and G2 are shown in Figure 8. Refer to Figure 3 forthe location of individual members in a typical cross-frame.Similar discrepancies and trends to previous comparisonsare shown.Representative comparisons for the final construction
test, ES3-1, are plotted in Figures 9 to 11. The compar-
Fig. 6. G1 top flange strains at cross-frame 7, displacement =1.0 cm, ES1-4.
isons are made for G3 support reactions and strains and foraxial forces in cross-frame 7 between G2 and G3. Note thatsince ES3-1 incorporated additional investigations using asingle midspan shore, certain figures contain results fromthe first two shoring removal steps only.Similar results to those discussed for ES1-4 are evident
for the analytical and experimental comparisons made forES3-1. Discrepancies between experimental and analyticalvalues are evident and are attributed to zero shifts of thedata and to locked-in forces being developed in the struc-ture as it was being constructed. Cross-frames added to

438 D. G. Linzell
Fig. 7. G1 bottom flange strains at cross-frame 7,displacement = 1.0 cm, ES1-4.
Fig. 8. Lower chord member axial forces versus G1displacement, cross-frame 7 between G1 and G2, ES1-4.
the system to obtain the final ES3-1 configuration causedfurther redistribution of loads and subsequent increases indifferences between experimental results and analytical pre-dictions. While the levels of error in some of the plots mayappear alarming, magnitudes typically were small when thesize of the structure, its level of indeterminacy, and antici-pated loads and deformations generated during the flexuraltests were considered. As an example, a 31-kN differencebetween analytical and experimental support reactions wasobserved in Figure 9. This difference appears large but isapproximately 5 percent of the total self-weight of the sys-tem, which was 521 kN.
5.2 Construction test data, finite-element andV-load analyses
It was of interest to compare results from the construc-tion tests against those found using both ABAQUS anal-ysis results and results from an approximate analysismethod. The V-load method, as outlined by AISC,2 was theapproach chosen because it is one of the most commonpreliminary design tools used for curved steel bridges.The V-load method was studied through comparisons
of G1 and G3 midspan moments for ES3-1. Comparisonswere made for the testing step in which the three-girder sys-tem had all intermediate shoring removed and was fully dis-placed under its own self-weight. Since the V-load methodwas derived for curved girder systems in which all cross-frame lines were continuous, it was decided that V-loadswould be calculated assuming that cross-frames that existedonly between G1 and G2 had been removed. ABAQUSanalyses of the modified framing plan loaded under self-weight indicated that minimal changes to girder midspanmoments occurred when the cross-frames were removed.Primary moments would be determined using measureddead loads, which included all cross-frames.Midspan moments found using the V-load method and
the finite-element model are compared with experimentalmoments for G1 and G3 in Table 2. Girder dead loadsare found using as-built measurements. The table showsthat both analytical and V-load results gave good estimatesof experimental midspan moments for G3, with differ-ences being 10 percent or less. V-load estimations for G1midspan moment were not as accurate and were noncon-servative, with a moment of −50 kN·m being predictedat midspan of G1, whereas the experimental magnitudewas 41 kN·m. The ABAQUS model predicted the experi-mental midspan moment for G1 quite well. Even thoughthe midspan moment magnitudes for G1 were small, thefact that the V-load method estimated negative bending atmidspan of G1 showed that interior girder moment pre-dictions using this approach could not be considered asaccurate as those for the exterior girder. Studies by Fiechtlet al.11 showed similar results to what was observed for

The role of computer models in full-scale bridge laboratory tests 439
Fig. 9. Support reactions versus G3 midspan vertical displacement, ES3-1.
Fig. 10. G3 top flange strains at cross-frame 7,displacement = 2.5 cm, ES3-1.
here: V-load estimations of dead-load flexural behavior inthe exterior girder were shown to be accurate, but non-conservative results could be obtained for the interior girderin a multigirder system.
6 MONTE CARLO SIMULATIONS
In addition to helping examine the accuracy of finite-element models used to analyze and design the structure,the construction tests provided a means for development
Table 2G1, G3 midspan moments
Midspan moment (kN· m) Difference from exp. (%)
Girder Exp. FEM V-Load FEM V-Load
G1 41 39 −50 −3 −220G3 1306 1395 1333 7 2
and coordination of data reduction and storage methodsfor the flexural tests, which followed ES3-1 and involvedhigher loads and more sensors. One important part of thedata reduction process was being able to resolve equilib-rium of various free-body diagrams of the bridge. Beingable to evaluate the equilibrium of portions of the struc-ture with an acceptable level of accuracy not only wasvaluable for studying the validity of the data, but it alsowas important for determining the behavior of a portion ofthe structure (such as the midspan of G3) when loads anddeformations exceeded an instrument’s operating range.It was known prior to calculating equilibrium that cer-tain items associated with the highly indeterminate struc-tures that were tested, such as construction-sequence effectsand material and geometric imperfections introduced dur-ing fabrication, would affect experimental results so thatequilibrium in a theoretical sense (all force and momentcomponents summing to zero) could not be achievedexperimentally.

440 D. G. Linzell
Fig. 11. Lower chord member axial forces versus G3displacement, cross-frame 7 between G2 and G3, ES3-1.
Extensive effort was dedicated to developing and exam-ining data reduction methods for calculating equilibriumof numerous free-body diagrams of the construction tests.The sensitivity of results generated from these equilibriumstudies was examined using a series of computer-aidedMonte Carlo simulations. The studies examined the effectsof cumulative changes in instrument resolution on equi-librium results, which could result from electrical noisedisturbing instrument signals and from using different data-acquisition systems, with varying levels of accuracy, toacquire the data. A commercially available software pack-age, DecisionPro,26 was selected to perform the MonteCarlo simulations. DecisionPro uses a decision tree tocreate the probabilistic model and all subsequent single-valued and random variables in that model.The first step for the simulation was identification of the
probabilistic model to be analyzed. Data from test ES1-3were used to complete the simulation. The free-body dia-gram that was selected was the entire span of G1, which
exposed internal forces in the two end cross-frames (1L and1R) and was judged to be representative of all remainingequilibrium checks performed for the construction tests.The six equations typically examined for equilibrium
(force and moment sums about the three global coordi-nate axes) were reduced to two generic force and momentequations for simulation in DecisionPro. The numbers offorce, unit, and distance vectors involved in the simulationswere directly related to the number of active instrumentsfor ES1-3 and their locations on the structure. All variablesin the equations were either random in their own right orinvolved terms that were random.Monte Carlo simulations were run for a single data set
from ES1-3: the testing step in which the largest verticaldisplacements and rotations were generated at midspan ofG1. Load and strain magnitudes from this data set wereused to obtain initial means and standard deviations forthe normal distributions that represented corresponding ran-dom variables in DecisionPro. Means and standard devi-ations for strain gauges affixed to cross-frames 1L and1R are listed in Table 3. Data for the geometric variablesrequired for calculating force and moment equilibrium wereobtained from geometry measurements taken during con-struction. Normal distributions were used to represent thesevariables.Standard deviations for certain random variables were
increased from their initial settings, and effects on forceand moment equilibrium obtained were examined. Thefirst simulations calculated equilibrium using recordeddata means and standard deviations from the cross-framestrain gauges. Strain gauge standard deviations were thenincreased to 5µε to investigate sensitivity of calculatedequilibrium to increased variability in gauge data. A stan-dard deviation of 5µε was approximately four times thevalues listed in Table 3, which appears to be a dramaticincrease. However, 12-bit data acquisition systems wereused to acquire the strain gauge data, and their readableranges were set at ± 20,000µε so that resolutions greaterthan those shown in Table 3, between 10µε and 20µε, werelikely. Therefore, a third set of simulations with standarddeviations of 10µε and a final set with deviations of 20µε
also were examined. Results from the moment simulationsare tabulated in Table 4.The table indicates a general trend for the influences of
strain gauge variability on moment equilibrium sums. Itshows that while adjustments in the variability of straingauge readings did not appreciably affect mean sum val-ues (i.e., errors in the equilibrium calculations), they hadgreater influence on the standard deviations. When slightcumulative increases in the variability of the strain gaugereadings was introduced, standard deviations for the corre-sponding moment equilibrium sums increased by upwardof a factor of 10 from initial values. This indicates thatequilibrium was sensitive to slight variations in strain gauge

The role of computer models in full-scale bridge laboratory tests 441
Table 3Cross-frame strain gauge means and standard deviations, ES1-3
Gauge ID Mean(µε) Standard deviation (µε) Gauge ID Mean (µε) Standard deviation(µε)
S-1L-U1-T −14.15 1.28 S-1R-U1-T −41.45 0.90S-1L-U1-E −223.24 1.49 S-1R-U1-E 199.82 0.52S-1L-U1-B 28.64 0.83 S-1R-U1-B −20.05 0.76S-1L-U1-W 214.65 1.04 S-1R-U1-W −226.10 0.52S-1L-M2-T −47.51 0.90 S-1R-M2-T −38.08 0.52S-1L-M2-E −707.96 1.04 S-1R-M2-E 659.78 0.83S-1L-M2-B −1.18 0.76 S-1R-M2-B 0.17 0.41S-1L-M2-W 561.55 1.53 S-1R-M2-W −705.94 0.83S-1L-L2-T 24.94 0.83 S-1R-L2-T −3.37 1.22S-1L-L2-E 180.44 0.55 S-1R-L2-E −21.90 0.83S-1L-L2-B 82.22 1.22 S-1R-L2-B 91.65 0.52S-1L-L2-W −64.36 1.04 S-1R-L2-W 181.96 0.90
Table 4Moment equilibrium means and standard deviations, G1 equilibrium, ES1-3
Equilibriumsummation mean Equilibrium summation
Component MC simulation (kN · m) standard deviation (kN · m)
Mx Raw data 91.3 6.4Strain gauge std. dev. = 5 µε 91.1 18.3Strain gauge std. dev. = 10 µε 90.8 36.6Strain gauge std. dev. = 20 µε 90.1 73.3
My Raw data 44.1 19.7Strain gauge std. dev. = 5 µε 43.1 53.5Strain gauge std. dev. = 10 µε 41.6 106.9Strain gauge std. dev. = 20 µε 38.5 213.9
Mz Raw data −28.7 1.0Strain gauge std. dev. = 5 µε −28.7 2.6Strain gauge std. dev. = 10 µε −28.7 5.2Strain gauge std. dev. = 20 µε −28.6 10.4
readings. The moment components that exhibited the largestincreases in standard deviations, moments about the x and y
axes, were those which were influenced the most by cross-frame member forces (due to the member orientations) andby the moment arm through which those forces acted.
7 CONCLUSIONS
The role of computers during design and preliminary test-ing phases of the Curved Steel Bridge Research Project(CSBRP) is summarized. The CSBRP was instituted tostudy the behavior of full-scale curved steel bridge I-girdersin a testing system that produced realistic load and bound-ary conditions.Finite-element analysis was an important part of the
experimental bridge system’s iterative design process.A number of preliminary finite-element models were
assembled in ABAQUS and were used to examine proto-type testing systems to determine if desired behavior wasachieved. These analyses helped determine that a simplysupported three-girder system would provide the best sim-ulation of actual full-scale curved I-girder behavior in theprescribed restraints of the laboratory used for testing. Italso would provide a level of redundancy and safety thatsimilarly sized single- and twin-girder systems could not.28
The first evaluations of the accuracy of finite-elementmodels used during the design phase occurred when aseries of tests of the selected experimental structure, a sim-ply supported three-girder system, was performed whileit was being constructed. The tests involved various sub-assemblies of the final structure and examined the behav-ior of each system elastically as intermediate shoring wasremoved and replaced. Comparisons between analyticalpredictions fromABAQUS and laboratory data occurred for

442 D. G. Linzell
five of the tests: ES1-4, ES1-6, ES2-1, ES2-2, and ES3-1.Support reactions and midspan displacements, girder flangeand web strains, and axial forces developed in individualcross-frame members were examined. These studies indi-cated that
• The detailed finite-element models gave good predictionsof elastic behavior, given the size of the systems thatwere tested and their high levels of redundancy.
• Zero shifts, caused by heating of instruments and cir-cuitry prior to testing, and locked-in forces introducedduring construction that could not be quantified were thepredominant causes of errors observed between the com-puter predictions and data.
• Replacing nominal geometric and material propertieswith measured properties offered little improvement inanalytical predictions.
Additional comparisons between experimental and ana-lytical results were made when girder midspan momentsand cross-frame member axial forces produced during testES3-1 were compared with analytical predictions fromABAQUS models and from the V-load method. These com-parisons indicated that the V-load method gave conservativepredictions for G3 midspan moments and nonconservativepredictions of G1 midspan moments, whereas the finite-element model gave conservative predictions of both G3and G1 moments.Computer simulations also were used to assess the sen-
sitivity of equilibrium evaluations of the construction teststo changes in instrument readings. Monte Carlo simu-lations, run using commercially available software, wereused to study the cumulative influence of instrument res-olution variability on equilibrium results. These studiesindicated that both force and moment equilibria weresensitive to small cumulative changes in readings suppliedby resistance strain gauges affixed to cross-frame members(±5µε). These cumulative changes could result from usingdata acquisition systems with varying resolution levels toacquire data or from unwanted electrical noise being intro-duced into these systems during testing.
ACKNOWLEDGMENTS
This work was supported for the Georgia Institute ofTechnology by HDR Engineering through FHWA underContract No. DTFH61-92-C-00136. Sheila Duwadi servesas the Contracting Officer’s Technical Representative forFHWA. The assistance of Jim Burrell of Qualcomm, Inc.,with preparation of this manuscript is greatly appreciated.In addition, the advice of Dr. Abdul-Hamid Zureick andDr. Roberto Leon at the Georgia Institute of Technologyhas been invaluable for completing this research. The assis-tance of Bill Wright of FHWA, Joey Hartmann of Profes-sional Service Industries, Inc., Dann Hall and Mike Grubbof BSDI, and John Yadlosky of HDR is appreciated.
REFERENCES
1. American Association of State Highway and Transporta-tion Officials, Guide Specifications for Horizontally CurvedBridges, Washington, 1980, 1993.
2. American Institute of Steel Construction, Highway Struc-tures Design Handbook, Vol. I, Chap. 12: V-Load Analysis,Chicago, IL, 1996.
3. Arizumi, Y., Hamada, S. & Oshiro, T., Static behavior ofcurved composite box girders, Transactions of the JapaneseSociety of Civil Engineers, 15 (1983), 212–6.
4. Brennan, P. J., Horizontally curved bridges first annualreport: Analysis of horizontally curved bridges through three-dimensional mathematical model and small scale structuraltesting, Syracuse University, First Annual Report, ResearchProject HPR-2(111), November 1970.
5. Brennan, P. J., Horizontally curved bridges second annualreport: Analysis of Seekonk River Bridge small scale struc-ture through three-dimensional mathematical model and smallscale structural testing, Syracuse University, Second AnnualReport, Research Project HPR-2(111), November 1971.
6. Brennan, P. J., Analysis and structural testing of a multi-ple configuration small scale horizontally curved highwaybridge, Syracuse University, Research Project HPR-2(111),December 1974.
7. Brennan, P. J., Antoni, C. M., Leininger, R. & Mandel, J. A.,Analysis for stress and deformation of a horizontally curvedbridge through a geometric structural model, Syracuse Uni-versity Department of Civil Eng., Special Research ReportNo. SR-3, August 1970.
8. Brennan, P. J. & Mandel, J. A., Multiple configuration curvedbridge model studies, ASCE Journal of the Structural Divi-sion, 105 (ST5) (1979), 875–90.
9. Culver, C. G. & Christiano, P. P., Static model tests of curvedgirder bridge, ASCE Journal of the Structural Division, 95(ST8) (1969), 1599–1614.
10. Fam, A. R. & Turkstra, C., Model study of horizontallycurved box girder, ASCE Journal of the Structural Division,102 (ST5) (1976), 1097–1108.
11. Fiechtl, A. L., Fenves, G. L. & Frank, K. H., Approximateanalysis of horizontally curved girder bridges, Texas Univer-sity, Austin, Center for Transportation Research, Final ReportNo. FHWA-TX-91-360-2F, November 1987.
12. Fukumoto, Y. & Nishida, S., Ultimate load behavior of curvedI-beams, ASCE Journal of the Engineering Mechanics Divi-sion, 107 (EM2) (1981), 367–84.
13. Galambos, T. V., Hajjar, J. F., Leon, R. T., Huang, W., Pulver,B. E. & Rudie, B. J., Stresses in steel curved girder bridges,Minnesota Department of Transportation Report No. MN/RC-96/28, August 1996.
14. Hajjar, J. F. & Boyer, T. A., Live load stresses in steel curvedgirder bridges, Progress Report on Task 1 for MinnesotaDepartment of Transportation Project 74708, December 1997.
15. Hanshin Expressway Public Corporation, Guidelines for thedesign of horizontally curved girder bridges (draft), 1988.
16. Hibbitt, Karlsson & Sorenson, Inc., Introduction toABAQUS/Pre, Version 5.8, Pawtucket, RI, 1998.
17. Hibbitt, Karlsson & Sorenson, Inc., ABAQUS/Post Manual,Version 5.8, Pawtucket, RI, 1998.
The role of computer models in full-scale bridge laboratory tests 443
18. Hibbitt, Karlsson & Sorenson, Inc., ABAQUS/Standard User’sManual, Version 5.8, (1–3), Pawtucket, RI, 1998.
19. Linzell, D. G., Studies of a full-scale horizontally curvedsteel I-girder bridge system under self-weight, Ph.D. disserta-tion, School of Civil and Environmental Engineering, GeorgiaInstitute of Technology, 1999.
20. MacNeal-Schwendler Corporation, MSC/PATRAN UsersManual, Los Angeles, CA, 1998.
21. Mozer, J., Cook, J. & Culver, C., Horizontally curved high-way bridges: Stability of curved plate girders, CarnegieMellon University Report No. P3, Research Project HPR-2(111), January 1973.
22. Pulver, B. E., Measured stresses in a steel curved bridge sys-tem, M.C.E. Report, Department of Civil Engineering, Uni-versity of Minnesota, 1996.
23. Sennah, K. & Kennedy, J. B., Shear distribution in simply-supported curved composite cellular bridges, ASCE Journalof Bridge Engineering, 3 (2) (19xx), 47–55.
24. Shanmugam, N. E., Thevendran, J. Y., Liew, R., Tan, L. O.,Experimental study on steel beams curved in plan, ASCEJournal of Structural Engineering, 121 (2) (1995), 249–59.
25. Thevendran, J. Y., Shanmugam, N. E. & Liew, R., Flex-ural torsional behavior of steel I-beams curved in plan,Journal of Constructional Steel Research, 46 (1–3), (1998),79–80.
26. Vanguard Software Corporation, DecisionPro for Windows,version 3.0.4, demonstration version, Cary, NC, 1998.
27. Yoo, C. H. & Carbine, R. L., Experimental and analyticalstudy of horizontally curved steel wide flanged beams, in Pro-ceedings, Structural Stability Research Council Annual Tech-nical Session: Stability of Plate Structures, Washington, 1985,pp. 131–43.
28. Zureick, A., Linzell, D., Leon, R. T. & Burrell, J., Curvedsteel I-girder bridges: Experimental and analytical studies,Engineering Structures, 22 (2) (2000), 180–90.
29. Zureick, A. & Naqib, R., Horizontally curved steel I-girderstate-of-the-art analysis methods, ASCE Journal of BridgeEngineering, 4 (1), (1999), 38–47.
30. Zureick, A., Naqib, R. &Yadlosky, J. M., Curved steel bridgeresearch project, interim report I: Synthesis, HDR Engi-neering, Inc., Publication No. FHWA-RD-93-129, December1994.


![Industrial to POTW application [application]](https://img.pdfslide.net/doc/110x75/616d79a1f91810718d431e10/industrial-to-potw-application-application.jpg)