Embed Size (px)
Citation preview
EPTD DISCUSSION PAPER NO. 58
Environment and Production Technology Division
International Food Policy Research Institute 2033 K Street, N.W.
Washington, D.C. 20006 U.S.A.
March 2000 EPTD Discussion Papers contain preliminary material and research results, and are circulated prior to a full peer review in order to stimulate discussion and critical comment. It is expected that most Discussion Papers will eventually be published in some other form, and that their content may also be revised.
INDUSTRIALIZATION, URBANIZATION, AND LAND USE IN CHINA
Xiaobo Zhang, Tim D. Mount and Richard N. Boisvert
ABSTRACT
Rapid industrial development and urbanization transfer more and more land away
from agricultural production, threatening China’s capability to feed itself. This paper
analyzes the determinants of land use by modeling arable land and sown area separately.
An inverse U-shaped relationship between land use intensity and industrialization is
explored both theoretically and empirically. The findings highlight the conflict between
the two policy goals of industrialization and grain self-sufficiency in the end. Several
policy recommendations are offered to reconcile the conflict.
i
CONTENTS
1. Introduction..................................................................................................................... 1
2. An Historical Review of China’s Agricultural Land Use............................................ 3 Land Reforms (1949-1955) ........................................................................................... 4 Great Leap Forward and the Great Famine (1956-1961)............................................. 5 Pre-Reform (1962-1978)................................................................................................ 8 Rural Reform (1979-1985) ............................................................................................ 9 Post-Rural Reform (1986-1997).................................................................................. 10
3. Conceptual framework................................................................................................. 13
4. Results........................................................................................................................... 19
5. Conclusions and Policy Implications .......................................................................... 28 Appendix: Data Sources........................................................................................................ 30
References .............................................................................................................................. 33
Industrialization, Urbanization, and Land Use in China
Xiaobo Zhang, Tim D. Mount and Richard N. Boisvert*
1. INTRODUCTION
Land scarcity has become an increasingly important issue in China. Because of
rapid industrial development and population growth, the land base for agricultural
production has been shrinking steadily. Since 1952, more than 13 million hectares of
arable land have been lost. 1 With the growing population and only about 7 percent of the
world’s arable land, some Malthusians, such as Brown (1995), have questioned China’s
capacity to feed its 1.25 billion people over the long haul. Despite these persistent
pessimistic forecasts by the Malthusians, China has been rather successful in maintaining
grain self-sufficiency over the past two decades.
One factor that Malthusians fail to consider is the increase in land use intensity.2
In contrast to the decline of arable land, the sown area, a product of arable land area and
*Xiaobo Zhang is Postdoctoral Research Fellow at IPFRI. Tim D. Mount and
Richard N. Boisvert are professors at the Department of Agricultural, Resource, and Managerial Economics at Cornell University. We are grateful to Shenggen Fan and Peter Hazell for helpful comments.
1 Arable land area and cultivated area are often used interchangeably. Sown area or cropping area is equal to the multiplication of arable land area and multiple-cropping index. It has been noted that the official arable land area might be under-reported (P. 368, SSB, 1997; Ash and Edmonds, 1998; Smil, 1999). In spite of the shortcomings of the official statistics, they are the only source for land stock at the provincial level that are readily available and consistently compiled. The trends of land use may not be severely affected by this problem considering that most under-reporting of arable land occurred in hilly and mountainous regions (Ash and Edmonds, 1998).
2 For instance, Brown (1995) predicted a decline in both arable land and multiplying cropping.
2
the multiple-cropping index, has increased by more than 13 million hectares since 1952.
As the total grain output is more related to the total sown area rather than the total arable
land area, unrealistic predictions will result from ignoring the role of increased multiple
cropping. Therefore, understanding the driving forces behind the growth in sown area is
crucial for analyzing China’s future grain production and trade situation. The question is:
can China sustain the upward trend of sown area in the long run by continuingly
offsetting the farmland loss with increasing intensity?
To address this question, an analytical framework based on policy and historical
details is developed in this paper. Compared with previous studies on China’s land use,
this study has at least two unique features. First, land intensity is modeled separately
from arable land area. Most previous studies (Heilig, 1997; Li and Sun, 1997; Fischer,
Chen, and Sun, 1998) have just focused on arable land area, thus understating China’s
grain production capacity. In China, local governments have much authority to procure
land for non-agriculture use, whereas the central government responds to the overall food
situation by setting policy guidelines for local governments and farmers. Since land is
nominally owned by the collective, individual farm, households are not allowed to convert their
land to non-agriculture use, but they do have the right to cultivate their land and use multiple
cropping. Therefore, it is sensible to model the different decision processes separately.
Second, using a thirty-three year (1965-97) panel data set at the provincial level,
we can quantify the driving forces behind the changes in arable land and land use
intensity. This is an improvement over previous studies on land use, which generally are
qualitative or just based on time series data (Brown, 1995; Heilig, 1997; Zhang, Huang,
3
and Rozelle, 1997; Ash and Edmonds, 1998). Using the panel data set, we can also study
the interplay between governments and farmers.
The paper is organized as follows. We provide a historical review of Chinese
agricultural land use policy in section 2. Then, we develop an analytical framework to
model arable land area and land intensity in Section 3. Section 4 presents the
econometric results based on a panel data set. The conclusions and policy implications
are provided in Section 5. A detailed description of the data is presented in the appendix.
2. AN HISTORICAL REVIEW OF CHINA’S AGRICULTURAL LAND USE
Arable land area per capita in China is now less than 0.08 hectare (SSB, 1998),
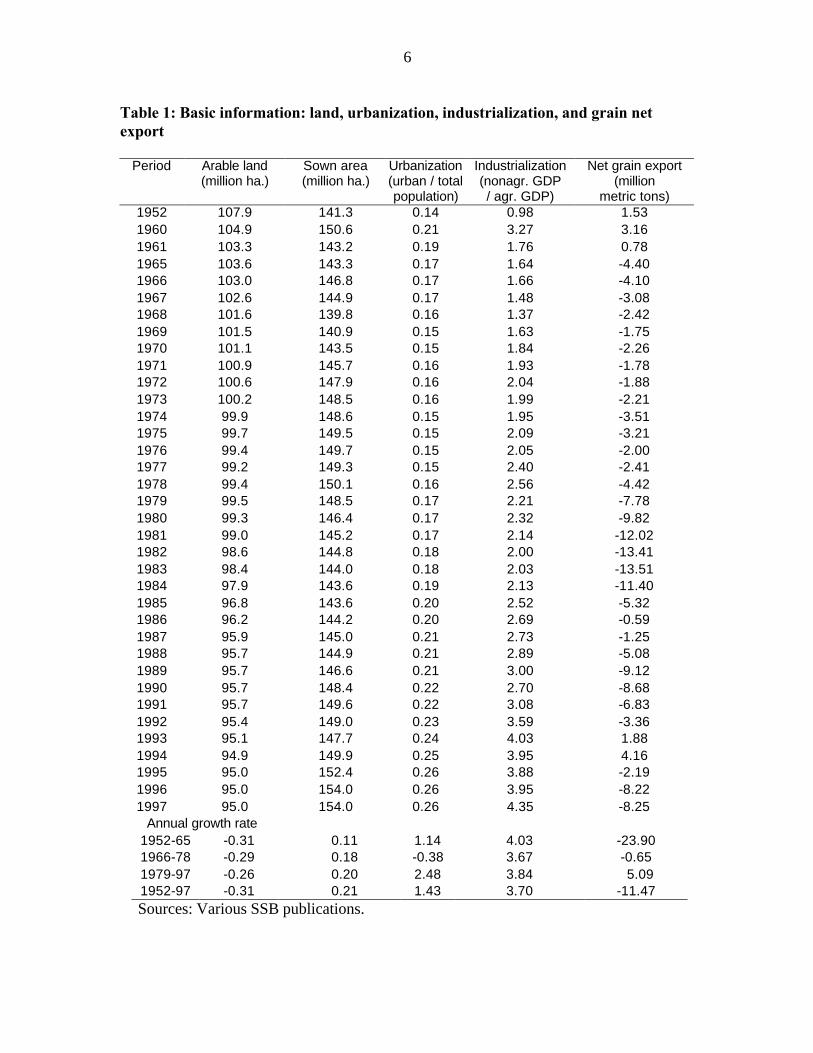
which ranks among the lowest in the world. Table 1 presents the basic information about
land use (arable land and sown area), industrialization, urbanization, and grain trade
balance. The time paths for these variables are also plotted in Figure 1.
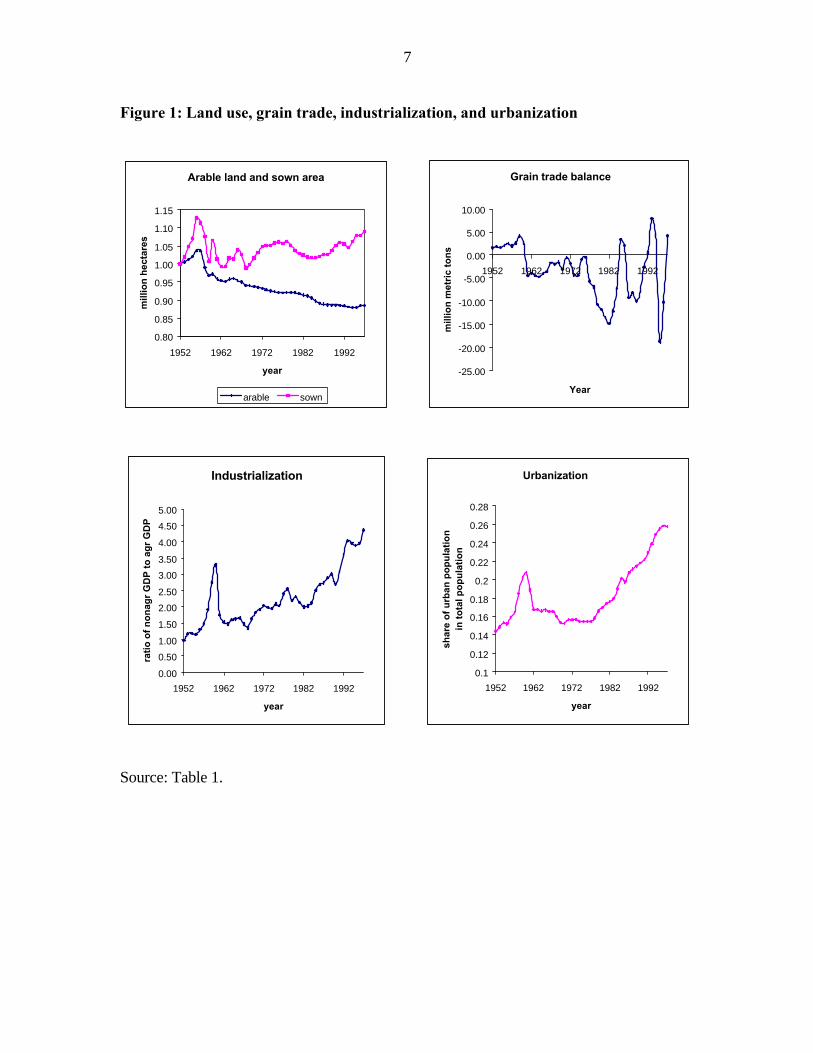
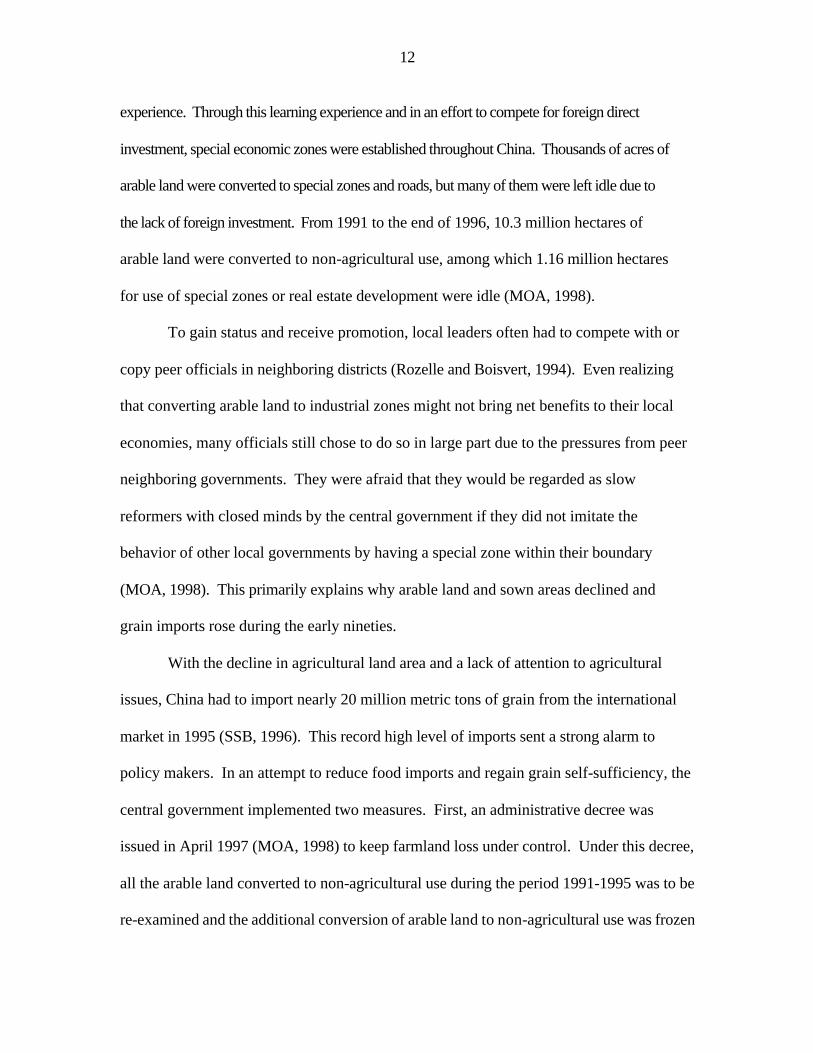
Three features are apparent from Figure 1. First, it appears that there is a negative
relationship between arable land area and industrialization and urbanization. During the
period 1952-1997, the arable land area declined by 12 percent, from 108 million hectares
to 95 million hectares, while population more than doubled, from less than 0.6 billion to
more than 1.2 billion. The ratio of non-agricultural GDP to agricultural GDP, an
indicator of industrialization, increased four fold and the share of urban population rose
from 14 percent to about 26 percent. It appears that industrialization and urbanization are
among the most important factors explaining the decline of China’s agricultural land use.
Second, despite hunger and malnutrition in the pre-reform period and the
subsequent decline in the arable land area, China has still been quite successful in turning
4
its food situation around; the ratio of net grain imports to total grain production has
fluctuated within a narrow range, from 4.2 percent to -2.5 percent (SSB, 1998). Figure 1
shows that the sown area increased by about 9 percent from 1952 to 1997. Grain yields
rose by 177 percent during the same period (SSB, 1998). The multiple-cropping index
(calculated by the authors using the sown and arable areas) increased from 1.3 in 1952 to 1.6 in
1997, indicating that land is being more intensively cultivated. Clearly, the increase in grain
production stems largely from the rise in multiple-cropping practices as well as higher yields.
Third, it seems that the cycles in the grain trade balance are related to fluctuations
in the sown area. Tang (1984) observed that Chinese agriculture had been marked by
persistent cycles in response to the central government’s policies. However, it is not
clear how various factors play out by just looking at figure 1. To gain a better
understanding of the observed trends, it is necessary to review the history of China’s
development and agricultural policies.
LAND REFORMS (1949-1955)
Following the establishment of the People’s Republic of China in 1949, the state
confiscated land from landlords and distributed it equally to peasants in order to improve
both equity and efficiency. At that time, China faced a hostile international environment
with political isolation and economic embargos. The political leaders adopted two
important development strategies—the prioritization of heavy industrial development to
catch up with developed western countries and a grain self-sufficiency policy to lessen its
reliance on international markets (Lin, Cai, and Li, 1996). However, these two policies
were not complementary over time.
5
GREAT LEAP FORWARD AND THE GREAT FAMINE (1956-1961)
With net grain exports continuing to rise during this period, the focus of national
policy shifted from agricultural to industrial development. Chairman Mao thought it
would be impossible to catch up with advanced western economies without an industrial
revolution. Therefore, the “Great Leap Forward” was called to boost steel and other
heavy industrial output at the expense of agricultural production. The ratio of industrial
GDP to agricultural GDP rose three-fold in four years, from 0.63 in 1956 to 1.9 in 1960.
There was an accompanying sharp decline in arable land and sown area as land and labor
were diverted away from agricultural production. The sharp decline in the agricultural land
base together with the collectivization movement resulted in a serious food shortage, triggering
the greatest famine in human history (Lin, 1990). During the early sixties, China had to import
as much as four million metric tons of grain, although it hesitated to do so initially.
6
Table 1: Basic information: land, urbanization, industrialization, and grain net export
Period Arable land (million ha.)
Sown area (million ha.)
Urbanization (urban / total population)
Industrialization (nonagr. GDP / agr. GDP)
Net grain export (million
metric tons) 1952 107.9 141.3 0.14 0.98 1.53 1960 104.9 150.6 0.21 3.27 3.16 1961 103.3 143.2 0.19 1.76 0.78 1965 103.6 143.3 0.17 1.64 -4.40 1966 103.0 146.8 0.17 1.66 -4.10 1967 102.6 144.9 0.17 1.48 -3.08 1968 101.6 139.8 0.16 1.37 -2.42 1969 101.5 140.9 0.15 1.63 -1.75 1970 101.1 143.5 0.15 1.84 -2.26 1971 100.9 145.7 0.16 1.93 -1.78 1972 100.6 147.9 0.16 2.04 -1.88 1973 100.2 148.5 0.16 1.99 -2.21 1974 99.9 148.6 0.15 1.95 -3.51 1975 99.7 149.5 0.15 2.09 -3.21 1976 99.4 149.7 0.15 2.05 -2.00 1977 99.2 149.3 0.15 2.40 -2.41 1978 99.4 150.1 0.16 2.56 -4.42 1979 99.5 148.5 0.17 2.21 -7.78 1980 99.3 146.4 0.17 2.32 -9.82 1981 99.0 145.2 0.17 2.14 -12.02 1982 98.6 144.8 0.18 2.00 -13.41 1983 98.4 144.0 0.18 2.03 -13.51 1984 97.9 143.6 0.19 2.13 -11.40 1985 96.8 143.6 0.20 2.52 -5.32 1986 96.2 144.2 0.20 2.69 -0.59 1987 95.9 145.0 0.21 2.73 -1.25 1988 95.7 144.9 0.21 2.89 -5.08 1989 95.7 146.6 0.21 3.00 -9.12 1990 95.7 148.4 0.22 2.70 -8.68 1991 95.7 149.6 0.22 3.08 -6.83 1992 95.4 149.0 0.23 3.59 -3.36 1993 95.1 147.7 0.24 4.03 1.88 1994 94.9 149.9 0.25 3.95 4.16 1995 95.0 152.4 0.26 3.88 -2.19 1996 95.0 154.0 0.26 3.95 -8.22 1997 95.0 154.0 0.26 4.35 -8.25
Annual growth rate 1952-65 -0.31 0.11 1.14 4.03 -23.90 1966-78 -0.29 0.18 -0.38 3.67 -0.65 1979-97 -0.26 0.20 2.48 3.84 5.09 1952-97 -0.31 0.21 1.43 3.70 -11.47 Sources: Various SSB publications.
7
Figure 1: Land use, grain trade, industrialization, and urbanization
Source: Table 1.
Arable land and sown area
0.80
0.85
0.90
0.95
1.00
1.05
1.10
1.15
1952 1962 1972 1982 1992
year
mill
ion
hec
tare
s
arable sown
Urbanization
0.1
0.12
0.14
0.16
0.18
0.2
0.22
0.24
0.26
0.28
1952 1962 1972 1982 1992
year
shar
e o
f u
rban
po
pu
lati
on
in t
ota
l po
pu
lati
on
Grain trade balance
-25.00
-20.00
-15.00
-10.00
-5.00
0.00
5.00
10.00
1952 1962 1972 1982 1992
Year
mill
ion
met
ric
ton
s
Industrialization
0.00
0.50
1.00
1.50
2.00
2.50
3.00
3.50
4.00
4.50
5.00
1952 1962 1972 1982 1992
year
rati
o o
f n
on
agr
GD
P t
o a
gr
GD
P
8
PRE-REFORM (1962-1978)
In reaction to the great famine and the increasing reliance on international grain
markets, the central government was forced to reconsider its industrialization policy.
Grain self-sufficiency emerged as a priority theme of governmental policy. The slogan,
“Yi Liang Wei Gang, Gang Ju Mu Zhang” (Food must be taken as a core; once it is
grasped, everything falls into place) reflected the spirit of this policy. One way to
reconcile the conflict between the two policies was to reduce the urban population and
increase the rural population. In the years between 1961 and 1964, 20 million state
workers and 17 million urban high school students were sent to the countryside for “re-
education” by participating in agricultural production (Selden, 1992). Furthermore, the
“household register system”, in conjunction with elaborate rationing mechanisms, made
migration from rural to urban areas virtually impossible (Chan, 1995). Hence, the share
of the urban population kept dwindling until the late 1970s, which kept the demand for
land for non-agricultural purposes under control.
By the early 1970s, the potential for boosting sown area through reductions of the
urban population was almost exhausted. Therefore, from the early 1970s, all collectives
were mobilized to learn from Da Zhai (a model village in Shanxi province) how to claim
more land from marginal areas such as hillsides and lakes (Selden, 1992). During the
sixties and seventies, grain self-sufficiency was barely achieved, primarily through
keeping a large base of rural population and by cultivating more marginal land. The
share of grain imports relative to total grain production was controlled at a level of less
than 4 percent during this pre-reform period.
9
RURAL REFORM (1979-1985)
With the end of the Cultural Revolution, the Chinese economy was on the verge
of collapse. The potential for increasing grain production through developing more
marginal land and increasing land utilization under the old collective system was
nearly exhausted. By the late seventies, China had to import as much as 10 million
metric tons of grain from the world market. In response to the agricultural crisis, the
government started to give more flexibility in decision making to individual
household producers by officially promoting the household responsibility system
nationwide. This idea originated from farmers in Anhui Province and by the end of
1983, 98 percent of villages had adopted the household responsibility system (Lin,
1992). Alongside the reform, the role of state interventions on acreage plans was
greatly reduced. Alternatively, to control agricultural land use and boost food
production, the government fostered market-oriented strategies, such as increasing
procurement prices for grain and other crops. These reforms greatly enhanced
farmers’ incentives to allocate their inputs more efficiently and adopt more profitable
technologies (Lin, 1991, 1992; Fan and Pardey, 1997). Thanks to the success of rural
reform, agricultural output and grain production (measured at constant prices) grew 7.4
percent and 4.8 percent annually from 1978 to 1984, respectively (SSB, 1998). Because
of the rapid agricultural growth, the share of agricultural GDP in total GDP increased
from 0.28 to 0.32 during this period. Although there was little change in sown area
during this period, a spectacular growth in agricultural output was generated.
10
POST-RURAL REFORM (1986-1997)
The rural reforms released a large amount of labor and provided a base for
industrial development. Since the mid-eighties, the town and village enterprises (TVEs)
in rural areas have experienced a phenomenal growth, making it possible to absorb much
of the surplus labor in rural areas. Developing rural industry became a major objective
for many local governments (Rozelle and Boisvert, 1995).
However, the development of the TVEs has not been distributed evenly. The
TVEs developed much more rapidly in coastal provinces than in inland provinces largely
because coastal areas had better access to capital and new technologies. Meanwhile,
localized migration from rural areas to nearby towns was much easier although many
institutional barriers still existed for cross-regional migration (Kanbur and Zhang, 1999).
As a result, the industrialization level in coastal provinces was of a different magnitude
from that in inland provinces. In many of the industrialized coastal provinces, farmers
faced more opportunities for higher pay from non-farm work. Thus, farmers had less
incentive to continue intensive cropping. Accordingly, the multiple-cropping index for
many coastal provinces, such as Jiangsu Province, began to decrease from their historical
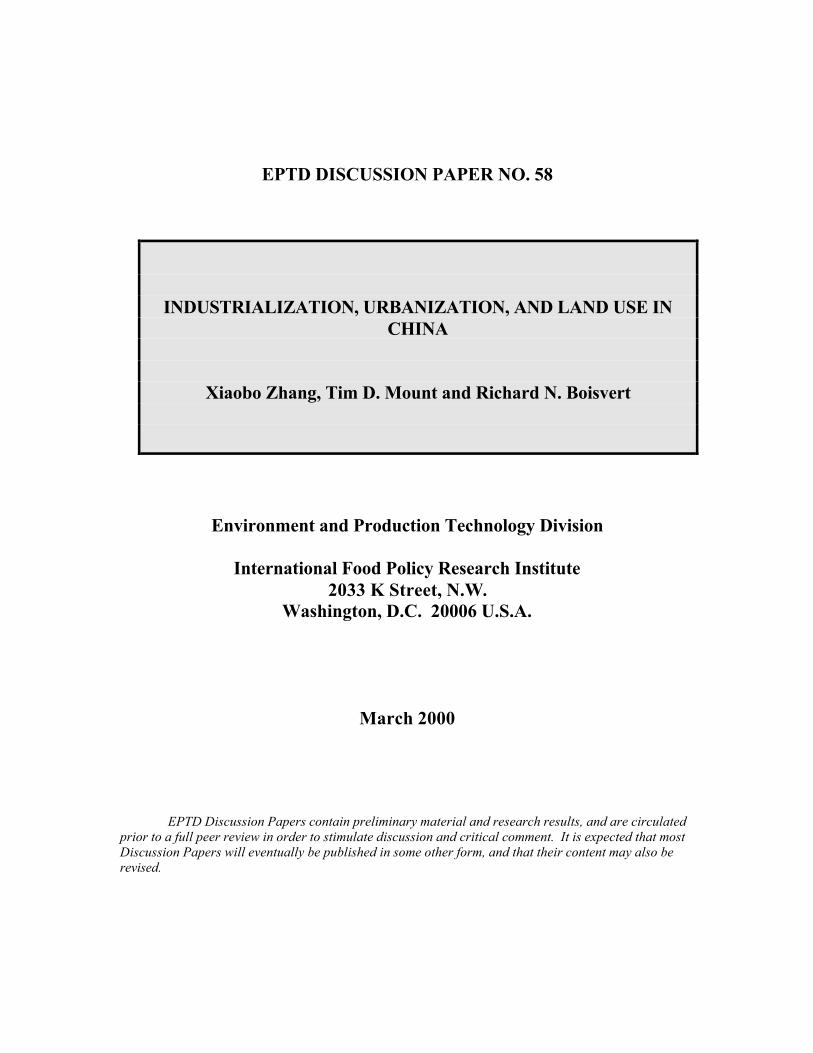
highs of the late 1980s (see Figure 2).
11
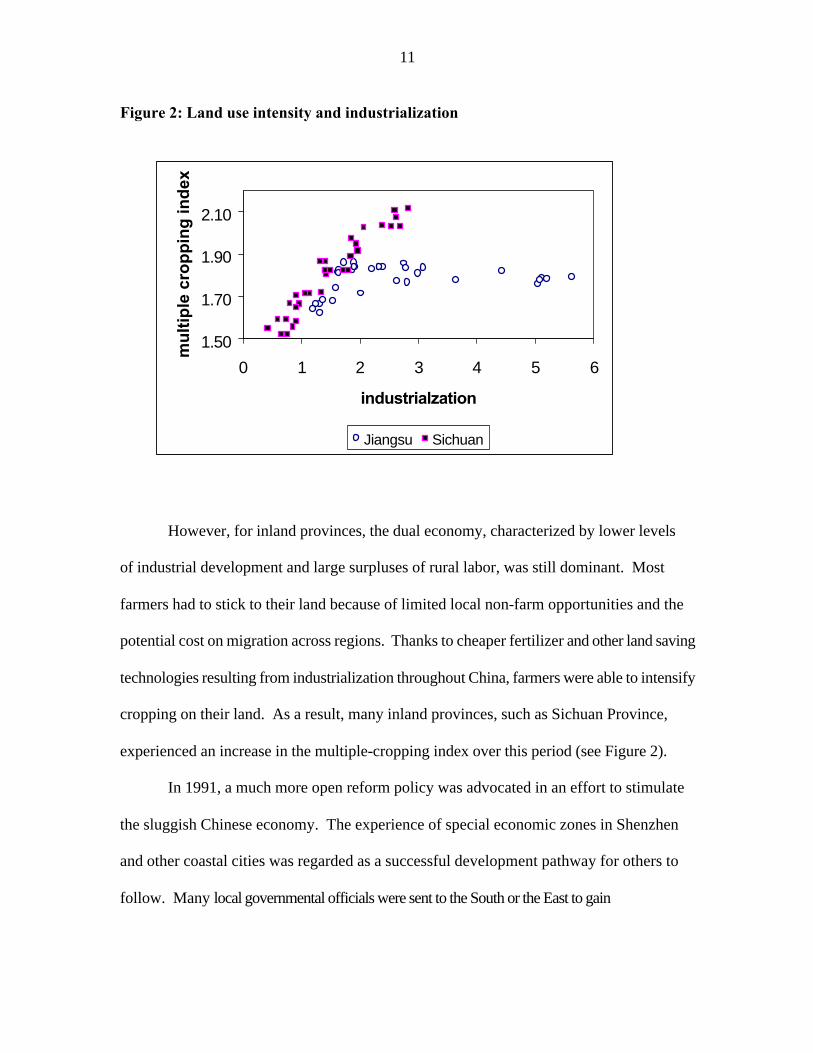
Figure 2: Land use intensity and industrialization
However, for inland provinces, the dual economy, characterized by lower levels
of industrial development and large surpluses of rural labor, was still dominant. Most
farmers had to stick to their land because of limited local non-farm opportunities and the
potential cost on migration across regions. Thanks to cheaper fertilizer and other land saving
technologies resulting from industrialization throughout China, farmers were able to intensify
cropping on their land. As a result, many inland provinces, such as Sichuan Province,
experienced an increase in the multiple-cropping index over this period (see Figure 2).
In 1991, a much more open reform policy was advocated in an effort to stimulate
the sluggish Chinese economy. The experience of special economic zones in Shenzhen
and other coastal cities was regarded as a successful development pathway for others to
follow. Many local governmental officials were sent to the South or the East to gain
1.50
1.70
1.90
2.10
0 1 2 3 4 5 6
industrialzation
mu
ltip
le c
rop
pin
g in
dex
Jiangsu Sichuan
12
experience. Through this learning experience and in an effort to compete for foreign direct
investment, special economic zones were established throughout China. Thousands of acres of
arable land were converted to special zones and roads, but many of them were left idle due to
the lack of foreign investment. From 1991 to the end of 1996, 10.3 million hectares of
arable land were converted to non-agricultural use, among which 1.16 million hectares
for use of special zones or real estate development were idle (MOA, 1998).
To gain status and receive promotion, local leaders often had to compete with or
copy peer officials in neighboring districts (Rozelle and Boisvert, 1994). Even realizing
that converting arable land to industrial zones might not bring net benefits to their local
economies, many officials still chose to do so in large part due to the pressures from peer
neighboring governments. They were afraid that they would be regarded as slow
reformers with closed minds by the central government if they did not imitate the
behavior of other local governments by having a special zone within their boundary
(MOA, 1998). This primarily explains why arable land and sown areas declined and
grain imports rose during the early nineties.
With the decline in agricultural land area and a lack of attention to agricultural
issues, China had to import nearly 20 million metric tons of grain from the international
market in 1995 (SSB, 1996). This record high level of imports sent a strong alarm to
policy makers. In an attempt to reduce food imports and regain grain self-sufficiency, the
central government implemented two measures. First, an administrative decree was
issued in April 1997 (MOA, 1998) to keep farmland loss under control. Under this decree,
all the arable land converted to non-agricultural use during the period 1991-1995 was to be
re-examined and the additional conversion of arable land to non-agricultural use was frozen
13
for one year. Second, since provincial governors were required to be responsible for the “Mi
Dai Zi” (rice bag) (Crook, 1997), the national self-sufficiency policy degenerated into a
policy of local self-sufficiency. Mandatory targets for acreage plans were assigned to lower
levels of governments. Because of these efforts, both arable land and sown area were
stabilized and grain imports were reduced.
Our review of the history of China’s agricultural policy reveals that balancing
industrial development, urbanization, and food security has been a persistent challenge
for the central government. From time to time, the government had to adopt mandatory
administrative means to manage the problem. Urbanization and industrialization are
important driving forces behind the conversion of farmland. Nevertheless, the
relationship between industrialization and land intensification is more complicated. Total
grain production depends on total sown area, which in turn, is determined by the
availability of arable land area and the extent of land use intensity.
3. CONCEPTUAL FRAMEWORK
Since arable land area and land use intensity are determined by different actors,
we need to model them separately. In the first step, we present a model of arable land use
for a local government because it has the authority to convert farmland for non-
agricultural use. For simplicity, we assume that the total arable land area is fixed, and the
land can be used for either agriculture or non-agriculture.3
3 Because most of China has already been heavily populated, there is little room
to claim marginal land. Arable land may also be lost due to environmental changes such as soil erosion and salinity (Huang and Rozelle, 1995; Ash and Edmonds, 1998). Because environmental changes are mostly related to population growth, increase in

14
As discussed in the last section, the demand for agricultural land is likely to be
associated with industrialization, urbanization, land use decisions in neighboring regions,
and national policy. Therefore, the arable land function can be expressed as follows:
)è,A,urb,F(indA 1tb
1mt1t1tt −−−−= , (1)
where At is the arable land area in time t; indt-1 refers to the industrialization level at time
t-1, defined as the ratio of non-agricultural GDP to agricultural GDP; urbt-1 is the share of
urban population; bmtA 1− is the land used for agriculture in time t-1 by the local
government which has the highest GDP per capita among all neighboring provinces, and is a
proxy for peer pressure from neighboring provinces; and 1−tθ is the national grain trade
deficit, which we use as a proxy for the overall national policy for land use in year t-14.
Generally, the demand for non-agricultural land use is positively related to
industrialization and urbanization. Because the total endowment of land is fixed, if more land
is used for industrial and urban development, then less land is left for agricultural use.
Therefore, we expect a negative relationship between agricultural land use and industrialization
and urbanization. Since the demand for arable land cannot exceed a region’s natural limit, it is
sensible to model the share of arable land as a logit model so that a prediction based on the
model will not exceed its natural endowment. The model can be written explicitly as:
agricultural inputs, and development of rural enterprises, partly captured by the population and industrialization variables in the model, the environmental variables are not explicitly included in this analysis.
4 Although rapid change in grain trade positions often has an important impact on the tightness of land use policy, other factors may also affect land policy.
15
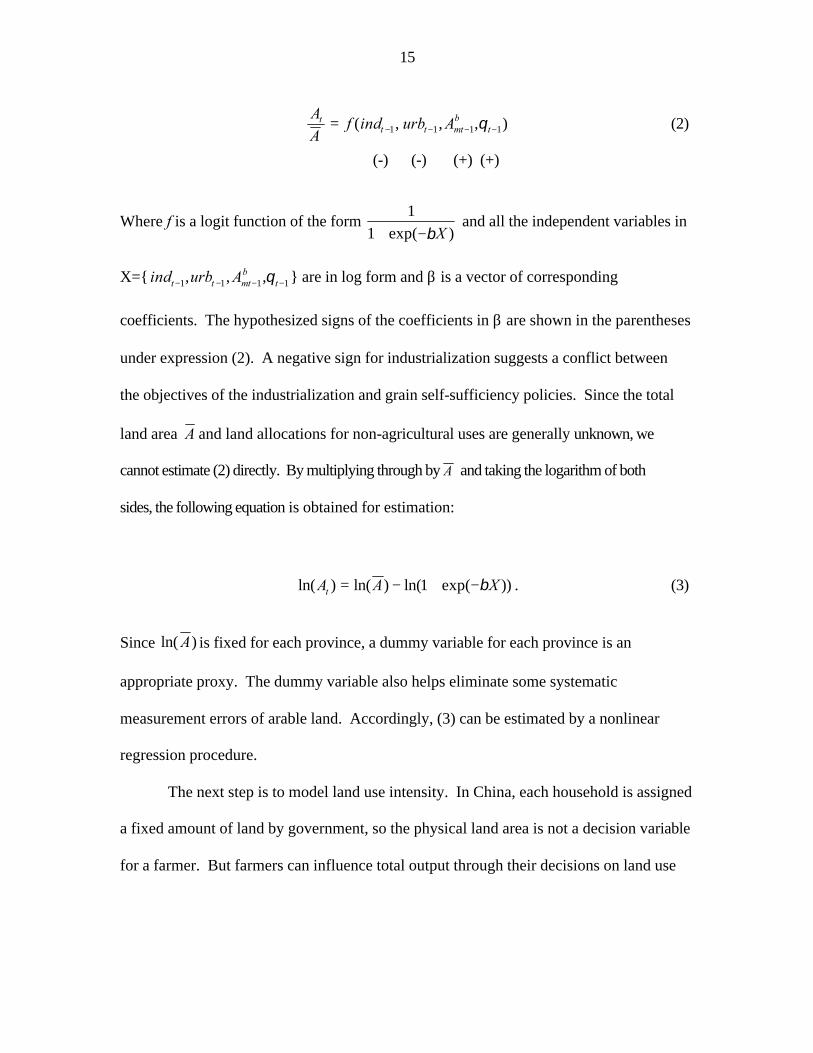
),,,( 1111 −−−−= tbmttt
t AurbindfA
A θ (2)
(-) (-) (+) (+)
Where f is a logit function of the form )exp(1
1
Xβ−+ and all the independent variables in
X={ 1111 ,,, −−−− tbmttt Aurbind θ } are in log form and β is a vector of corresponding
coefficients. The hypothesized signs of the coefficients in β are shown in the parentheses
under expression (2). A negative sign for industrialization suggests a conflict between
the objectives of the industrialization and grain self-sufficiency policies. Since the total
land area A and land allocations for non-agricultural uses are generally unknown, we
cannot estimate (2) directly. By multiplying through by A and taking the logarithm of both
sides, the following equation is obtained for estimation:
))exp(1ln()ln()ln( XAAt β−+−= . (3)
Since )ln( A is fixed for each province, a dummy variable for each province is an
appropriate proxy. The dummy variable also helps eliminate some systematic
measurement errors of arable land. Accordingly, (3) can be estimated by a nonlinear
regression procedure.
The next step is to model land use intensity. In China, each household is assigned
a fixed amount of land by government, so the physical land area is not a decision variable
for a farmer. But farmers can influence total output through their decisions on land use
16
patterns and intensity5. For simplicity, but without loss of generality, we assume each
farmer has one unit of land. Let us further assume that there are only two production
seasons with technologies F1 and F2, respectively, and the price of output is equal to P in
both seasons. Moreover, we assume constant returns to scale in agricultural production.
If farmers do not have a non-farm working opportunity, they would optimize their land
use intensity to maximize the total profit from agricultural production as follows:
Max )()()|()|( 212211 αααπ gcllwlFPlPF −+−Φ+Φ= (4)
{l1, l2, α}
where l1 and l2 are the amount of labor used in the first (major) season and second season
production, respectively; Φ is a vector of public investments such as irrigation and
agricultural research (R&D); α represents the proportion of the land used for cropping in
the second season (1+α can therefore be regarded as a multiple-cropping index); c(α) is
the non-labor cost incurred in second season production (it is assumed to be convex in α);
w stands for the agricultural wage; and g is the annual rate of reduction in non-labor input
costs due to cost-reducing technological change in the industrial sector (an indirect
benefit of industrialization).6 Since we assume that farmers use all their land for
production in the main season, the non-labor cost is fixed for the main season and
therefore it does not appear in (4). The first order conditions for (4) are:
5 For one rationale to separate the area allocations and yield in estimating an
agricultural supply function, see McGuirk and Mundlak (1991). 6 Under the assumption of constant returns to scale for production, the cost
neutrality technology in (4) is equivalent to a profit neutral or Hicks neutral technical change (Chambers, 1988).
17
wlFP =Φ′ )|( 11 (5)
wlFP =Φ′ )|( 22 (6)
)()|( 222 αcgwllPF ′+=Φ (7)
A reduced form solution for the multiple-cropping equation can be expressed as
),,,(ˆˆ gwP Φ= αα . (8)
From (7), we can conduct a standard comparative static analysis for α̂ with respect to w,
Φ , and g:
)ˆ(
ˆ
αα
cg
l
dw
d′′
−= < 0 (9)
( )
)ˆ(
)|(ˆ 22
αα
cg
lFP
d
d′′
Φ∂Φ∂−=
Φ > 0 (10)
)ˆ(
)ˆ(ˆ
ααα
cg
c
dg
d′′
′−= < 0. (11)
Since c is convex, the denominators in (9) and (11) are positive. Therefore, an
increase in the wage lowers the multiple-cropping index, while technical progress in the
industrial sector, represented as a decrease in g, promotes multiple cropping. Since an
increase in public investment generally has a positive impact on production, the
numerator in (10) is positive, implying that pubic investment fosters land use intensity.
18
Unfortunately, we do not have usable data on the technology, wage, and price
variables for empirical analysis. Hence, we develop an argument as to why the rate of
industrialization and urbanization may serve as proxies for wage, price, and the technical
progress coefficient in the empirical specification of the model (10).
In a dual economy, with limited non-farm opportunities and abundant surplus
labor, the agricultural wage is fixed at a subsistence level (Lewis, 1954). With the
expansion of the industrial sector and reductions of surplus labor in the rural sector, the
agricultural wage will eventually be bid up to a higher level. Writing it more formally,
we have:
>>≤
=∂∂
*
*
0
0
indindif
indindif
ind
w (12)
where ind* is the turning point for an economy which becomes industrialized from a
traditional dual economy.
Another consequence of industrialization is that the unit costs of non-labor inputs
generally move downward thanks to technological innovations. This is exactly what
happened to China where the real prices of fertilizer and pesticides have declined but the
quality has increased over the last several decades (SSB, 1998). So, we make the
following legitimate assumption:
.0<∂∂ind
g (13)
19
With the above conditions, we can derive the relationship between multiple
cropping and industrialization,
ind
g
gind
w
wdind
d
∂∂
∂∂
+∂∂
∂∂
=ααα ˆˆˆ
(14)
(-) (0 or +) (-) (-)
The signs of the changes in the arguments on the corresponding variables are shown in
the parentheses. The third and forth parentheses in (14) reveal that industrialization
increases land use intensity by lowering non-labor input costs. When industrialization is
low, represented by surplus labor, the impact of industrialization on the agricultural wage
is zero or negligible. So, the first part of (14) is close to zero. Under this circumstance,
the net effect of industrialization on land use intensity is positive. However, when
industrialization develops to a certain stage, the tighter labor market will put upward
pressure on the agricultural wage rate. When the first part of (14) becomes negative and
dominant, the multiple-cropping index would begin to decline. Overall, the model
suggests an inverse-U shape relationship between land intensity and industrialization.
This is an important hypothesis that can be tested empirically.
4. RESULTS
To test the hypotheses in (2) and (14) empirically, we use a panel data set for the
period 1965 to 1997 for 24 provinces that includes land use, industrialization, and
urbanization. 1965 is the earliest year for which systematic sown area data for each
province are available. After taking a one-year lag for all the independent variables, we
20
have 768 observations in total. A detailed description of the data is provided in the
Appendix.
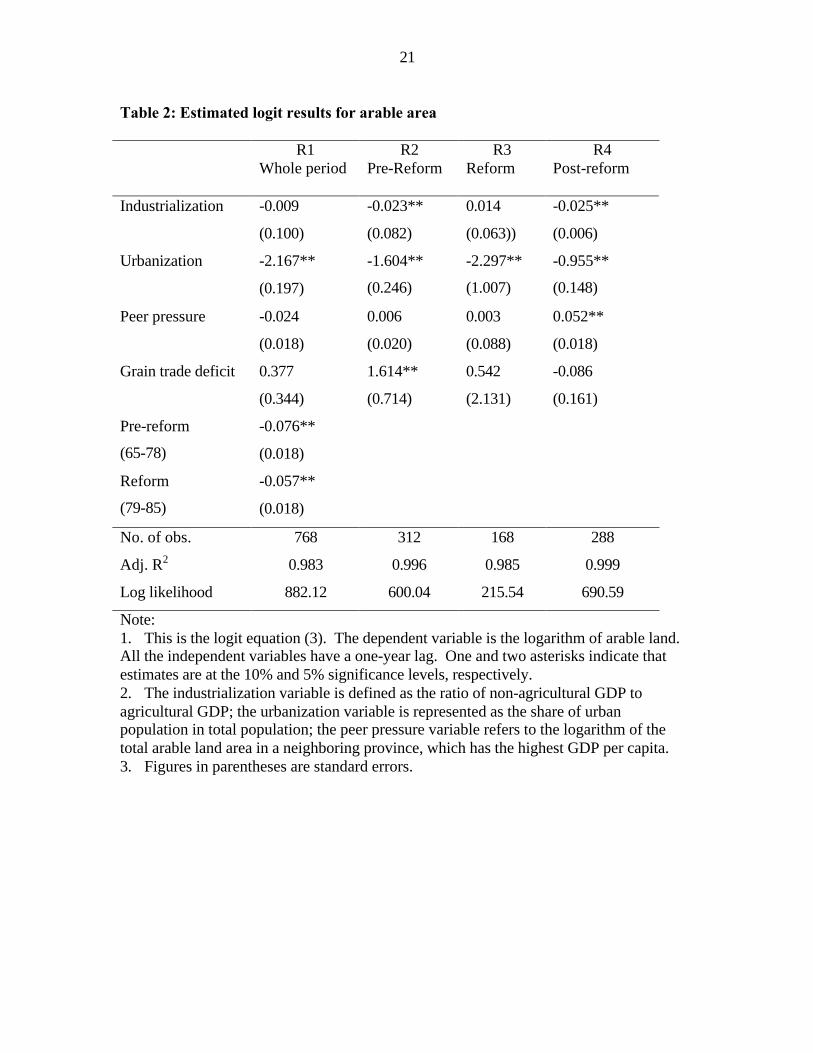
Table 2 reports the estimated logit model for the arable land area (3). Provincial
dummies are used as a proxy for total land A for all the regressions. The first regression
(R1) includes regime dummies and is estimated for the whole period 1965-97. The
negative and statistically significant coefficient on the urbanization variable is consistent
with the predictions of equation (2). This suggests that urbanization has contributed to
the loss of arable land. The regime dummies are significant at the 5% level, indicating
that institutional change may have significant impacts on total arable land area.
However, the coefficients for other variables are insignificant.
21
Table 2: Estimated logit results for arable area R1 R2 R3 R4 Whole period Pre-Reform Reform Post-reform
Industrialization -0.009
(0.100)
-0.023**
(0.082)
0.014
(0.063))
-0.025**
(0.006)
Urbanization -2.167**
(0.197)
-1.604**
(0.246)
-2.297**
(1.007)
-0.955**
(0.148)
Peer pressure -0.024
(0.018)
0.006
(0.020)
0.003
(0.088)
0.052**
(0.018)
Grain trade deficit 0.377
(0.344)
1.614**
(0.714)
0.542
(2.131)
-0.086
(0.161)
Pre-reform
(65-78)
-0.076**
(0.018)
Reform
(79-85)
-0.057**
(0.018)
No. of obs. 768 312 168 288
Adj. R2 0.983 0.996 0.985 0.999
Log likelihood 882.12 600.04 215.54 690.59
Note: 1. This is the logit equation (3). The dependent variable is the logarithm of arable land. All the independent variables have a one-year lag. One and two asterisks indicate that estimates are at the 10% and 5% significance levels, respectively. 2. The industrialization variable is defined as the ratio of non-agricultural GDP to agricultural GDP; the urbanization variable is represented as the share of urban population in total population; the peer pressure variable refers to the logarithm of the total arable land area in a neighboring province, which has the highest GDP per capita. 3. Figures in parentheses are standard errors.
22
To further explore the impact of different regimes associated with institutional
change, we divided the total sample period into three periods: pre-reform (1965-1978),
reform (1979-1985), and post-reform (1986-1997). The model was estimated separately
for each of the three regimes and the results are presented as R2, R3, and R4 in Table 2.
In spite of some difference in their magnitudes, the coefficients for all three regimes are
consistent with each other. Except for the industrialization variable in the reform period
(R3), the coefficients for industrialization and urbanization have significantly negative
signs. The results show that industrialization and urbanization are indeed driving forces
behind the conversion of farmland to non-farm uses. The relatively large value of the
coefficients for the urbanization variable in the pre-reform and reform periods may
illustrate the economic rationale behind the government’s policy of preventing the rural
population from moving to cities and sending thousands of urban youths and cadres to the
countryside. However, with the successful rural reform, agricultural labor productivity
greatly improved, reducing the reliance on a large rural population to cultivate farmland.
The peer pressure is significant at the 5% level only in post-reform period when
local governments became more decentralized. The grain trade deficit only has a positive
and significant impact on arable land area during the pre-reform period when the national
food situation was very tight. Thanks to the rural reform, agricultural production became
more efficient and total grain supply increased. Furthermore, the rapid growth of non-
farm exports provided a large amount of foreign reserves, increasing China’s capability
to buffer year-to-year domestic production fluctuations in grain production.
Next, we model land use intensity and test the curvature of the land use intensity
with respect to industrialization. Specifically, we want to show that the second derivative
23
is negative. Thus, the model needs to include both a linear and quadratic term for
industrialization.7 In order to proxy for the agricultural wage rate, price, and technical
progress variables described in equation (14), we use urbanization and its quadratic term,
and the interaction of industrialization and urbanization variable in our model. In
addition, we add a learning variable to capture the adoption of technologies in
agricultural production (Foster and Rosenzweig, 1995). The learning variable is defined
as the MCI in the neighboring province with the highest GDP per capita. To write it
more explicitly, the multiple-cropping index can be estimated as a function of the
following variables:
)&,,,*,,,,(ˆˆ 22 DRirrigationlearningurbindurburbindindαα = . (15)
Where ind measures industrialization, expressed as the ratio of non-agricultural GDP to
agricultural GDP; urb is the share of urban in total population; irrigation is the share of
irrigated area relative to total arable area; and R&D is the logarithm of total expenditure
on agricultural research. All the variables have a one-year lag.
Table 3 presents the estimated results for seven different specifications. The first
four regressions are for China as a whole and for three regions (North, Central, and
South). Two regime dummies for the pre-reform and reform periods are included in
these regressions. Three more regressions are conducted separately for all China under
the three regimes.
7 Other functional forms, such as inverse function, were also tried and the results
are similar.
24
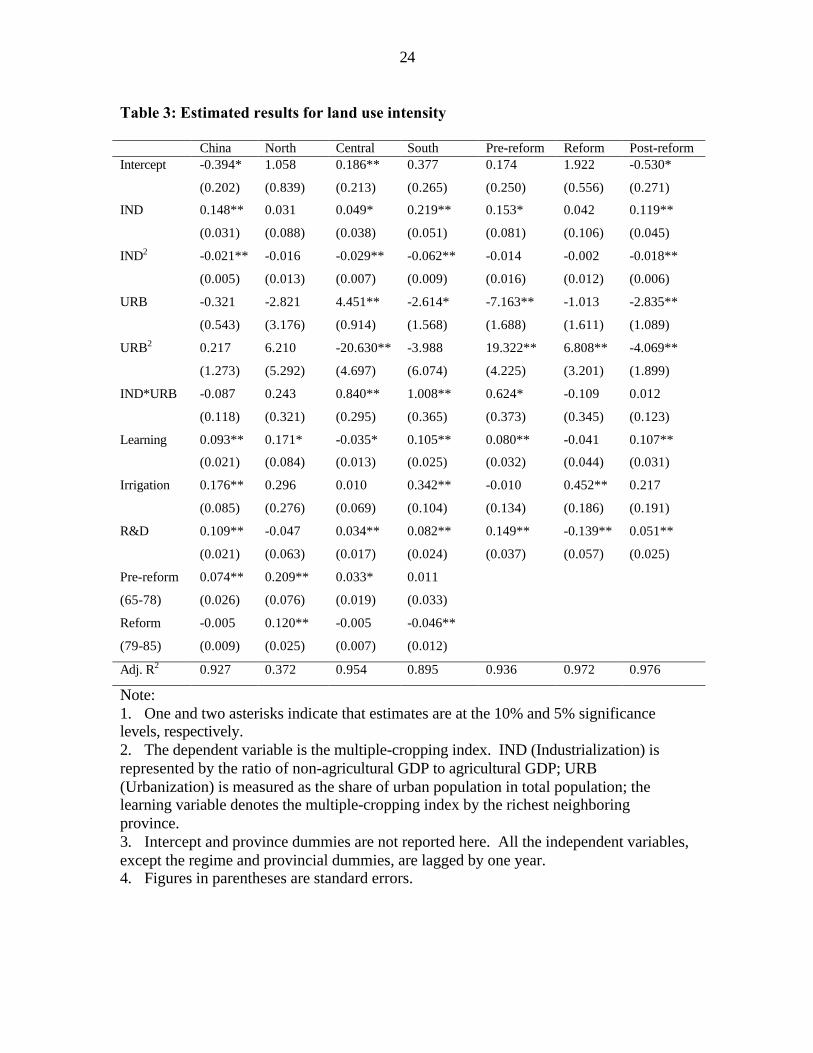
Table 3: Estimated results for land use intensity China North Central South Pre-reform Reform Post-reform Intercept -0.394*
(0.202)
1.058
(0.839)
0.186**
(0.213)
0.377
(0.265)
0.174
(0.250)
1.922
(0.556)
-0.530*
(0.271)
IND 0.148**
(0.031)
0.031
(0.088)
0.049*
(0.038)
0.219**
(0.051)
0.153*
(0.081)
0.042
(0.106)
0.119**
(0.045)
IND2 -0.021**
(0.005)
-0.016
(0.013)
-0.029**
(0.007)
-0.062**
(0.009)
-0.014
(0.016)
-0.002
(0.012)
-0.018**
(0.006)
URB -0.321
(0.543)
-2.821
(3.176)
4.451**
(0.914)
-2.614*
(1.568)
-7.163**
(1.688)
-1.013
(1.611)
-2.835**
(1.089)
URB2 0.217
(1.273)
6.210
(5.292)
-20.630**
(4.697)
-3.988
(6.074)
19.322**
(4.225)
6.808**
(3.201)
-4.069**
(1.899)
IND*URB
-0.087
(0.118)
0.243
(0.321)
0.840**
(0.295)
1.008**
(0.365)
0.624*
(0.373)
-0.109
(0.345)
0.012
(0.123)
Learning 0.093**
(0.021)
0.171*
(0.084)
-0.035*
(0.013)
0.105**
(0.025)
0.080**
(0.032)
-0.041
(0.044)
0.107**
(0.031)
Irrigation 0.176**
(0.085)
0.296
(0.276)
0.010
(0.069)
0.342**
(0.104)
-0.010
(0.134)
0.452**
(0.186)
0.217
(0.191)
R&D 0.109**
(0.021)
-0.047
(0.063)
0.034**
(0.017)
0.082**
(0.024)
0.149**
(0.037)
-0.139**
(0.057)
0.051**
(0.025)
Pre-reform
(65-78)
0.074**
(0.026)
0.209**
(0.076)
0.033*
(0.019)
0.011
(0.033)
Reform
(79-85)
-0.005
(0.009)
0.120**
(0.025)
-0.005
(0.007)
-0.046**
(0.012)
Adj. R2 0.927 0.372 0.954 0.895 0.936 0.972 0.976
Note: 1. One and two asterisks indicate that estimates are at the 10% and 5% significance levels, respectively. 2. The dependent variable is the multiple-cropping index. IND (Industrialization) is represented by the ratio of non-agricultural GDP to agricultural GDP; URB (Urbanization) is measured as the share of urban population in total population; the learning variable denotes the multiple-cropping index by the richest neighboring province. 3. Intercept and province dummies are not reported here. All the independent variables, except the regime and provincial dummies, are lagged by one year. 4. Figures in parentheses are standard errors.
25
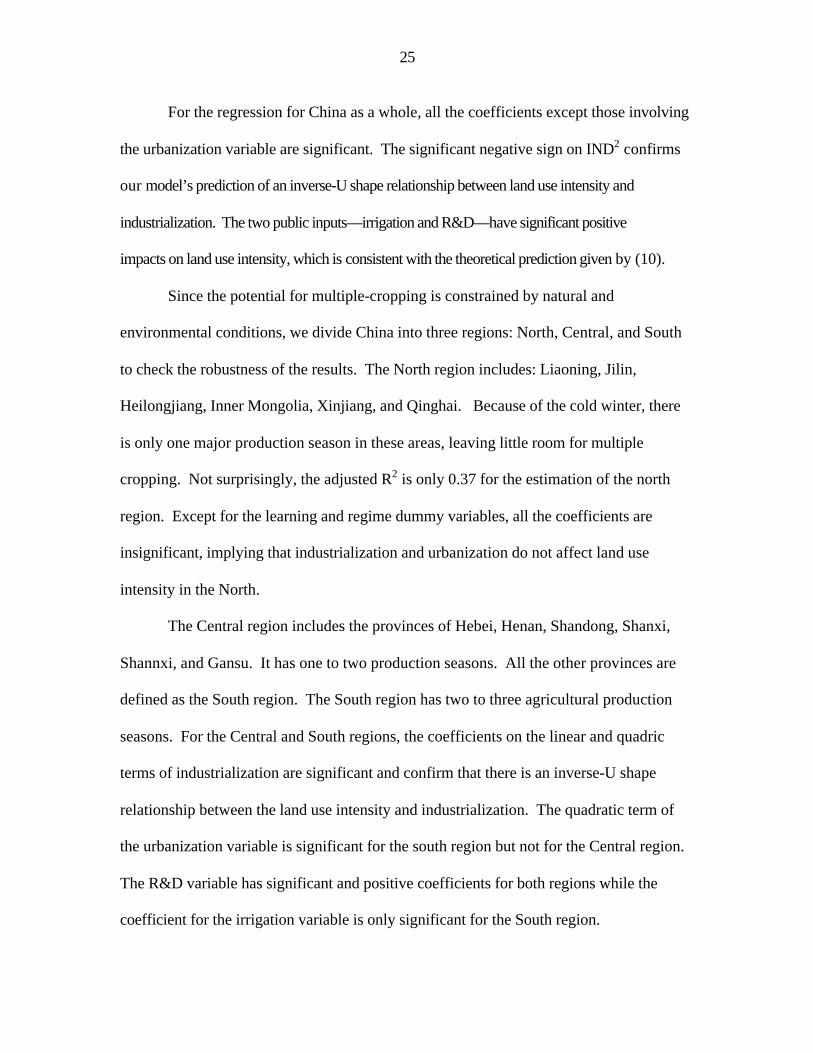
For the regression for China as a whole, all the coefficients except those involving
the urbanization variable are significant. The significant negative sign on IND2 confirms
our model’s prediction of an inverse-U shape relationship between land use intensity and
industrialization. The two public inputs—irrigation and R&D—have significant positive
impacts on land use intensity, which is consistent with the theoretical prediction given by (10).
Since the potential for multiple-cropping is constrained by natural and
environmental conditions, we divide China into three regions: North, Central, and South
to check the robustness of the results. The North region includes: Liaoning, Jilin,
Heilongjiang, Inner Mongolia, Xinjiang, and Qinghai. Because of the cold winter, there
is only one major production season in these areas, leaving little room for multiple
cropping. Not surprisingly, the adjusted R2 is only 0.37 for the estimation of the north
region. Except for the learning and regime dummy variables, all the coefficients are
insignificant, implying that industrialization and urbanization do not affect land use
intensity in the North.
The Central region includes the provinces of Hebei, Henan, Shandong, Shanxi,
Shannxi, and Gansu. It has one to two production seasons. All the other provinces are
defined as the South region. The South region has two to three agricultural production
seasons. For the Central and South regions, the coefficients on the linear and quadric
terms of industrialization are significant and confirm that there is an inverse-U shape
relationship between the land use intensity and industrialization. The quadratic term of
the urbanization variable is significant for the south region but not for the Central region.
The R&D variable has significant and positive coefficients for both regions while the
coefficient for the irrigation variable is only significant for the South region.
26
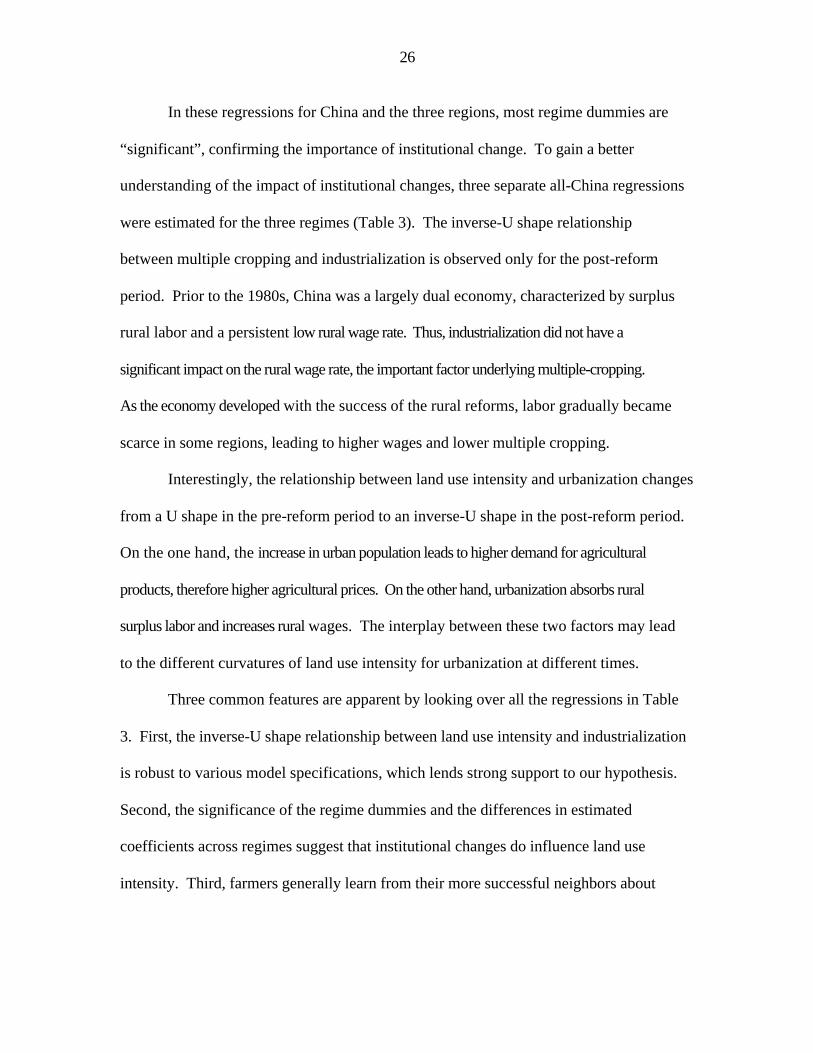
In these regressions for China and the three regions, most regime dummies are
“significant”, confirming the importance of institutional change. To gain a better
understanding of the impact of institutional changes, three separate all-China regressions
were estimated for the three regimes (Table 3). The inverse-U shape relationship
between multiple cropping and industrialization is observed only for the post-reform
period. Prior to the 1980s, China was a largely dual economy, characterized by surplus
rural labor and a persistent low rural wage rate. Thus, industrialization did not have a
significant impact on the rural wage rate, the important factor underlying multiple-cropping.
As the economy developed with the success of the rural reforms, labor gradually became
scarce in some regions, leading to higher wages and lower multiple cropping.
Interestingly, the relationship between land use intensity and urbanization changes
from a U shape in the pre-reform period to an inverse-U shape in the post-reform period.
On the one hand, the increase in urban population leads to higher demand for agricultural
products, therefore higher agricultural prices. On the other hand, urbanization absorbs rural
surplus labor and increases rural wages. The interplay between these two factors may lead
to the different curvatures of land use intensity for urbanization at different times.
Three common features are apparent by looking over all the regressions in Table
3. First, the inverse-U shape relationship between land use intensity and industrialization
is robust to various model specifications, which lends strong support to our hypothesis.
Second, the significance of the regime dummies and the differences in estimated
coefficients across regimes suggest that institutional changes do influence land use
intensity. Third, farmers generally learn from their more successful neighbors about
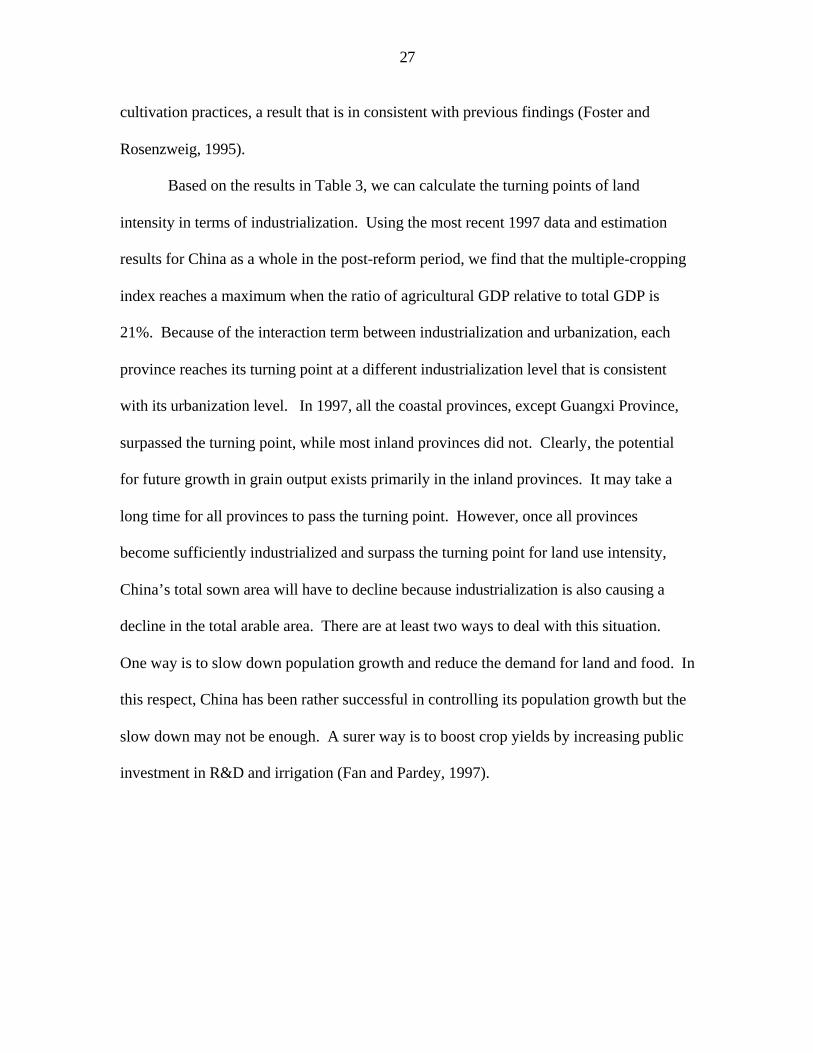
27
cultivation practices, a result that is in consistent with previous findings (Foster and
Rosenzweig, 1995).
Based on the results in Table 3, we can calculate the turning points of land
intensity in terms of industrialization. Using the most recent 1997 data and estimation
results for China as a whole in the post-reform period, we find that the multiple-cropping
index reaches a maximum when the ratio of agricultural GDP relative to total GDP is
21%. Because of the interaction term between industrialization and urbanization, each
province reaches its turning point at a different industrialization level that is consistent
with its urbanization level. In 1997, all the coastal provinces, except Guangxi Province,
surpassed the turning point, while most inland provinces did not. Clearly, the potential
for future growth in grain output exists primarily in the inland provinces. It may take a
long time for all provinces to pass the turning point. However, once all provinces
become sufficiently industrialized and surpass the turning point for land use intensity,
China’s total sown area will have to decline because industrialization is also causing a
decline in the total arable area. There are at least two ways to deal with this situation.
One way is to slow down population growth and reduce the demand for land and food. In
this respect, China has been rather successful in controlling its population growth but the
slow down may not be enough. A surer way is to boost crop yields by increasing public
investment in R&D and irrigation (Fan and Pardey, 1997).
28
5. CONCLUSIONS AND POLICY IMPLICATIONS
This paper develops a framework to model the determinants of land use based on
policy and historical experiences. The models for arable land area and multiple-cropping
are specified separately to reflect the different decision processes underlying them. A
long period panel data set at the provincial level is constructed from various
governmental sources to conduct the empirical analysis and hypothesis tests. In spite of
the complexity of modeling land use, the results are quite encouraging, and provide us
with a better understanding of the driving forces behind the changes in China’s
agricultural land use.
The empirical evidence shows that industrialization and urbanization are
important contributory factors to the conversion of farmland. Therefore, the
“industrialization” and grain self-sufficiency policies, both proposed in fifties, are inherently in
conflict with each other. Prior to the economic reform, these two objects were barely achieved,
and only then through the household register system that kept a large rural population in place.
Since the reform, the two goals have become more balanced largely by increasing land
productivity through the practice of multiple cropping.
Moreover, the results suggest an inverse U-shape relationship between land use
intensity and industrialization. On the one hand, industrialization brings down non-labor
input costs for agricultural production, promoting the practice of multiple cropping. On
the other hand, industrialization, especially the rapid development of rural enterprises,
offers more non-farm job opportunities, raising wages and making intensive farming
unattractive as surplus labor is exhausted. Therefore, in the short run, the total sown area
29
may still be stable or slightly expanding. In the end, as the country develops further, the
total sown area will inevitably shrink, threatening the objective of grain self-sufficiency.
Until recently, the primary way for government to control farmland loss and
increase sown area was through administrative orders, but the efficiency loss from doing
so may have been high (Rozelle and Huang, 1999). However, there are several better
ways to deal with the potential decline in sown area. First, encouraging labor movement
across regions will cause the economically advanced provinces to delay reaching their
maximum levels of cropping intensity. Second, long-term investment in agricultural
research should be guaranteed in order to further increase yields. If the growth rate of
yield surpasses the rate of loss in sown area, total grain output will not fall. Third,
considering the important effect of the learning variable on land use intensity, it is
sensible to strengthen the agricultural extension system to assist farmers in adopting land-
saving technologies. Finally, China should increasingly make use of international trade
to exploit its comparative advantages by gradually augmenting the import of land-
intensive crops, such as grain, and paying for these with additional exports of labor-
intensive commodities, such as fruits and vegetables.
30
APPENDIX: DATA SOURCES
Sown area and arable land area are widely used as indictors of agricultural land
use. However, it is generally believed that the official statistics for cultivated land area
are significantly biased (Ash and Edmonds, 1998; Ministry of Agriculture, 1998). Sown
area statistics are a more policy responsive and consistent indictor.
Land sown areas for each province from the period from 1979 to 1997 were
obtained from various issues of China Agricultural Yearbooks, China Rural Statistical
Yearbooks and China Statistical Yearbooks. For earlier years, the data for sown area
were taken from National Agricultural Statistical Materials for 30 years, 1949-1979.
Some missing observations were supplemented by data in provincial yearbooks. The
arable areas from 1980 to 1997 were taken from various issues of China Agricultural
Yearbooks and China Rural Statistical Yearbooks. For earlier years, the information was
taken from the National Water Resource Statistical Materials for 30 years, 1949-1979.
However, the sown area and arable land data for most provinces only go back to the early
1960s. Therefore, the data set used in our estimation only covers the period from 1965 to
1997. Tibiet, Hainan, and Ningxia are excluded due to lack of consistent data. The three
direct administrative cities—Beijing, Shanghai, and Tianjin—are also not included
considering their relatively small shares of agricultural production. As a result, the data
set contains 24 provinces.
The total and rural population data for each province for the period of 1982 to
1997 were taken from various issues of China Agricultural Statistics Yearbook. Prior to
1982, the data were taken from China Provincial Historical Statistical Materials, 1949-
1989. Some missing data were estimated based on provincial yearbooks and the National
31
Water Resource Statistical Materials for 30 years, 1949-1979. The urban population was
estimated by subtracting rural population from total population. Urban and rural
residencies are determined by the household registration system. Principally speaking,
rural and urban residents are supposed to specialize in farm work and non-farm work in
their registration areas, respectively. The ratio of the urban-to-total-population is used as
a proxy for urbanization. However, with the success of the rural reform, many workers
have been freed from agricultural activities and have moved to urban areas, especially big
cities, to seek opportunities without any entitlement to subsidies like urban residents.
There may be possible biases resulting from using the official registered numbers of rural
and urban population.
Nominal GDP and the annual growth rates of real GDP for industrial, agricultural,
and service sectors are available from SSB’s The Gross Domestic Product of China. A
ratio of non-agricultural GDP relative to the GDP in the agricultural sector is used to
measure the levels of industrialization. The ratio of industrial GDP to total GDP is not
used as a measurement because it would give a declining trend of industrialization due to
an increasing share of GDP in the service sector. The previous year’s growth rates of real
GDP are used as a criterion to select the best neighbor province to imitate.
Total grain import and export data from 1950 to 1991 were downloaded from the
USDA/ERS database. The information after 1991 was obtained from various issues of
China Statistical Yearbooks. The Ministry of Foreign Economic Relations and Trade
(MOFERT) were responsible for compiling the grain trade statistics prior to 1985. Since
1985, the Customs Department started reporting the trade statistics as well. There are
slight differences between the two sources but their trends are similar. As the Customs
32
statistics are more reliable (Colby, Crook, and Webb, 1992), we use the data from this
source after 1985. Annual aggregate grain production is available from the same sources
as the grain trade statistics.
The irrigated area data were taken from various issues of China Statistical
Yearbooks. The agricultural R&D expenditure data for the years following 1986 were
taken from various issues of Statistical Materials on Agricultural Science and Technology
(MOA, 1987-1997). Data for earlier years were obtained from the provincial academies of
agricultural sciences. The nominal research expenditure data were deflated to constant 1980
Yuan using the national retail price index taken from China Statistical Yearbooks.
33
REFERENCES
Ash, R.F. and R.L. Edmonds. 1998. China’s land resources, environment and
agricultural production. China Quarterly. 836–879.
Brown, L. 1995. Who will feed China: Waking-up call for a small planet. New York:
W.W. Norton & Company.
Chambers, R.G. 1988. Applied production analysis. New York: Cambridge University
Press.
Chan, K.W. 1995. Migration controls and urban society in Post-Mao China. Seattle
Population Research Center working paper, No. 95-2.
Colby, W.H., F.W. Crook, and S-E.H. Webb. 1992. Agricultural statistics of the People’s
Republic of China, 1949-1990. Economic Research Service, United States
Department of Agriculture. More recent data can be found at
http://usda.mannlib.cornell.edu/.
Crook, F.W. 1997. How will China’s ‘rice bag’ policy affect grain production,
distribution, prices, and international trade? In Agricultural polices in China by
OECD. Paris: OECD publications.
Fan, S. and M. Agcaoili-Sombilla. 1997. Why projections on China’s future food supply
and demand differ? The Australia Journal of Agricultural and Resource
Economics, 41(2): 169–190.
34
Fan, S. and P. Pardey. 1997. Research, productivity, and output growth in Chinese
agriculture. Journal of Development Economics 53: 115–137.
Fischer, G., Y. Chen, and L. Sun. 1998. The balance of cultivated land in China during
1988-1995. International Institute for Applied Systems Analysis (IIASA), Interim
Report 98-047.
Foster, A. and M.R. Rosenzweig. 1995. Learning by doing and learning from others:
Human capital and technical change in agriculture, Journal of Political Economy
103(6): 1176–1209.
Heilig, G.K. 1997. Anthropogenic factors in land-use in China, Population and
Development Review 23(1): 139–168.
Huang, J. and S. Rozelle. 1995. Environmental stress and grain yields in China, American
Journal of Agricultural Economics 77 (4): 853–864.
Kanbur, R. and X. Zhang. 1999. Which regional inequality? The evolution of rural-urban
and inland-coastal inequality in China, 1983-1995, Journal of Comparative
Economics, 27: 686-701.
Lewis, W.A. 1954. Economic development with unlimited supplies of labor. Manchester
School, 28: 139–191.
Li, X. and L. Sun. 1997. Driving forces of arable land conversion in China. International
Institute for Applied Systems Analysis (IIASA), Interim Report 97-076.
35
Lin, J.Y. 1990. Collectivization and China's agricultural crisis in 1959-1961, Journal of
Political Economy 98(6): 1228–1252.
________. 1991. The household responsibility system reform and adoption of hybrid rice
in China. Journal of Development Economics 36: 353–372.
________. 1992. Rural reforms and agricultural growth in China. American Economic
Review 82(1): 34–51.
Lin, J.Y., F. Cai, and Z. Li. 1996. The China miracle: Development strategy and
economic reform. Hong Kong: The Chinese University Press.
Ma, J, 1997. Intergovernmental relations and economic management in China. New
York: St. Martin's Press.
McGuirk, A. and Y. Mundlak, 1991. Incentives and constraints in the transformation of
Punjab agriculture. Washington, D.C.: International Food Policy Research
Institute Report No. 87.
Ministry of Agriculture (MOA). (Various issues). China agricultural yearbooks. Beijing:
China Statistical Publishing House
________. (Various issues). Statistical materials on agricultural science and technology.
Beijing: China Statistical Publishing House
Qian, Y. and G. Roland. 1998. Federalism and soft budget control, American Economic
Review 88(5): 1143–1162.
36
Rozelle, S. and R.N. Boisvert. 1994. Quantifying Chinese village leader’s multiple
objectives. Journal of Comparative Economics 18: 25–45.
________. 1995. Control in a dynamic village economy: The reforms and unbalanced
development in China’s rural economy. Journal of Development Economics 46:
233–252.
Rozelle, S. and J. Huang. 1999. Grain market reform, stage?: A review of performance
and policy. Paper presented in the Annual American Agricultural Economics
Association Meetings at Nashville, TN, August 8-11.
Selden, M. 1992. The political economy of Chinese development. New York, London:
M.E. Sharpe.
Smil, V. 1999. China’s agricultural land. China Quarterly 158: 414–429.
State Statistical Bureau (SSB). (Various years). China price statistical yearbook.
Beijing: China Statistical Publishing House.
________. (Various years). China rural statistical yearbook. Beijing: China Statistical
Publishing House.
________. (Various years). China statistical yearbook. Beijing: China Statistical
Publishing House.
________. 1990. National water resource statistical materials for 30 years, 1949-1979.
Beijing: China Statistical Publishing House.
37
________. 1998. The gross domestic product of China (1952-1995). Dalian: Dongbei
University of Finance and Economics Press.
________. 1998. Historical Statistical materials for provinces, autonomous regions and
municipalities (1949-1989). Beijing: China Statistical Publishing House.
Tang, A.M. 1984. An analytical and empirical investigation of agricultural in Mainland
China, 1952-1978. Chung-Hua Institution for Economic Research, Taiwan.
Zhang, X., T. Mount, and R. Boisvert. 1998. Food demand in China: Lessons from
Guangdong Province. Department of Agricultural, Resource, and Managerial
Economics Working Paper 98-02. New York: Cornell University.
Zhang, L., J. Huang, and S. Rozelle. 1997. Land policy and land use in China. In
Agricultural polices in China by OECD. Paris: OECD Publications.
List of EPTD Discussion Papers
01 Sustainable Agricultural Development Strategies in Fragile Lands, by Sara J. Scherr and Peter B.R. Hazell, June 1994.
02 Confronting the Environmental Consequences of the Green Revolution in Asia, by Prabhu L. Pingali and Mark W. Rosegrant, August 1994.
03 Infrastructure and Technology Constraints to Agricultural Development in the Humid and Subhumid Tropics of Africa, by Dunstan S.C. Spencer, August 1994.
04 Water Markets in Pakistan: Participation and Productivity, by Ruth Meinzen-Dick and Martha Sullins, September 1994.
05 The Impact of Technical Change in Agriculture on Human Fertility: District-level Evidence from India, by Stephen A. Vosti, Julie Witcover, and Michael Lipton, October 1994.
06 Reforming Water Allocation Policy Through Markets in Tradable Water Rights: Lessons from Chile, Mexico, and California, by Mark W. Rosegrant and Renato Gazmuri S., October 1994.
07 Total Factor Productivity and Sources of Long-Term Growth in Indian Agriculture, by Mark W. Rosegrant and Robert E. Evenson, April 1995.
08 Farm-Nonfarm Growth Linkages in Zambia, by Peter B.R. Hazell and Behjat Hojjati, April 1995.
09 Livestock and Deforestation in Central America in the 1980s and 1990s: A Policy Perspective, by David Kaimowitz (Interamerican Institute for Cooperation on Agriculture), June 1995.
10 Effects of the Structural Adjustment Program on Agricultural Production and Resource Use in Egypt, by Peter B. R. Hazell, Nicostrato Perez, Gamal Siam and Ibrahim Soliman, August 1995.
11 Local Organizations for Natural Resource Management: Lessons from Theoretical and Empirical Literature, by Lise Nordvig Rasmussen and Ruth Meinzen-Dick, August 1995.
12 Quality-Equivalent and Cost-Adjusted Measurement of International Competitiveness in Japanese Rice Markets, by Shoichi Ito, Mark W. Rosegrant, and Mercedita C. Agcaoili-Sombilla, August, 1995.
13 Role of Inputs, Institutions, and Technical Innovations in Stimulating Growth in Chinese Agriculture, by Shenggen Fan and Philip G. Pardey, September 1995.
14 Investments in African Agricultural Research, by Philip G. Pardey, Johannes Roseboom, and Nienke Beintema, October 1995.
15 Role of Terms of Trade in Indian Agricultural Growth: A National and State Level Analysis, by Peter B. R. Hazell, V. N. Misra and Behjat Hojjati, December 1995.
16 Policies and Markets for Non-Timber Tree Products, by Peter A. Dewees and Sara J. Scherr, March 1996.
17 Determinants of Farmers' Indigenous Soil and Water Conservation Investments in India's Semi-Arid Tropics, by John Pender and John Kerr, August 1996.
18 Summary of a Productive Partnership: The Benefits from U.S. Participation in the CGIAR, by Philip G. Pardey, Julian M. Alston, Jason E. Christian and Shenggen Fan, October 1996.
19 Crop Genetic Resource Policy: Towards a Research Agenda, by Brian D. Wright, October 1996.
20 Sustainable Development of Rainfed Agriculture in India, by John M. Kerr, November 1996.
21 Impact of Market and Population Pressure on Production, Incomes and Natural Resources in the Dryland Savannas of West Africa: Bioeconomic Modeling at the Village Level, by Bruno Barbier, November 1996.
22 Why Do Projections on China's Future Food Supply and Demand Differ? by Shenggen Fan and Mercedita Agcaoili-Sombilla, March 1997.
23 Agroecological Aspects of Evaluating Agricultural R&D, by Stanley Wood and Philip G. Pardey, March 1997.
24 Population Pressure, Land Tenure, and Tree Resource Management in Uganda, by Frank Place and Keijiro Otsuka, March 1997.
25 Should India Invest More in Less-favored Areas? by Shenggen Fan and Peter Hazell, April 1997.
26 Population Pressure and the Microeconomy of Land Management in Hills and Mountains of Developing Countries, by Scott R. Templeton and Sara J. Scherr, April 1997.
27 Population Land Tenure, and Natural Resource Management: The Case of Customary Land Area in Malawi, by Frank Place and Keijiro Otsuka, April 1997.
28 Water Resources Development in Africa: A Review and Synthesis of Issues, Potentials, and Strategies for the Future, by Mark W. Rosegrant and Nicostrato D. Perez, September 1997.
29 Financing Agricultural R&D in Rich Countries: What's Happening and Why, by Julian M. Alston, Philip G. Pardey, and Vincent H. Smith, September 1997.
30 How Fast Have China's Agricultural Production and Productivity Really Been Growing? by Shenggen Fan, September 1997.
31 Does Land Tenure Insecurity Discourage Tree Planting? Evolution of Customary Land Tenure and Agroforestry Management in Sumatra, by Keijiro Otsuka, S. Suyanto, and Thomas P. Tomich, December 1997.
32 Natural Resource Management in the Hillsides of Honduras: Bioeconomic Modeling at the Micro-Watershed Level, by Bruno Barbier and Gilles Bergeron, January 1998.
33 Government Spending, Growth and Poverty: An Analysis of Interlinkages in Rural India, by Shenggen Fan, Peter Hazell, and Sukhadeo Thorat, March 1998, Revised December 1998.
34 Coalitions and the Organization of Multiple-Stakeholder Action: A Case Study of Agricultural Research and Extension in Rajasthan, India, by Ruth Alsop, April 1998.
35 Dynamics in the Creation and Depreciation of Knowledge and the Returns to Research, by Julian Alston, Barbara Craig, and Philip Pardey, July 1998.
36 Educating Agricultural Researchers: A Review of the Role of African Universities, by Nienke M. Beintema, Philip G. Pardey, and Johannes Roseboom, August 1998.
37 The Changing Organizational Basis of African Agricultural Research, by Johannes Roseboom, Philip G. Pardey, and Nienke M. Beintema, November 1998.
38 Research Returns Redux: A Meta-Analysis of the Returns to Agricultural R&D, by Julian M. Alston, Michele C. Marra, Philip G. Pardey, and T.J. Wyatt, November 1998.
39 Technological Change, Technical and Allocative Efficiency in Chinese Agriculture: The Case of Rice Production in Jiangsu, by Shenggen Fan, January 1999.
40 The Substance of Interaction: Design and Policy Implications of NGO-Government Projects in India, by Ruth Alsop with Ved Arya, January 1999.
41 Strategies for Sustainable Agricultural Development in the East African Highlands, by John Pender, Frank Place, and Simeon Ehui, April 1999.
42 Cost Aspects of African Agricultural Research, by Philip G. Pardey, Johannes Roseboom, Nienke M. Beintema, and Connie Chan-Kang, April 1999.
43 Are Returns to Public Investment Lower in Less-favored Rural Areas? An Empirical Analysis of India, by Shenggen Fan and Peter Hazell, May 1999.
44 Spatial Aspects of the Design and Targeting of Agricultural Development Strategies, by Stanley Wood, Kate Sebastian, Freddy Nachtergaele, Daniel Nielsen, and Aiguo Dai, May 1999.
45 Pathways of Development in the Hillsides of Honduras: Causes and Implications for Agricultural Production, Poverty, and Sustainable Resource Use, by John Pender, Sara J. Scherr, and Guadalupe Durón, May 1999.
46 Determinants of Land Use Change: Evidence from a Community Study in Honduras, by Gilles Bergeron and John Pender, July 1999.
47 Impact on Food Security and Rural Development of Reallocating Water from Agriculture, by Mark W. Rosegrant and Claudia Ringler, August 1999.
48 Rural Population Growth, Agricultural Change and Natural Resource Management in Developing Countries: A review of Hypotheses and Some Evidence from Honduras, by John Pender, August 1999.
49 Organizational Development and Natural Resource Management: Evidence from Central Honduras, by John Pender and Sara J. Scherr, November 1999.
50 Estimating Crop-Specific Production Technologies in Chinese Agriculture: A Generalized Maximum Entropy Approach, by Xiaobo Zhang and Shenggen Fan, September 1999.
51 Dynamic Implications of Patenting for Crop Genetic Resources, by Bonwoo Koo and Brian D. Wright, October 1999.
52 Costing the Ex Situ Conservation of Genetic Resources: Maize and Wheat at CIMMYT, by Philip G. Pardey, Bonwoo Koo, Brian D. Wright, M.Eric van Dusen, Bent Skovmand, and Suketoshi Taba, October 1999.
53 Past and Future Sources of Growth for China, by Shenggen Fan, Xiaobo Zhang, and Sherman Robinson, October 1999.
54 The Timing of Evaluation of Genebank Accessions and the Effects of Biotechnology, by Bonwoo Koo and Brian D. Wright, October 1999.
55 New Approaches to Crop Yield Insurance in Developing Countries, by Jerry Skees, Peter Hazell, and Mario Miranda, November 1999.
56 Impact of Agricultural Research on Poverty Alleviation: Conceptual Framework with Illustrations from the Literature, John Kerr and Shashi Kolavalli, December 1999.
57 Could Futures Markets Help Growers Better Manage Coffee Price Risks in Costa Rica? by Peter Hazell, January 2000.
58 Industrialization, Urbanization, and Land Use in China, by Xiaobo Zhang, Tim Mount and Richard Boisvert, January 2000.