Embed Size (px)
Citation preview

P a g e | 97
Sustainable Structure and Materials, Vol. 2, No .1, (2019) 97-117
DOI: https://doi.org/10.26392/SSM.2019.02.01.097
Influence of Water Binder Ratio and Chemical Admixture on
the Properties of Self- Compacting Concrete with composite
Cement- Fly Ash binder
Baboo Rai*1, Sanjay kumar1, Kumar Satish2
1Associate Professor, National Institute of Technology, Patna-800005, Bihar, India, 2Project Incharge, Planning & Development, Department of Planning & Development, Birla
Institute of Technology, Mesra, Off Campus Deoghar – 814142, Jharkhand, India
*Corresponding author/ E-mail: [email protected]
Received May 04, 2019, Revised June 25, 2019, Accepted July 05, 2019)
ABSTRACT. This paper describes an experimental investigation to study the combined effect of water binder
ratio and chemical admixture on mechanical properties of self- compacting concrete (SCC) prepared using composite fly ash–cement binder. For this purpose, the mixture proportioning for SCC was based upon creating
a high-degree of flowability by using High-Range Water-Reducing Admixtures (HRWRA) combined with
Viscosity Modifying Admixture (VMA) to ensure homogeneity of the mixture. The flowability test results showed that the spread for all mixes was within the specified range recommended by EFNARC 2005 and EN 206. The J
Ring height for all SCC mixes was observed to be between 17-20 mm, which was within the specified limits of EFNARC 2005. A visual stability index has been provided to all SCC mixes for qualitative assessment of the
flowability indexes. The cementing efficiency factor of fly ash, adopted in the presented work, restores the
cementitious content in the mix. At 0.36 w/b ratio, the cube compressive strength at 28 days was almost 51MPa when 2.2% HRWRA with VMA was added to the mix. Through the different flowability test results, an effort has
been made to develop a correlation between different flowability parameters using regression analysis in MINITAB software. An empirical formula in the form of basic equations suggested by CEB-FIP and ACI 363R
-92 to express the relationship between split tensile strength and compressive strength of SCC has also been
proposed.
Keywords: Fly Ash, Flowability Index, Compressive Strength, Split Tensile Strength
1. INTRODUCTION Self-Compacting Concrete (SCC), first used in Japan in the late nineteen eighties (1) is a new kind of concrete
that combines a high flowability and a high resistance to segregation obtained by a large amount of fine particles and
the use of superplasticizers (2). Unlike ordinary vibrated concrete, SCC does not need any external compaction energy,
eliminating possible problems caused by poor external compaction (3). There are numerous more focal points as far as
innovation, working conditions and health monitoring is concerned (4).
In general, the important performance indexes for SCC are good workability with high fluidity and high-
quality control (5). Viscosity Modifying Admixtures (VMA) which contain a water-soluble polymer, acrylic water-
soluble polymers or biological glue, helps resolve this problem (6–9). The viscosity of SCC mixes decreases with
increase in water to binder ratio (w/b) ratio, while flowability increases and mechanical and durability properties
decrease. According to Rao et al. 2010 (10), segregation and cohesiveness in fresh concrete are interrelated and can be
enhanced by adding VMA along with High-Range Water-Reducing Admixtures (HRWRA). According to Jayasree et
al. 2011 (11), the reduction in water content is as much as 40% when polycarboxylate ether based superplasticizers
(PCE SP) is used.

P a g e | 98
Further, with the help of this chemical admixture, any delay in the gain of strength of concrete is minimized.
PCE SP, with its diverse molecular structure and mode of chemical activity, represents an improvement over sulfonate-
based HRWRAs by preventing flocculation of cement particles. Ozawa 1995 (12) and Khayat 1998 (7) concluded that
VMA could enhance the viscosity and cohesiveness of SCC mixes through the addition of filler material like limestone
powder. They further concluded that the viscosity of concrete mixes can also be increased by decreasing the w/b ratio.
High flowability requirement of SCC stimulates the utilization of mineral admixtures. Use of mineral
admixtures such as Fly Ash (FA), Ground Granulated Blast Furnace Slag (GGBS), Rice Husk Ash (RHA), allcofine,
and other similar fine powder additives, increases the fine materials in the concrete mixture and increases the flow of
the mix (13,14). Utilization of mineral admixtures additionally reduces the cost of concrete by subsequently reducing
the dosage of superplasticizers (15–20). The incorporation of mineral additives can improve particle-packing density
and reduce inter-particle friction and viscosity because of its different morphology and grain-size distribution compared
to cement (21). Yazici 2008 (22) in his study concluded that the use of FA could increase the slump flow of the SCCs
mixes. Moreover, the need for viscosity-enhancing chemical admixtures is minimized. The Indian standard IS 456:
2000 (23) permits the use of FA and silica fume for modifying the properties of concrete. The w/b ratio must be lower
than the water to cement ratio, for FA mixture to be equivalent in strength to a plain cement mixture. This is acceptable
due to the fact that FA acts like a water reducer.
Smith 1967 (24) introduced the cementing efficiency factor for FA for effective utilization of this cementing
material. For FA replacement up to 25 % in cement, a cementing efficiency factor k = 0.25 was further suggested. The
German code (25) and the British code (26) adopted a value 0.3 for FA replacement up to 50% with cement. Cementing
efficiency factor of 0.5 for water to cement ratio in the range of 0.5 to 0.65 was reported by Schiess 1991 (24). He
further reported that for a w/c ratio between 0.5 and 0.65, a value of 0.5 is more appropriate for the cementing efficiency
factor. The Danish standards further stipulated an efficiency value of 0.5 for FA.
The explicit objective of the present research program was to obtain an optimum combination of w/b ratio and
superplasticizer for achieving SCC. The scope of this experimental research program included an examination of the
effect of chemical admixture and water binder ratio on SCC. For this purpose, PCE SP combined with stabilizing agents
like VMA was utilized in the mixture composition of SCC to create a high-degree of flowability and to ensure
homogeneity of the mixture.
2. MATERIALS AND MIX PROPORTIONING
2.1. Materials Ordinary Portland Cement (OPC) of grade 43 conforming to IS8112:1989 (27) was used in this investigation.
The physical properties of cement were tested in accordance with IS 4031 (28). ASTM Class C FA obtained from
Kahalgaon thermal power generation plant located in India was used in the present study for the partial replacement of
OPC. Physical properties of the FA were tested in accordance with IS 3812-2003 (29). The physical properties of FA
and cement are given in Table 1.
Table 1: Physical Properties of Cement and Fly Ash
Sl. No. Physical Properties Observed values for
Cement
Observed values for Fly
Ash
1 Specific Gravity 3.15 2.2
2 Initial Setting 30 min -
3 Final Setting 600 min -
4 Soundness (autoclave expansion) % 0.8 0.06
5 Fineness (m2/g) 0.225 0.368
River sand and crushed gravel obtained from local sources were used as fine aggregate and coarse aggregate,
respectively. Physical properties of the aggregates were determined per IS 383:1970 (30) requirements. Selected
properties of the aggregates are given in Table 2. Fig 1 presents the grain size distribution of aggregates used in the
present work. Poly-carboxylic ether based Super plasticizers with and without inbuilt VMA was used in this study. The
chemical admixtures used were supplied by BASF India limited with a brand name of Master Glenium SKY 8630/8632.
The chemical and physical properties are presented in Table 3. The dosages of admixtures were varied to achieve the
desired fresh concrete properties for the SCC mixtures.

P a g e | 99
Table 2: Physical Properties of River Sand and Coarse aggregate
Sl. No. Parameters River sand Coarse aggregate
1 Specific gravity 2.66 2.74
2 Fineness modulus 2.60 -
3 Water absorption 1.35 0.78
4 Aggregate crushing value - 24%
5 Aggregate impact value - 29%
Fig 1: Particle Size distribution curve of aggregates
Table 3: Properties of Chemical Admixture (BASF India Ltd.)
Parameter Specifications
(as per IS 9103) (31) Results
Physical state Reddish brown liquid Reddish brown liquid
Chemical name of active ingredient Polycarboxylate polymers Polycarboxylate polymers
Relative density at 250C 1.06 ± 0.01 1.066
PH ≥ 6 at 250 C 7.22
Chloride ion content (%) < 0.2 < 0.1%
Dry material content 18± 5% 18.42
2.2. Mixture proportions Mix design calculations for SCC was done in accordance with IS 10262:2009 (32). Water adsorption for fine
aggregate and coarse aggregate has been considered in mix design calculations. To convert the aggregates into saturated
surface dry condition, extra water was added in the SCC mix. The amounts and percentage of the constituents utilized
in the SCC mixes are given in Table 4. This extra water is presented separately in column 9 of table 4 as it is not going
to participate in the reaction mechanism of concrete. Further, a cementing efficiency factor, K, for fly ash has been
considered in the mix design calculations. “The K value of fly ash relative to cement is measured as the number of parts
of cement that may be replaced by one part of the ash without changing the property being investigated, generally the
compressive strength (24)”. Thus for concrete containing fly-ash, the effective water/cement ratio is represented as
𝑤
𝐶=
𝑤
𝐶1+𝑘𝐹𝐴 ……………………………..………………………………………… (1)
0
20
40
60
80
100
120
0.1 1 10 100
Particle Size
% P
as
sin
g
20 mm 16mm Fine Aggregate

P a g e | 100
where, w is water content; C is cement content of control concrete, and C1 is the cement content of fly ash concrete.
Based upon the previous work (33), in the present investigation, a cementing efficiency factor (k) of 0.30 has been
considered for fly ash percentage replacement, less than 30% and 0.55 for fly ash percentage replacement greater than
or equal to 30%. Four sets of SCC mixes with five different fly ash replacement percentages (0%, 10%, 20%, 30% and
40%) were cast at different water to binder ratio with different chemical admixture dosage.
2.3 TEST PROGRAM AND PROCEDURES
2.3.1 Flowability Test
The fresh concrete properties were measured as per the acceptance criteria for self-compacting concrete given
in EFNARC: 2005 (34) and EN 206 (35) to evaluate the flow and self-compacting behaviour of the concrete. The
various flowability tests conducted in the lab were Slump Flow Test (T-500 time in sec), J- ring Test, L-box and V-
funnel Test.
The slump flow test is a measure of the viscosity of SCC mixes. T-500 test measures the time taken for concrete
to reach a spread diameter of 500mm from the moment the slump cone is lifted. A higher T-500 value indicates a more
viscous mix. The L-box and J-ring test measures the passing ability of SCC mixes in congested reinforcement while
the V-funnel test shows how quickly the SCC mixture passes through the constricted area.
2.3.2 Strength Test A Digital Compression Testing Machine of 2000kN capacity was used for measuring the compressive strength
of test specimens. Compressive strength was measured on 150 mm cubes in accordance with Indian Standard IS 516-
1959 (36).
Cylindrical specimens of size 150mm x 300mm were cast to measure the splitting tensile strength in
accordance with Indian Standard IS 5816,-1976 (37). The horizontal tensile stress is expressed as:
πDL
P2= Stress Tensile Horizontal
……………………………………………..………………….. (2)
where P = compressive load on cylinder L = Length of cylinder D = Diameter of cylinder
For both, the tests, three test samples were tested, and the average values were obtained.
2.3.3 Visual Stability Index (VSI) Rating The Visual Stability Index (VSI) is the qualitative measure of the fresh concrete ability to resist segregation
(38,39). It can be used as the measure of the relative quality control of the mixed concrete. This test is subjective and
its best used to relatively compare several similar SCC mixes. The VSI rating varies from 0 to 3. If SSCs mixes show
no evidence of segregation and bleeding, then a rating of 0 is provided further, if there is evidence of segregation and
bleeding, then a rating of 3 is provided to the SCC mixture. Further, a rating of 1 is indicative of slight bleeding with
no mortar halo in the slump flow of the mix while a rating of 1.5 indicates noticeable bleeding with a just noticeable
aggregate piling during the slump flow test. A VSI rating has been provided to all the mixes and is depicted in table 5.
3. RESULTS AND DISCUSSIONS Twenty mixes with partial replacement of FA with cement were prepared. Three sets of experiments were
conducted wherein the first set of the experiment; the PCE SP dosage for the ten mixes was fixed at 2.8% by weight of
cement. For the first five mixes, the w/b ratio was fixed at 0.38, and for the next five, the water to binder ratio was 0.36.
In the second set of the experiment, the w/b ratio was fixed at 0.36. The dosage of PCE SP was fixed at 2.4% by weight
of cement. In the third set of experiment, another chemical admixture was used which contained PCE SP with inbuilt
VMA. The dosage for this chemical admixture was fixed at 2.2% by weight of cement and water to binder ratio was
fixed at 0.36.

P a g e | 101
Table 4: Mix Proportioning of Trial Mixes
Mix
No.
Cement
(Kg) Fly Ash (kg)
% of Fly
Ash
Water/
powder ratio
Coarse
aggregate (kg)
Fine aggregate
(kg) Water (Liter)
Extra
Water
(Liter)
Chemical Admixture
1 467 00 0
0.38
864 903 177.45 19.11
2.8% of PCE SP by
weight of Cement
2 453 46 10 826 864 189.87 18.74
3 439 92 20 789 825 202.29 18.38
4 390 139 30 784 820 201.41 18.74
5 364 185 40 757 792 209.39 18.62
6 467 00 0
0.36
876 916 168.11 19.20
2.8% of PCE SP by
weight of Cement
7 453 46 10 839 878 179.88 19.03
8 439 92 20 803 839 191.65 18.69
9 390 139 30 798 834 190.81 19.05
10 364 185 40 772 807 198.37 18.94
11 467 00 0
0.36
878 918 168.11 19.43
2.4 % of PCE SP by
weight of Cement
12 453 46 10 842 880 179.88 19.08
13 439 92 20 805 841 191.65 18.73
14 390 139 30 800 836 190.81 19.09
15 364 185 40 774 809 198.37 18.98
16 467 00 0
0.36
880 920 168.11 19.45
2.2 % of PCE SP +
VMA by weight of
Cement
17 453 46 10 843 881 179.88 19.11
18 439 92 20 806 843 191.65 18.76
19 390 139 30 801 837 190.81 19.11
20 364 185 40 775 810 198.37 19.00

P a g e | 102
3.1 Effect on Flowability Index
The results of the various flowability tests of SCC with different percentage of FA are presented in Table 5.
The viscosity of SCC mixtures was evaluated through the slump flow test. According to Nagataki and Fujiwara (40)
and Khayat et al. (41), a slump flow ranging from 500 to 700 mm is considered as the slump required for concrete to
be self-compacted. The stability of SCC mixtures was evaluated through the V- funnel test. Both the spread diameter
and the V-funnel flow times are in good agreement to that of the values given by European guidelines (35) for a range
of applications and different viscosity classes and were also within the specified range recommended in the literature
(42). The L-box blocking ratio was also within the specified range laid down by EFNARC 2005 (34). The J-ring test
extends common filling ability test methods to also characterize passing ability. It is also an estimation of susceptibility
to blocking. The J Ring height for all SCC mixes was observed to be between 17-20 mm. The J-ring time was measured
and is presented in Table 5. Slight bleeding and the noticeable aggregate pile were observed during the flowability test
in few SCC mixes. Based on the visual of the flow tests, a visual stability index rating has been provided to all SCC
mixes and is presented in Table 5.
At a higher dosage of PCE SP the spread diameter achieved was near maximum at same w/b ratio, in contrary,
the spread diameter decreased with a reduction in w/b ratio for the same dosage of HRWR. At PCE SP dosage of 2.8%
by weight of cement mass, the visual stability index achieved was 2 at both w/c ratios (0.38 and 0.36). High fluidity
with bleeding was observed for SCC mixes with a PCE-SP dosage of 2.8% by weight of cement. The SCC mixes were
unstable as a slight mortar halo was observed in the centre of concrete masses. Consistent viscosity with bleeding was
observed in the case of mixes with PCE SP with VMA. As reported by Lachemi et al. (43), the mixes with an adequate
concentration of PCE SP with VMA inhibits fluidity with increased viscosity. In such concrete mixes, the viscosity
built up is promoted due to association and enlargement of polymer chains of VMA at the low shear rate. This property
increases the stability of the concrete and reduces the risk of segregation.
When cement is partially replaced by FA, the superplasticizer dosage decreases without compromising the
filling ability of the SCC mixes, this can be seen from the results presented in Table 5. Bouzoubaa et al. (44) reported
similar results. Bleeding reduced noticeably when PCE SP with inbuilt VMA was used and further there was a slight
increase in V–funnel time. A similar report has been published by Khayat (7) owing to the fact that VMAs, reduces the
segregation and bleeding and increases viscosity as it absorbs some free water present in the mix. More or less similar
reasons for the reduction in bleeding and increase in viscosity has also been cited by Khayat et al. (7). The VSI rating
provided to all the FA-induced SCC mixes indicates that despite the use of PCE SP with inbuilt VMA, slight bleeding
was observed along with air popping on the surface of concrete, but this effect was less when compared to SCC mixes
without VMA.
Fig. 2 represents the combined influence of w/b ratio and dosage of PCE SP on both spread diameter and V-
funnel time of SCC mixes. Both V-funnel time and spread diameter show a quadratic relation with the high correlation
coefficient. Further Fig 3 and Fig 4 represent the effect of FA on V-funnel time and spread diameter of SCC mixes at
w/b ratio 0.36. Here also both the flowability parameters viz., V- funnel time and spread diameter show a quadratic
relation with FA replacement percentage with cement. From figures, it can clearly be interpreted that V- funnel time
decreases with an increase in FA percentage, while spread diameter increases with an increase in FA percentage. Thus,
concluding that FA lowers the viscosity of the SCC mixes. The SEM image shown in Fig 5 confirms the above finding
that the increase in FA content increases flowability of SCC mixtures. The high fluidity of SCC having large FA content
would be induced by the ball milling effect of FA particles, which is quite evident in Fig 5. The same findings have
also been reported in the literature (44,45) and reasoned that due to its spherical shape, FA can disperse agglomeration
of cement particles leading to a reduction in viscosity. From Fig 3 and 4, it can also be seen that the V funnel time and
the spread diameter remained constant (the nature of the curve almost flattens) at replacement level more than 20%.
Hence it can be concluded that the optimum level of fly ash replacement should be between 20% and 30%. The same
has also been reported by Omar et al. 2018 (46).
The equation presented in the figures indicates that the cementing efficiency factor of FA, adopted in the
presented work, restores the cementitious content in the mix. The increase in percentage replacement of FA has little or
no impact on the spread and v funnel value as evident from the intercept value of the equation which is a 2nd order
polynomial equation in the form
y= ax2 + bx + c……………………………………………………………………………………… (3)

P a g e | 103
Table 5: Flowability Test Results
Mix
No.
w/b
ratio
Chemical
Admixture
% Fly Ash
by weight
of cement
Spread
diameter
mm
Slump Flow Test
(time in sec) J Ring Test (time in sec) L Box Test
V Funnel
Test VSI
300mm 500mm 700mm 300mm 500mm 700mm H2/H1 time in sec
1
0.38
2.8% of PCE SP
by weight of
Cement
00 743 0.8 3.2 6.2 1.0 3.8 6.6 0.84 9.4 2
2 10 748 1.1 3.1 7.2 1.5 4.6 7.8 0.88 9.1 2
3 20 752 0.8 2.5 6.9 1.2 4.3 7.5 0.85 8.6 2
4 30 755 0.6 2.3 6.4 1.1 4.1 7.1 0.84 8.4 2
5 40 760 0.5 2.4 5.9 0.8 3.9 6.7 0.83 8.2 2
6
0.36
2.8% of PCE SP
by weight of
Cement
00 732 1.0 3.2 6.6 1.4 4.2 7.1 0.82 9.6 2
7 10 734 1.3 3.2 7.5 1.6 4.9 8.1 0.87 9 2
8 20 741 0.9 2.9 7.0 1.4 4.5 7.9 0.80 8.4 1.5
9 30 745 0.8 2.7 6.2 1.3 4.3 7.5 0.98 8.4 1.5
10 40 747 0.7 2.3 6.0 1.1 4.2 7.1 1.00 8.2 2
11
0.36
2.4% of PCE SP
by weight of
Cement
00 715 1.7 3.5 7.9 1.8 5.9 9.1 0.85 10.5 1.5
12 10 720 1.5 3.0 7.8 1.7 5.7 8.7 0.88 9.2 1.5
13 20 724 1.4 3.2 7.5 1.7 5.4 9.2 0.90 9.0 1.5
14 30 732 1.3 3.0 6.9 1.5 5.2 9.4 0.87 8.5 1.5
15 40 729 1.1 2.8 6.4 1.4 5.1 9.6 0.89 8.6 1.5
16
0.36
2.2% of PCE SP +
VMA by weight
of Cement
00 652 1.5 4.4 - 1.7 5.6 - 0.84 11.4 1
17 10 700 1.3 3.9 7.6 1.6 5.3 8.0 0.85 10.9 1
18 20 710 1.0 3.7 7.0 2.0 5.0 9.0 0.84 10.5 0.5
19 30 705 1.0 3.4 4.0 1.0 6.0 8.8 0.88 10.4 0.5
20 40 725 0.8 3.3 5.0 1.9 6.0 8.4 0.90 10.2 1

P a g e | 104
Fig 2: Combined Influence of w/b Ratio and Dosage of HRWR on both Spread Diameter and V-funnel Time
Fig 3: Influence of Fly Ash Percentage on Spread Dia at w/b = 0.36
y = 4.0343x2 - 83.889x + 1175.8R² = 0.9726
y = 6.25x2 - 123.75x + 1341.5R² = 0.919
y = 5.7537x2 - 117.64x + 1315.8R² = 0.991
700
710
720
730
740
750
760
770
780
7 8 9 10 11 12
Sp
read
mm
V-funnel Time in Sec
HRWR = 2.8%, w/b = 0.38
HRWR = 2.8%, w/b = 0.36
HRWR = 2.4%, w/b = 0.36
y = -0.0175x2 + 1.225x + 708.75R² = 0.8673
y = -0.0125x2 + 1.055x + 724.75R² = 0.9995
y = -0.035x2 + 2.57x + 676.5R² = 0.9193
650
670
690
710
730
750
770
0 10 20 30 40 50 60
Sp
read
Dia
mm
% Fly Ash
HRWR = 2.4%
HRWR = 2.8%
HRWR + VMA = 2.2%

P a g e | 105
Fig 4: Influence of Fly Ash Percentage on V-funnel Time at w/b = 0.36
Fig 5: SEM Image Showing Ball Milling Effect of FA particles in SCC Mixture
3.2 CORRELATION BETWEEN FLOWABILITY INDEX
The test methods described in (34) are devised specifically for SCC and are mainly definitive. No
correlation has yet been developed between the different flowability parameters to standardize these test methods.
Many researchers in the past have used T-500 and V- funnel time as an indicator of viscosity in case of self-
compacting concrete, and have indicated co-relations between these two parameters. Through the different
flowability test results, an effort has been made to develop a correlation between different flowability parameters
using regression analysis in MINITAB software. All 20 experimental data irrespective of w/b ratio and dosage of
superplasticizers were used to develop the correlation between different flowability parameters. A good correlation
exists between V-funnel time and T-500 time for all SCC mixes with a correlation coefficient R2=0.84, as indicated
y = 0.0007x2 - 0.0605x + 9.775R² = 0.8763
y = 0.001x2 - 0.074x + 9.6R² = 0.9111
y = 0.0005x2 - 0.047x + 11.3R² = 0.9692
7.0
7.5
8.0
8.5
9.0
9.5
10.0
10.5
11.0
11.5
0 10 20 30 40 50 60
V-f
un
nel T
ime
Se
c
% Fly Ash
HRWR = 2.4%
HRWR = 2.8%
HRWR + VMA = 2.2%
P a g e | 106
in Fig 6. Relationship between V-funnel time and T-500 time has also been reported in the past and is presented in
Table 6.
Table 6: Correlation equation between T-500 and VF time
Author Correlation equation R2 value
Beton & Wüstholz (47) 𝑇500 = 0.261 × 𝑉𝐹𝑇𝑖𝑚𝑒 + 0.523 0.77
Felekoğlu & Sarıkahya (48) 𝑉𝐹𝑇𝑖𝑚𝑒 = 2.83 × (𝑇500)2.05 0.87
Safiuddin, Salam, & Jumaat (49) 𝑉𝐹𝑇𝑖𝑚𝑒 = 2.7614 × 𝑇500 + 0.6247 0.92
Savić & Aškrabić (50) 𝑉𝐹𝑇𝑖𝑚𝑒 = 1.666 × 𝑇500 + 7.457 0.86
Present work 𝑉𝐹𝑇𝑖𝑚𝑒 = 6.073 + 0.403 × 𝑇500 + 0.2025(𝑇500)2 0.84
Most of the authors have presented a linear correlation between V- funnel time and T-500 time however
in the present work both quadratic and linear models were tried, and both the models were statistically significant
with 95% confidence level (p<0.05). However, the quadratic model was chosen in the present work as the regression
coefficient was more as compared to the linear model. The prediction plot at a 95% confidence interval is shown
in Fig 7.
Fig 6: Correlation between T500 and V Funnel Time
Fig 7: Prediction Plot for V Funnel Time

P a g e | 107
Spread diameter, in the present work, has also been considered as an indicator of viscosity in case of self-
compacting concrete; hence correlation between spread diameter and V-funnel time and spread dia and T-500 time
has also been developed and is shown in Fig 8 and Fig 9 respectively. Second order polynomial equation fitted best
with high correlation coefficient.
𝑉𝐹𝑇𝑖𝑚𝑒 = − 41.43 + 0.1796 Spread dia − 0.000151 (Spread dia)2 …………………………… (4)
Spread dia = −20.43 + 0.08695𝑇500 − 0.000075(𝑇500)2 …….………………………….….… (5)
Similar expressions between spread diameter and V- funnel time have been reported in the literature
(16,51,52). The prediction plot at a 95% confidence interval is shown in Fig 10 and Fig 11, respectively.
Fig 8: Correlation between V Funnel Time and Spread Diameter
Fig 9: Correlation between T-500 and Spread Diameter
R-squared (adjusted) 80.58% 79.86%
P-value, model <0.005* <0.005*
P-value, linear term 0.307 <0.005*
P-value, quadratic term 0.214 —
Residual standard deviation 0.236 0.241
Statistics Quadratic
Selected Model
Linear
Alternative Model
775750725700675650
4.5
4.0
3.5
3.0
2.5
2.0
spread diameter(mm)
T-50
0(SE
C)
* Statistically significant (p < 0.05)
Linear Model

P a g e | 108
Fig 10: Prediction Plot for V Funnel Time with Spread Diameter
Fig 11: Prediction Plot for T 500 with Spread Diameter
3.3 EFFECT ON COMPRESSIVE STRENGTH
Three different sets of mix proportion were cast to study the influences of the different parameter on the
fresh and hardened properties of SCC. Table 7 presents the descriptive statistics of all 60 cube specimens prepared
to evaluate the compressive strength at 28 days.

P a g e | 109
Table 7: Descriptive Statistics of the Test Samples
w/b PCE-SP
By Weight of Cement Sample Number Mean Std Dev
Normality
Test P Value
0.38 2.80% 15 44.65 1.24 Pass 0.842
0.36 2.80% 15 47.40 1.74 Pass 0.685
0.36 2.40% 15 48.07 1.94 Pass 0.107
0.36 2.20% 15 52.79 1.11 Pass 0.515
The comparative analyses of the results of the cube compressive strength test at 14 days, 28 days and 56
days are presented in Table 8. The compressive strength increased with a decrease in the percentage of the fly ash
and the water-to-binder ratio. These observations are in agreement with the findings of Zhao et al. (53) and Güneyisi
et al. (20). In case of the first set of experiments, where, the dosage of PCE SP was fixed at 2.8% by weight of
cement, the cube compressive strength is on a higher side of w/b ratio 0.36 as compared with w/b ratio 0.38 at both
28 and 56 days. Further, it can be inferred that in the same water to binder ratio, there was an increase in compressive
strength when PCE SP with VMA was used in the trial mixes. The increase observed was almost 10% as compared
to the strength of the trial mixes were only HRWR was used.
From the results, it can be seen that at 56 days, the increase in compressive strength for all the mixes is
almost 25% as compared to that at 28 days strength. This may be due to the slower pozzolanic reaction of the FA
with the Ca(OH)2 of the hydrated cement at an early age. It has been reported (54,55) that at the age of 56 days,
about 15% FA undergoes pozzolanic reaction, forming a gel-like calcium silicate hydrates (CSH) and consequently
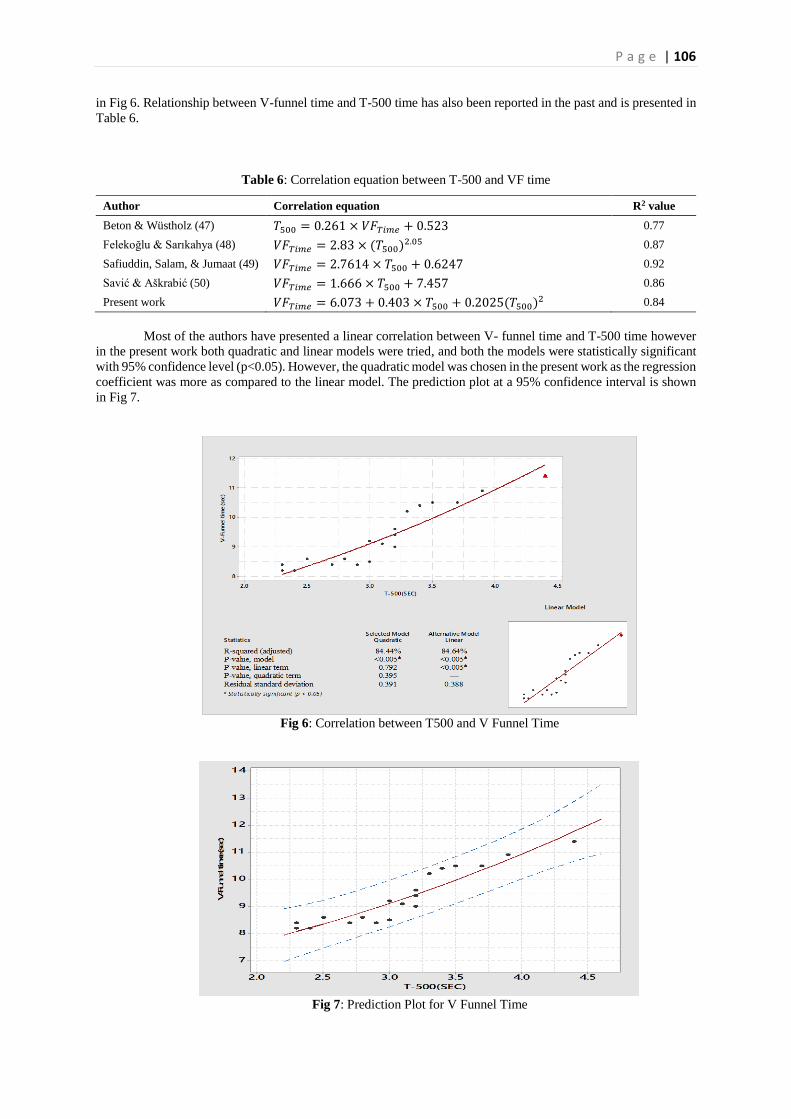
results in about 20% increase in compressive strength. From Fig 12 it can also be inferred that at 30% replacement
of FA with cement, the compressive strength increased by about 7% as compared to 20% replacement of FA by
weight of cement. However, the compressive strength increase is nominal at 40% replacement of FA as compared
to 20% replacement of FA by weight of cement, i.e. the strength decreases by about 3% as compared to 30%
replacement of FA with cement. The same conclusions were drawn in all three sets of experiments.
Table 8: Strength Test Results
Mix
No. w/b Chemical Admixture
% of Fly Ash by
Weight of
Binder
Compressive Strength (MPa)
14 Days 28 Days 56 Days
1 0.38
2.8% PCE SP by
wt of Binder
0 38.50 46.38 57.85
2 0.38 10 25.60 43.12 55.32
3 0.38 20 24.80 44.26 56.25
4 0.38 30 27.59 44.85 62.19
5 0.38 40 26.15 44.63 58.26
6 0.36
2.8% PCE SP by
wt of Cement
0 38.92 47.97 58.63
7 0.36 10 28.20 45.17 57.55
8 0.36 20 29.60 46.32 59.80
9 0.36 30 31.72 49.76 63.80
10 0.36 40 27.60 47.79 61.20
11 0.36
2.4% PCE SP by
wt of Cement
0 36.36 47.48 61.34
12 0.36 10 33.67 47.12 59.92
13 0.36 20 33.90 47.37 60.23
14 0.36 30 35.10 51.26 65.26
15 0.36 40 33.50 47.13 60.12
16 0.36
2.2% PCE SP with
VMA by wt of
Cement
0 37.87 53.26 67.52
17 0.36 10 35.56 51.52 67.82
18 0.36 20 35.77 51.82 68.56
19 0.36 30 36.72 53.86 68.97
20 0.36 40 36.65 53.46 67.76
P a g e | 110
Test results revealed that the main factor affecting the compressive strength of SCC was the w/b ratio. The
incorporation of VMA did not affect compressive strength development. The results presented in Fig 12 shows that
the SCC mixes with PCE-SP with VMA resulted in the least reduction in compressive strength as compared to SCC
mixes with only PCE-SP. This may be attributed to the higher air content of the modified mixes. The same has
been reported by Isik et al. 2014 (56).
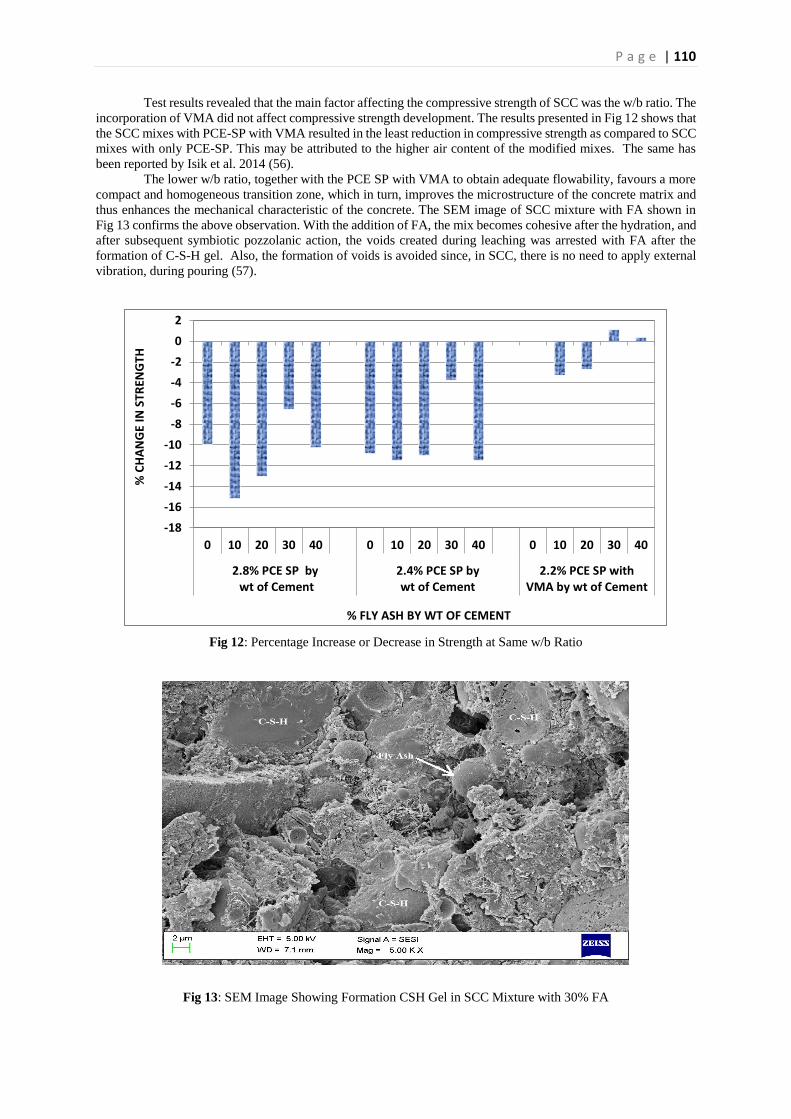
The lower w/b ratio, together with the PCE SP with VMA to obtain adequate flowability, favours a more
compact and homogeneous transition zone, which in turn, improves the microstructure of the concrete matrix and
thus enhances the mechanical characteristic of the concrete. The SEM image of SCC mixture with FA shown in
Fig 13 confirms the above observation. With the addition of FA, the mix becomes cohesive after the hydration, and
after subsequent symbiotic pozzolanic action, the voids created during leaching was arrested with FA after the
formation of C-S-H gel. Also, the formation of voids is avoided since, in SCC, there is no need to apply external
vibration, during pouring (57).
Fig 12: Percentage Increase or Decrease in Strength at Same w/b Ratio
Fig 13: SEM Image Showing Formation CSH Gel in SCC Mixture with 30% FA
-18
-16
-14
-12
-10
-8
-6
-4
-2
0
2
0 10 20 30 40 0 10 20 30 40 0 10 20 30 40
2.8% PCE SP by wt of Cement
2.4% PCE SP bywt of Cement
2.2% PCE SP withVMA by wt of Cement
% C
HA
NG
E IN
STR
ENG
TH
% FLY ASH BY WT OF CEMENT

P a g e | 111
3.4 EFFECT ON SPLIT TENSILE STRENGTH In the present study, the splitting tension of all SCC mixes was assessed, and the results are shown in Fig
14. It clearly indicates that split tensile strength increases with a decrease in w/c ratio. The effect of VMA was most
prominent on split tensile strength test results as VMA helped in increasing the cohesiveness of the SCC mixes.
This is attributed to an improved bond between the aggregates and the paste in the SCC mixtures (57).
Fig 14: Split Tensile Strength Test Results
3.4.1 Relationship between Split Tensile Strength and Compressive Strength
For serviceability of RC structures, the direct or indirect tensile strength of concrete should be used as an
indication of cracking in concrete. The American standard test method (ASTM), (58,59) suggests an indirect
method (splitting tensile strength) to measure tensile strength, however, ASTM has no recommendations for direct
tension test for concrete, as it is challenging to ensure that uniaxial stress along the specimen is evenly applied.
Further, in accordance with MC 2010 and EC 2 (60) the direct tensile strength (𝑓𝑐𝑡) can be converted into the
splitting tensile strength( 𝑓𝑡𝑠) by using a conversion factor Asp, presented in Eq. (6):
𝑓𝑐𝑡 = 𝐴𝑠𝑝 × 𝑓𝑡𝑠 ……………………………………………………………………………….………..……….. (6)
With:
𝐴𝑠𝑝 = 0.9 for all concrete grades according to EC 2.
𝐴𝑠𝑝 = 1.0 for all concrete grades, according to MC 2010.
However, it is not quite clear whether these conversion factors can still be used for SCC. In the present
work splitting tensile strength has been recorded in the lab and to establish the relationship between splitting tensile
strength and cube compressive strength no conversion factor have been considered. Moreover, changes that affect
SCC, such as variations in the mix design or higher fines content in the Cement-Fly or the placing of concrete, can
also modify this relationship (61).
The correlation between splitting tensile strength and cube compressive strength for SCC is reported in
several kinds of literature (3,62–69). Different concrete institutes and researchers have summarized the correlation
between 𝑓𝑡𝑠and cube compressive strength (𝑓𝑐𝑘) by the following general equation:
𝑓𝑡𝑠 = 𝑎0(𝑓𝑐𝑘)𝑎1…………………………………………………………….…………………….……………… (7)
3.0
3.2
3.4
3.6
3.8
4.0
4.2
4.4
0 10 20 30 40 0 10 20 30 40 0 10 20 30 40 0 10 20 30 40
2.8% HRWR by wt ofBinder w/b = 0.38
2.8% HRWR by wt ofCement w/b = 0.36
2.4% HRWR by wt ofCement w/b = 0.36
2.2% HRWR + VMAby wt of Cement
w/b = 0.36
Split
Ten
sile
Str
engt
h M
Pa
% Fly Ash

P a g e | 112
where 𝑓𝑐𝑘 and 𝑓𝑡𝑠 are in MPa; a0 and a1 are regression coefficients. Logarithmic transformation was applied as
the dependency in equation 6 is nonlinear. Equation 7 and equation 8 presents the relationship between 𝑓𝑐𝑘 and
𝑓𝑡𝑠obtained after linear regression.
log10( 𝑓𝑡𝑠) = −0.6925 + 0.760 log10(𝑓𝑐𝑘)…………………..…………………………….………..………… (8)
Equation 7 was transformed into a single variable power equation in the form
𝑓𝑡𝑠 = 0.205(𝑓𝑐𝑘)0.76……………………………………………………………………..….………………..… (9)
The proposed empirical formula (equation 8) to express the relationship between 𝑓𝑐𝑘 and 𝑓𝑡𝑠 of SCC is
presented in Table 9. Table 9 also presents the correlation proposed by ACI 363R -92 (70), ACI 318-95 (71) and
CEB-FIP (72).
Table 9: Proposed Empirical Relationship between Split Tensile Strength and Compressive Strength for SCC
Sl. No. Authors Correlation proposed Remarks Filler material
1 ACI363R -92 (70) 𝑓𝑡𝑠 = 0.59(𝑓𝑐𝑘)0.5 Normal concrete -
2 CEB-FIP (72) 𝑓𝑡𝑠 = 0.301(𝑓𝑐𝑘)0.67 Normal concrete -
3 ACI 318 -95 (71) 𝑓𝑡𝑠 = 0.56(𝑓𝑐𝑘)0.5 Normal concrete -
4 Felekoglu et al. 2007 (73) 𝑓𝑡𝑠 = 0.43(𝑓𝑐𝑘)0.6 SCC Limestone
5 Parra et al. 2011 (74) 𝑓𝑡𝑠 = 0.28(𝑓𝑐𝑘)0.67 SCC Limestone
6 Nikbin et al. 2014 (61) 𝑓𝑡𝑠 = 0.49(𝑓𝑐𝑘)0.5 SCC Limestone
7 Aslani and Nejadi (62) 𝑓𝑡𝑠 = 0.251(𝑓𝑐𝑘)0.712 SCC Fly ash
8 Kim (75) 𝑓𝑡𝑠 = 0.52(𝑓𝑐𝑘)0.5 SCC Fly ash
9 Present work 𝑓𝑡𝑠 = 0.205(𝑓𝑐𝑘)0.76 SCC Fly ash
Fig 15 displays the fitted line plot of equation 7 at a 95% confidence interval. The residual plots shown in
Fig 16 validate the proposed relation. Fig 17 compares the formulae proposed by different codes and researchers
with Equation 8 proposed in the present work. The comparison demonstrates that the relation proposed in the
present work is in the vicinity of the relations proposed by CEB-FIP (72), ACI 318 (71), ACI 363 (70) codes.
Vilanova et al. (57) reported that ACI 318 relations can predict the values of the tensile strength of SCC with
acceptable precision. From the results of this limited study, this code shows a noticeable underestimation of the
SCC tensile strength when compared with the normal concrete.
Fig 15: Relationship between Split Tensile Strength and Compressive Strength

P a g e | 113
Fig 16: Residual Plots for Proposed Relation
Fig 17: Comparison of the Proposed Relation with ACI 363R -92 and CEB-FIP
4. CONCLUSIONS
Based on the results of this experimental work, the following conclusions can be drawn:
1. The combined influence of w/b ratio and dosage of PCE SP on both spread diameter and V-funnel time
of SCC mixes showed a quadratic relation with a high correlation coefficient. At a higher dosage of PCE
SP the spread diameter achieved was near maximum at same w/b ratio, in contrary, the spread diameter
decreased by a reduction in the w/b ratio for the same dosage of PCE SP.
2. The cementing efficiency factor of FA, adopted in the presented work, restored the cementitious content
in the mix. The effect of FA on spread diameter and V-funnel time also showed a quadratic relation with
FA replacement percentage with cement which clearly indicated that V- funnel time decreases with
increase in FA percentage, while spread diameter increases with increase in FA percentage. Thus,
concluding that FA lowers the viscosity of the SCC mixes which results in segregation.
3. Bleeding reduced noticeably when PCE SP with inbuilt VMA was used. The mixes with an adequate
concentration of PCE SP with VMA inhibited fluidity with increased viscosity. In such concrete mixes,
the viscosity built up is promoted due to association and enlargement of polymer chains of VMA at the
low shear rate. This property increases the stability of the concrete and reduces the risk of segregation.
4. A good correlation existed between V-funnel time and T-500 time for all SCC mixes with a correlation
coefficient. Correlation between spread diameter and V-funnel time and spread diameter and T-500 time

P a g e | 114
has also been proposed. Although the models are based on a given set of materials, they can be easily
used to predict the flowability parameters with low scattering between the measured and predicted values.
5. The compressive strength increased with a decrease in the percentage of the fly ash and the water-to-
binder ratio. With the addition of fly ash, it can be seen that the compressive strengths of the SCC mixes
were either almost the same or below that of the control mixes.
6. The cube compressive strength was on a higher side at w/b ratio 0.36 as compared with w/b ratio 0.38
for both 28 and 56 days at same PCE SP content. For the same w/b ratio there was an increase in
compressive strength when PCE SP with VMA was used in the trial mixes. The increase observed was
almost 10% as compared to the strength of the trial mixes were only PCE SP was used. This may be
attributed to the fact that lower w/b ratio, together with the PCE SP with VMA, favours a more compact
and homogeneous transition zone, which in turn, may have improved the mechanical characteristic of the
concrete.
7. The empirical formula proposed in the present work to express the relationship between compressive
strength and split tensile strength of SCC is in close relation with the empirical relations proposed by
different codes. The Residual Plots for Proposed Relation indicates that the proposed equation is a pretty
good fit for the data. However, the values of split tensile strength achieved with the proposed equation
were under predicted because of the effect of FA addition in the SCCs mix.
8. Proposed splitting tensile strength model for SCC mixtures show that there are small differences between
proposed SCC models with normally vibrated concrete.
Based on experimental investigations carried out on self-compacting concrete it is recommended to produce
SCCs with FA, and HRWR with VMA coupled with w/b ratio 0.36. The use of fly ash as replacement of cement
may be used up to 30% by weight of cement in SCC effectively. It is further recommended to concurrently use FA
with other cementitious material like silica fume to achieve early gain in strength. Moreover, the higher powder
content in SCC compared to normally vibrated concrete provides an opportunity to replace the Portland cement
with different types of cementitious materials which can have potential economic and environmental advantages.
REFERENCES 1. Okamura H, Ouchi M. Self-compacting Concrete: Development, Present, and Future. In: Proceedings of
the 1st International RILEM Symposium on Self-compacting Concrete. 1999. p. 3–14.
2. Bharathi V, Subramania RJ V., Regupathy R, Seenivasa C. Workability and strength study of high volume
fly ash self- concrete. Indian Concr J. 2009;83:17–22.
3. De Schutter G, Bartos P, Domone P, Gibbs J. Self-Compacting Concrete. J Adv Concr Technol [Internet].
2008;1(1):5–15. Available from: http://discovery.ucl.ac.uk/41306/
4. Okamura H, Ouchi M. Self-Compacting Concrete. J Adv Concr Technol [Internet]. 2003;1(1):5–15.
Available from: https://www.jstage.jst.go.jp/article/jact/1/1/1_1_5/_article
5. Almuwbber O, Haldenwang R, Mbasha W, Masalova I. The influence of variation in cement
characteristics on workability and strength of SCC with fly ash and slag additions. Constr Build Mater
[Internet]. 2018;160:258–67. Available from: https://doi.org/10.1016/j.conbuildmat.2017.11.039
6. Rols S, Amboise J, Pera J. Development of admixture for self-levelling concrete. Cem Concr Res.
1999;29:261–6.
7. Khayat KH. Viscosity-enhancing admixtures for cement-based materials — An overview. Cem Concr
Compos [Internet]. 1998;20(2–3):171–88. Available from:
http://linkinghub.elsevier.com/retrieve/pii/S0958946598800061
8. Khayat KH, Yahia A. Effect of welan gum-high-range water reducer combinations on rheology of cement
grout. ACI Mater J. 1997;94(5):365–72.
9. Allen F, Best G, Lindroth T. Welan gum in cement compositions. US Patent 5. 1991. p. 004–506.
10. Rao S V, Rao MV., Kumar PR. Effect of Size of Aggregate and Fines on Standard And High Strength
Self Compacting Concrete. J Appl Sci Res [Internet]. 2010;6(5):433–442. Available from:
http://www.aensiweb.com/old/jasr/jasr/2010/433-442.pdf
11. Jayasree C, Santhanam M, Gettu R. Cement-superplasticiser compatibility - Issues and challenges. Vol.
85, Indian Concrete Journal. 2011. p. 48–60.

P a g e | 115
12. Ozawa K, Sakata N, Okamura H. Evaluation of self-incompatibility of fresh concrete using the funnel
test. In: Concrete Library International 25 [Internet]. 1995. p. 59–76. Available from:
http://library.jsce.or.jp/jsce/open/00670/No25/CLI-25-0059.pdf
13. Okamura H OM. Self-compacting concrete: development, present use and future. In: Frst international
conference on self-compacting concrete. 1999. p. 3–14.
14. Siddique R. Effect of fine aggregate replacement with Class F fly ash on the abrasion resistance of
concrete. Cem Concr Res. 2003;33(11):1877–81.
15. Gesoǧlu M, Güneyisi E, Özbay E. Properties of self-compacting concretes made with binary, ternary, and
quaternary cementitious blends of fly ash, blast furnace slag, and silica fume. Constr Build Mater. 2009;
16. Khatib JM. Performance of self-compacting concrete containing fly ash. Constr Build Mater.
2008;22(9):1963–71.
17. Lachemi M, Hossain KMA, Lambros V, Bouzoubaâ N. Development of Cost-Effective Self-
Consolidating Concrete Incorporating Fly Ash, Slag Cement, or Viscosity-Modifying Admixtures. ACI
Mater J. 2003;100(5):419–25.
18. Poon CS, Ho DWS. A feasibility study on the utilization of r-FA in SCC. Cem Concr Res.
2004;34(12):2337–9.
19. Jalal M, Pouladkhan A, Harandi OF, Jafari D. Comparative study on effects of Class F fly ash, nano silica
and silica fume on properties of high performance self compacting concrete. Constr Build Mater.
2015;94:90–104.
20. Güneyisi E, Gesoglu M, Al-Goody A, Ipek S. Fresh and rheological behavior of nano-silica and fly ash
blended self-compacting concrete. Constr Build Mater. 2015;95:29–44.
21. Sonebi M, Bartos P, Zhu W, Gibbs J, Tamimi A. Final report task 4 on the SSC project; project no. BE
96-3801; self-compacting concrete: properties of hardened concrete. Advanced Concrete Masonry Center,
University of Paisley, Scotland, UK. 2000.
22. Yazici H. The effect of silica fume and high-volume Class C fly ash on mechanical properties, chloride
penetration and freeze-thaw resistance of self-compacting concrete. Constr Build Mater. 2008;22(4):456–
62.
23. IS 456. PLAIN AND REINFORCED CONCRETE - CODE OF PRACTICE. Bur Indian Stand. 2000;144.
24. Smith IA. The design of fly ash concretes. Proc Inst Civ Eng [Internet]. 1967;36(4):769–90. Available
from: http://www.icevirtuallibrary.com/doi/10.1680/iicep.1967.8472
25. DIN 1045-1. Structures made of concrete, reinforced concrete and prestressed concrete. Ger Inst Stand
(Deutsches Inst für Normung). 2008;
26. British Standards Institution. BS 3892: Pulverised-fuel ash for use as a cementitious component in
structural concrete. Pulverised-fuel ash. 1982;
27. IS: 8112. Ordinary Portland cement, 43 grade-Specification. Bur Indian Stand New Delhi. 1989;
28. IS:4031. IS: 4031-1996 (PART 1 to 15) Indian Standard Method of Physical Tests for Hydraulic Cement.
Bur Indian Satandards. 1996;
29. IS 3812(part-1):2003. Indian Standard Pulverized Fuel Ash- Specification. Bur Indian Stand New Delhi,
India. 2003;3812(October).
30. IS 383. Specification for Coarse and fine aggregates from natural sources for concrete. IS 383:1970,
editor. Bur Indian Stand. 1970th ed. 2016;
31. IS: 9103. Indian Standard Concrete Admixtures – Specification. Bur Indian Stand New Delhi. 1999;
32. IS 10262. Recommended Guidelines for concrete mix design. Bur Indian Stand. 2009;
33. Rai B, Kumar S, Satish K. Effect of Quarry Waste on Self-Compacting Concrete Containing Binary
Cementitious Blends of Fly Ash and Cement. Adv Mater Sci Eng. 2016;2016.
34. EFNARC. Specification and Guidelines for Self-Compacting Concrete. Rep from EFNARC [Internet].
2002;44(February):32. Available from:
http://scholar.google.com/scholar?hl=en&btnG=Search&q=intitle:Specification+and+Guidelines+for+S

P a g e | 116
elf-Compacting+Concrete#0
35. European Committee for Standardization (CEN). EN 206 2013. Concrete — Specification, performance,
production and conformity. European Standard 2013.
36. IS: 516. Method of test for strength of concrete. Bur Indian Stand New Delhi. 1959;
37. IS: 5816. Splitting Tensile Strength of Concrete Method of Test. Bur Indian Stand New Delhi. 1999;
38. ASTM International. ASTM C1611-09 Standard Test Method for Slump Flow of Self-Consolidating
Concrete. ASTM Stand. 2009;04.02:1–6.
39. M L Gambhir. Concrete Technology. Tata McGraw-Hill Education; 2004. 658 p.
40. Nagataki S, Fujiwara H. Self-Compacting Property of Highly Flowable Concrete. ACI Spec Publ.
154:301–14.
41. Khayat KH, Manai K, Trudel A. In Situ Mechanical Properties of Wall Elements Cast Using Self-
consolidating Concrete. Mater J. 94(6):492–500.
42. Bouzoubaâ N, Lachemi M. Self-compacting concrete incorporating high volumes of class F fly ash:
Preliminary results. Cem Concr Res. 2001;31(3):413–20.
43. Lachemi M, Hossain KMA, Lambros V, Nkinamubanzi PC, Bouzoubaâ N. Self-consolidating concrete
incorporating new viscosity modifying admixtures. Cem Concr Res. 2004;34:917–26.
44. Bouzoubaâ, N L. Self Compacting Concrete Incorporating High-Volumes of Class F Fly Ash :
Preliminary Results. Cem Concr Res. 2001;
45. Nehdi M, Pardhan M, Koshowski S. Durability of self-consolidating concrete incorporating high-volume
replacement composite cements. Cem Concr Res. 2004;34(11):2103–12.
46. Almuwbber O, Haldenwang R, Mbasha W, Masalova I. The influence of variation in cement
characteristics on workability and strength of SCC with fly ash and slag additions. Constr Build Mater.
2018;160:258–67.
47. Von Selbstverdichtendem Beton F, Wüstholz T. Fresh properties of self-compacting concrete (SCC).
2003;14.
48. Felekoğlu B, Sarıkahya H. Effect of chemical structure of polycarboxylate-based superplasticizers on
workability retention of self-compacting concrete. Constr Build Mater. 2008;22(9):1972–80.
49. Safiuddin M, Salam M a., Jumaat MZ. Effects of recycled concrete aggregate on the fresh properties of
self-consolidating concrete. Arch Civ Mech Eng. 2011;11(4):1023–41.
50. Savić A, Aškrabić M. Forming a correlation among the properties of fresh self-compacting concrete using
Fuzzy least Square model. Elektron časopis građevinskog Fak Osijek. 2016 Jul;7(12):66–75.
51. Liu M. Self-compacting concrete with different levels of pulverized fuel ash. Constr Build Mater.
2010;24(7):1245–52.
52. Safiuddin M, West JS, Soudki KA. Hardened properties of self-consolidating high performance concrete
including rice husk ash. Cem Concr Compos [Internet]. 2010;32(9):708–17. Available from:
http://dx.doi.org/10.1016/j.cemconcomp.2010.07.006
53. Zhao H, Sun W, Wu X, Gao B. The properties of the self-compacting concrete with fly ash and ground
granulated blast furnace slag mineral admixtures. J Clean Prod. 2015;95:66–74.
54. Kim BG, Aiitcin PC, Jiang S. Effect of Sodium Sulfate Addition on Properties of Cement Pastes
Containing Different Molecular Weight PNS Superplasticizers. Spec Publ [Internet]. 2000;195:485–504.
Available from:
https://www.concrete.org/publications/internationalconcreteabstractsportal.aspx?m=details&ID=9930
55. Zhang X, Han J. The effect of ultra-fine admixture on the rheological property of cement paste. Cem
Concr Res. 2000;30(5):827–30.
56. Isik IE, Ozkul MH. Utilization of polysaccharides as viscosity modifying agent in self-compacting
concrete. Constr Build Mater [Internet]. 2014;72:239–47. Available from:
http://dx.doi.org/10.1016/j.conbuildmat.2014.09.017
57. Vilanova A, Fernandez-Gomez J, Landsberger GA. Evaluation of the mechanical properties of self

P a g e | 117
compacting concrete using current estimating models: Estimating the modulus of elasticity, tensile
strength, and modulus of rupture of self compacting concrete. Constr Build Mater [Internet].
2011;25(8):3417–26. Available from: http://dx.doi.org/10.1016/j.conbuildmat.2011.03.033
58. ASTM Standard C78/C78M. Standard Test Method for Flexural Strength of Concrete (Using Simple
Beam with Third-Point Loading). ASTM Int West Conshohocken, PA, 2018. 2018;
59. ASTM C496/C496M. ASTM C496 Standard Test Method for Splitting Tensile Strength of Cylindrical
Concrete Specimens. ASTM Int West Conshohocken, PA, 2017. 2017;
60. EC2. Eurocode 2: Design of concrete structures. EN1992. 1992;1(1).
61. Nikbin IM, Beygi MHA, Kazemi MT, Vaseghi Amiri J, Rabbanifar S, Rahmani E, et al. A comprehensive
investigation into the effect of water to cement ratio and powder content on mechanical properties of self-
compacting concrete. Constr Build Mater. 2014;57:69–80.
62. Aslani F, Nejadi S. Mechanical properties of conventional and self-compacting concrete: An analytical
study. Constr Build Mater. 2012;
63. Aslani F. Effects of specimen size and shape on compressive and tensile strengths of self-compacting
concrete with or without fibres. Mag Concr Res. 2013;
64. Craeye B, Van Itterbeeck P, Desnerck P, Boel V, De Schutter G. Modulus of elasticity and tensile strength
of self-compacting concrete: Survey of experimental data and structural design codes. Cem Concr
Compos [Internet]. 2014;54:53–61. Available from:
http://dx.doi.org/10.1016/j.cemconcomp.2014.03.011
65. Bonen D, Deshpande Y, Olek J, Shen L, Struble L, Lange DA. Robustness of self-consolidating concrete.
In: In: De Schutter G, Boel V, editors 5th International RILEM Symposium on Self-Compacting Concrete
Ghent, Belgium: RILEM Publications SARL. 2007. p. 33–42.
66. Domone PL. A review of the hardened mechanical properties of self-compacting concrete. Cem Concr
Compos. 2007;29(1):1–12.
67. Holschmacher K, Klug Y. A Database for the Evaluation of Hardened Properties of SCC . Lacer. 2002;
68. Topçu İB, Sarıdemir M. Prediction of compressive strength of concrete containing fly ash using artificial
neural networks and fuzzy logic. Comput Mater Sci. 2008;
69. Topçu IB, Uygunoǧlu T. Effect of aggregate type on properties of hardened self-consolidating lightweight
concrete (SCLC). Constr Build Mater. 2010;
70. ACI Committee 363. State-of-the-Art Report on High-Strength Concrete. Am Concr Inst.
1997;92(Reapproved).
71. ACI Committee 318. Building Code Requirements for Structural Concrete (ACI 318-95) and commentary
(ACI 318R-95). Am Concr Inst [Internet]. 1995;552(d):503. Available from:
http://www.concrete.org/Publications/InternationalConcreteAbstractsPortal.aspx?m=details&i=7919
72. CEB-FIP C. Model Code 1990. Com Euro-International Du Beton, Paris. 1991;87–109.
73. Felekoǧlu B, Türkel S, Baradan B. Effect of water/cement ratio on the fresh and hardened properties of
self-compacting concrete. Build Environ. 2007;42(4):1795–802.
74. Parra C, Valcuende M, Gómez F. Splitting tensile strength and modulus of elasticity of self-compacting
concrete. Constr Build Mater. 2011;25(1):201–7.
75. Kim YH. PhD Thesis; Characterization of self-consolidating concrete for the design of precast,
pretensioned bridge superstructure elements. Texas A&M University; 2008.