Embed Size (px)
Citation preview

IJRET: International Journal of Research in Engineering and Technology eISSN: 2319-1163 | pISSN: 2321-7308
_______________________________________________________________________________________
Volume: 06 Issue: 07 | Jul-2017, Available @ http://www.ijret.org 85
INFLUENCE ON BEARING PRESSURE OF SHALLOW FOOTING
RESTING ON GEOGRID REINFORCED DOUBLE LAYERED SOIL
SYSTEM
J. Sudheer Kumar1, Love Sharma2
1Assistant Prof., Department of Civil Engg, DAVIET, Jalandhar, Punjab, India 2P.G. Student, Department of Geotechnical Engg, DAVIET, Jalandhar, Punjab, India
Abstract Model test was conducted to investigate the effect of geogrid reinforcement on bearing pressure of strip footing resting on sand
overlay on clayey soil stabilized with fly ash. Various percentages of fly ash mixed with clayey soil and found the optimum
proportion. The optimum percentage of fly ash mixed with clay and then used as a second layer in the model test. Experiments
were conducted on model test of strip footing, calculated the bearing pressure of double layer soil system without geogrid, with
geogrid at the interface level and at designated levels within the sand layer. To check the different parameters contributing to
their performance using model test of tank size is 830mm x 680mm x 630mm. The parameters investigated in this study include
H/W (thickness of top sandy layer to width of footing), x/W (depth of the 1st layer of geogrid to width of footing), d/W (spacing
between consecutive geogrid layers to width of footing), l/W (length of the geogrid layer to width of footing). The effect of
different H/W ratios and no. of geogrid layers (n) on the bearing pressure ratio (BPR) and settlement reduction ratio (SRR) were
investigated. Based on the Atterberg’s limit the optimum mix obtained is 90% clay and 10% fly ash. The optimum mix was used
as bottom layer in the model tank. The result indicates that bearing pressure increases with increasing the H/W ratio and n
values. The bearing pressure calculated without geogrid at three different materials like clay alone, optimum mix of clay and fly
ash and double layers (sand, optimum mix of clay and fly ash) are 104.1, 106.8 and 187.5 kN/m2 respectively. Geogrid
reinforcement used at the interface (n=1) and at two different levels within sand layer (n=2, 3), the corresponding bearing
pressure values are 270 kN/m2, 315 kN/m2 and 636.7 kN/m2 respectively. The bearing pressure for the soil increases with H/W =
0.5, 1, 1.5 and 2, the average values are 12.35%, 35.76%, 75.56% and 230.83% respectively. It was found that the use of geogrid
at interface and multiple layers has a considerable effect on the bearing pressure. Use of geogrid layers in the granular overlay
has significant effect on Bearing pressure ratio (BPR) & Settlement reduction ratio (SRR).
Keywords: Model test, optimum mix, geogrid, bearing pressure, SRR.
--------------------------------------------------------------------***---------------------------------------------------------------------
1. INTRODUCTION
The design of foundation governs the two different
requirements, one is the ultimate bearing pressure of soil and
other is settlement within permissible limits. Low bearing
pressure and high settlement behaviour of expansive soils is
the challenge for the engineers. There are number of
techniques are available to control/improve the properties of
soil (low bearing pressure, high compressibility, settlement,
etc.). Soil Stabilization & Soil Reinforcement are the two
different techniques which helps us to improve its
properties.
The bearing pressure of different footings on expansive soil
can be increased significantly by placing a layer of granular
fill of limited thickness with geogrid reinforcement at
granular fill-expansive soil interface (Krishnaswamy et al.
2000; Alawaji 2001; Das et al. 2003; Deb et al. 2011; Ornek
et al. 2012; Mahallawy and Rashed 2012). The improved on
bearing pressure ratios for strip footing of various granulated
blast furnace slag fill thickness and number of geogrid
layers in granular slag fill overlay on soft soil (Tripathi and
Yadu (2014). Experimental and numerical investigations
conducted on bearing pressure of circular footing on
geogrid-reinforced compacted granular fill layer overlying
on natural clay, the degree of improvement depends on
thickness of granular fill layer, properties and configuration
of geogrid layers (Demir et al. 2014). Pressure – settlement
behaviour and ultimate bearing pressure of strip footing
resting on top of fly ash slope can be enhanced by the
presence of geogrid reinforced layer (Jha et al. 2009). The
behaviour of shallow footing’s on an upper layer of
processed cemented soil that overlies at layer of weak
bonded residual soil with a high void ratio, as H/D
(thickness of cemented soil to weak soil) increases, the
load–settlement response becomes stiffer and stronger
(Thome et al. 2005).
2. MATERIAL AND LABORATORY MODEL
TEST
The sand, clay, flyash and geogrid are the basic materials
that are used in this research study. Model tank of
dimensions 830mm x 680mm x 630mm is used throughout
the investigation. The clayey soil (Fig. 1) used in this
research is collected from Kapurthala, Punjab, India and it is

IJRET: International Journal of Research in Engineering and Technology eISSN: 2319-1163 | pISSN: 2321-7308
_______________________________________________________________________________________
Volume: 06 Issue: 07 | Jul-2017, Available @ http://www.ijret.org 86
classified as highly compressible clay (CH) as for the
unified soil classification system (USCS). The properties of
the original clay are presented in Table. 1.
Fig. 1 Clayey soil Fig. 2. SEM image of clay at 2000 magnification
Fig. 2. SEM image shows that the morphological
characteristics of clayey soil, it shows the shapes of the
particles are rounded and rough angular surface at lower
magnification level, but higher magnification level shows
flat and smooth plate like structure surface. As per EDS
(Energy dispersive spectrum) investigation, chemical
composition of clayey soil presented in Table 2.
Table.1 Geotechnical properties of clay
Properties Value
Specific Gravity 2.74
Liquid Limit (%) 50.4
Plastic Limit (%) 26.6
Plasticity Index 23.8
OMC, (%) 10.4
MDD, (g/cc) 2.03
Classification as per USCS CH*
UCS (kN/m2) 88
CBR (%) 1.3
*CH = Clay of high compressibility
Table.2: Chemical Compound of Clayey Soil (as per EDS), EDS Image
2.1 Fly Ash
The class F fly ash collected from Guru Gobind Singh Super
Thermal Plant at Ropar, Punjab, India. As per EDS
investigation chemical composition was observed and
submitted in Table 3.

IJRET: International Journal of Research in Engineering and Technology eISSN: 2319-1163 | pISSN: 2321-7308
_______________________________________________________________________________________
Volume: 06 Issue: 07 | Jul-2017, Available @ http://www.ijret.org 87
Table 3: Chemical Compound of Fly ash (as per EDS), EDS image
2.2 Sand
River sand is used in the study and it is classified as poorly
graded sand (SP) by Unified Soil Classification System
(USCS). Table. 4. Shows the engineering properties of sand.
Table 4: Properties of Sandy Soil
2.3 Geogrid
Polypropylene geogrid bought from M/s Strata Geosystem
(India) pvt. ltd, Mumbai, India. Uniaxial geogrid (SGi-040)
used as reinforcing element. Table. 5 show the properties of
geogrid SGi-040.
Table .5: Specification of geogrid-SGi-040: courtesy M/S Strata Geosystems (India) Pvt. Ltd, Mumbai, India
Properties Value
Mechanical properties
Tensile strength (ASTM D 6637) MD 40 kN/m
CMD 20 kN/m
Creep Reduction Factor (at 200C, 114 years design life) 1.47
Creep limited strength MD 27.2 kN/m
Partial Factor Installation Damage ASTM D 5818
In clay, silt or sand 1.07
In sandy gravel 1.07
In gravel 1.35
Grid Aperture sizes MD 60mm
CMD 23mm

IJRET: International Journal of Research in Engineering and Technology eISSN: 2319-1163 | pISSN: 2321-7308
_______________________________________________________________________________________
Volume: 06 Issue: 07 | Jul-2017, Available @ http://www.ijret.org 88
2.4 Model Tank
The model tank as shown in fig.4a was used to determining
the bearing pressure and settlement of strip footing in the
laboratory. Tank is fabricated with the 12mm thick mild
steel plates; the size of the tank is 830 mm (Lt) x 680mm
(Bt) x 630mm (Dt). The bottom and side plates of the tank
are stiffened by using steel angle sections at the top, bottom
and middle of the tank to avoid any lateral yielding during
soil compaction and while applying load. The inner surfaces
of the tank were smooth to reduce the side friction. The load
on the footing is applied by a hydraulic jack; settlement of
the footing is measured by a set of dial gauges of sensitivity
0.02 mm.
Fig 4a: Model Tank Fig 4b: Model Footing
2.5 Model Footing
Footing dimensions are 600mm x 100mm x 100mm (length,
width and depth) used in the tank. Footing sizes are selected
based on the tank’s dimensions. It was made in a way that
its width is less than 6.5 times the depth of the tank, so that
the effect of the loading should not reach to the walls of
tank. Fig. 4b shows the pictorial view of model footing.
3. EXPERIMENTAL INVESTIGATION
Geotechnical experiments were conducted for finding the
optimum proportion of the fly ash with clayey soil. The Fly
ash mixed with clay at various percentages of 10%, 20% and
30% and then determined the Atterberg’s limits, compaction
characteristics and uniaxial compressive strength.
3.1 Placement of Geogrid
In case of reinforced sand bed, it is very essential to decide
the magnitude of (x/W), (d/W), (H/W), (l/w) and (n) to take
the maximum advantage in bearing pressure of reinforced
sand. After going through several literatures, for strip
footing it has been found that (x/W) between 0.5 to 1.5,
(l/W) is 8, and (H/W) lies between 0.5 to 2.0. By keep the
above factor in consideration, parameters are fixed as (x/W)
= 0.5, (l/W) = 8.0 & (d/W) = 0.5 and (H/W) = 0.5, 1.0, 1.5,
2.0. Fig. 5 shows the arrangement of geogrid with different
parameters.

IJRET: International Journal of Research in Engineering and Technology eISSN: 2319-1163 | pISSN: 2321-7308
_______________________________________________________________________________________
Volume: 06 Issue: 07 | Jul-2017, Available @ http://www.ijret.org 89
Fig. 5: Geometric parameters of a footing resting on reinforced sandy layer overlay on clay mixed with flay ash
4. TESTS SERIES
A series of tests were conducted in model tank on clayey
soil alone, clay mixed with fly ash (optimum) and double
layered soil at unreinforced condition. Using geogrid
reinforcement three tests were performed. Table 6 shows the
series of tests conducted.
Table. 6: Scheme of tests in model tank
Series Descriptions Variable Parameters Constant Parameters
A Unreinforced clayey soil Fly ash = 0%, 10%. MDD & OMC
B
Unreinforced sand fill overlay on
fly ash mixed clayey soil
H/W = 0.5, 1.0, 1.5, 2.0. RD = 60%
C Reinforced sand fill overlay on fly
ash mixed clayey soil
n = 1, 2, 3.
H/W = 1.5, RD = 60%,
x/W = d/W = 0.50, l/W = 8
4.1 Test Series A
Two numbers of tests were performed, one with pure clayey
soil and other clay mixed with fly ash (optimum). In series
A for first test, tank is completely filled with the clayey soil,
whereas in second test, tank is filled with uniform mix of
clay and 10% fly ash. Both the cases soil compacted at
MDD & OMC values of heavy compaction test. Nuclear
density meter used to check the MDD & OMC values in the
tank. Load applied through the hydraulic jack then
calculated the pressure versus settlement values.
4.2 Test Series B
It is double layer system consists of sandy layer overlay the
uniform mixed clay with 10% fly ash without any geogrid
reinforcement. Four tests were conducted with four H/W
ratios (i.e. H/W=0.5, H/W=1.0, H/W=1.5 & H/W=2.0). H/W
is the top sandy layer thickness to width of footing.
4.3 Test Series C
Sand thickness taken as 150mm (constant, H/W =1.5) as a
first layer, second layer is clay mixed with 10% fly ash.
Geogrid placed at interface level and x/W, d/W is equal to
0.5 (i.e. n=1, n=2 & n=3). The 60% relative density of sand
used for test series B and C.
Fig. 6 shows the pattern of the tank tests without
reinforcement and with reinforcement.
(a)

IJRET: International Journal of Research in Engineering and Technology eISSN: 2319-1163 | pISSN: 2321-7308
_______________________________________________________________________________________
Volume: 06 Issue: 07 | Jul-2017, Available @ http://www.ijret.org 90
(b)
Fig. 6: c/s of model test (a) without reinforcement (b) with
reinforcement
5. RESULTS AND DISCUSSION
Atterberg’s limit test performed with clayey soil varying fly
ash content 0%, 10%, 20% and 30 %, and the results are
shown in table 5 and fig. 7. Liquid limit (LL) & plastic limit
(PL) decreases at 10% fly ash and after that they increased
with 20% & 30% fly ash. Fly ash inclusion diminished the
clay size fraction of soil in view of flocculation of the clay
particles by cementation. The increase in trend of
Atterberg’s limit is may be due to increase in more fines.
Table 5: Atterberg limits of soil–flyash mixtures
S.
No. Soil Type
Liquid Limit
(LL) (%)
Plastic Limit
(PL) (%)
Plasticity
Index (PI)
MDD
(g/cc) OMC (%)
1. Clay 50.4 26.7 23.7 2.03 10.4
2. 90% Clay + 10% FA 42.5 18.7 23.8 1.92 10.5
3. 80% Clay + 20% FA 48.0 20.0 28.0 1.84 14.5
4. 70% Clay + 30% FA 49.0 26.7 22.3 1.79 15.4
Fig. 7 Variation of Atterberg’s limits with fly ash (%)
5.1 Compaction Test
The variation of the MDD (maximum dry density) and
OMC (optimum moisture content) with fly ash content as
shown in Fig. 8. The MDD of original clay soil is 2.03 g/cc
and clay with 10%, 20% & 30% fly ash conten t were 1.92,
1.84 & 1.79 g/cc, MDD decreases with increasing content of
fly ash and OMC slightly increases with addition of fly ash.

IJRET: International Journal of Research in Engineering and Technology eISSN: 2319-1163 | pISSN: 2321-7308
_______________________________________________________________________________________
Volume: 06 Issue: 07 | Jul-2017, Available @ http://www.ijret.org 91
Fig. 8 MDD and OMC for clay uniform mix with fly ash
The reason of decrease in dry density may be due to
flocculation and agglomeration process, it will change the
texture of the mixed soil and due to which it cover large
space into the soil particles and increase water holding
capacity. Increment of OMC may be fineness of fly ash,
which caused an enlarged void ratio in soil mixtures.
5.2 Pressure V/S Settlement
Result of model tests are plotted in the form of pressure-
settlement curve, as shown in Fig.9 to Fig.11. Footing size
(600mm x 100mm x 100mm) and tank dimensions (830mm
x 680mm x 630mm) are kept constant in all cases, and the
variables are H/W, d/W, x/W, l/W & n. The total nine
numbers of model tests were conducted on test series A, B
and C.
5.3 Pressure-Settlement Characteristics
The results of test series are presented in terms of pressure -
settlement, bearing pressure ratio (BPR) and settlement
reduction ratio (SRR). To calculate the bearing pressure
ratio, the following equation was used (Binquet and Lee)
(1975).
Where:-
qR = Ultimate bearing pressure of unreinforced (or)
reinforced soil.
qo = Ultimate bearing pressure of clayey soil (i.e. flyash
mixed clayey soil)
Where:-
SR = Settlement of unreinforced/reinforced soil
So = Settlement of clayey soil (i.e. flyash mixed clayey soil)
5.4 Result of Test Series A
The pressure-settlement curves for test series A are shown in
fig. 9.

IJRET: International Journal of Research in Engineering and Technology eISSN: 2319-1163 | pISSN: 2321-7308
_______________________________________________________________________________________
Volume: 06 Issue: 07 | Jul-2017, Available @ http://www.ijret.org 92
Fig. 9 Pressure-Settlement curves of unreinforced clay and clay mixed with 10% fly ash
From the graph, it can concludes that the bearing pressure of
original clay is slightly less than to that of clay mixed with
10% fly ash, but settlement in original clay is more than the
fly ash mixed clayey soil. The ultimate bearing pressure is
104.10 kN/m2 for original clay and 106.80 kN/m2 for fly ash
mixed clayey soil. The bearing pressure for fly ash mixed
clayey soil slightly increases with an average of 2.59%.
Reason may be due to pozzolanic reaction of the fly ash.
5.5 Result of Test Series B
Test series B, the effect of double layer soil system on
bearing pressure of the footing on without reinforcement
case was investigated. The thickness of sandy layer was
changed as H/W= 0.5, 1.0, 1.5 & 2.0. The relative density of
sandy soil was 60%. The pressure –settlement curves are
published in Fig.10.
Fig. 10 Pressure - Settlement curves of H/W ratios

IJRET: International Journal of Research in Engineering and Technology eISSN: 2319-1163 | pISSN: 2321-7308
_______________________________________________________________________________________
Volume: 06 Issue: 07 | Jul-2017, Available @ http://www.ijret.org 93
From Fig.10 indicates the increase in bearing pressure with
double layer system i.e. sandy soil, uniform mix of clay with
10% of fly ash. The average increasing values of bearing
pressure with the original clayey soil are 12. 35%, 35.76%,
75.56% and 230.83% for H/W = 0.5, 1, 1.5 & 2 respectively.
This may be due to the shear parameter angle of internal
friction and stiffness of sandy soil contributing to the load
increment. It is shows that among the four H/W ratios,
H/W=2.0 indicate the maximum improvement in bearing
pressure of soil, but beyond H/W=1.5 it was observe that the
settlement value doesn’t decreases. Das et al. (2005) similar
results published in strip footing supported by the sandy soil.
5.6 Test Series C
The effect of geogrid reinforcement in sandy layer overlay
on flyash mixed clayey soil was investigated. The thickness
of sandy layer is 150 mm (i.e. H/W = 1.5) and place three
layers of geogrid at three different thickness. Variations of
pressure – settlement curves published in Fig.11.
Fig.11. Pressure - settlement curves of number of geogrid layers (n)
With the provision of geogrid reinforcement at the interface
and in sand layer, the load carrying capacity increased with
that of unreinforced case. Fig.11 indicates the bearing
pressure of the reinforced soil increases from layer n = 0 to
layer n = 3. The bearing pressure value lies between 187.5
kN/m2 to 636.7 kN/m2 for n = 0 and n = 3 respectively. The
bearing pressure increases to 80% from original clay (single)
to double layer without geogrid, 239% from double layered
of without geogrid to three layers of geogrid. Reason may be
due to interlocking nature of geogrid, tensile strength of the
geogrid and stiffness of the material. The graph indicates
slight increase in the settlement value in case of number of
layer of geogrid is three (n=3).
6. BEARING PRESSURE RATIO (BPR)
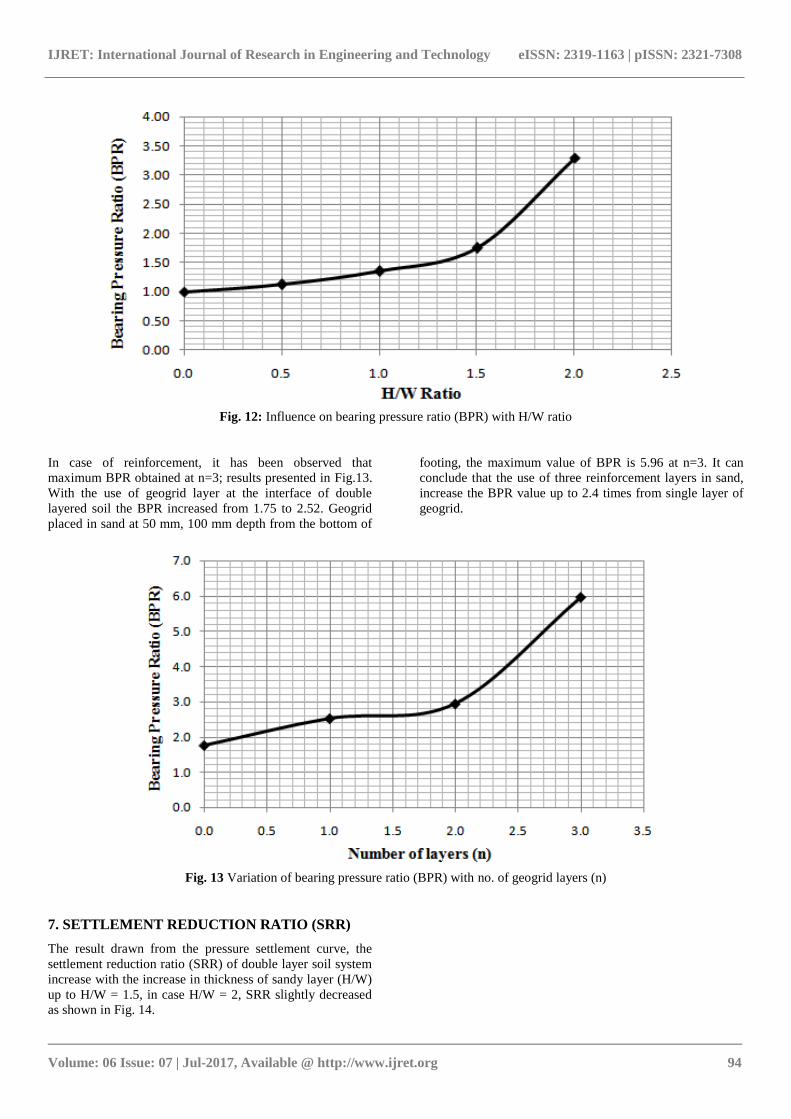
Fig.12 presents the variation of bearing pressure ratio (BPR)
with different H/W ratios at unreinforced case. It is observed
that if the thickness of sandy layer increases the BPR value
was increased. The maximum value of BPR is obtained at
H/W =2.0
IJRET: International Journal of Research in Engineering and Technology eISSN: 2319-1163 | pISSN: 2321-7308
_______________________________________________________________________________________
Volume: 06 Issue: 07 | Jul-2017, Available @ http://www.ijret.org 94
Fig. 12: Influence on bearing pressure ratio (BPR) with H/W ratio
In case of reinforcement, it has been observed that
maximum BPR obtained at n=3; results presented in Fig.13.
With the use of geogrid layer at the interface of double
layered soil the BPR increased from 1.75 to 2.52. Geogrid
placed in sand at 50 mm, 100 mm depth from the bottom of
footing, the maximum value of BPR is 5.96 at n=3. It can
conclude that the use of three reinforcement layers in sand,
increase the BPR value up to 2.4 times from single layer of
geogrid.
Fig. 13 Variation of bearing pressure ratio (BPR) with no. of geogrid layers (n)
7. SETTLEMENT REDUCTION RATIO (SRR)
The result drawn from the pressure settlement curve, the
settlement reduction ratio (SRR) of double layer soil system
increase with the increase in thickness of sandy layer (H/W)
up to H/W = 1.5, in case H/W = 2, SRR slightly decreased
as shown in Fig. 14.

IJRET: International Journal of Research in Engineering and Technology eISSN: 2319-1163 | pISSN: 2321-7308
_______________________________________________________________________________________
Volume: 06 Issue: 07 | Jul-2017, Available @ http://www.ijret.org 95
Fig. 14: Variation of SRR with H/W ratios
In case of geogrid reinforcement, SRR significantly
increases compare to that of without reinforcement. Fig.15
indicates the reduction ratio of settlement increases with
number of geogrid layer (n) up to two, after that author
observed SRR slightly decreases with three layers of
geogrid. The SRR increases about 13.5% from H/W= 1.5 of
without reinforcement to geogrid at interface.
Fig. 15: Variation of SRR with number of geogrid layers (n)
8. IMPROVEMENT FACTOR (IF)
The term improvement factor is comparison of bearing
pressure at different settlement values. Improvement factor
(IF) is the ratio of bearing pressure at reinforced /
unreinforced (PR) to the bearing pressure on clayey soil (PO)
at different settlement values.
Fig. 16 indicates the variations of IF for different H/W
values at different settlement levels. IF increases with an
increase in H/W ratio up to H/W=1.5 at same settlement
value but after H/W is at 1.5 to 2.0 IF decreases from 8.37 to
7.69.

IJRET: International Journal of Research in Engineering and Technology eISSN: 2319-1163 | pISSN: 2321-7308
_______________________________________________________________________________________
Volume: 06 Issue: 07 | Jul-2017, Available @ http://www.ijret.org 96
Fig. 16 Variation of improvement factor (IF) with H/W ratio
Fig.17 is the variation of Improvement factor (IF) for n
values at different settlement levels. Due to the
reinforcement placement the value of IF increases from 8.37
to 9.42. The IF value varies from 8.37 for n= 0 to 9.42 for
n=3 at 1mm settlement and 2.16 for n=0 to 7.66 for n=3 at 6
mm settlement.
Fig. 17: Variation of IF with number of geogrid layers (n)
9. CONCLUSION
From the optimization of fly ash quantity with clay to model
tests investigation, the following concluding remarks may
draw.
1. Based on the consistency limits test results, the
optimum mix obtained is of 90% clay + 10% flyash,
beyond this percentage water content increases.
2. The bearing pressure of clay with 10% fly ash is
slightly greater than the clay soil alone. Due to
pozzolanic action it may also increase.
3. The bearing pressure of the two layers (sand and
stabilized clay) is better than the stabilized clay alone at
unreinforced case.
4. The presence of sand on clayey soil improves the load-
carrying capacity and decreases the settlement, the
thickness of sand layer up to H/W=1.5 effective in
settlement perspective.
5. The effect of geogrid reinforcement in sand increases
the bearing pressure and decreases the settlement up to
two layers of geogrid i.e. n = 2.
6. Bearing pressure ratio is maximum at H/W = 2 for
unreinforced case and with three number of geogrid
layers. SRR is increases up to H/W is 1.5 for
unreinforced case and two number of geogrid layers.

IJRET: International Journal of Research in Engineering and Technology eISSN: 2319-1163 | pISSN: 2321-7308
_______________________________________________________________________________________
Volume: 06 Issue: 07 | Jul-2017, Available @ http://www.ijret.org 97
ACKNOWLEDGEMENT
The authors wish to gratefully acknowledge the support of
M/s Strata Geosystem India, Pvt Ltd, Mumbai regarding
geogrid supply. The help of geotech laboratory staff of
DAVIET is gratefully acknowledged. The authors also
acknowledge the DAV managing committee.
REFERENCES
[1] Adamska, K. Z. 2008. Laboratory compaction of fly
ash and fly ash with cement additions, Journal of
Hazardous Materials 151 481–489, Elsevier Ltd.
[2] Alawaji, H. A. 2001. Settlement and bearing capacity
of geogrid-reinforced sand over collapsible soil,
Geotextiles and Geomembranes 75-88, Elsevier
Science Ltd.
[3] Bhuvaneshwari, S., Robinson, R. G. and Gandhi, S.
R. 2005. Stabilization of expansive soils using flyash,
Fly Ash Utilization Programme (FAUP), TIFAC.
[4] Consoli, N. C., Rosa, F. D. andFonini, A. 2009. Plate
Load Tests on Cemented Soil Layers Overlaying
Weaker Soil, J. Geotech. Geoenviron. Engg.
135:1846-1856, ASCE/1847.
[5] Das, B. M., Patra, C. R. and Shin, E. C. 2005.
Ultimate Bearing Capacity of Eccentrically Loaded
Strip foundation On Sand Reinforced with Geogrids,
Geotextiles and Geomembranes, 211-218, Elsevier
Science Ltd.
[6] Demir, A., Yildiz, A.,Laman, M. and Ornek, M.
2014. Experimental and numerical analyses of
circular footing on geogrid-reinforced granular fill
underlain by soft clay ActaGeotechnica9: 711–723, ©
Springer-Verlag Berlin Heidelberg.
[7] Gill, K. S., Choudhary, A. K.,Jha, J. N. and Shukla, S.
K. 2013. Large model footing load test on reinforced
coalash slope, International Journal of Geotechnical
Engineering vol. 7, no.3, 257-265 © 2013 W. S.
Maney & Son Ltd.
[8] Hafez, K. M. and Ibrahim, I. 2014. Bearing capacity
of circular footing restingon granular soil overlying
soft clay, Elsevier B.V. on behalf of Housing and
Building National Research Center, 1687-4048.
[9] Jha, J. N., Choudhary, A. K. and Gill, K. S. 2009.
Laboratory investigation of bearing capacity
behaviour of strip footing on reinforced flyash slope,
Geotextiles and Geomembranes, Vol. 28, Issue 4,
Pages 393–402, Elsevier Ltd.
[10] Kolay,P. K., Kumar, S. and Tiwari,D. 2013.
Improvement of Bearing Capacity of Shallow
foundation on geogrid reinforced silty clay and Sand,
Journal of Construction Engineering, Volume 2013,
Article ID 293809, © Hindawi Publishing
Corporation.
[11] Mostafa, A. and Sawwaf, E. L. 2007. Behavior of
strip footing on geogrid-reinforced sand over a soft
clay slope, Geotextiles and Geomembranes, Volume
25, Issue 1, Pages: 50–60, Elsevier Ltd.
[12] Patra, C. R., Das, B. M. and Atalar, C. 2005. Bearing
capacity of embedded strip foundation on geogrid-
reinforced sand, Geotextiles and Geomembranes,
Vol. 23, Issue 5, 454–462, Elsevier Science Ltd.
[13] Shirvani, R.A. and Shooshpasha, I. 2015.
Experimental Study on Load-Settlement Behaviour of
Cement Stabilised Footing with Different Dimensions
on Sandy Soil, Arab J SciEng 40:397–406, ©The
Author(s), Springer.
[14] Thome, A.,Donato, M., Consoli, N. C. and Graham, J.
2005. Circular footings on a cemented layer above
weak foundation soil, Canadian Geotechnical Journal
42: 1569–1584, NRC Canada.
[15] Tripathi, R. K. and Yadu, L. K. 2014. Effect on
Bearing Capacity Ratio of Strip Footing for Various
Granular Fill Thickness and Number of Geogrid
Layers in Granular Fill Overlay on Soft Soil, Geo-
Congress Technical Papers, GSP 234 © ASCE.
[16] Tripathi, R. K. and Yadu, L. K. 2014. Effect of Depth
and Number of Layers of Reinforcement on Bearing
Capacity Ratio of Strip Footing Resting on
Granulated Blast Furnace Slag Reinforced with
Geogrid, Geo-Congress Technical Papers, GSP 234
© ASCE..
[17] Udayashankar, D. 2010. Geotechnical Characteristics
of Hubli - Dharwad Black Cotton Soils Mixed With
Fly Ash: An Experimental Evaluation, Indian
Geotechnical Conference, GEO trendz, IGS Mumbai
Chapter & IIT Bombay.
[18] Umesha, T. S., Dinesh, S. V. and Sivapullaiah, P. V.
2009. Control of dispersivity of soil using lime and
cement, International Journal of Geology, Issue 1,
Vol. 3.
[19] Yadu, L. K. and Tripathi, R. K. 2014. Effect of the
length of geogrid layers in the bearing capacity ratio
of geogrid reinforced granular fill-soft subgrade soil
system, Procedia - Social and Behavioral
Sciences 12/2013; 104:225-234, Published by
Elsevier.
[20] Yadu, L. K. and Tripathi, R. K. 2013. Stabilization of
soft soil with granulated blast furnace slag and fly
ash, International Journal of Research in Engineering
and Technology ISSN: 2319-1163, Volume: 02 Issue:
02.