Embed Size (px)
Citation preview
Airports | October 2016 | 1
Infrastructure InvestmentsINVESTING IN AIRPORTS
Whether you’re parking your car, walking through the duty free or boarding a plane for your vacation, the airport experience is familiar to many of us. Airports are now very much an essential component of infrastructure to most modern economies. Today, airports around the world collectively cater for more than three billion passengers annually, with growth driven by the expansion of the middle class combined with the declining cost of air travel. For most investors, the listed market is the only way to gain access to the airport infrastructure that has underpinned this growth.
THE DEVELOPMENT OF COMMERCIAL AIRLINE TRAVELThe deregulation of the global aviation industry1 saw a step change in the level of growth of air travel as increased competition, including the arrival of low cost carriers into the marketplace, together with the larger and more fuel efficient planes, saw prices fall and air travel become more accessible. The International Air Transport Association (IATA) forecasts carriage of 3.6 billion airline passengers globally in 2016, compared to the 2.8 billion passengers carried by airlines in 2011.
While air transport has grown by 62% over the past 10 years2, we expect strong growth to continue, driven by increasing household wealth (particularly in Asia) together with decreasing real airfares being driven by continuing developments in aircraft technology. All of this growth has, and will continue to be underpinned by the essential airport infrastructure that facilitates air travel. 1 US - 1978; UK - 1991; Europe - 1992; Australia - 20022 Airbus, 2015
EXAMPLES OF LISTED AIRPORT ASSETS
Listed Airport Services Company
Example of assets held
Groupe ADP Paris Charles de Gaulle and Orly Airport
Aena SA Madrid–Barajas Airport, Adolfo Suárez and other Spanish airports
Sydney Airport Sydney Airport
Auckland International Airport Limited
Auckland Airport
Fraport AG Frankfurt Airport and other airports
Grupo Aeroportuario del Sureste
Cancun Airport and various other airports in Mexico
TAV Havalimanlari Holding AS
Istanbul Atatürk Airport and various airport holdings
Airports | October 2016 | 2
WHAT ARE THE KEY REVENUE DRIVERS OF AIRPORTS?Airports earn revenue primarily from two categories:
1. AERONAUTICAL REVENUESRevenue is usually earned as a per-passenger charge and/or a charge based on the size of the aircraft, and such aeronautical revenues are normally subject to economic regulation. Revenues grow as airports invest in terminal and airfield facilities (new gates, expanded terminals, runway widenings or improvements, aircraft parking spaces and related facilities) to meet increasing passenger demands.
2. COMMERCIAL REVENUES> Retail leases – Airports earn rent from retail space within the terminal buildings for
stores ranging from duty-free to restaurants and general merchandise (clothes, watches, souvenirs, books, etc.). The leases are typically structured with minimum guaranteed rents and upside from sales above certain thresholds.
> Car parking and ground transport, including bus and taxi access charges.> Property - Airports own vast tracts of land that are sought after by a range of airport
users including car rental agencies, airline offices and associated service providers like freight, catering, ground handling, fueling, maintenance and hotels.
Many of these revenue streams have grown consistently over time. Leases may also feature inflation-linked adjustments or established pricing mechanisms that are built into contractual arrangements. In some cases, such as car parking and property rental, the airport has greater pricing discretion in order to optimise the balance between revenue and utilisation.
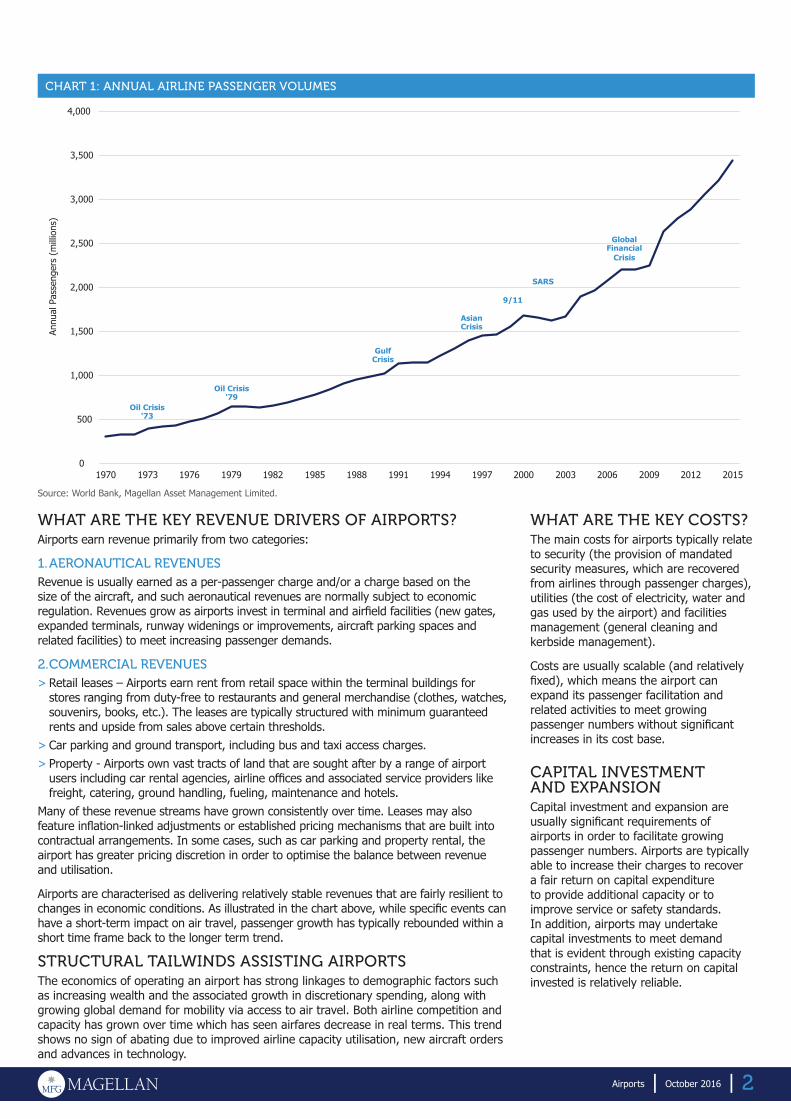
Airports are characterised as delivering relatively stable revenues that are fairly resilient to changes in economic conditions. As illustrated in the chart above, while specific events can have a short-term impact on air travel, passenger growth has typically rebounded within a short time frame back to the longer term trend.
STRUCTURAL TAILWINDS ASSISTING AIRPORTSThe economics of operating an airport has strong linkages to demographic factors such as increasing wealth and the associated growth in discretionary spending, along with growing global demand for mobility via access to air travel. Both airline competition and capacity has grown over time which has seen airfares decrease in real terms. This trend shows no sign of abating due to improved airline capacity utilisation, new aircraft orders and advances in technology.
WHAT ARE THE KEY COSTS?The main costs for airports typically relate to security (the provision of mandated security measures, which are recovered from airlines through passenger charges), utilities (the cost of electricity, water and gas used by the airport) and facilities management (general cleaning and kerbside management).
Costs are usually scalable (and relatively fixed), which means the airport can expand its passenger facilitation and related activities to meet growing passenger numbers without significant increases in its cost base.
CAPITAL INVESTMENT AND EXPANSIONCapital investment and expansion are usually significant requirements of airports in order to facilitate growing passenger numbers. Airports are typically able to increase their charges to recover a fair return on capital expenditure to provide additional capacity or to improve service or safety standards. In addition, airports may undertake capital investments to meet demand that is evident through existing capacity constraints, hence the return on capital invested is relatively reliable.
0
500
1,000
1,500
2,000
2,500
3,000
3,500
4,000
Annu
al P
asse
nger
s (m
illio
ns)
Oil Crisis '73
Oil Crisis '79
Gulf Crisis
Asian Crisis
9/11
SARS
Global Financial
Crisis
1970 1973 1976 1979 1982 1985 1988 1991 1994 1997 2000 2003 2006 2009 2012 2015
CHART 1: ANNUAL AIRLINE PASSENGER VOLUMES
Source: World Bank, Magellan Asset Management Limited.
Airports | October 2016 | 3
HOW ARE AIRPORTS REGULATED?Governments take responsibility for mandating the security standards of an airport’s operations, given the associated requirements of immigration and border security. Additionally, because airports are important economic and physical infrastructure, governments usually impose some form of economic regulation. This is usually effected in one of two ways via some form of price control.
1. SINGLE TILL REGULATION In single till regulation, both the aeronautical and commercial businesses are subject to price control or monitoring to ensure the total returns that accrue to the airport are within set regulatory parameters. Examples of single till airports include London Heathrow and a number of other UK airports.
2. DUAL TILL REGULATIONIn dual till regulation, the aeronautical activities are subject to some form of price control or price monitoring to ensure the airport is charging a fair, but not excessive, price for the passenger-related facilitation activities. This is by far the most common form of regulation.
Dual till airports are more attractive investments because the commercial segment can usually earn a higher rate of return than the regulated aeronautical segment. Examples of dual till airports that are publicly listed include Sydney, Auckland, AENA (a portfolio of principally Spanish airports), Zurich, Frankfurt, Copenhagen and Paris.
Some regulatory regimes, such as in Australia and New Zealand, have ‘light-handed’ dual till regulation, which means the regulator monitors (rather than regulates) pricing and service standards for the aeronautical business only. The pricing and related commercial arrangements are left largely to be negotiated between the airport and its airline and other customers, with little regulatory involvement or intervention. This allows the airport a higher degree of freedom to determine commercially viable arrangements.
WHAT ARE THE KEY RISKS?1. DISRUPTIVE EVENTS AND DISASTERSWhile the risk of major weather events, pandemics, airline crashes and terrorism is low relative to the volume of air travel, each of these is acknowledged as a real risk. History has demonstrated that while these disruptive events can have a short-term impact on patronage, volumes typically return to trend after a short period.
2. COMPETITION FROM ‘ORIGIN AND DESTINATION’ AIRPORTS VS ‘HUB’ AIRPORTS
Origin and destination airports typically have more stable passenger demand and don’t compete significantly with other destinations and airports. In contrast, hub airports can be materially impacted if an airline chooses to use an alternative hub airport or fails financially.
3. AIRLINE WITHDRAWALS OR BANKRUPTCIESAn airline’s collapse can have a short-term financial effect, but other airlines generally satisfy unmet demand through additional services and aircraft up-gaugings (using a larger aircraft on the existing service). An airport’s revenues are generally not sensitive to which airline provides capacity to passengers.
4. REGULATORY INTERVENTIONAirports and their airline customers are generally aligned in desiring effective commercial arrangements and working relationships, rather than relying on regulatory intervention. Higher-quality airports typically manage regulatory compliance and relationships diligently.
5. SOCIAL LICENCEWhile privately owned, airports are viewed as ‘public’ assets and ‘owned’ by their many stakeholders – customers, passengers, ‘meeters and greeters’, local communities, lobby groups, government, local councils and municipalities, etc. Honouring its social licence is vital for an airport over the long term to avoid regulatory intervention.
WHY ARE AIRPORTS CONSIDERED INFRASTRUCTURE?For an asset to meet our definition of infrastructure, it must satisfy two key criteria:
1. IT IS ESSENTIAL TO THE EFFICIENT FUNCTIONING OF A COMMUNITYAs commercial airline travel has become a common form of transportation, airports have become essential assets to communities.
2. EARNINGS ARE NOT SENSITIVE TO COMPETITION, COMMODITY PRICE MOVEMENTS OR SOVEREIGN RISK
> Airports enjoy monopoly positions as there is usually limited choice within a catchment area from where people can access air travel.
> As airport revenues are linked to the number of passengers and/or the number and size of the aircraft using the airport, large increases in oil prices tend to only affect growth at the margins, as it is the airlines who have to manage these costs (which are often passed on via fuel surcharges on tickets).
> Airports are governed by regulatory frameworks that are either stipulated or ‘light-handed’ in their control over the airport’s pricing and related economics.
> Capital management and leverage are typically well managed within sensible limits to ensure debt can be serviced comfortably, regardless of disruptive global or local events and economic conditions.
Airports | October 2016 | 4
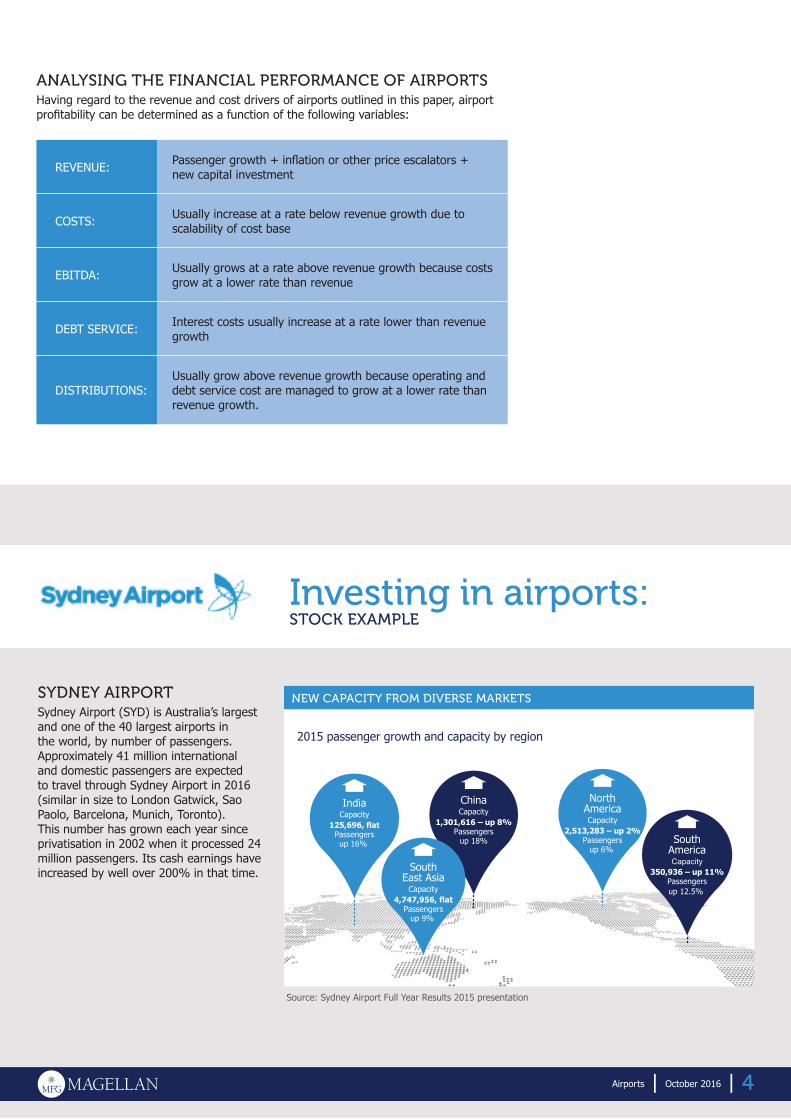
NEW CAPACITY FROM DIVERSE MARKETSSYDNEY AIRPORTSydney Airport (SYD) is Australia’s largest and one of the 40 largest airports in the world, by number of passengers. Approximately 41 million international and domestic passengers are expected to travel through Sydney Airport in 2016 (similar in size to London Gatwick, Sao Paolo, Barcelona, Munich, Toronto). This number has grown each year since privatisation in 2002 when it processed 24 million passengers. Its cash earnings have increased by well over 200% in that time.
Investing in airports:STOCK EXAMPLE
Source: Sydney Airport Full Year Results 2015 presentation
ANALYSING THE FINANCIAL PERFORMANCE OF AIRPORTSHaving regard to the revenue and cost drivers of airports outlined in this paper, airport profitability can be determined as a function of the following variables:
REVENUE: Passenger growth + inflation or other price escalators + new capital investment
COSTS: Usually increase at a rate below revenue growth due to scalability of cost base
EBITDA: Usually grows at a rate above revenue growth because costs grow at a lower rate than revenue
DEBT SERVICE: Interest costs usually increase at a rate lower than revenue growth
DISTRIBUTIONS:Usually grow above revenue growth because operating and debt service cost are managed to grow at a lower rate than revenue growth.
2015 passenger growth and capacity by region
NorthAmericaCapacity
2,513,283 – up 2%Passengers
up 6%
IndiaCapacity
125,696, flatPassengersup 16%
SouthEast Asia
Capacity4,747,956, flat
Passengersup 9%
ChinaCapacity
1,301,616 – up 8%Passengers
up 18% SouthAmericaCapacity
350,936 – up 11%Passengersup 12.5%
Airports | October 2016 | 4
Airports | October 2016 | 5
Sydney Airport is a true origin and destination airport, i.e, it is not reliant on passengers transiting to other destinations. Transit passengers are a very minor component of Sydney Airport’s total passengers, so patronage at Sydney Airport is regarded as very ‘sticky’.
Sydney Airport enjoys a mix of businesses from which it earns revenue, including international and domestic aeronautical, retailing, food and beverage, duty free, car parking, property, car rental and hotels.
The airport has three runways and three terminals. The business is scalable, with new investment limited to minor ongoing expansion and capital outlay. Throughout the airport’s history, capacity has been added incrementally via new investment to meet the significant passenger growth.
The year ended 30 June 2002, the year in which Sydney Airport was privatised, is the only year this millenium when passenger numbers fell – down 9.7% for the year – following the 9/11 attacks, the outbreak of SARS, as well as the collapse of Ansett (then Australia’s second largest airline) within three days of 9/11. Despite this, revenue, earnings and distributable cash increased in FY2002, and have continued to do so every year since, despite pandemics, weather events and the global financial crisis.
Sydney Airport has benefited from favourable local demographic factors, such as population growth, lower global real airfares, and growing demand for air travel.
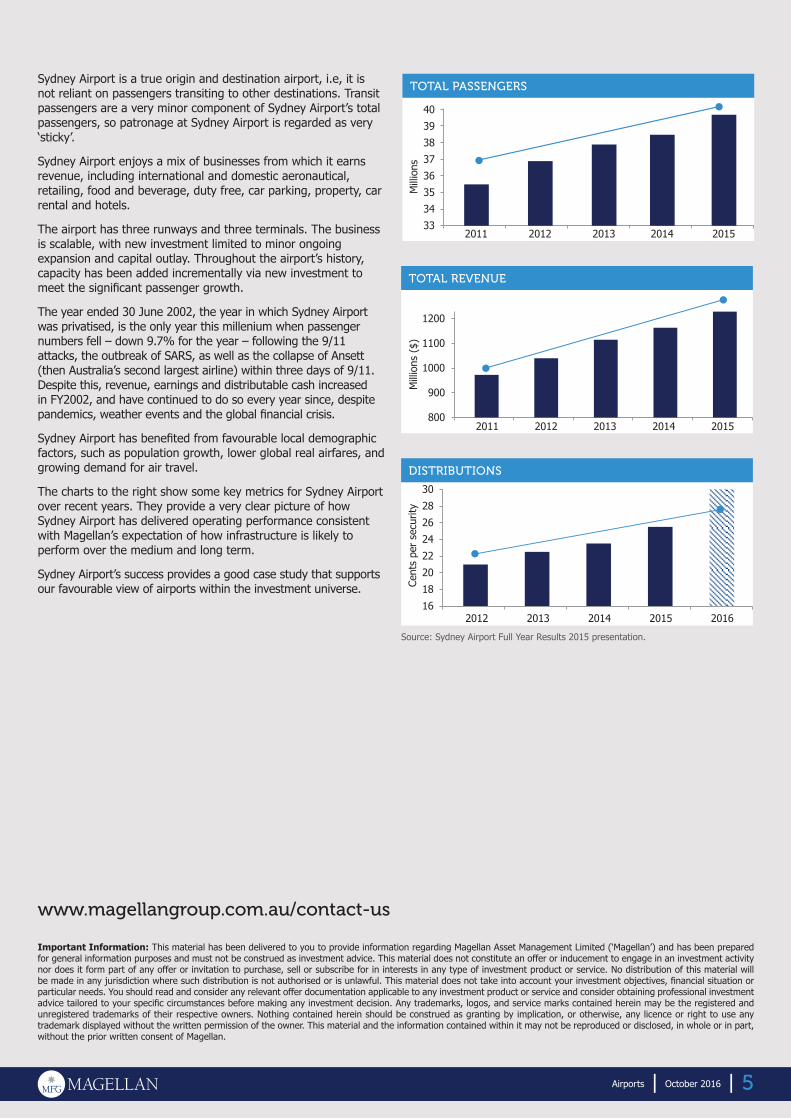
The charts to the right show some key metrics for Sydney Airport over recent years. They provide a very clear picture of how Sydney Airport has delivered operating performance consistent with Magellan’s expectation of how infrastructure is likely to perform over the medium and long term.
Sydney Airport’s success provides a good case study that supports our favourable view of airports within the investment universe.
Source: Sydney Airport Full Year Results 2015 presentation.
16
18
20
22
24
26
28
30
2012 2013 2014 2015 2016
Cent
s pe
r se
curit
y
DISTRIBUTIONS
800
900
1000
1100
1200
2011 2012 2013 2014 2015M
illio
ns (
$)
TOTAL REVENUE
Important Information: This material has been delivered to you to provide information regarding Magellan Asset Management Limited (‘Magellan’) and has been prepared for general information purposes and must not be construed as investment advice. This material does not constitute an offer or inducement to engage in an investment activity nor does it form part of any offer or invitation to purchase, sell or subscribe for in interests in any type of investment product or service. No distribution of this material will be made in any jurisdiction where such distribution is not authorised or is unlawful. This material does not take into account your investment objectives, financial situation or particular needs. You should read and consider any relevant offer documentation applicable to any investment product or service and consider obtaining professional investment advice tailored to your specific circumstances before making any investment decision. Any trademarks, logos, and service marks contained herein may be the registered and unregistered trademarks of their respective owners. Nothing contained herein should be construed as granting by implication, or otherwise, any licence or right to use any trademark displayed without the written permission of the owner. This material and the information contained within it may not be reproduced or disclosed, in whole or in part, without the prior written consent of Magellan.
33
34
35
36
37
38
39
40
Mill
ions
20152014201320122011
TOTAL PASSENGERS
Airports | October 2016 | 5
www.magellangroup.com.au/contact-us